Environmental DNA from archived leaves reveals widespread temporal turnover and biotic homogenization in forest arthropod communities
- University of Trier, Germany
- German Federal Environment Agency, Germany
- Max Planck Institute for Evolutionary Biology, Germany
- Ludwig Maximilians University, Germany
Figures
Figure 1
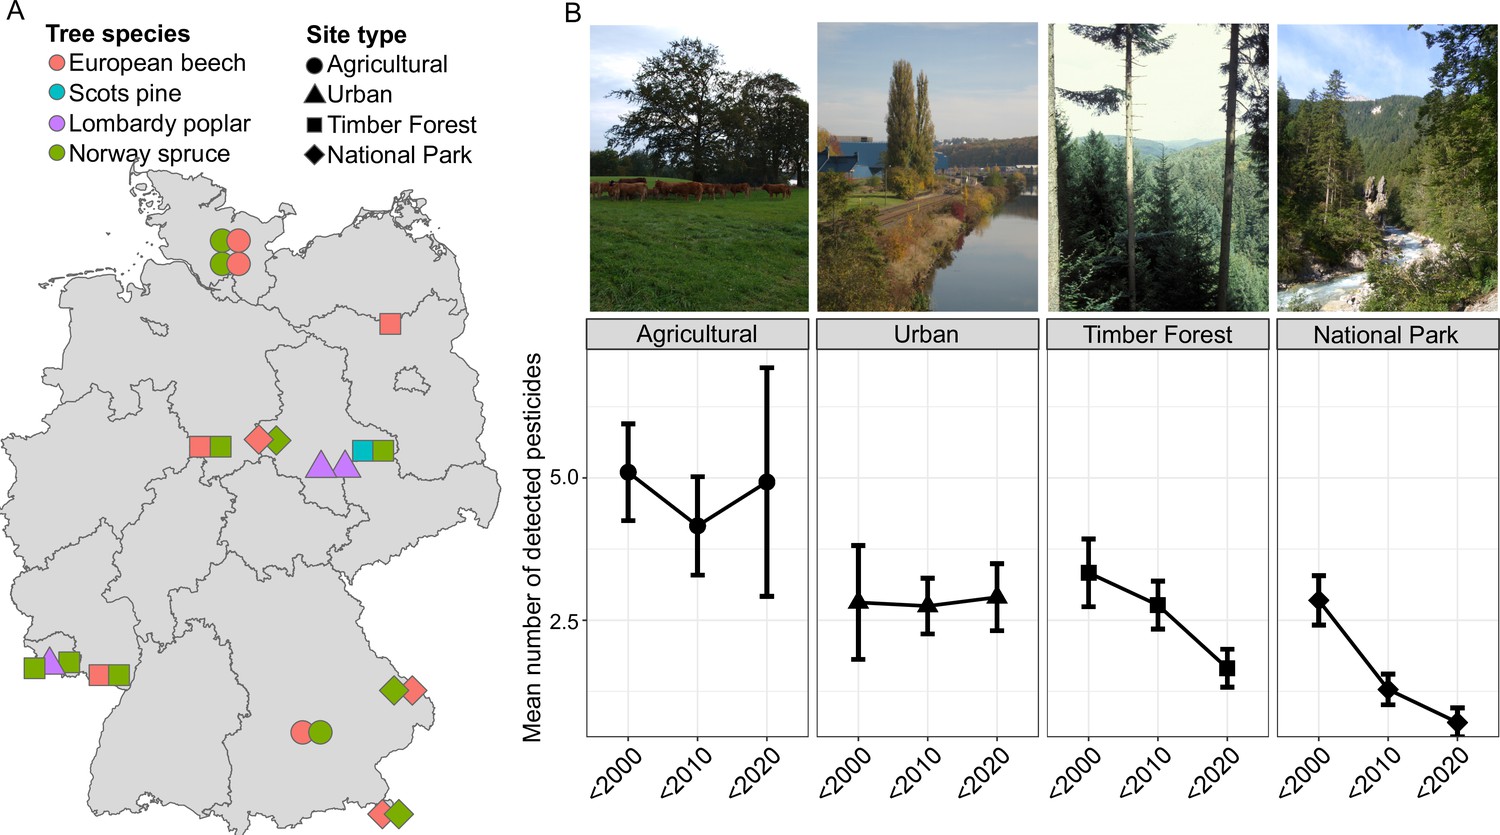
Overview of different sampling sites and samples in this study.
(A) Sampling sites, land use types, and the four tree species (European Beech Fagus sylvatica (N = 98), Lombardy Poplar Populus nigra ‘italica’ (N = 65), Norway Spruce Picea abies (N = 123), and Scots Pine Pinus sylvestris (N = 26)) sampled by the ESB in Germany. (B) Representative images of sampling sites for the four land use types and average number of detected pesticides (and 95 % confidence interval) across these land use types in three time periods (before 2000, 2000–2009, and 2010–2018). Gas chromatography–tandem mass spectrometry (GC–MS/MS) analysis (Löbbert et al., 2021) shows that the detected pesticide load distinguishes the different land use types, with agricultural sites continuously showing the highest number of pesticides.
Figure 2 with 7 supplements
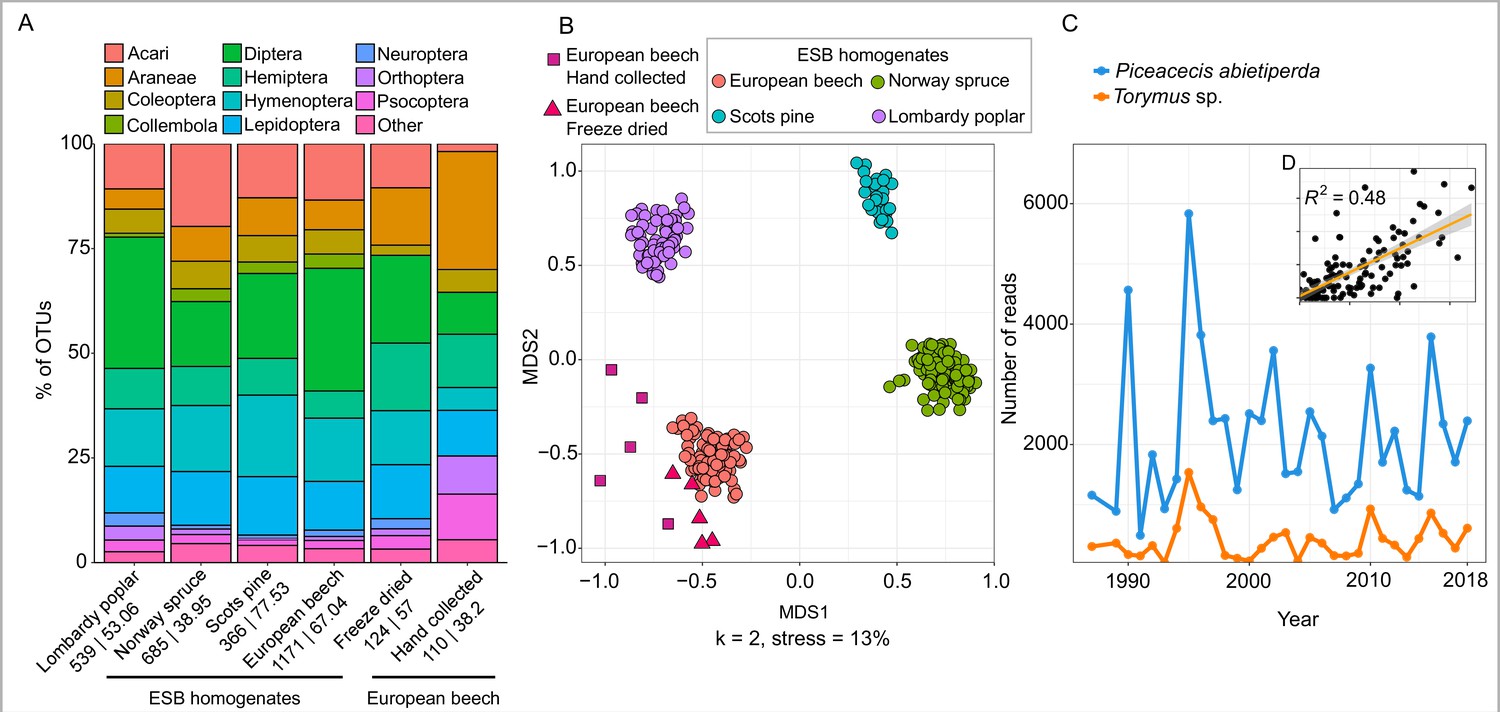
Recovery of diversity and interactions in canopy-associated arthropod communities from leaf material.
(A) Barplot showing recovered order composition of OTUs across the four tree species (N = 312). In addition to ESB samples, results from freeze-dried leaves stored at room temperature for 6–8 years (N = 5) and hand-collected bulk insect samples (N = 5) from European Beech are shown. Orders amounting to less than 1% of the total OTU number are merged as ‘Other’. Numbers below each barplot show the total number of arthropod OTUs followed by the mean OTU number per sample. (B) Non-metric multidimensional scaling (NMDS) plot showing tree-specific composition of arthropod communities for the same samples. (C) Temporal changes in abundance of the spruce gall midge Piceacecis abietiperda and its parasitoid Torymus sp. between 1987 and 2018 in a spruce forest in the Saarland. Inset (D) shows correlation of relative abundance between the two species across all ESB spruce samples.
Figure 2—figure supplement 1
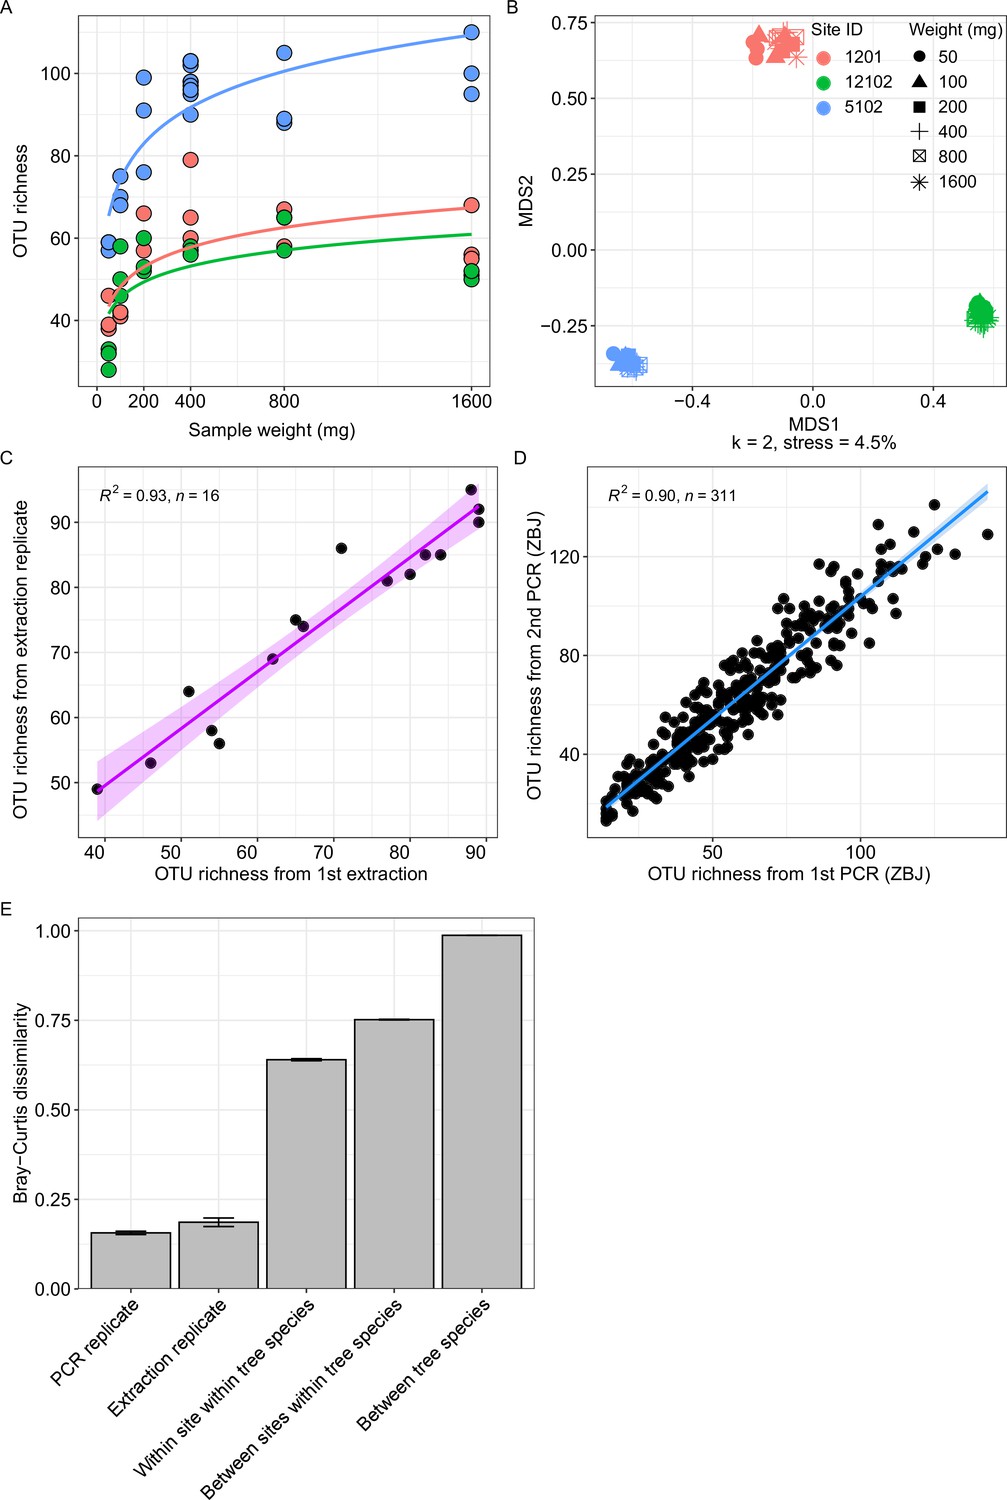
Effect of replication and sample input on recovered arthropod diversity.
(A) Saturation curves of recovered arthropod OTU richness for three sampling sites as a function of the amount of leaf homogenate used for DNA extraction. Extractions were made in triplicate for each input weight. (B) NMDS plot for the same samples. Homogenate samples cluster by sampling site, while the amount of leaf homogenate used for DNA extraction has no discernable effect on β-diversity. (C) Correlation of OTU richness obtained from extraction replicates. (D) Correlation of OTU richness obtained from PCR replicates. (E) Average β-diversity dissimilarity (and 95 % confidence interval) between PCR replicates, extraction replicates, different years within a site, different sites within a tree species and between tree species.
Figure 2—figure supplement 2

Effect of weight of plant material and precipitation events before sampling on the recovered arthropod diversity.
(A) Correlation between the amount of leaf material (wet weight of leaves, in grams) in a homogenate sample and recovered arthropod community richness. No significant effect of increasing leaf amount on diversity was recovered, suggesting that the large number of leaves collected – several thousand per ESB sample – is sufficient to saturate the recovered diversity. (B) Correlation between richness and the number of days between last precipitation event and sampling event. The number of days between rainfall and sampling did not affect the recovered diversity.
Figure 2—figure supplement 3
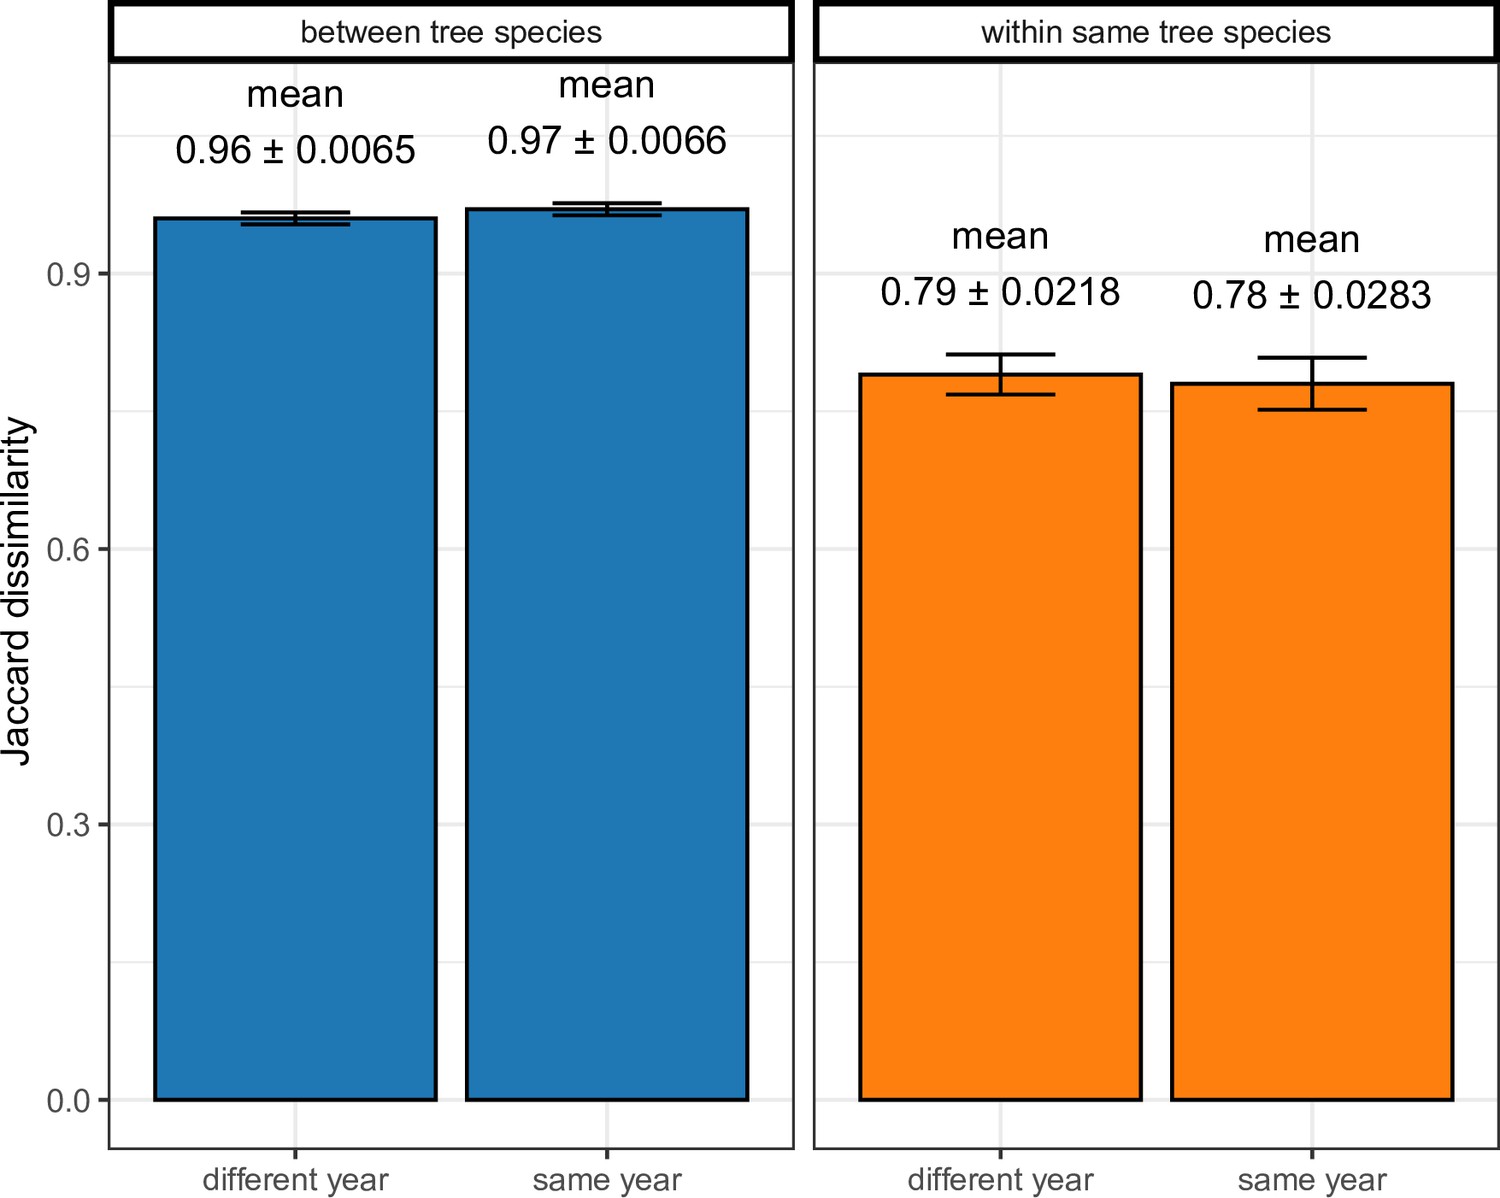
Contamination check in the cryomill.
The plots show average β-diversity (and 95 % confidence interval) between ESB tree samples processed right after each other in the cryomill (same year) and for tree samples from the same site, which were not processed consecutively in the mill. The blue plot shows β-diversity between tree species while the orange one shows β-diversity within tree species. Assuming cross-contamination by the mill, samples processed consecutively should show a significant reduction of β-diversity.
Figure 2—figure supplement 4
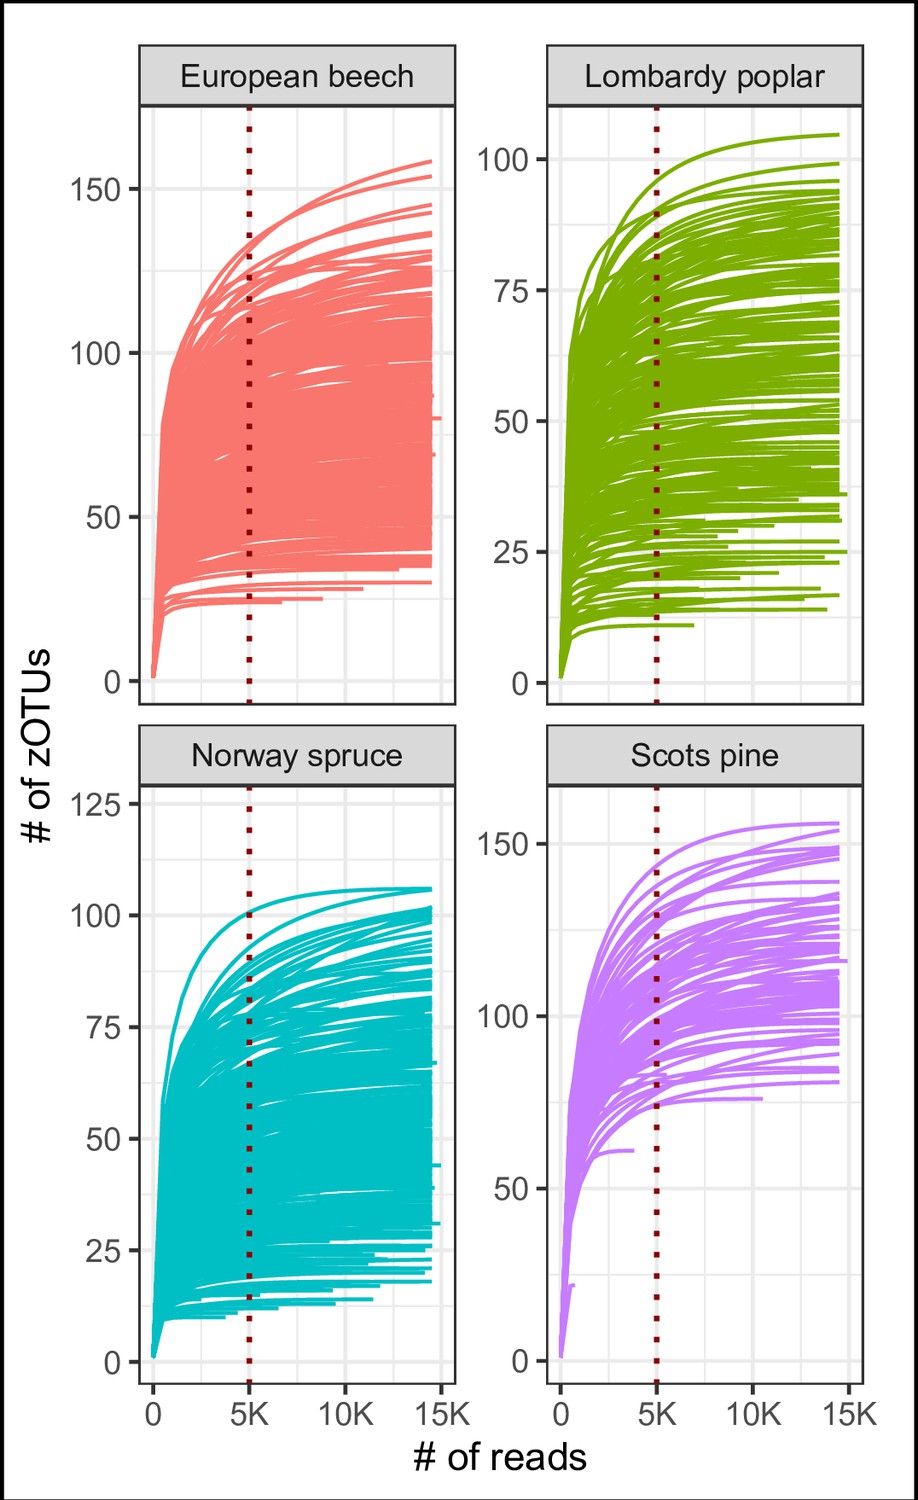
Rarefaction curves for all analyzed samples.
The dotted lines show the sampled read abundance for each of the two PCR replicates of each sample.
Figure 2—figure supplement 5
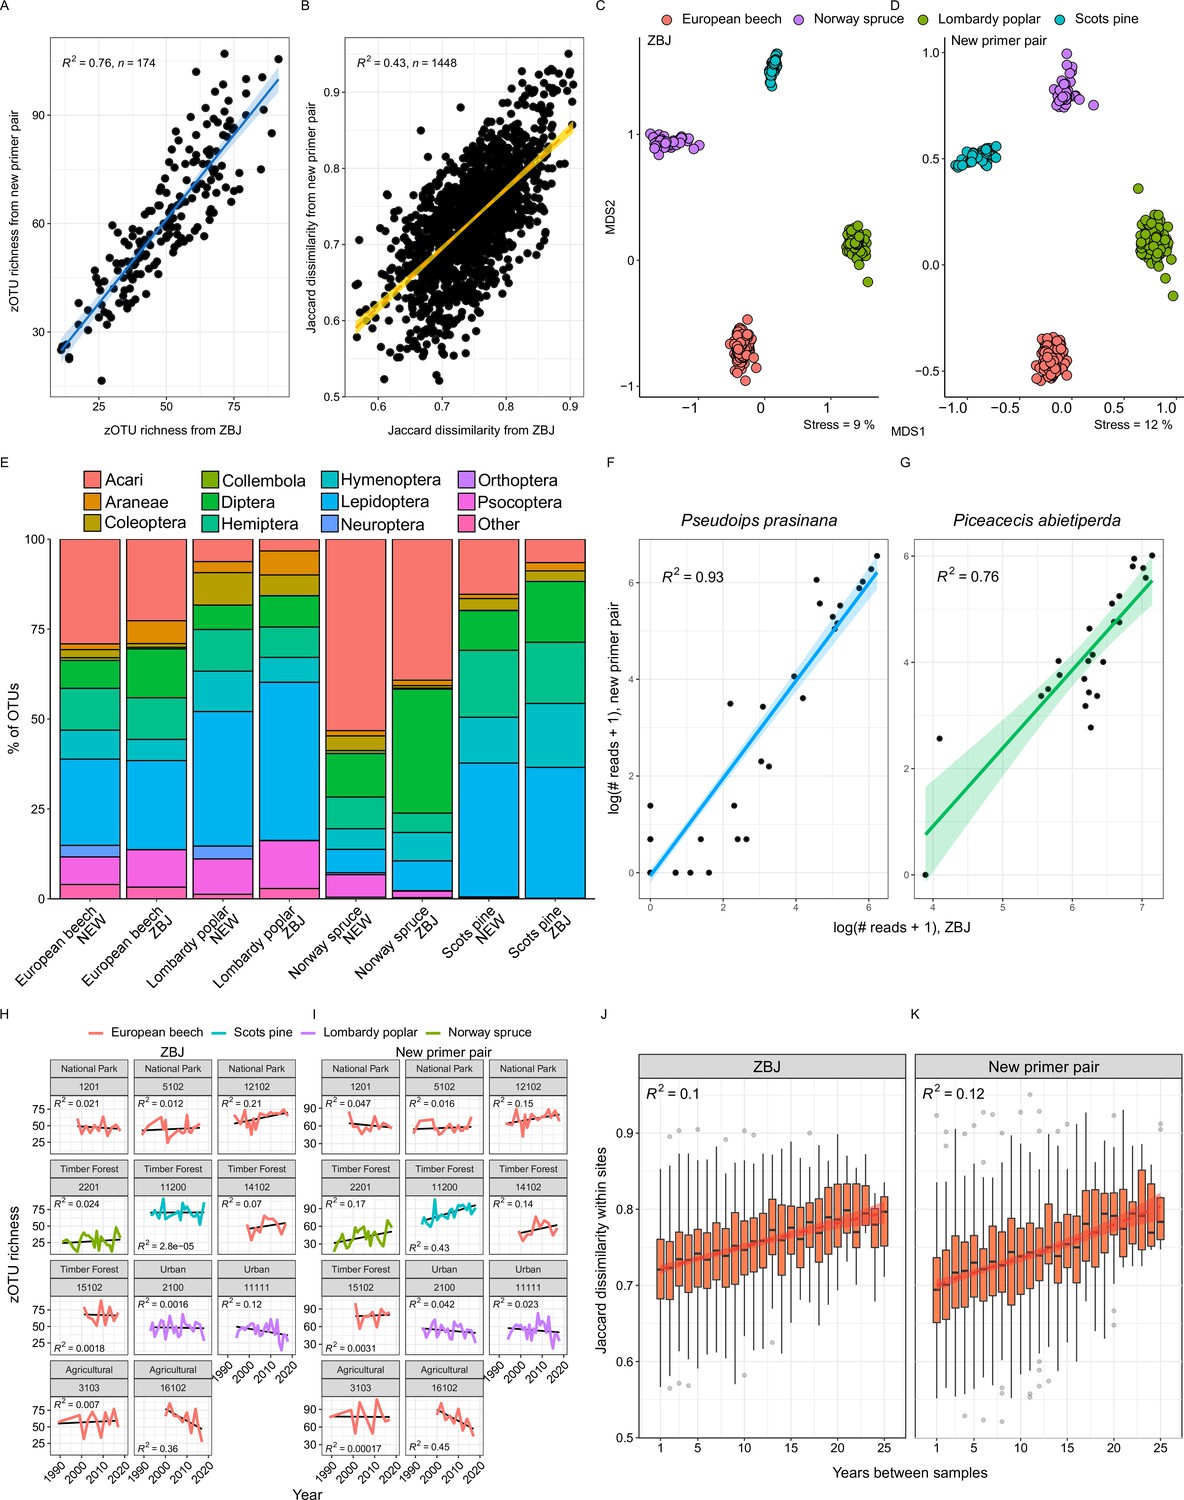
Comparison of recovered taxonomic composition and diversity patterns for the two COI markers (ZBJ-ArtF1c/ZBJ-ArtR2c vs. NoPlantF_270/mICOIintR_W) used in this study.
(A) Correlation of zOTU richness and (B) β-diversity between samples. (C, D) NMDS ordination of samples. (E) Order-level taxonomic composition by tree species. (F, G) Comparison of single species read abundances of two exemplary taxa. (H, I) zOTU richness over time for the eleventime series analyzed for both markers. (J, K) Temporal community turnover: Jaccard dissimilarity within sites compared against temporal distance between sampling events.
Figure 2—figure supplement 6
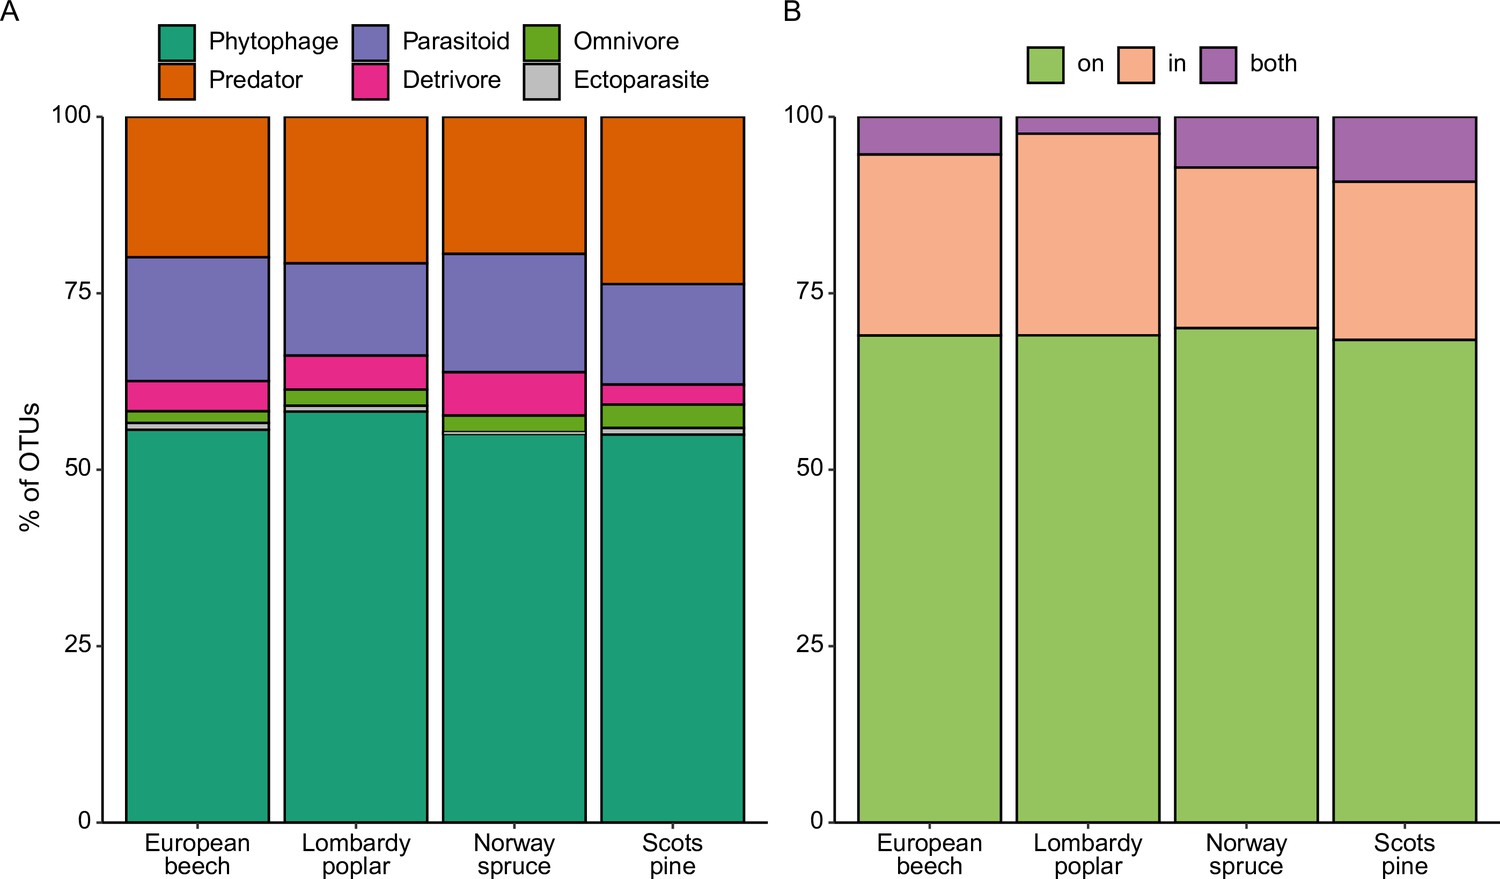
Ecological diversity of arthropod species recovered from the four tree species.
(A) Relative abundance of arthropod OTUs in different feeding guilds. (B) Relative abundance of arthropod OTUs whose DNA likely originated from outside or inside the sampled leaves.
Figure 2—figure supplement 7
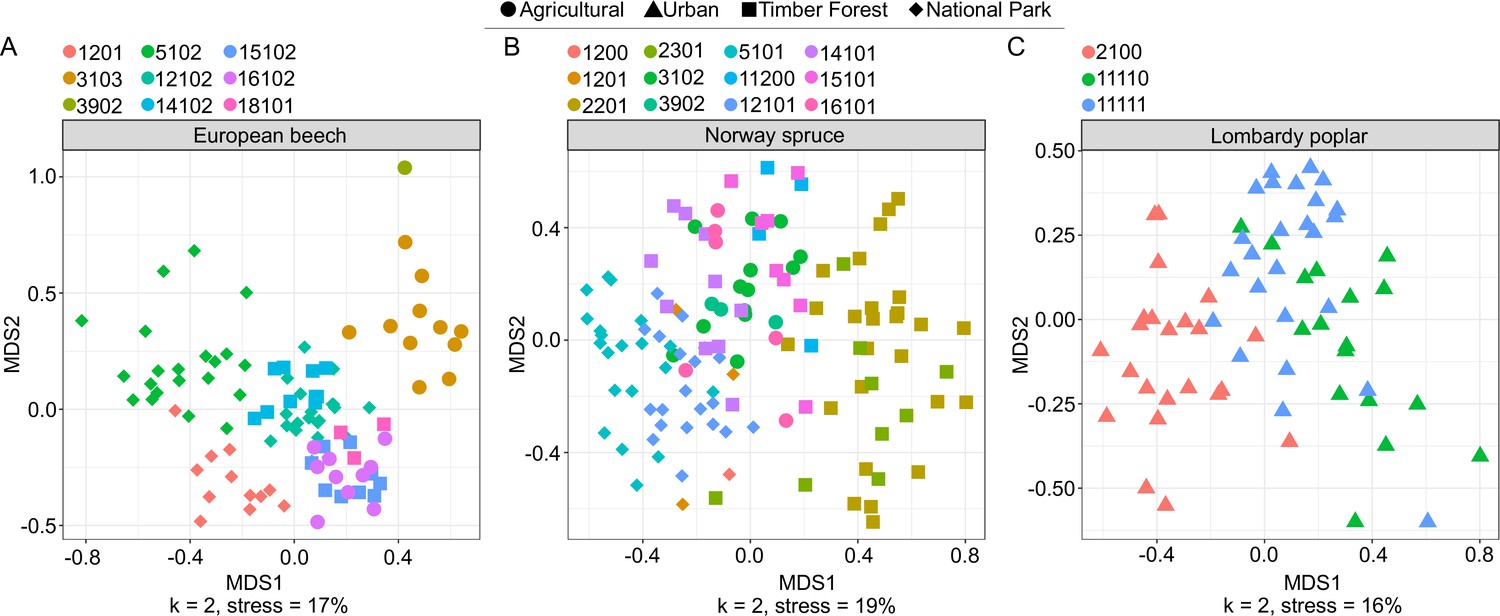
NMDS showing arthropod community differentiation by site, separated by tree species.
(A) European Beech, (B) Norway Spruce, and (C) Lombardy Poplar. Color represents site and shape represents land use type.
Figure 3 with 1 supplement
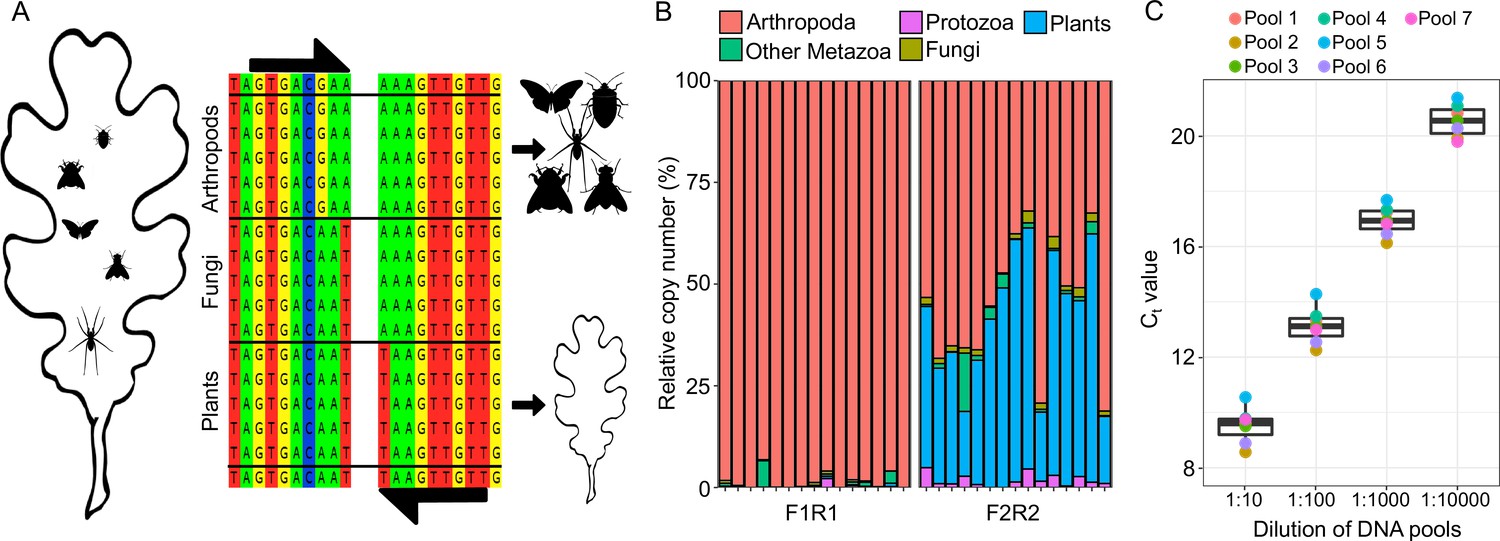
Quantitative PCR (qPCR) experiment to detect relative rDNA copy number of arthropods in plant homogenates.
(A) Schematic overview of the blocking approach to amplify homologous 18SrDNA fragments for either arthropod or plant DNA, based on lineage-specific priming mismatches. (B) Effect of primer mismatches on the recovery of arthropod sequences. Barplots show recovered read proportion of different higher taxa from 15 ESB leaf samples. The left plot shows the effect of a diagnostic mismatch in forward and reverse primers, while the right plot shows the effect of only a forward primer mismatch. (C) Boxplot showing CT values recovered from the seven mock communities of arthropod species from 13 different orders (see Figure 3—figure supplement 1 for community composition) and across a 1.10000 dilution series. Separate CT values for each community are indicated by the dots (Figure 3—figure supplement 1).
Figure 3—figure supplement 1
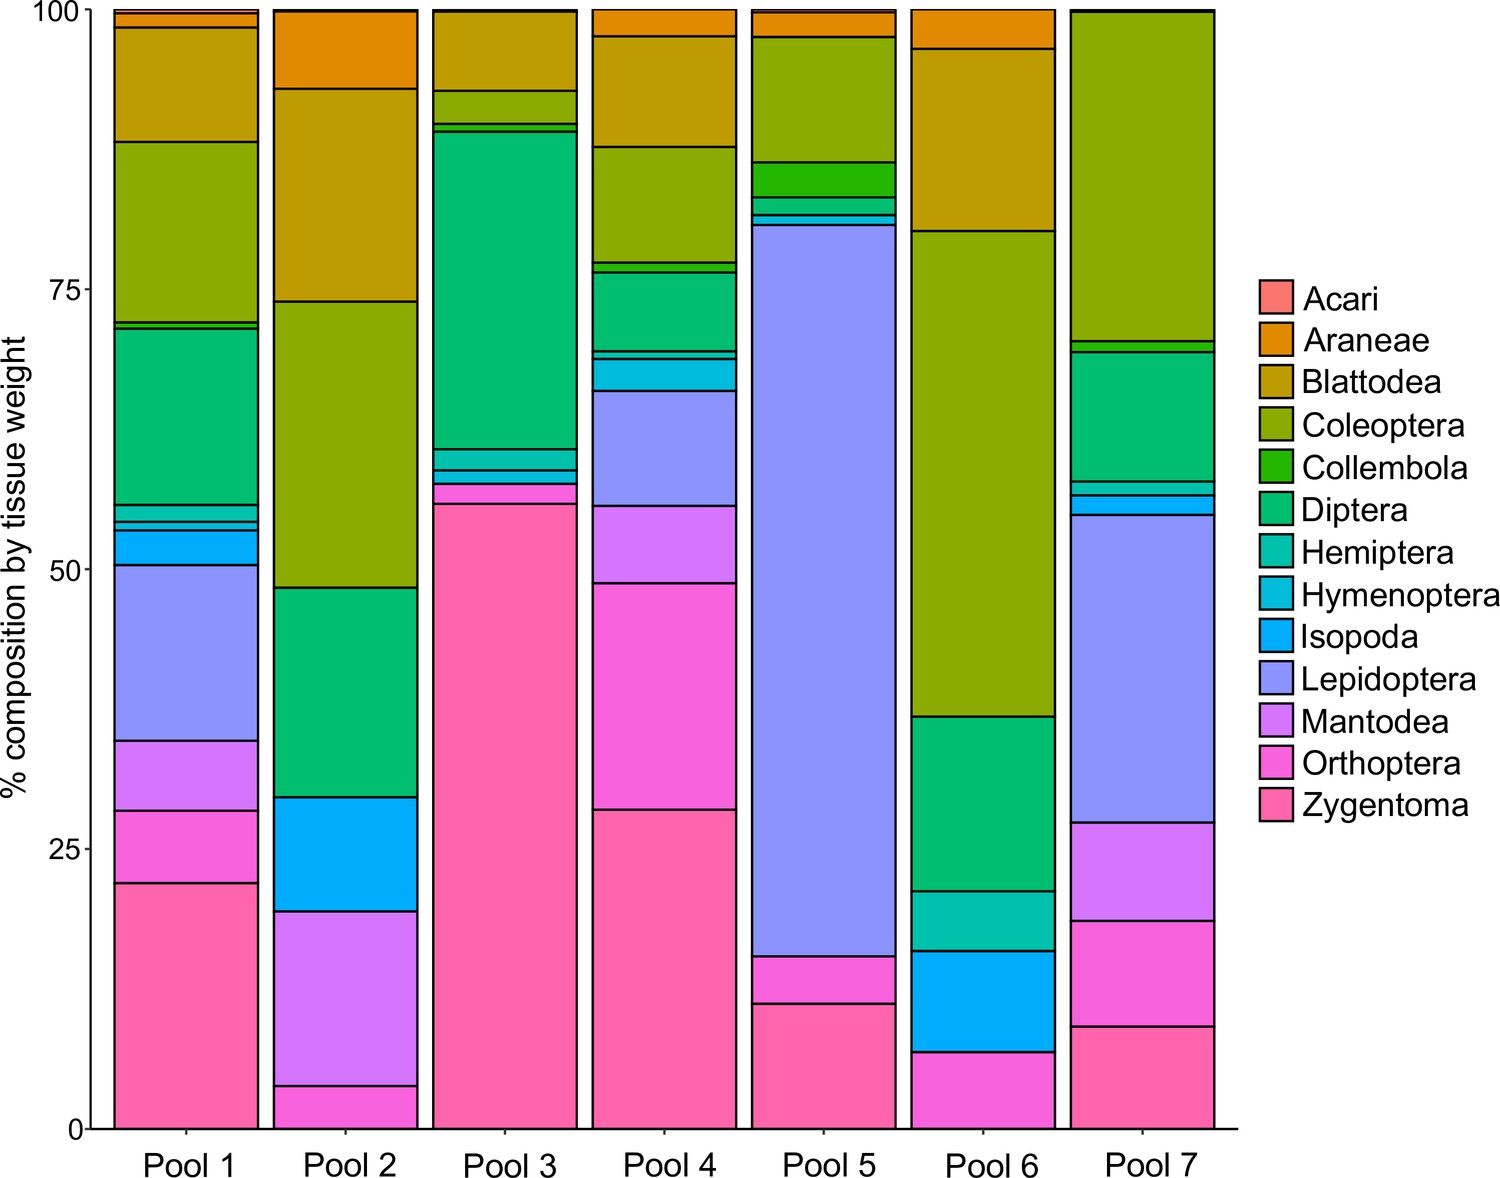
Taxonomic composition of the mock communities used to test the qPCR assay.
Order-level composition of the seven mock communities (Pools 1–7) used to test our quantitative PCR (qPCR) assay. Each community contained different DNA proportions of species from 13 different orders and three classes across the arthropod tree of life.
Figure 4 with 3 supplements
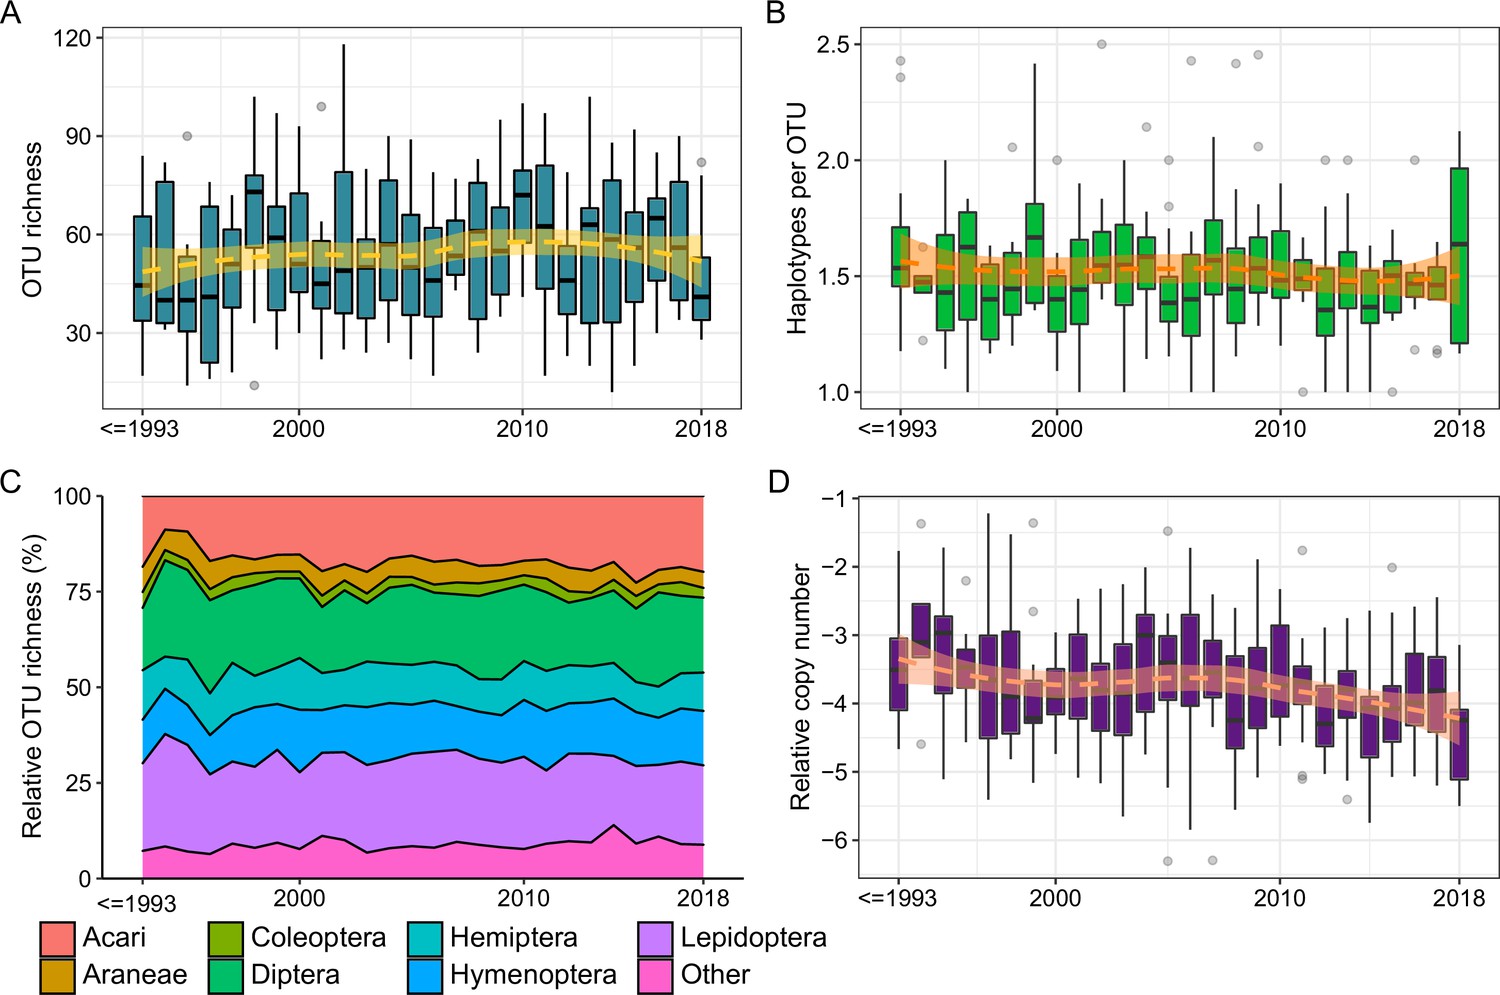
Temporal changes of diversity and copy number across all sites and samples (N = 312).
(A) Arthropod OTU richness (representing α-diversity). (B) Haplotype richness within OTUs (representing genetic variation). (C) Relative OTU richness per order. (D) Relative copy number of arthropod DNA (representing biomass).
Figure 4—figure supplement 1

Metabarcoding-based diversity indices and quantitative PCR (qPCR)-based relative copy number of arthropod rDNA per land use type over three decades.
Boxplots of (A) OTU richness, (B) copy number/biomass corrected OTU richness, (C) zOTU richness, (D) haplotype richness within OTUs, (E) relative copy number of arthropod rDNA, and (F) Jaccard dissimilarity between the given decade and the last sampling event in 2018, measured within sites. All datasets are merged by decade for clarity (before 2000, 2000–2009, and 2010–2018).
Figure 4—figure supplement 2
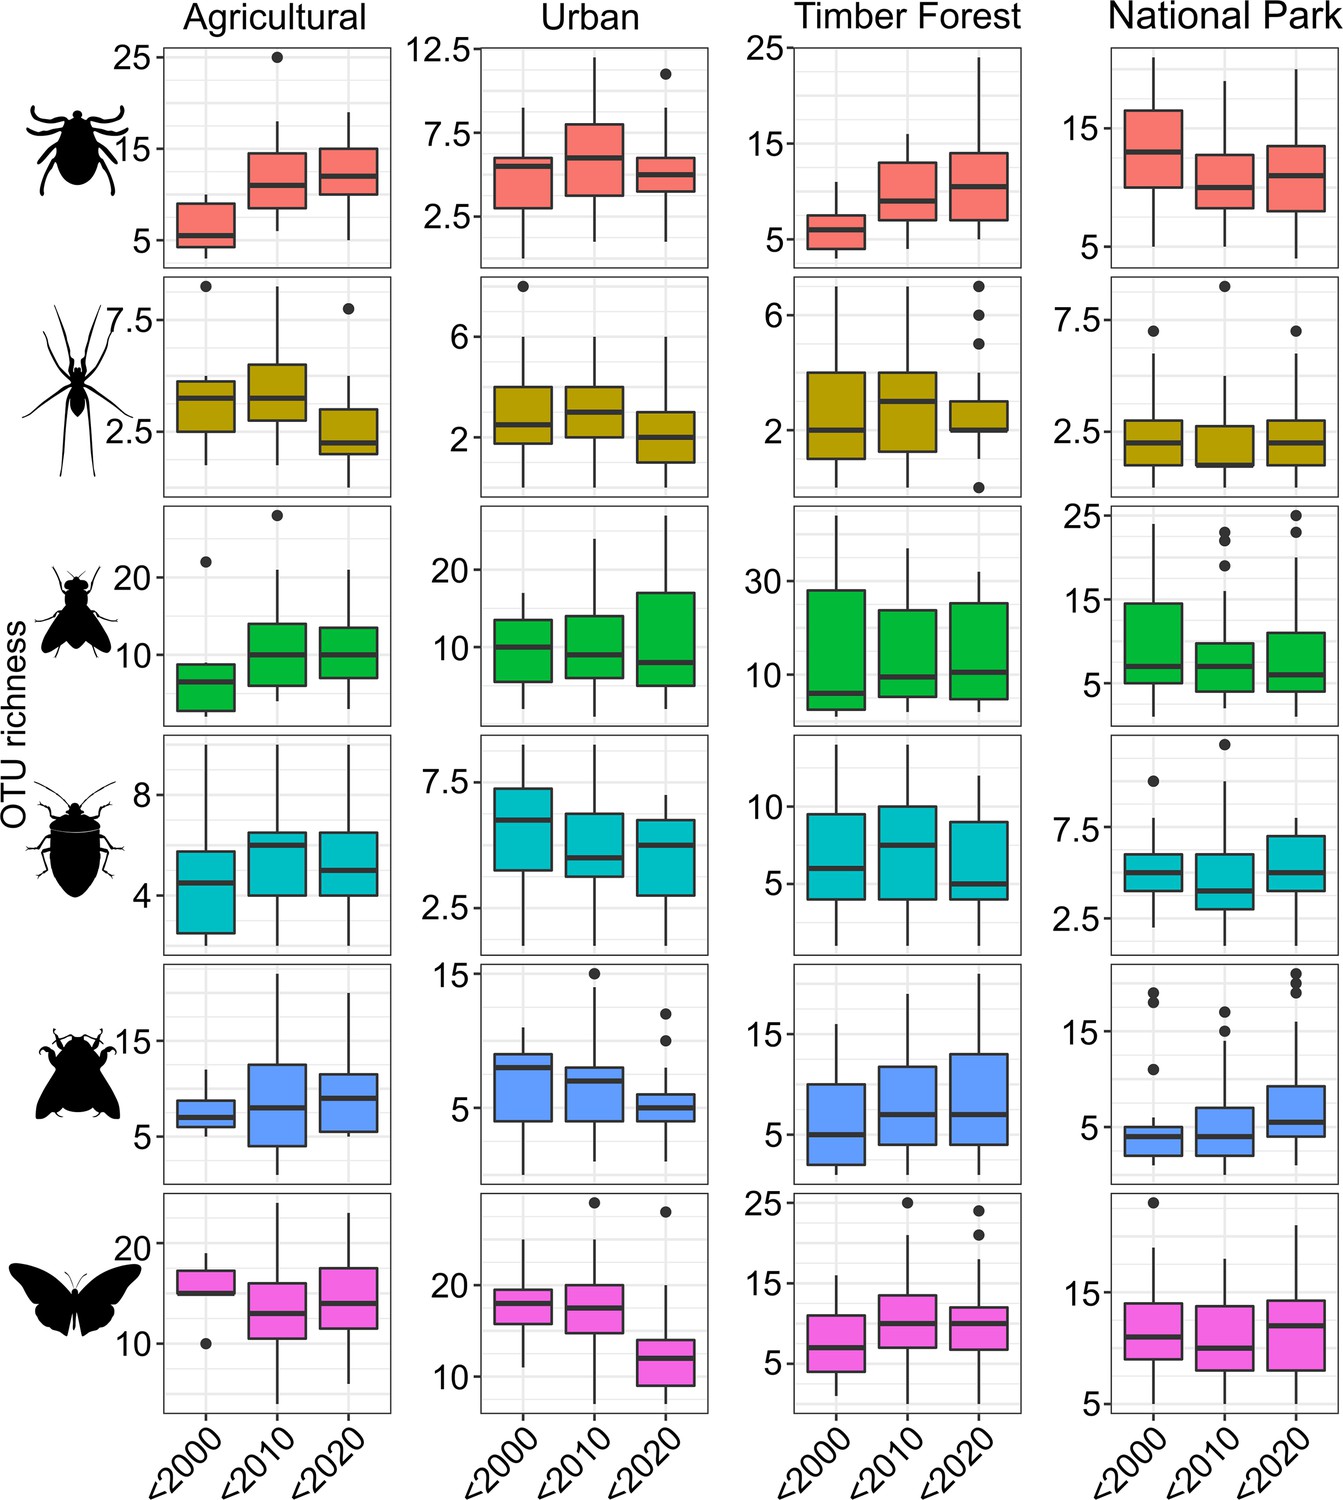
Boxplots of OTU richness by decade and land use type for the six most speciose arthropod orders in our dataset.
The data are merged by decade for clarity (before 2000, 2000–2009, and 2010–2018). Richness is shown from top to bottom for Acari, Araneae, Diptera, Hemiptera, Hymenoptera, and Lepidoptera.
Figure 4—figure supplement 3
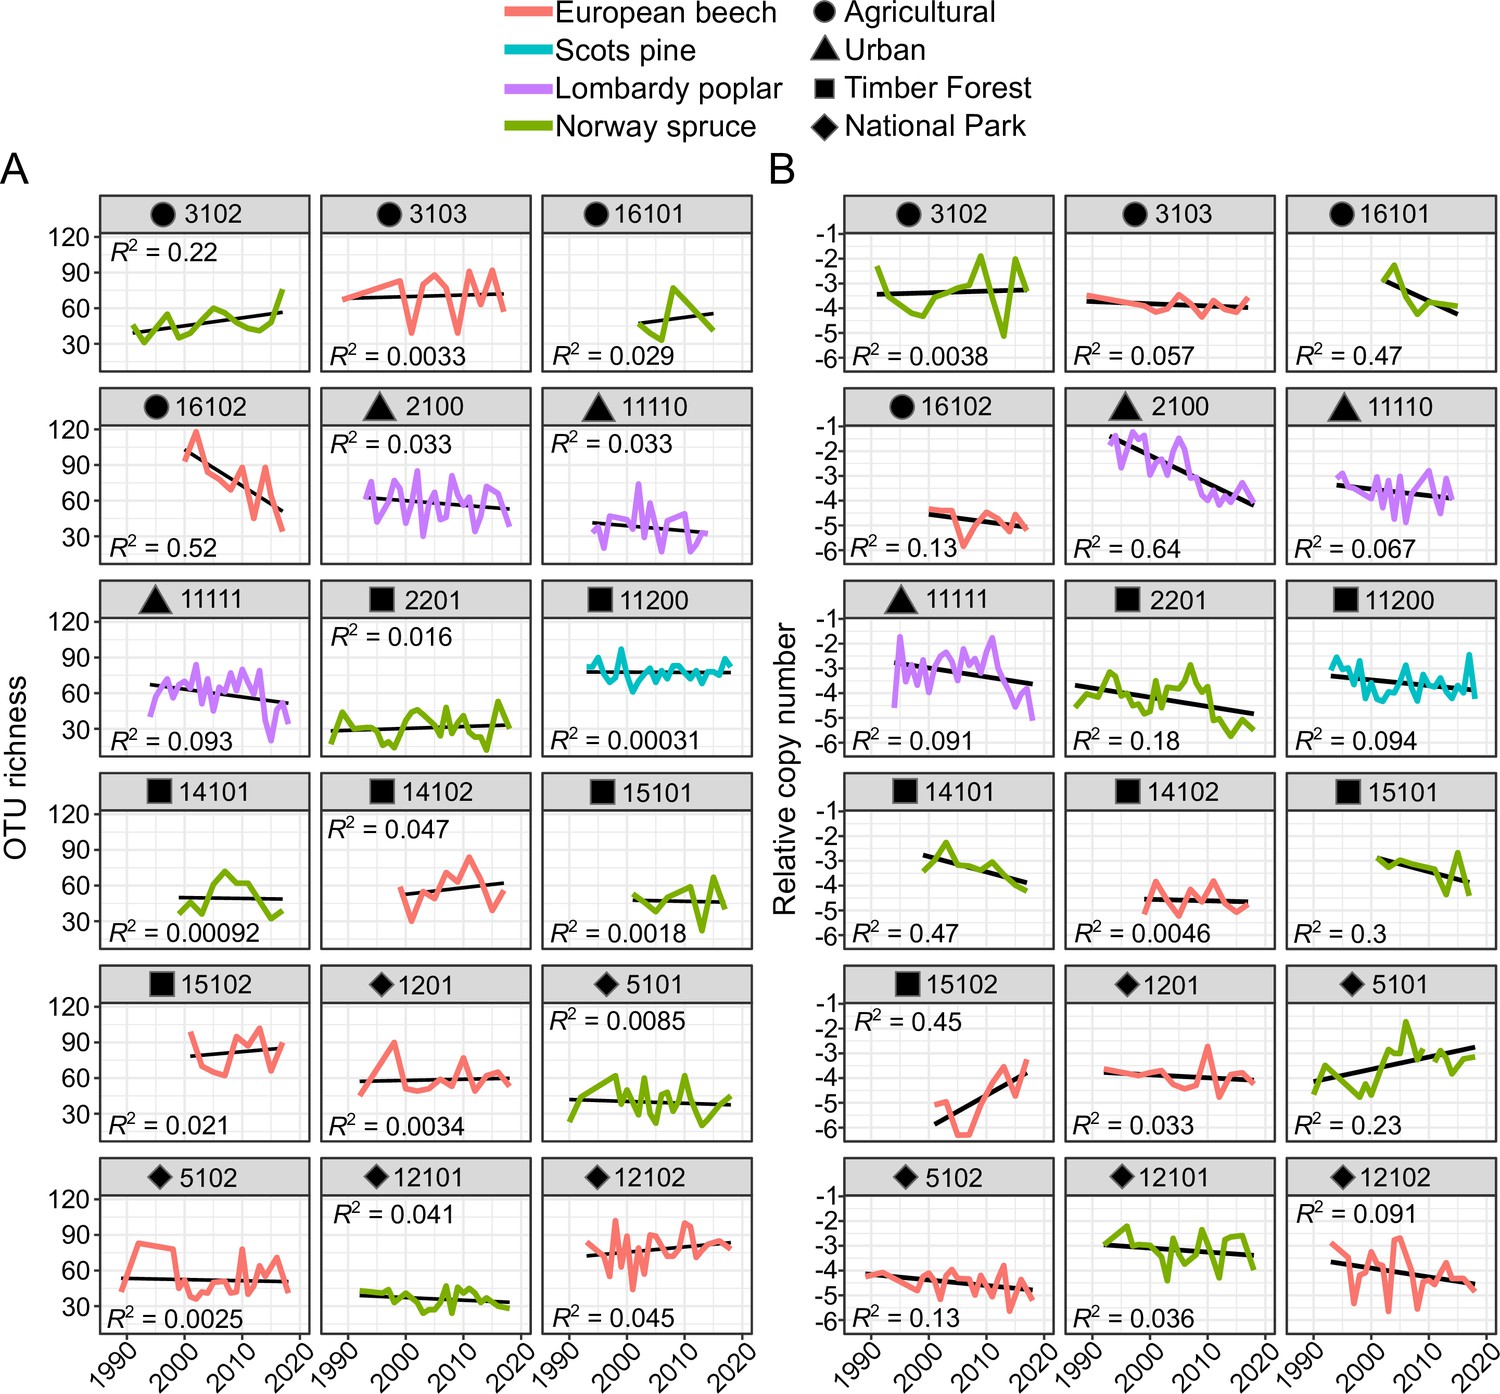
Arthropod diversity and relative copy number over time for all sites with time series longer than 10 years.
(A) OTU richness and (B) relative arthropod DNA copy number. Colors represent tree species; symbols represent land use types. Site name is indicated above each plot.
Figure 5 with 2 supplements
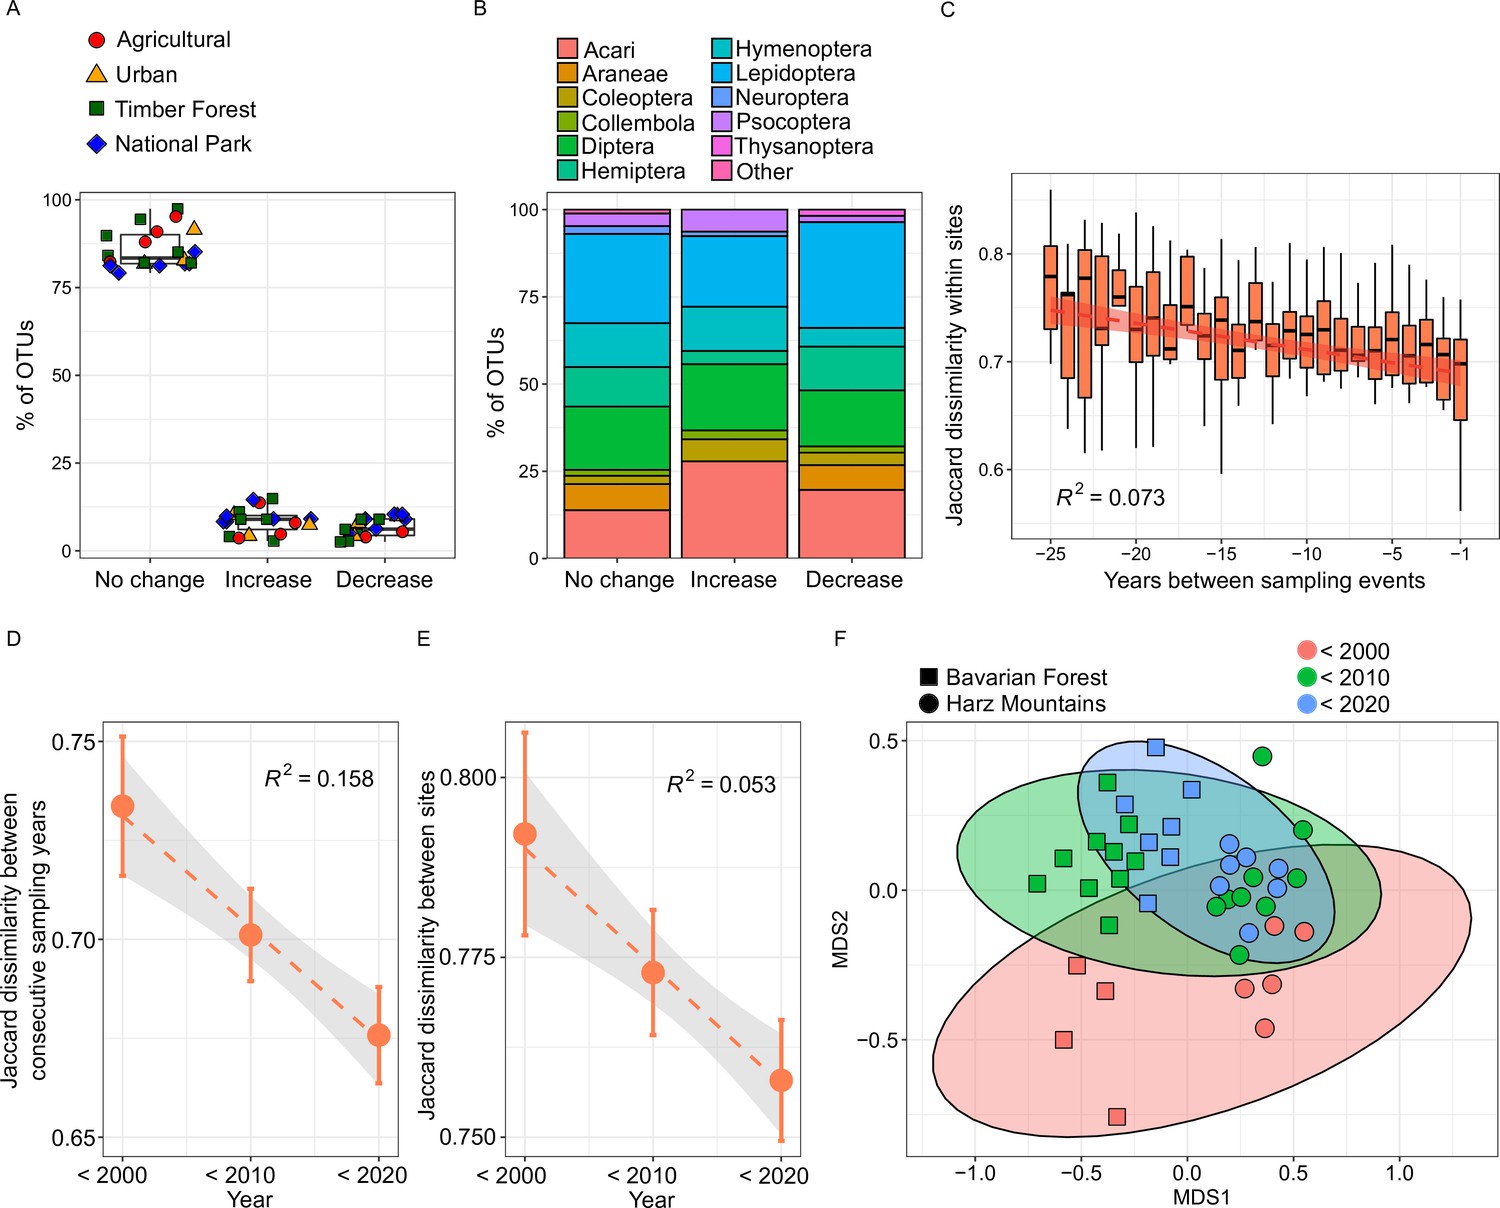
Temporal changes of species composition and β-diversity within and between sampling sites.
(A) Boxplots of the proportion of 413 separate OTUs that significantly increased, decreased, or did not show temporal abundance changes. The colored symbols overlaying the boxplots represent land use type for each site. (B) Stacked barplot showing the recovered order composition of the same three categories of OTUs. Orders amounting to less than 1% of the total OTU number are merged as ‘Other’. (C) Within-site Jaccard dissimilarity as a function of number of years between sampling events, showing a pronounced taxonomic turnover (N = 312). (D) Jaccard dissimilarity between consecutive sampling years in each decade of sampling (N = 15, 44 & 39), calculated within sites for beech forests. We find a loss of temporal β-diversity over time. Points indicate means and error bars show 95% confidence interval. (E) Jaccard dissimilarity between sites for the same samples as in D. We find a loss of average between-site β-diversity, that is spatial homogenization. (F) NMDS plot showing community dissimilarity within and between Bavarian Forest and Harz Mountains national parks over three decades (<2000: sampled before 2000; <2010: sampled between 2000 and 2009; <2020: sampled between 2010 and 2018).
Figure 5—figure supplement 1
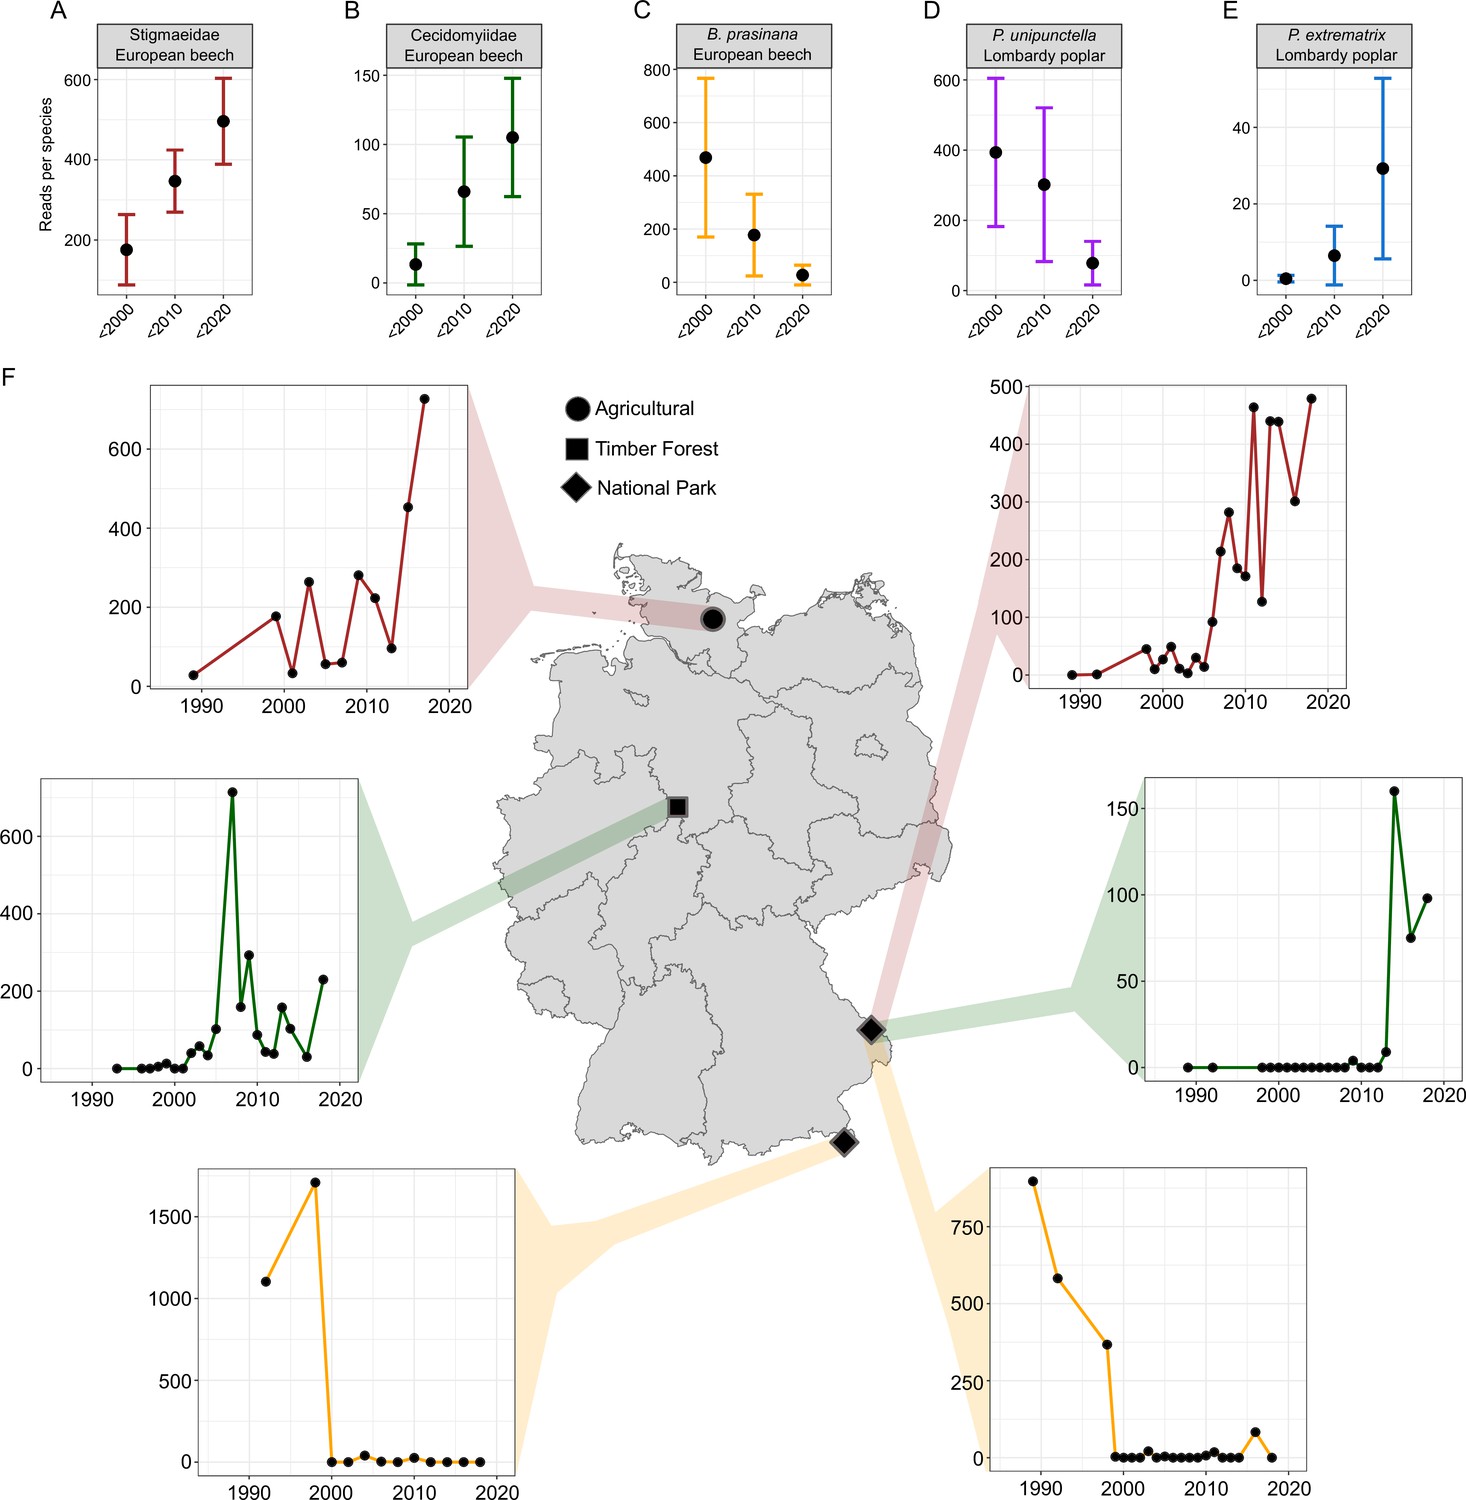
Temporal change in relative read abundance for five exemplary arthropod OTUs at all beech and poplar sites and abundance change for three OTUs at two sites each in Germany.
(A) Unidentified mite showing considerable increase over time. (B) Unidentified gall midge also showing an increase. (C) Decline in the Green Silver-Line over time. (D) Decline in Phyllocnistis unipunctella, a leaf-mining lepidopteran, at poplar sites. (E) Increase in a congeneric miner, P. extrematrix, at the same sites. The plots show mean read abundance and 95 % confidence interval. (F) Exemplary gains of the OTUs from (A) and (B) and losses of the OTU from (C) at four sites in Germany.
Figure 5—figure supplement 2
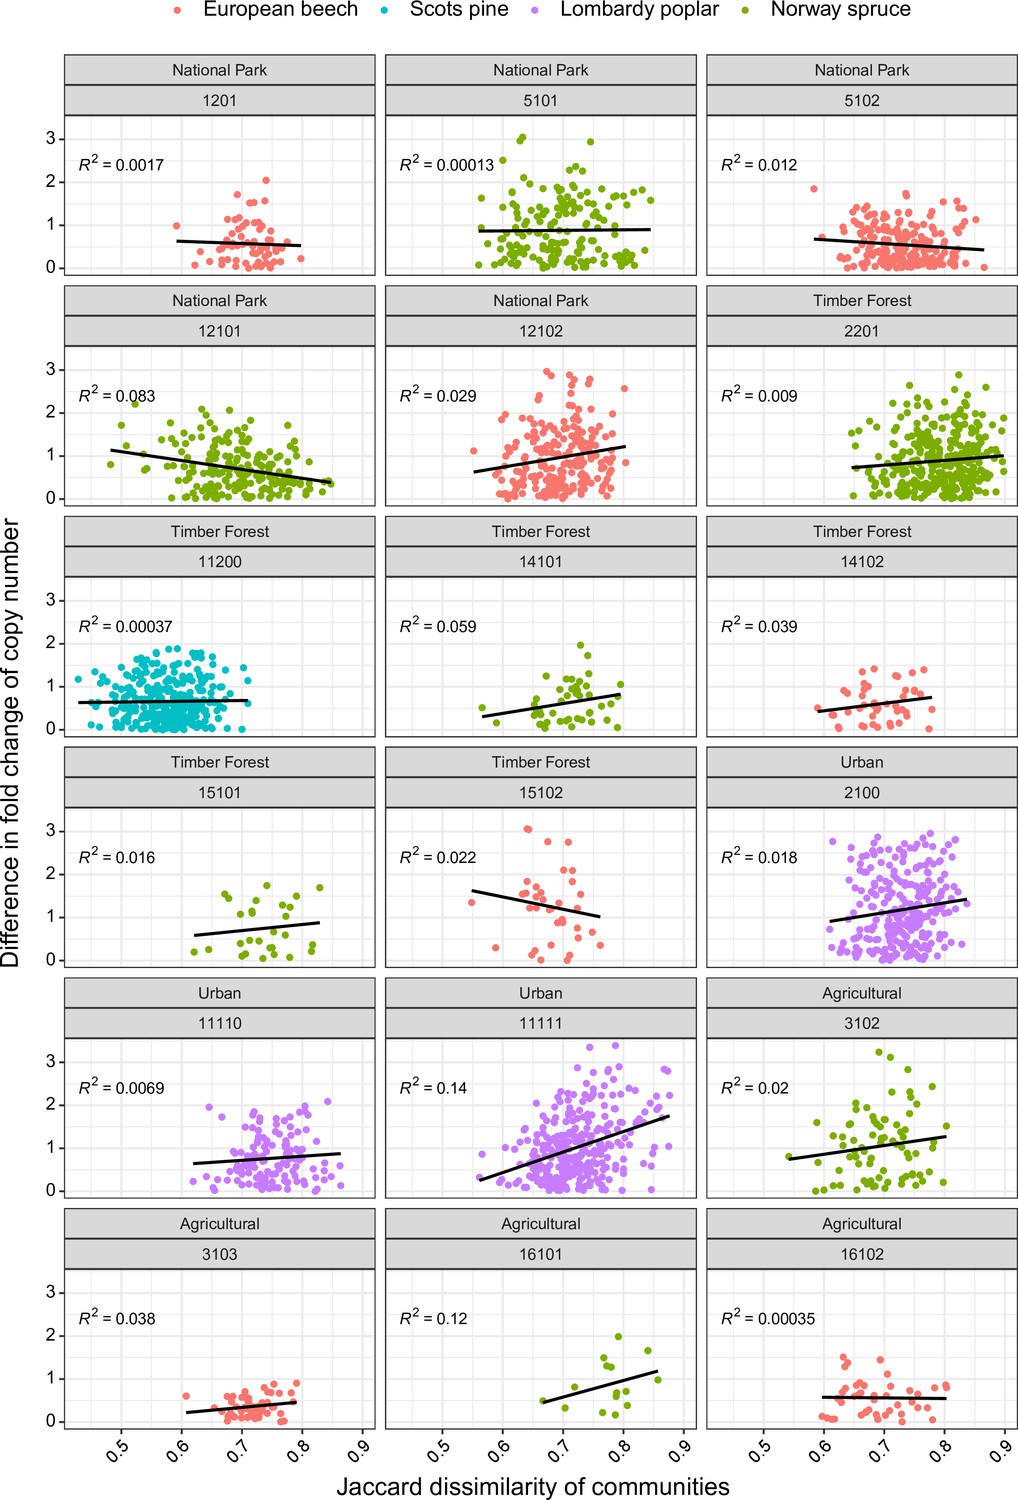
Correlation of dissimilarity in 18S rDNA copy number and β-diversity for all sites with time series longer than 10 years.
Colors represent tree species; symbols represent land use types. Site name is indicated above each plot.
Additional files
-
Supplementary file 1
Primers used in this study.
- https://cdn.elifesciences.org/articles/78521/elife-78521-supp1-v2.xlsx
-
Supplementary file 2
OTU table with metadata and quantitative PCR (qPCR) results.
- https://cdn.elifesciences.org/articles/78521/elife-78521-supp2-v2.xlsx
-
Supplementary file 3
Contamination check in the cryomill.
The table shows the taxonomic annotation for the 10 most abundant host-specific OTUs, as well as all OTUs above 1000 reads for a poplar and a pine ESB sample from 2016 (highlighted in red). The read abundance for the same OTUs in a beech and spruce sample from 2016, which were processed directly after the poplar and pine sample in the mill, are highlighted in red. The OTU abundances for beech and spruce samples from the same sites and processed in consecutive years are also shown. The total read abundance for each sample is shown below the tables (Reads).
- https://cdn.elifesciences.org/articles/78521/elife-78521-supp3-v2.xlsx
-
MDAR checklist
- https://cdn.elifesciences.org/articles/78521/elife-78521-mdarchecklist1-v2.pdf
Download links
A two-part list of links to download the article, or parts of the article, in various formats.
Downloads (link to download the article as PDF)
Open citations (links to open the citations from this article in various online reference manager services)
Cite this article (links to download the citations from this article in formats compatible with various reference manager tools)
Environmental DNA from archived leaves reveals widespread temporal turnover and biotic homogenization in forest arthropod communities
eLife 11:e78521.
https://doi.org/10.7554/eLife.78521


