Core genes can have higher recombination rates than accessory genes within global microbial populations
- Department of Biology, New York University, United States
- Department of Physics, New York University, United States
Figures
Figure 1
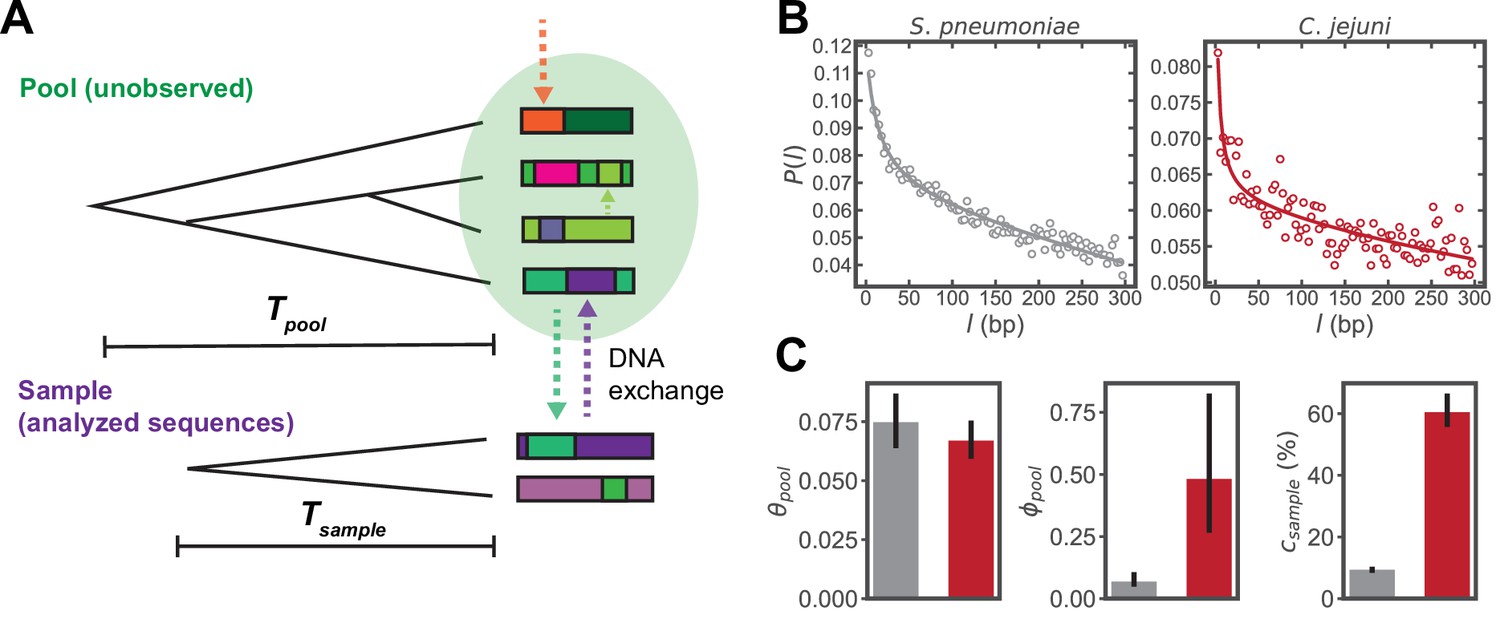
Inferring parameters of homologous recombination from whole genome sequences (WGS).
(A) Schematic depicting exchange of homologous DNA fragments between the analyzed sequences (‘Sample’) and a larger, unobserved reservoir of bacterial genomes (‘Pool’). The coalescence times of the pool and sample are denoted as and , respectively. (B) Example correlation profiles of synonymous substitutions for the core genes in samples consisting of 568 S. pneumoniae and 2215 C. jejuni WGS (further description of these datasets are given in the following sections). (C) Recombination parameters inferred from fitting the profiles shown in panel C to a population genetics model (see Materials and methods). Left to right: the pool’s mutational divergence (), the pool’s recombinational divergence (), and the sample’s recombination coverage (). Error bars are 95% bootstrap confidence intervals (see Materials and methods). Colors correspond to panel B. and have units of and is given as the percentage of genomic sites that have recombined.
Figure 2 with 4 supplements

Inference of recombination parameters for the core and accessory genome of S. pneumoniae.
(A) Dendrogram resulting from hierarchical clustering of 26,599 whole genome sequences (WGS) from the PubMLST genome collection for S. pneumoniae using the average linkage algorithm. The dendrogram was cut at the 10th percentile of all measured pairwise distances () yielding a discrete set of flat clusters. Here, we analyzed the 44 major clusters (those with >100 sequences) which resulted from this cut, encompassing 24,097 strains. In the dendrogram, alternating colors delineate adjacent clusters. (B) Correlation profiles measured across the core and accessory genes of a S. pneumoniae sequence cluster. Open-faced circle is the profile measured from sequencing data and solid line is the fit to the population genetics model. (C–E) Distributions of the pool’s mutational and recombinational divergence ( and , shown in panels C and D, respectively) and the relative recombination rate of the pool ( , shown in panel E). For C–E, the bottom plot depicts empirical cumulative distribution functions (ECDFs) for each parameter and the top plots depict the medians of the bottom plot, where error bars are 95% bootstrap CIs created by sampling the distributions with replacement (n = 1000). Each step in the ECDF corresponds to a pool recombination parameter inferred from a correlation profile measured over a sequence cluster or pair of clusters like that shown in panel B. Core genes are defined as genes found in >95% of strains. We used model selection with the Akaike information criterion to ensure that each profile was well fit (see Materials and methods for details). and have units of and is unitless. Two-sided p-values were calculated using the Wilcoxon signed-rank test and were p = 1.9e−159, 3.9e−53, and 3.5e−99 for panels C–E, respectively.
-
Figure 2—source data 1
List of SRA accession numbers corresponding to the raw reads of genomes used from NCBI.
- https://cdn.elifesciences.org/articles/78533/elife-78533-fig2-data1-v2.txt
Figure 2—figure supplement 1
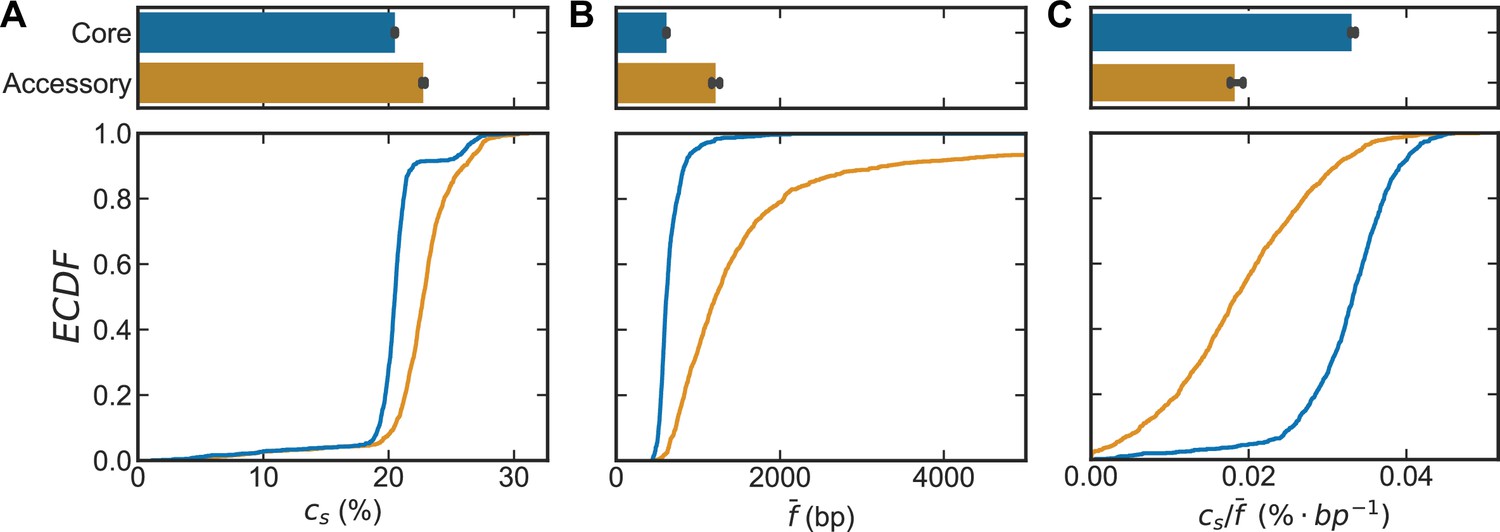
Recombination coverage and average size of a recombined fragment for S. pneumoniae.
Distributions of (A) the recombination coverage (), (B) the mean size of a fragment recombined into the genome (), and (C) the recombination coverage normalized by the mean fragment size () for all S. pneumoniae clusters and cluster pairs depicted in Figure 2. The recombination rates are inferred for the pools, while the coverage and fragments sizes are inferred for the samples (i.e., the analyzed sequence clusters). For A–C, the bottom plot depicts empirical cumulative distribution functions (ECDFs) for each parameter and the top plots depict the medians of the bottom plot, where error bars are 95% bootstrap CIs created by sampling the distributions with replacement (n = 1000). The recombination coverage is given as the percentage of genomic sites recombined, all other units are given in axis labels.
Figure 2—figure supplement 2
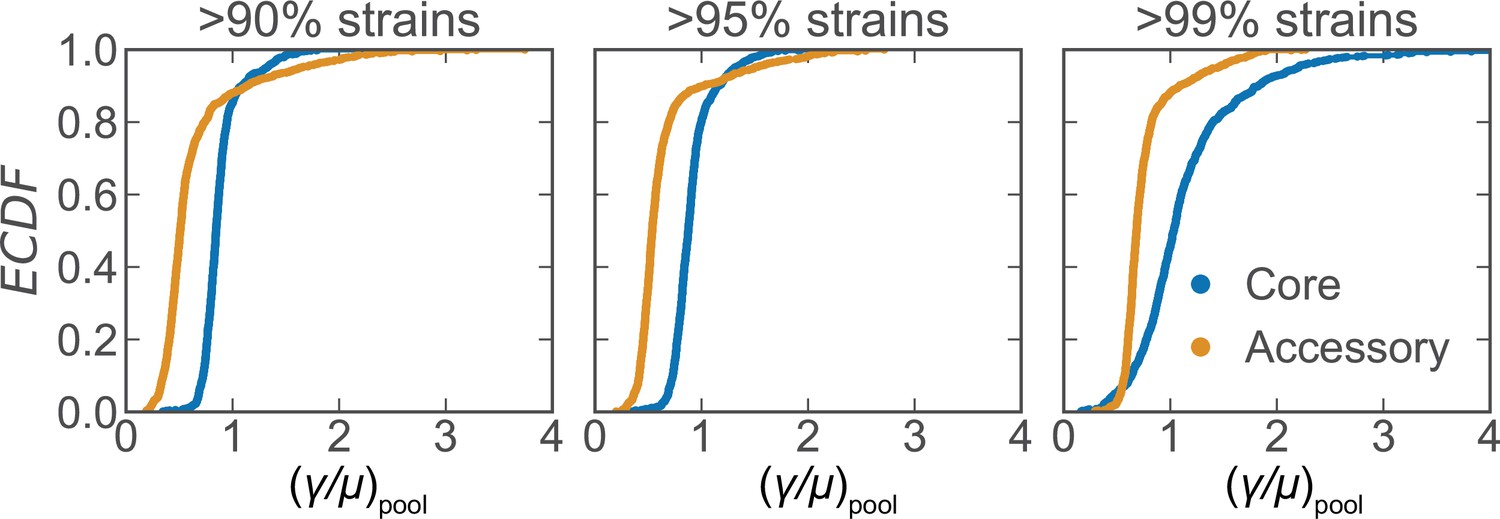
Recombination rate distributions for S. pneumoniae using different core gene cutoff thresholds.
Distributions of the relative recombination rate of the pool () for the core and accessory genomes of S. pneumoniae using different thresholds (indicated in subpanels) to define core genes (same dataset as Figure 2). Each subplot depicts empirical cumulative distribution functions (ECDFs) where each step in the ECDF corresponds to a pool recombination parameter inferred from a correlation profile measured over a sequence cluster or pair of clusters like that which is shown in Figure 2B. We used model selection with the Akaike information criterion to ensure that each profile was well fit (see Materials and methods for details). is unitless.
Figure 2—figure supplement 3
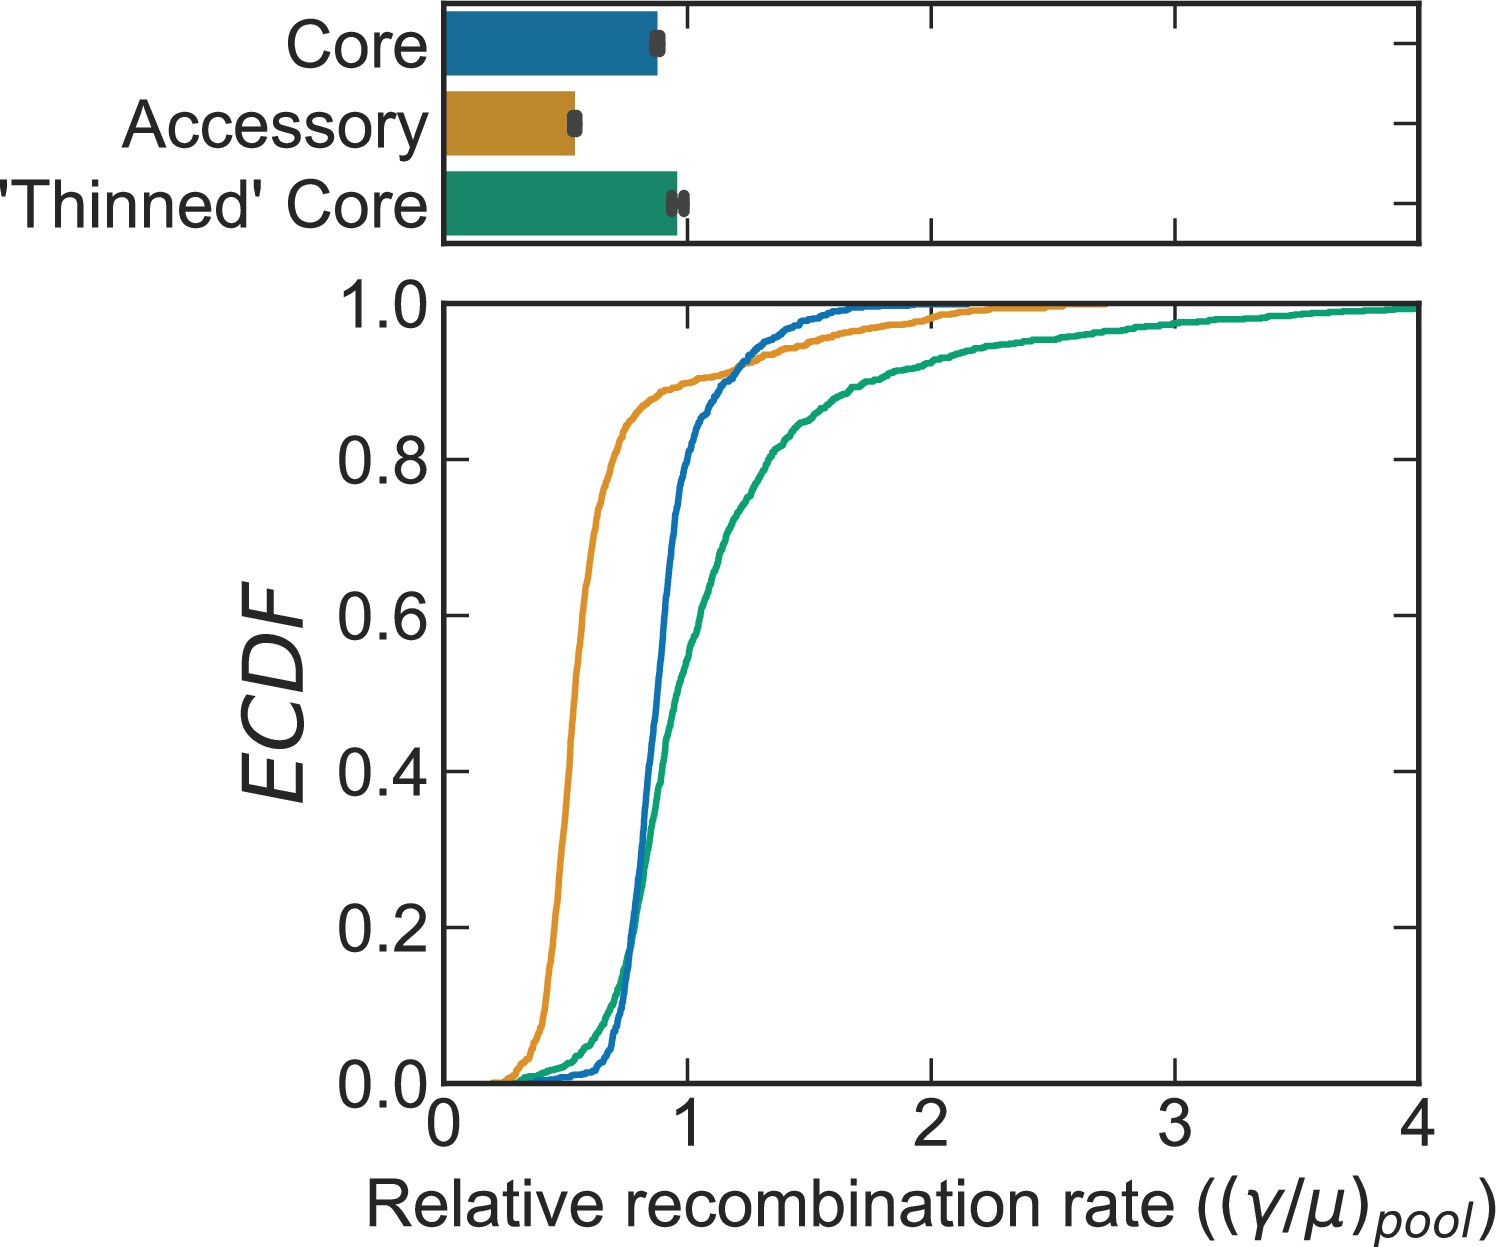
Comparison of recombination rates for the actual core and accessory genome versus an artificially ‘thinned’ core genome for S. pneumoniae.
Distributions of the relative recombination rate of the pool () for the S. pneumoniae dataset shown in Figure 2. The bottom plot depicts empirical cumulative distribution functions (ECDFs) and the top plots depict the medians of the bottom plot, where error bars are 95% bootstrap CIs created by sampling the distributions with replacement (n = 1000). Each step in the ECDF corresponds to a pool recombination parameter inferred from a correlation profile measured over a sequence cluster or pair of clusters like that which is shown in Figure 2B. Core genes are defined as genes found in >95% of strains. Curves/bars labeled ‘Core’ and ‘Accessory’ are reproduced from Figure 2E. Curve/bar labeled ‘Thinned’ Core is recombination rates inferred for the core genome which has been artificially ‘thinned’ to have the same number of sequence pairs as the accessory genome, as described in the main text. We used model selection with the Akaike information criterion to ensure that each profile was well fit (see Materials and methods for details).
Figure 2—figure supplement 4
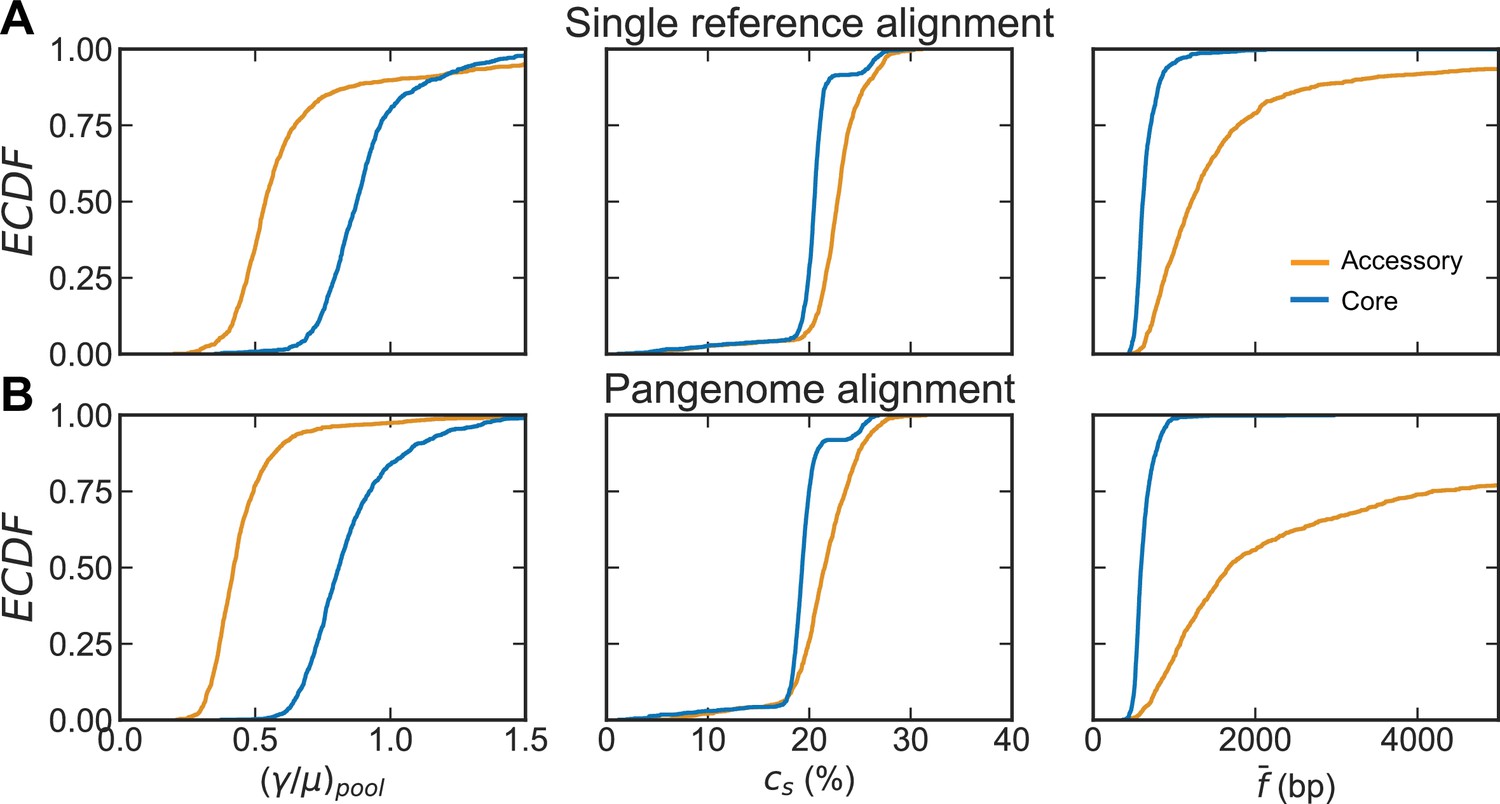
Comparison of distributions of recombination parameters for the core and accessory genome of S. pneumoniae with different alignment methods.
Recombination parameters inferred for each of the major sequence clusters (>100 strains) of ~26,000 S. pneumoniae strains from the PubMLST collection when raw reads were aligned to a single reference genome (A) compared to when raw reads were aligned to a multi-FASTA of all gene sequences in a pangenome generated by Roary (Page et al., 2015) (B). From left to right: distributions of the relative recombination rate (), the recombination coverage (), and the mean size of a fragment recombined into the genome (). The recombination rates are inferred for the pools, while the coverage and fragments sizes are inferred for the samples (i.e., the analyzed sequence clusters). Each plot depicts empirical cumulative distribution functions (ECDFs) for each parameter, where each step is a parameter inferred for a cluster or cluster pair. Core genes are defined as genes found in >95% of strains. For (A), left panel is reproduced from Figure 2E, center and right panels are reproduced from Figure 2—figure supplement 1. Clustering with the alignment using a single reference genome resulted in 44 major clusters, clustering with the pangenome alignment resulted in 46 major clusters. The relative recombination rate is unitless, recombination coverage is given as the percentage of genomic sites recombined, and the mean recombined fragment size is given in basepairs (bp).
Figure 3 with 1 supplement
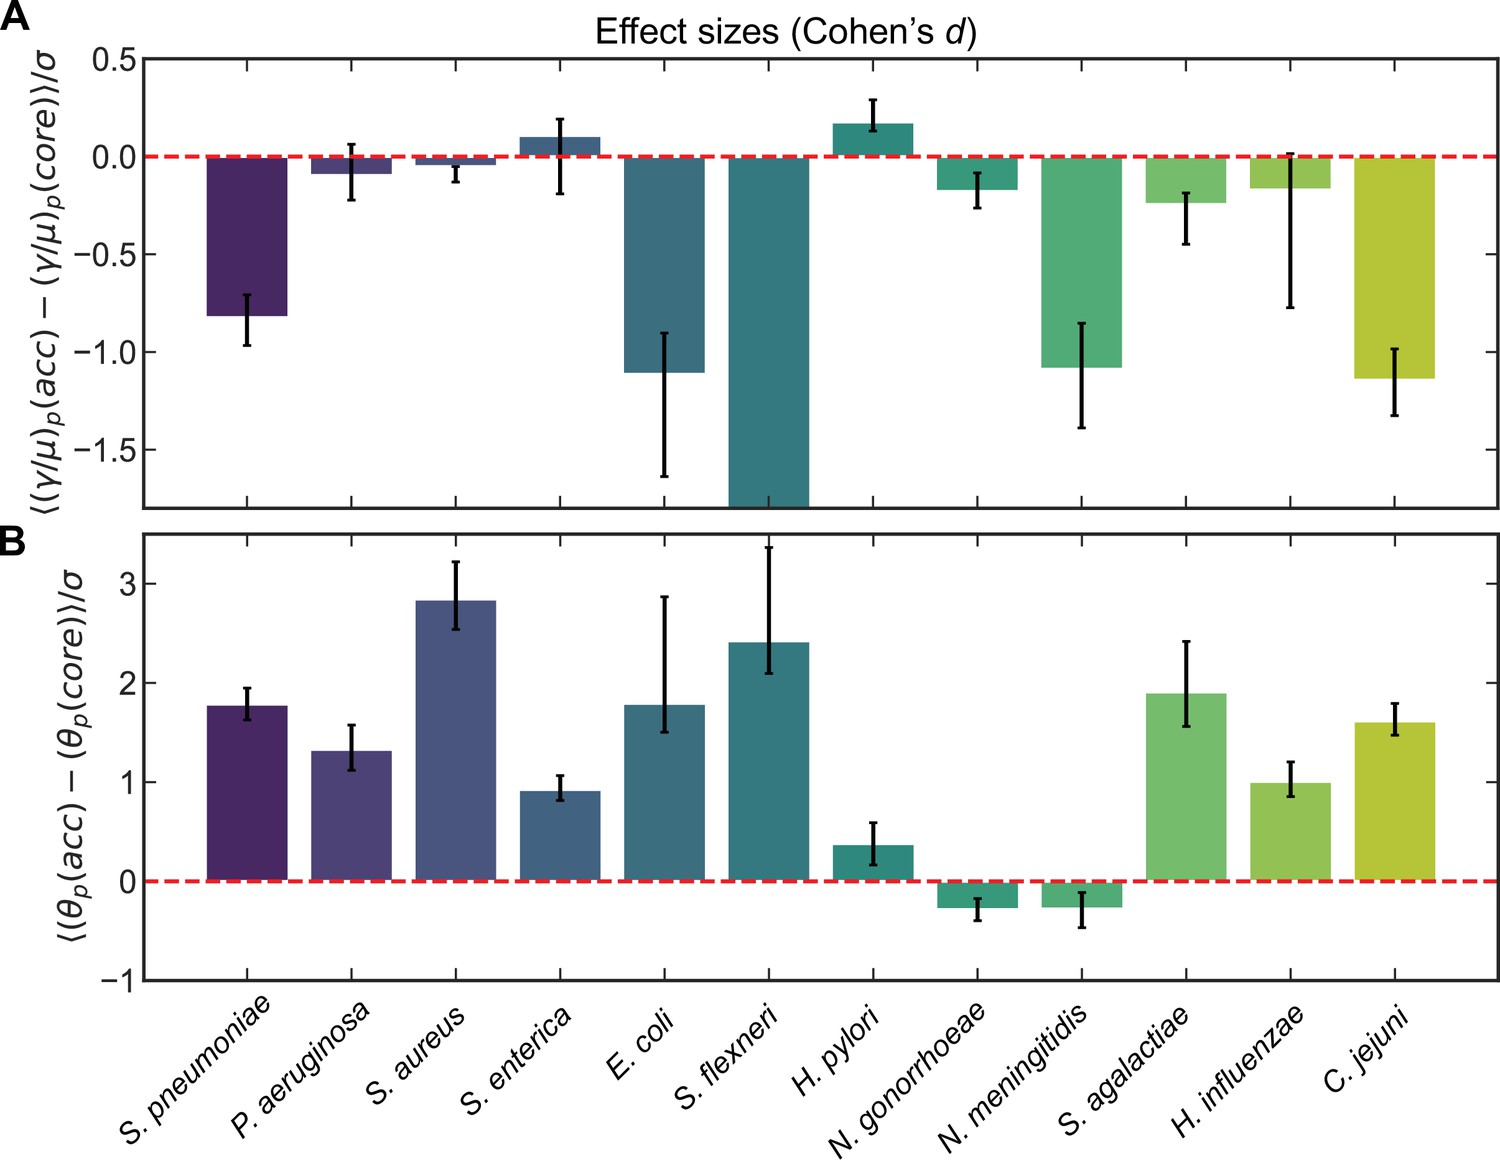
Effect sizes (Cohen’s d) for recombination rates and mutational divergence for S. pneumoniae and 11 additional microbial species.
Effect sizes (Cohen’s d) for (A) the relative recombination rate of the pool () and (B) the mutational divergence of the pool () for core/accessory genome pairs for individual clusters and pairs of clusters for S. pneumoniae and 11 additional microbial species. Cohen’s d for paired samples was calculated as the mean paired difference (, where or ) divided by the standard deviation of paired difference (). Error bars are 95% bootstrap CIs, calculated by sampling the distributions with replacement 10,000 times. All effect sizes are listed in Supplementary files 1 and 2, as well as the medians of the distributions and the results of the Wilcoxon signed-rank test for each species. For A, the effect size and 95% bootstrap CI for S. flexneri are −25.5 and [−34.4,−21.1], respectively. When model selection was performed with Akaike information criterion (AIC) (described in Materials and methods) if part of a core/accessory pair was poorly fit, the paired sample was excluded. Full species names, number of strains, number of clusters, and mean synonymous diversity within and between clusters are reported for each species in Supplementary file 3. Legends of supplementary material.
-
Figure 3—source data 1
Lists of SRA accession numbers corresponding to the raw reads of genomes used from NCBI.
- https://cdn.elifesciences.org/articles/78533/elife-78533-fig3-data1-v2.zip
Figure 3—figure supplement 1
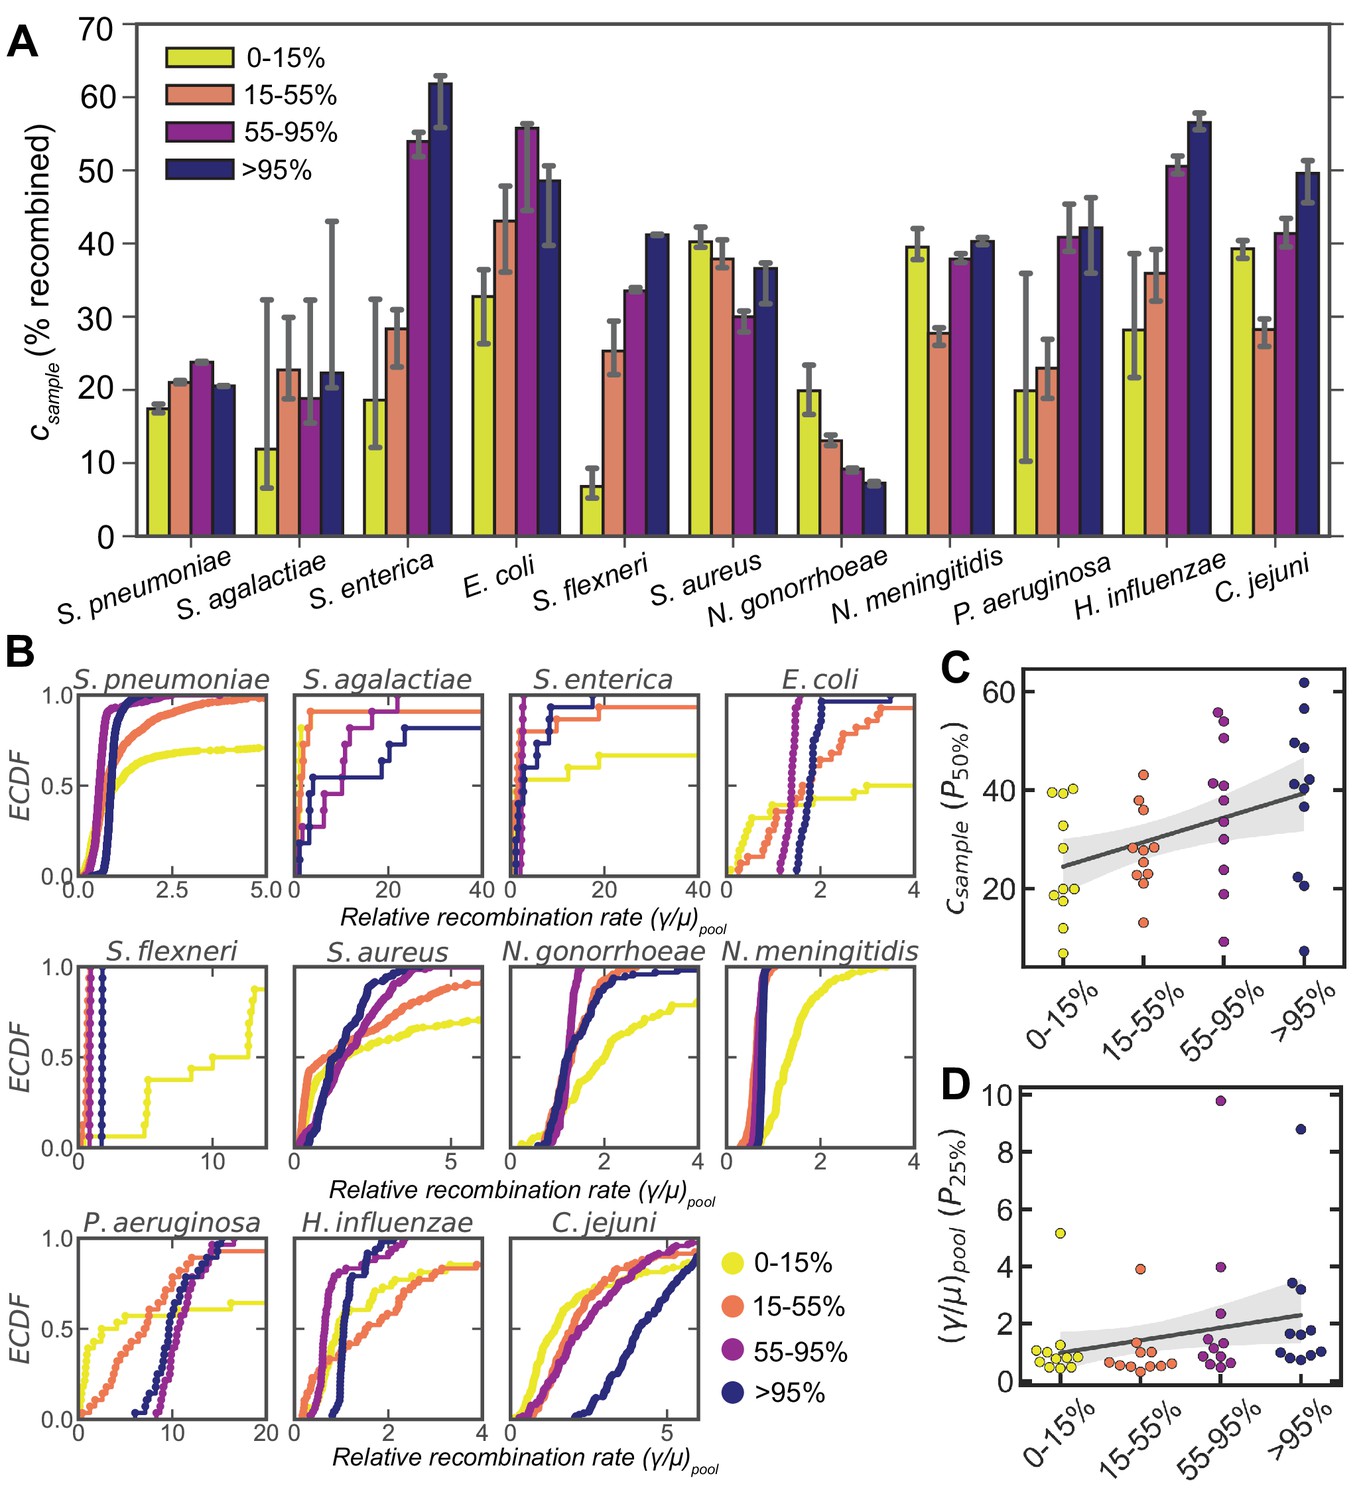
Dependence of recombination rates on gene frequency.
(A) Bar plots depicting the medians of the recombination coverage ( , given as the percentage of sites recombined) for genes of different frequency (i.e., the percentage of strains which have a given gene) for 11 microbial species. Matched parameter distributions were inferred from correlation profiles within and between clusters for each species. Error bars are 95% bootstrap CIs measured by randomly sampling with replacement from the parameter distributions. 10,000 bootstrap replicates were calculated. (B) ECDFs of the relative recombination rate (), for different gene frequencies corresponding to the same matched distributions shown in A. Two-sided p values were calculated using the Friedman test to compare the matched distributions shown in A and B (Supplementary file 4). The 50th percentile of the recombination coverage (C) and the 25th percentile of the rate (D) distributions for each species plotted against gene frequency. The solid gray line is a simple linear regression; shaded areas are 95% CIs of the regression estimated by bootstrapping the medians for each species. p values were calculated using the Wald test, where the null hypothesis is that the slope is less than zero; p = 0.003 and 0.05 for panels C and D, respectively. For all panels, only matched samples where parameters could be inferred for each gene frequency bin were included (i.e., all correlation profiles were deemed well fit by model selection using Akaike information criterion [AIC] as described in Materials and methods). For H. pylori this excluded almost all matched samples ( remained), leaving us with insufficient data to perform this analysis.
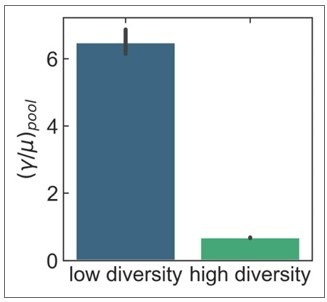
Author response image 1
Additional files
-
Supplementary file 1
Effect sizes, results of Wilcoxon signed-rank test, and medians of the recombination rate distributions for S. pneumoniae and 11 additional microbial species.
Values listed in the table were computed for core/accessory genome pairs for individual clusters and pairs of clusters. Effect sizes for the relative recombination rate () were calculated using Cohen’s d for paired samples using the mean paired difference () divided by the standard deviation of paired differences (). Two-sided p values were calculated using the Wilcoxon signed-rank test to compare the paired distributions of relative recombination rates for the core and accessory genome within each microbial species. The null hypothesis is that the distribution of paired differences is symmetric about zero (where is the paired difference for recombination parameter inferred for the core and accessory genome of cluster or cluster pair i). The columns and correspond to the median relative recombination rate of the accessory and core genome over all clusters and pairs of clusters. Values displayed in brackets are 95% bootstrap CIs calculated by sampling the distributions with replacement 10,000 times.
- https://cdn.elifesciences.org/articles/78533/elife-78533-supp1-v2.xlsx
-
Supplementary file 2
Effect sizes, results of Wilcoxon signed-rank test, and medians of the mutational divergence distributions for S. pneumoniae and 11 additional microbial species.
Values listed in the table were computed using the pool’s mutational divergence () for core/accessory genome pairs for individual clusters and pairs of clusters. This table is identical to Supplementary file 1 except the statistics displayed here were calculated using .
- https://cdn.elifesciences.org/articles/78533/elife-78533-supp2-v2.xlsx
-
Supplementary file 3
Description of the microbial species analyzed in Figures 2 and 3 and Supplementary files 1 and 2.
Column descriptions are as follows: ‘species’ and ‘full name’ give the abbreviated species name used in the main text and full species name, respectively, ‘major clusters’ gives the number of sequence clusters analyzed, ‘total strains aligned’ gives the number of consensus genomes (or whole genome sequences) which were made by aligning raw reads to the reference genome, ‘total strains in major clusters’ gives the number of strains included in the major clusters (and therefore included in the analysis of recombination parameters), and ‘min strains per cluster’ gives the minimum number of strains a cluster had to have to be designated as a major cluster. The minimum cluster size was lowered for smaller strain collections as follows (where s is the number of strains in the collection): for s > 10,000 in the collection the minimum cluster size was 100, for 10,000 > s > 5000 the minimum was 50 (S. enterica was on the border, so we took the minimum to be 50), for 5000 > s > 1000 the minimum was 25, and for s < 1000 the minimum was 10. The last four columns give the average synonymous diversity () within clusters and between clusters (shown as mean ± st. dev.). ‘Acc’ stands for accessory.
- https://cdn.elifesciences.org/articles/78533/elife-78533-supp3-v2.xlsx
-
Supplementary file 4
Results of Friedman test comparing matched distributions for each of the nine microbial species shown in Figure 3—figure supplement 1.
Two-sided p values were calculated using the Friedman test to compare the matched distributions of the normalized recombination rate () and recombinational coverage () for all four gene frequency bins within each microbial species shown in Figure 3—figure supplement 1. Null hypothesis in this case is that the measurements have been drawn from the same distribution.
- https://cdn.elifesciences.org/articles/78533/elife-78533-supp4-v2.xlsx
-
Supplementary file 5
Identifying information for sequencing data used in study.
Source of data and corresponding identifiers for all sequencing data used in this study.
- https://cdn.elifesciences.org/articles/78533/elife-78533-supp5-v2.xlsx
-
MDAR checklist
- https://cdn.elifesciences.org/articles/78533/elife-78533-mdarchecklist1-v2.docx
Download links
A two-part list of links to download the article, or parts of the article, in various formats.
Downloads (link to download the article as PDF)
Open citations (links to open the citations from this article in various online reference manager services)
Cite this article (links to download the citations from this article in formats compatible with various reference manager tools)
Core genes can have higher recombination rates than accessory genes within global microbial populations
eLife 11:e78533.
https://doi.org/10.7554/eLife.78533


