Comparative multi-tissue profiling reveals extensive tissue-specificity in transcriptome reprogramming during thermal adaptation
- Department of Cell Physiology and Metabolism, Faculty of Medicine, Centre Medical Universitaire (CMU), University of Geneva, Switzerland
- Diabetes center, Faculty of Medicine, University of Geneva, Switzerland
- Department of Pathology and Immunology, Faculty of Medicine, Centre Medical Universitaire (CMU), University of Geneva, Switzerland
- NGS- Integrative Genomics Core Unit (NIG), Institute of Human Genetics, University Medical Center, Germany
Figures
Figure 1
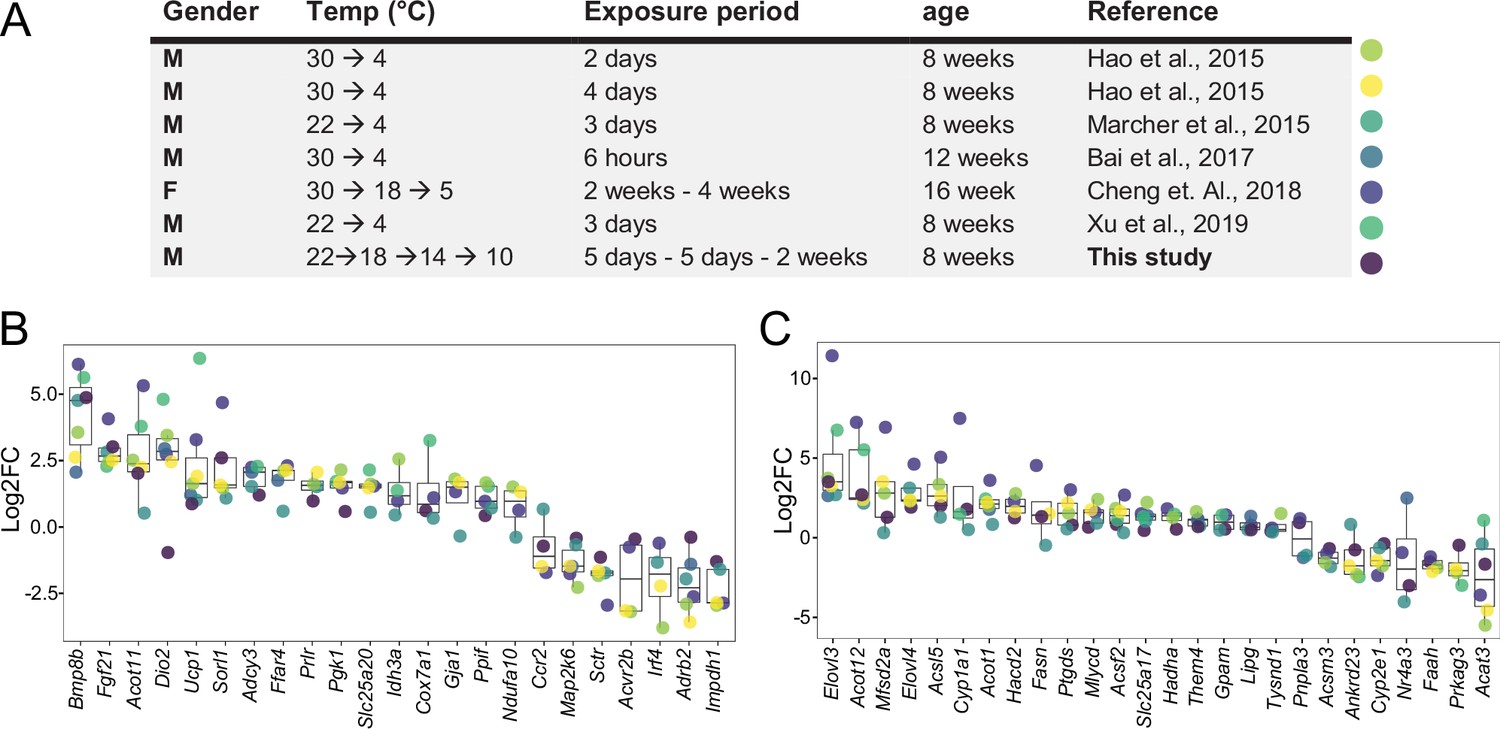
Log2FC of brown adipose tissue (BAT) biomarkers across seven datasets.
(A) Table of seven cold exposure studies with their corresponding experimental conditions. (B) Log2FC of 23 selected BAT thermogenic markers. (C) Log2FC of 26 selected fatty acid metabolism gene markers. The markers in (B) and (C) were selected as being significantly (p<0.05) regulated in at least four datasets. Each dot corresponds to the log2FC of the indicated gene and colors specify the corresponding study as designated in (A).
Figure 2 with 1 supplement
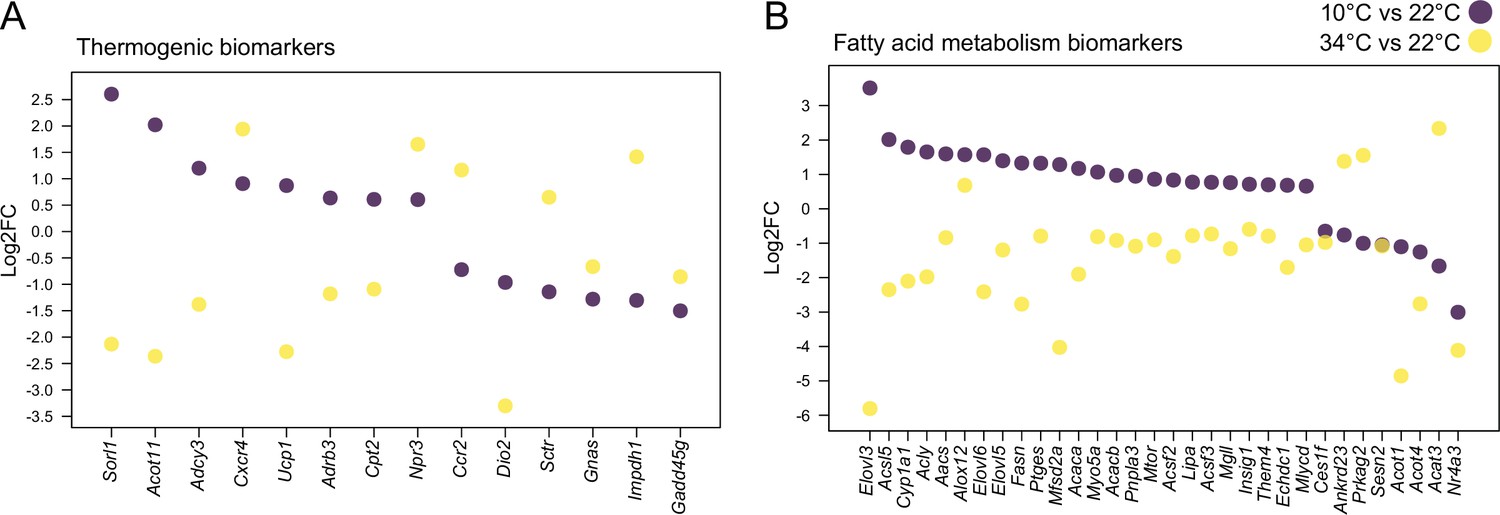
Cold and mild warm exposures induce opposite gene expression changes in BAT.
Thermogenic (A) and fatty acid metabolism (B) biomarkers in BAT of mice exposed to 10 °C vs. 22 °C, and 34 °C vs. 22 °C controls. All shown genes are significantly changed (p<0.05) and their Log2FC was calculated based on replicates with p-values listed in Supplementary file 6.
Figure 2—figure supplement 1
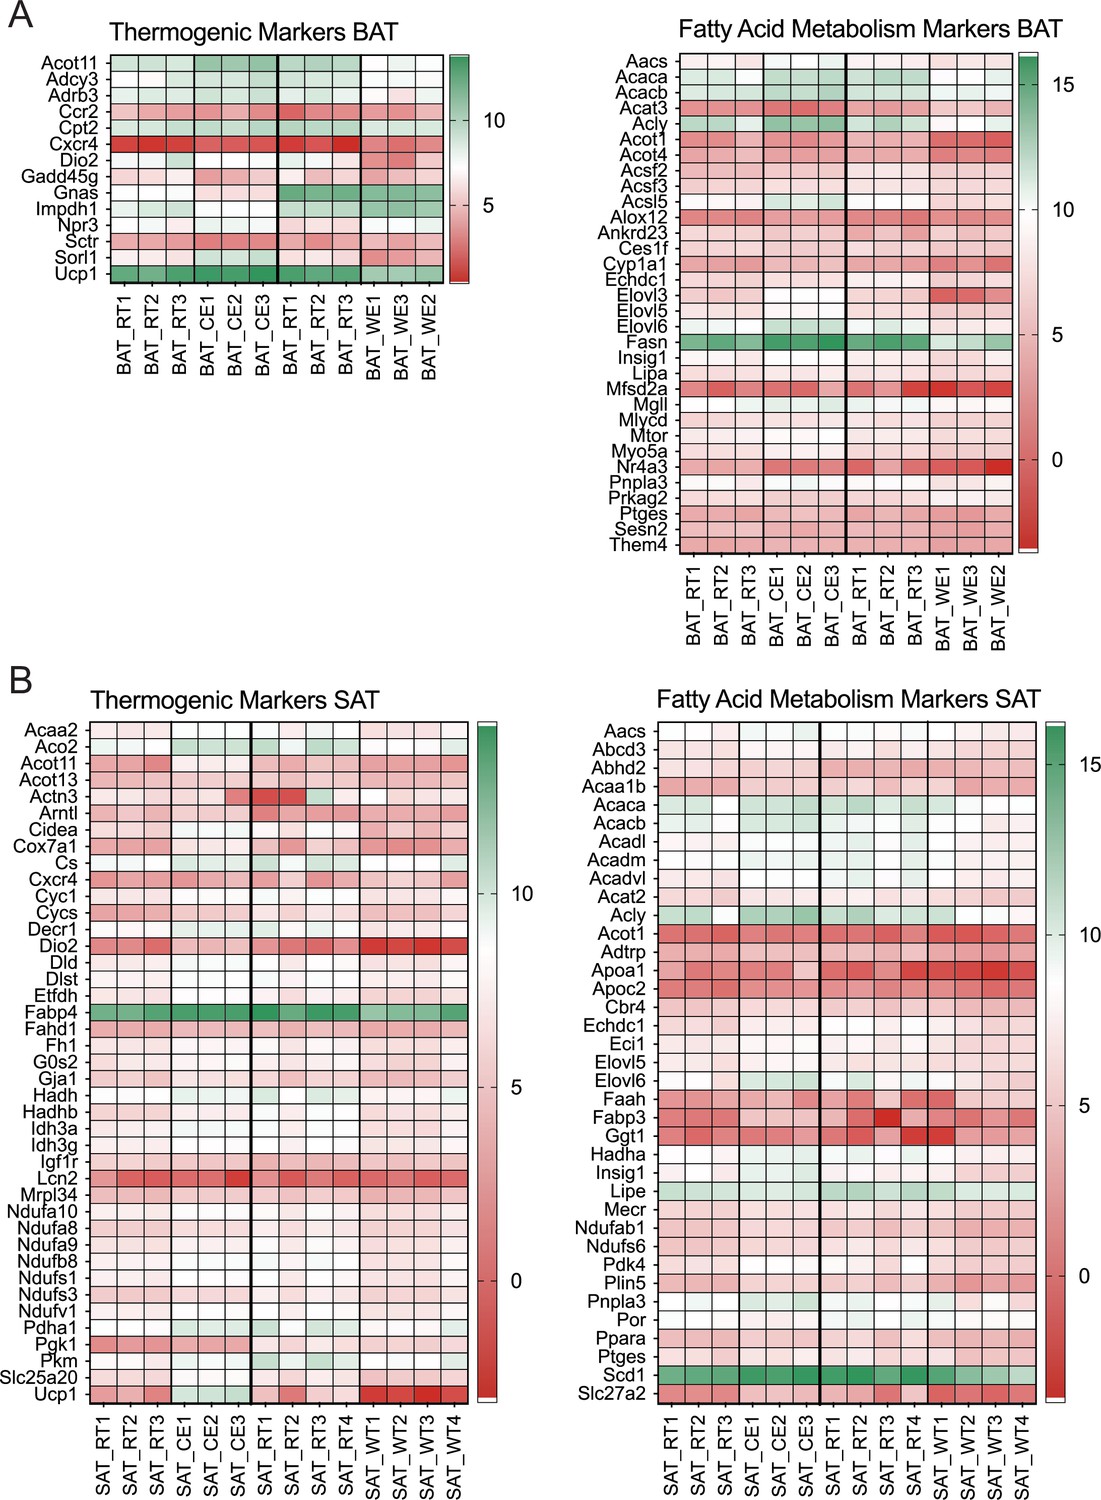
Heatmap of the thermogenic.(A) and fatty acid metabolism (B) biomarkers in BAT and SAT of mice as in Figure 2 showing the individual values.
The color code gradient on the right of each pane shows Log scale values of the significantly changed genes (p<0.05).
Figure 3
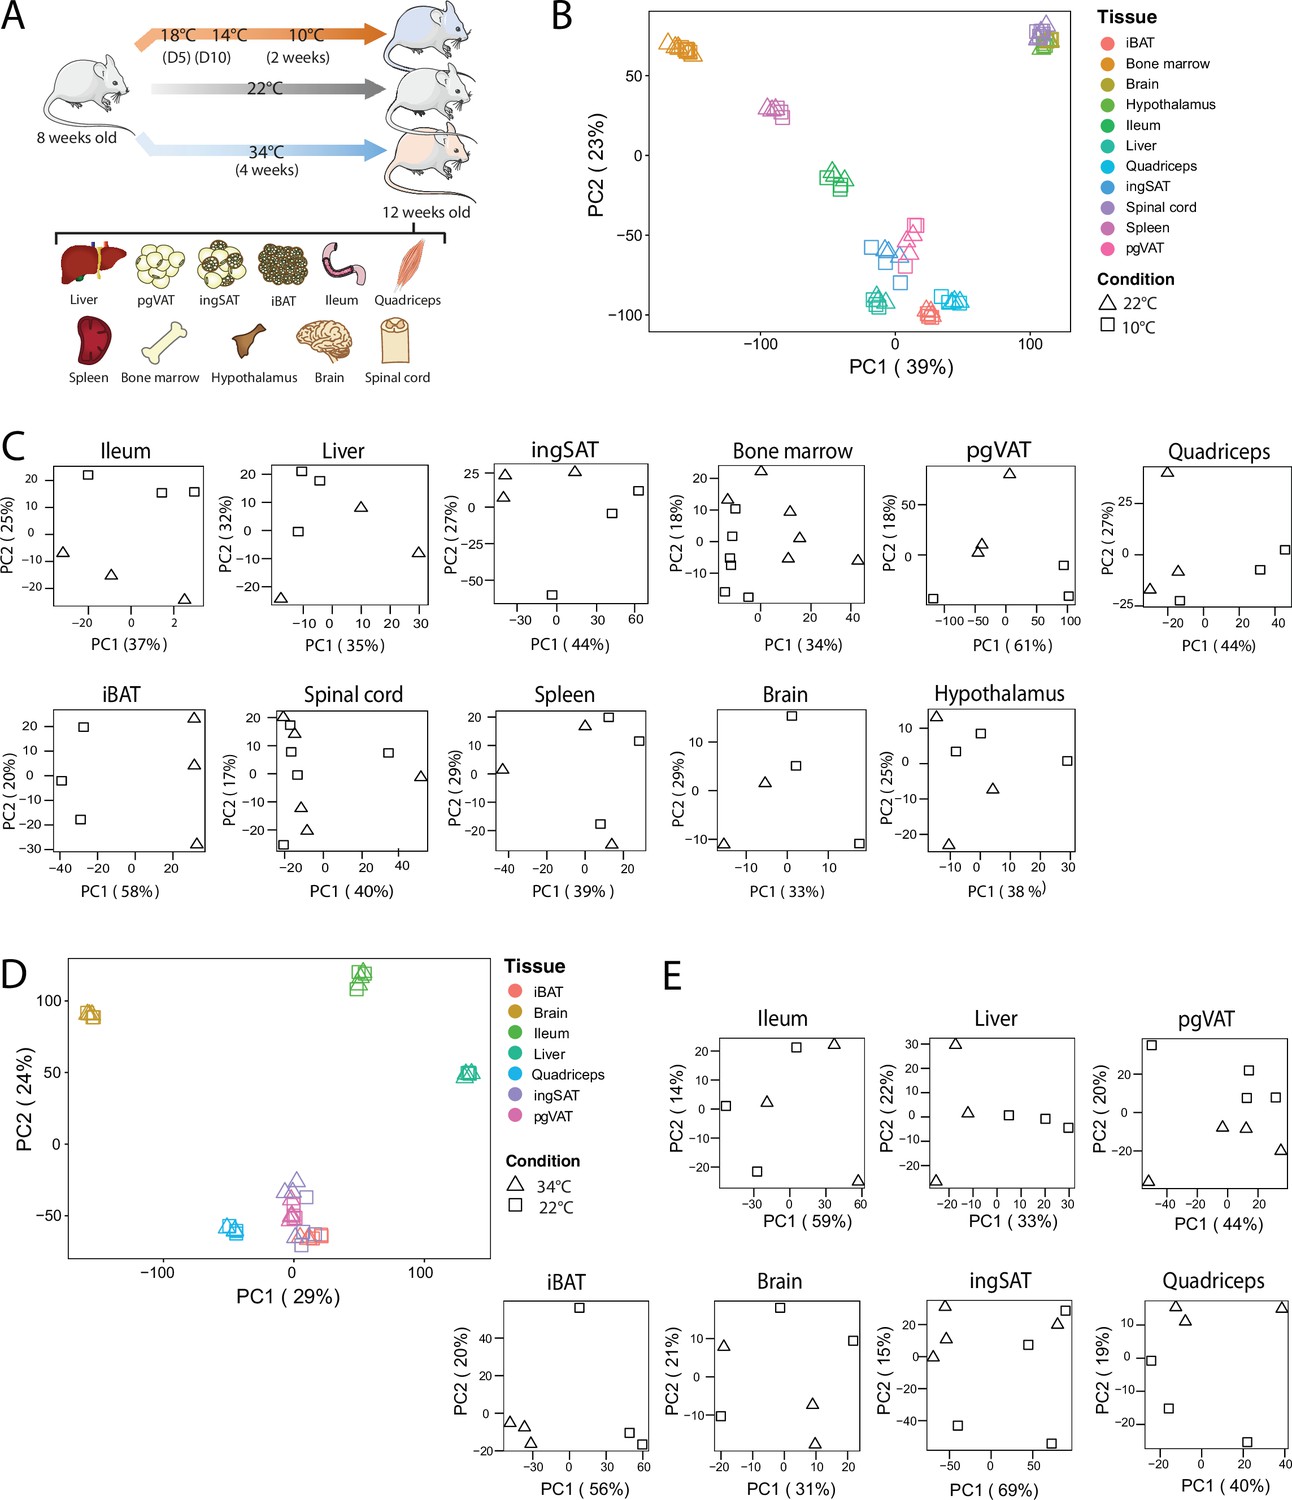
QC and clustering of the biological samples and tissues at 10 °C, 22 °C, and 34 °C.
(A) Experimental setup: 8-week-old C57BL/6 J mice were exposed to 34 °C for 4 weeks, 10 °C for 2 weeks following acclimatization at 18 °C, and 14 °C for 5 days each, or kept at room RT (22 °C) during the exposure of the respective temperature-challenged group, and their tissues were harvested for RNA sequencing. (B) Principal component analysis (PCA) of the transcriptome across the 11 tissues at RT and 10 °C of mice as in (A). Physiologically close tissues are distinguished by global gene expression patterns. For 10 °C samples, each dot represents a pool of two mice, except for the spinal cord and bone marrow, where each dot represents one mouse. (C) PCA of samples for each tissue from mice as in (B). (D) Principal component analysis (PCA) of the transcriptome across the 7 tissues of mice as in (A) exposed to 34 °C or RT for 4 weeks. (E) PCA of samples for each tissue from mice as in (A).
Figure 4
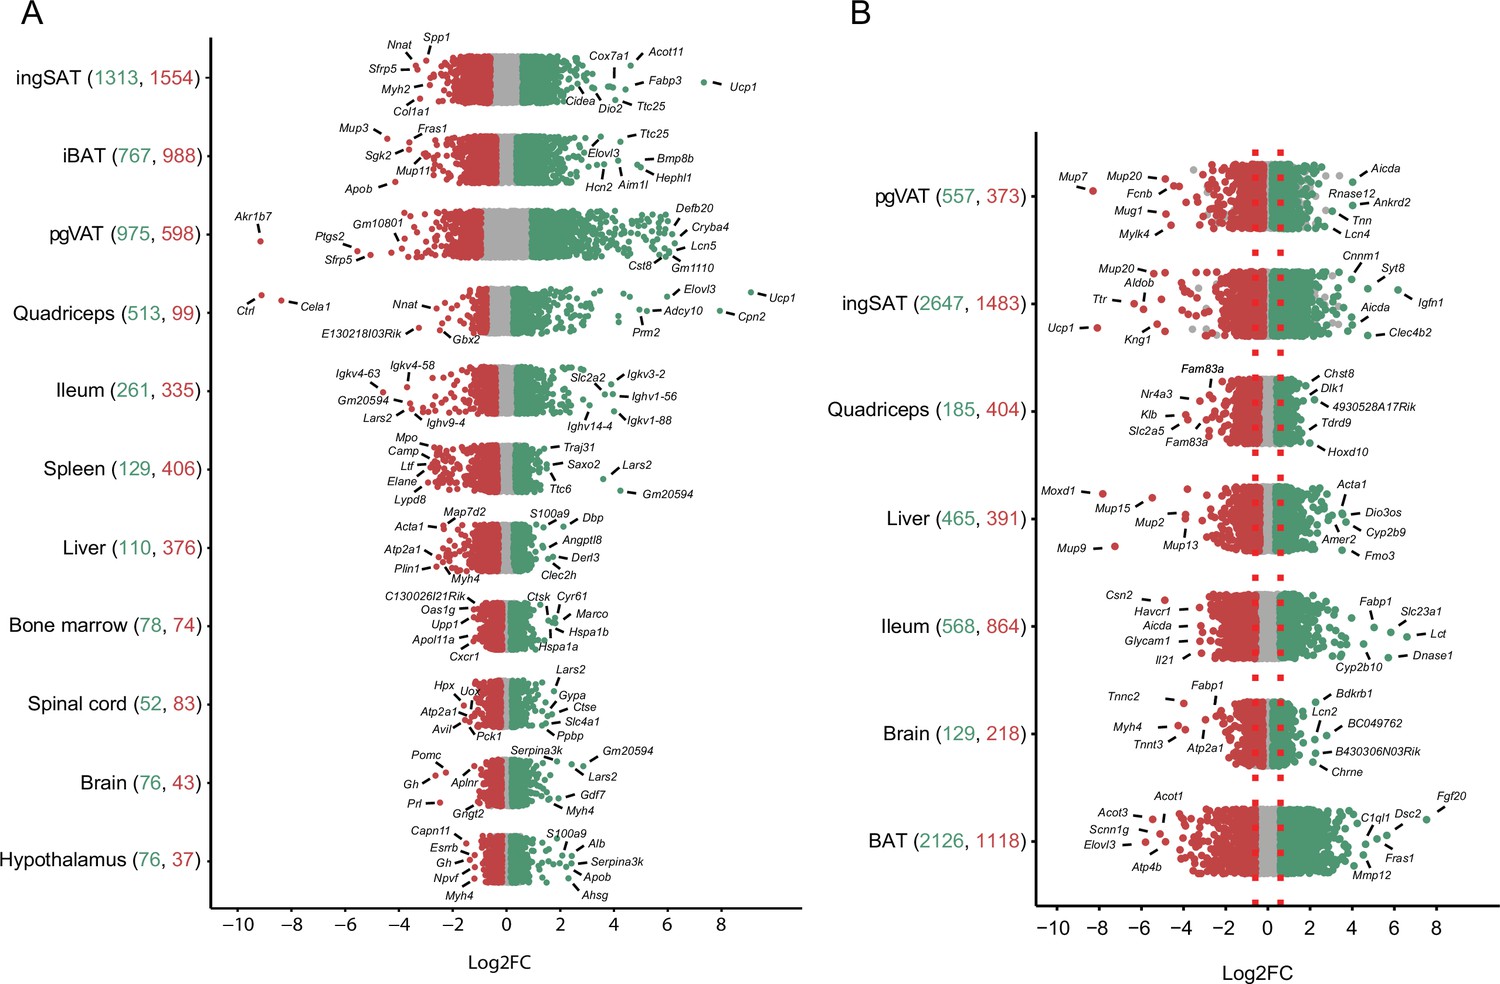
Distribution and degree of differential gene expression when comparing 10 °C to 22 °C and 34 °C to 22 °C.
Log2FC of all genes across the tissues of mice exposed to 10 °C vs. 22 °C (A) and 34 °C vs. 22 °C (B). Red and green colored dots indicate p<0.05, whereas grey dots indicate p>0.05. Numbers in parentheses on the x-axis indicate the number of significantly up- (green) and down- (red) regulated genes. Gene names are shown for the 5–7 most up- and down-regulated genes with highest log2FC.
Figure 5

Thermogenesis and fatty acid metabolism are altered in opposing directions during cold and warm.
Thermogenic (left) and fatty acid metabolism (right) biomarkers in SAT when comparing 10°C to 22°C and 34°C to 22°C. All shown genes are significantly changed (p<0.05) and their Log2FC was calculated based on replicates with p-values listed in Supplementary file 6.
Figure 6

Visualization of the highly enriched gene sets indicates common enrichment within groups of tissues upon thermal adaptation.
(A, B) Visualized are the top ranked 50 up- and down-regulated gene sets at 10 °C (A) and 34 °C (B) exposure. The p-value and the gene ratio (the ratio of differentially expressed genes to annotated genes in each gene set) were used as ranking criteria and the p-value weight is indicated with a gradient. The gene ratios are indicated by size of the dots and the exact values are provided in the supplementary Supplementary file 7. Gene sets that are commonly regulated in more than two tissues are highlighted in bold.
Figure 7
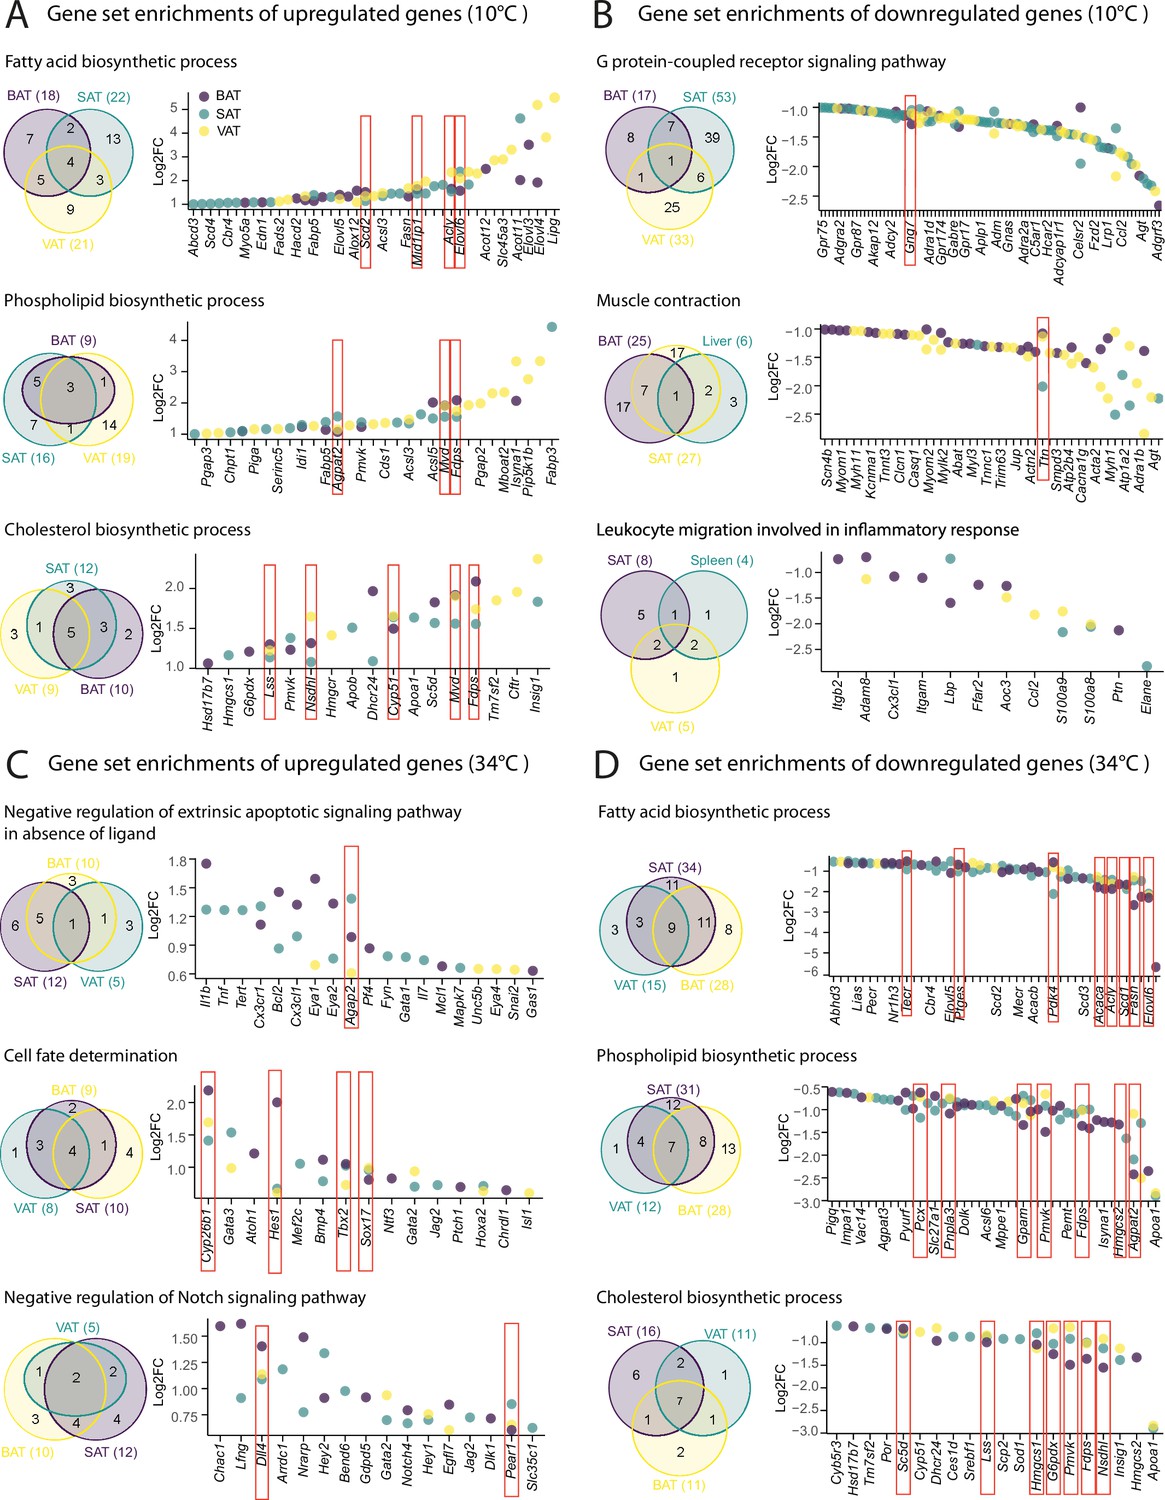
Shared tissue GO term enrichments and implicated genes.
(A–D) Venn diagrams (left) showing shared adipose tissue GO gene set enrichment, and dot plot of genes involved in these gene sets (right) that are significantly (p<0.05) up- (A–C), or down-regulated (B–D) across adipose tissues from mice as in Figure 2A. Not all the genes are labeled on the dot plots. Values are Log2FC and p-values are shown in .
Figure 8
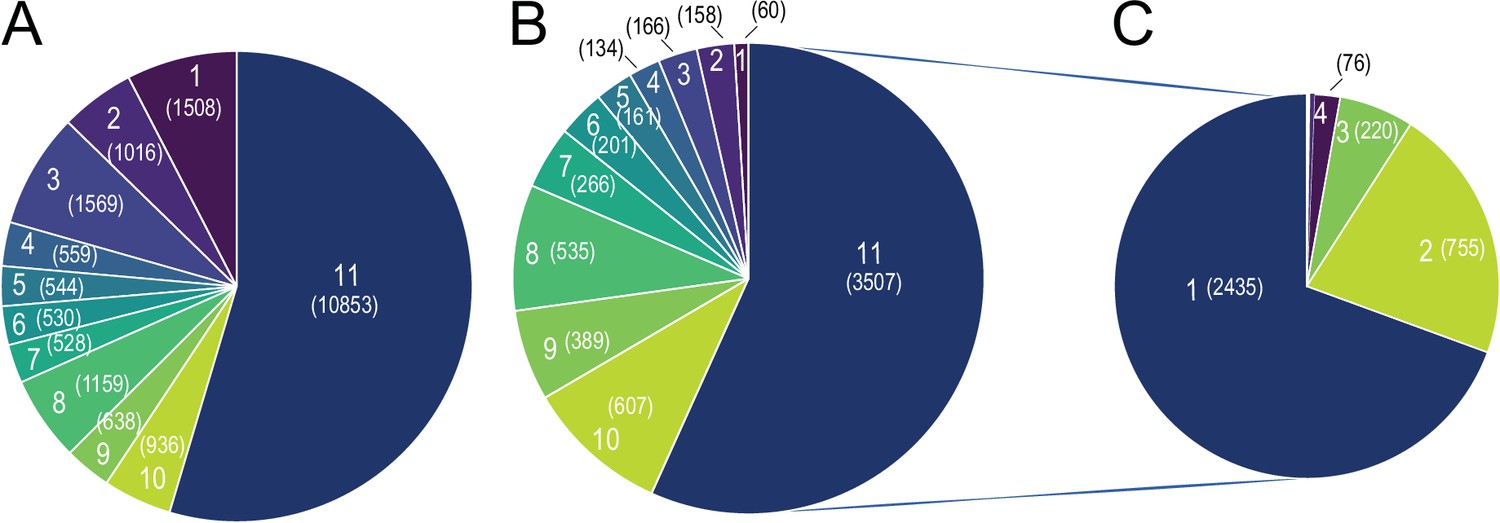
Global Tissue-shared and tissue-specific gene expression and regulation patterns across 11 tissues.
(A) The distribution of 19,881 expressed genes based on the number of tissues. Number of tissues is indicated on each slice of the Pie chart and the number of genes is shown in parenthesis, for example, 10,853 genes are expressed in all 11 tissues and 1,508 genes are expressed in only one tissue (B) The distribution of 6183 differentially expressed genes based on the number of tissues. Number of tissues is indicated on each slice of the Pie chart and the number of genes is shown in parenthesis. Number of tissues and colors are kept in the same order as in (A), for example, out of the 1508 genes that are expressed only in one tissue, 60 genes are differentially expressed. (C) The distribution of 3507 differentially expressed genes based on the number of tissues, for example, 2435 genes are differentially expressed in only one tissue.
Figure 9
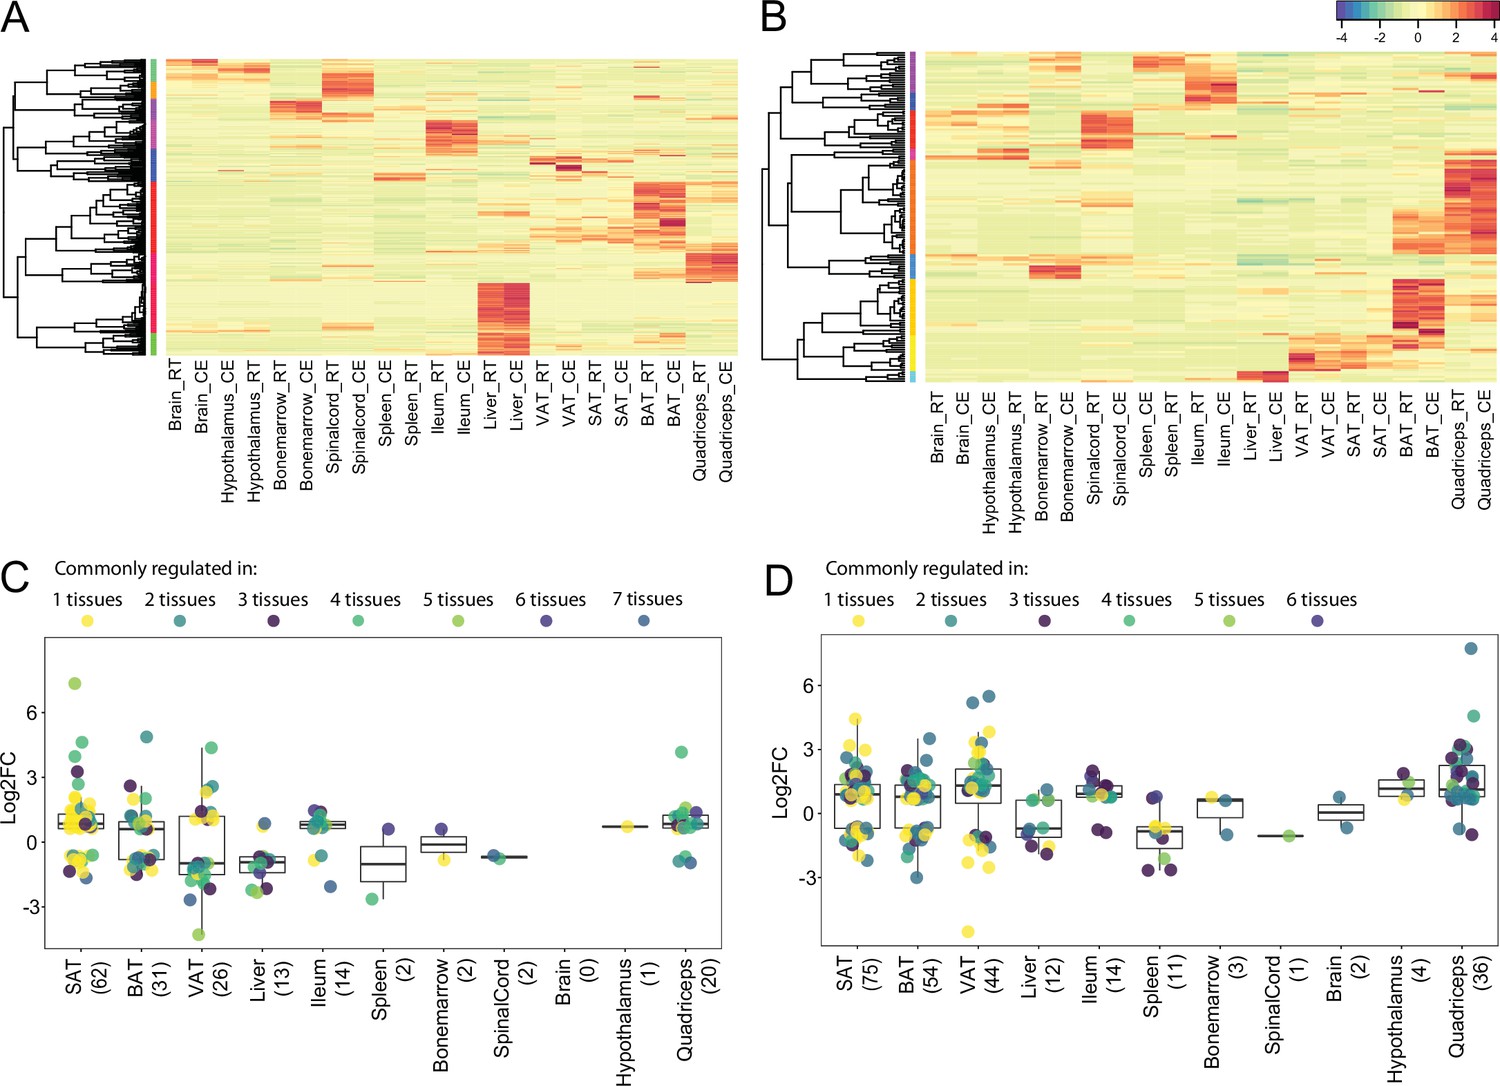
Expression and regulation of thermogenic and fatty acid metabolism biomarkers across 11 tissues.
(A) and (B) Heatmap showing an average of the thermogenic and fatty acid metabolism biomarker expression values of mice at RT or cold as in Figure 2A across the 11 tissues. (C) and (D) Log2FC of the significantly (p<0.05) differentially expressed thermogenic and fatty acid metabolism biomarkers across the 11 tissues. Each dot corresponds to the log2FC of a gene and colors specify the number of tissues where that gene is differentially expressed. The total number of differentially expressed genes for each tissue is shown in parenthesis.
Figure 10
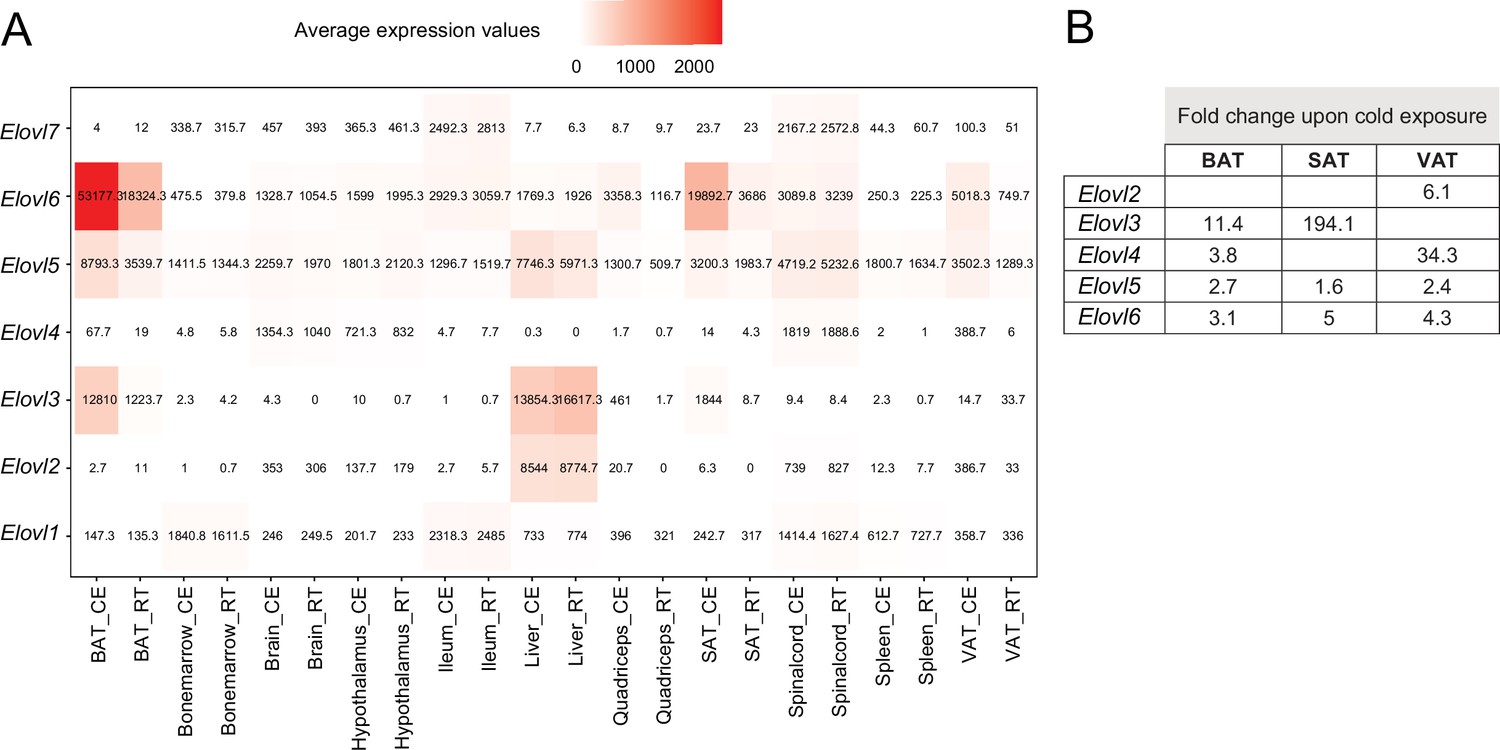
Average expression and regulation of Elovl gene family across 11 tissues at RT and cold.
(A) Heatmap showing average of the normalized gene expression values of mice at RT or cold as in Figure 2A across seven tissues where these genes are expressed. (B) Log2FC of the significantly upregulated genes (p<0.05) of the Elovl family from mice as in (A). Significant changes of the Elovl family were detected only in in the adipose tissues.
Tables
Table 1
GO-based gene set enrichment analysis when comparing 10 °C vs 22 °C and 34 °C vs 22 °C.
| Significantly enriched GO terms (p-value <0.05) | ||||
|---|---|---|---|---|
| Tissue | # of upregulated GO terms at 10 °C | # of downregulated GO terms at 10 °C | # of upregulated GO terms at 34 °C | # of downregulated GO terms at 34 °C |
| ingSAT | 83 | 178 | 264 | 177 |
| Quadriceps | 117 | 23 | 14 | 75 |
| pgVAT | 42 | 73 | 93 | 54 |
| iBAT | 43 | 53 | 175 | 82 |
| Spleen | 1 | 55 | - | - |
| Hypothalamus | 30 | 14 | - | - |
| Ileum | 25 | 12 | 59 | 187 |
| Liver | 3 | 27 | 64 | 19 |
| Bone marrow | 18 | 6 | - | - |
| Brain | 6 | 11 | 12 | 36 |
| Spinal cord | 8 | 5 | - | - |
Table 2
Number of up- and down-regulated genes per tissue shown as tissue-specific up-regulation and down-regulation profiles at both 10 °C and 34 °C exposures.
The percentage of tissue-specific changes versus the total number of differentially expressed genes (as in Figure 3) is displayed in parenthesis.
| Tissue | Tissue-specific upregulation profiles | Tissue-specific downregulation profiles | ||
|---|---|---|---|---|
| # of genes (% of tissue-specific) | # of genes (% of tissue-specific) | |||
| 10 °C exposure | 34 °C exposure | 10 °C exposure | 34 °C exposure | |
| ingSAT | 883 (67%) | 1621 (65%) | 995 (64%) | 911 (64%) |
| pgVAT | 719 (75%) | 139 (27%) | 570 (58%) | 144 (41%) |
| iBAT | 376 (49%) | 269 (74%) | 300 (74%) | 526 (54%) |
| Quadriceps | 292 (57%) | 32 (56%) | 258 (43%) | 75 (40%) |
| Ileum | 155 (59%) | 929 (57%) | 218 (65%) | 566 (88%) |
| Spleen | 91 (71%) | - | 212 (56%) | - |
| Liver | 77 (70%) | 142 (58%) | 56 (57%) | 154 (73%) |
| Bone marrow | 51 (65%) | - | 47 (64%) | - |
| Hypothalamus | 50 (66%) | - | 27 (63%) | - |
| Brain | 43 (57%) | 6 (67%) | 25 (68%) | 17 (68%) |
| Spinal cord | 27 (52%) | - | 22 (27%) | - |
| Total | 2764 (79%) | 3132 (59%) | 2730 (76%) | 2376 (62%) |
Additional files
-
Supplementary file 1
148 potential thermogenic biomarkers combined from literature and GO database, together with their log2FC across 7 studies.
- https://cdn.elifesciences.org/articles/78556/elife-78556-supp1-v1.xlsx
-
Supplementary file 2
292 potential fatty acid metabolism biomarkers from GO database, together with their log2FC across 7 studies.
- https://cdn.elifesciences.org/articles/78556/elife-78556-supp2-v1.xlsx
-
Supplementary file 3
Log2FC of significantly (p<0.05) regulated genes across 7 tissues exposed to 34°C.
- https://cdn.elifesciences.org/articles/78556/elife-78556-supp3-v1.xlsx
-
Supplementary file 4
Log2FC of significantly (p<0.05) regulated genes across 10 tissues exposed to 10°C.
- https://cdn.elifesciences.org/articles/78556/elife-78556-supp4-v1.xlsx
-
Supplementary file 5
Comparisons of the log2FC of common genes across the tissues between the 10°C and 34°C exposures.
- https://cdn.elifesciences.org/articles/78556/elife-78556-supp5-v1.xlsx
-
Supplementary file 6
Statistical values for the thermogenic and fatty acid biomarker changes in BAT and SAT after 10°C and 34°C exposures.
- https://cdn.elifesciences.org/articles/78556/elife-78556-supp6-v1.xlsx
-
Supplementary file 7
Enriched GO terms across 10 tissues (exposed to 10°C) and 7 tissues (exposed to 34°C).
- https://cdn.elifesciences.org/articles/78556/elife-78556-supp7-v1.xlsx
-
Supplementary file 8
248 commonly enriched GO terms between both treatments (exposure to 10°C and to 34°C).
- https://cdn.elifesciences.org/articles/78556/elife-78556-supp8-v1.xlsx
-
Supplementary file 9
Statistical values of the regulated pathways shown in Figure 7.
- https://cdn.elifesciences.org/articles/78556/elife-78556-supp9-v1.xlsx
-
Supplementary file 10
Average of the normalized gene expression values across the 11 tissues at RT and at 10°C.
- https://cdn.elifesciences.org/articles/78556/elife-78556-supp10-v1.xlsx
-
Supplementary file 11
Average of the normalized gene expression values of thermogenic and fatty acid metabolism biomarkers of mice at RT and at 10°C across the tissues.
- https://cdn.elifesciences.org/articles/78556/elife-78556-supp11-v1.xlsx
-
Supplementary file 12
Gene family members.
- https://cdn.elifesciences.org/articles/78556/elife-78556-supp12-v1.xlsx
-
Supplementary file 13
Summary of the study design.
- https://cdn.elifesciences.org/articles/78556/elife-78556-supp13-v1.xlsx
-
Transparent reporting form
- https://cdn.elifesciences.org/articles/78556/elife-78556-transrepform1-v1.docx
Download links
A two-part list of links to download the article, or parts of the article, in various formats.
Downloads (link to download the article as PDF)
Open citations (links to open the citations from this article in various online reference manager services)
Cite this article (links to download the citations from this article in formats compatible with various reference manager tools)
Comparative multi-tissue profiling reveals extensive tissue-specificity in transcriptome reprogramming during thermal adaptation
eLife 11:e78556.
https://doi.org/10.7554/eLife.78556


