Typhoid toxin sorting and exocytic transport from Salmonella Typhi-infected cells
- Department of Microbial Pathogenesis, Yale University School of Medicine, United States
- Graduate Institute of Microbiology, College of Medicine, National Taiwan University, Taiwan
Figures
Figure 1 with 1 supplement
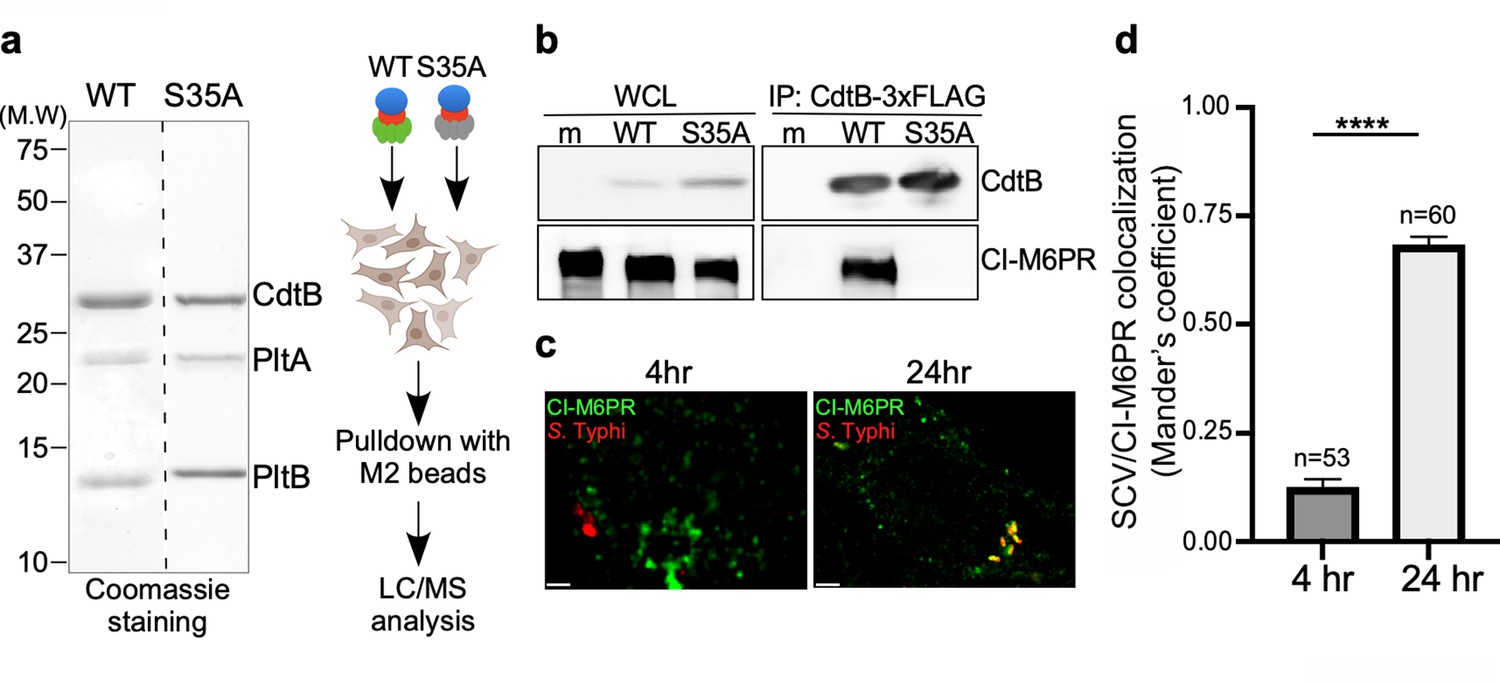
Identification of CI-M6PR as a typhoid toxin-interacting protein.
(a and b) Purified FLAG-tagged wild-type typhoid toxin or its PltBS35A mutant unable to bind glycosylated receptor proteins (a) were used in affinity purification experiments (outlined in a) to identify typhoid toxin-interacting proteins, which led to the identification of CI-M6PR (see Figure 1—source data 2). (b) The interaction between typhoid toxin and CI-M6PR was verified in Salmonella Typhi-infected cells. Henle-407 cells were infected with S. Typhi expressing FLAG-tagged CdtB for 24 hr and the interaction between typhoid toxin and endogenous CI-M6PR was probed by affinity purification with a FLAG antibody (directed to the CdtB subunit of typhoid toxin) and western blot (with antibodies to both FLAG and anti-CI-M6PR). (c and d) Co-localization of the S. Typhi-containing vacuole and CI-M6PR. Henle-407 cells were infected with S. Typhi for the indicated times and examined by immunofluorescence with differentially labeled antibodies to S. Typhi and CI-M6PR. The quantification of the co-localization is shown in (d). Values (Mander’s overlap coefficient) represent the degree of co-localization between CI-M6PR and S. Typhi and are the mean ± SEM. ****: p<0.0001. Scale bar = 5 µm. SCV: Salmonella-containing vacuole; CI-M6PR: cation-independent mannose-6-phosphate receptor. WCL: whole-cell lysates; IP: immunoprecipitation.
-
Figure 1—source data 1
Unprocessed coomassie stain of the protein gel.
- https://cdn.elifesciences.org/articles/78561/elife-78561-fig1-data1-v2.pdf
-
Figure 1—source data 2
Interacting proteins of cation-independent mannose-6-phosphate receptor (CI-M6PR) identified by immunoprecipitation-mass spectrometry (IP-MS).
- https://cdn.elifesciences.org/articles/78561/elife-78561-fig1-data2-v2.xlsx
-
Figure 1—source data 3
Unprocessed CdtB and cation-independent mannose-6-phosphate receptor (CI-M6PR) western blots.
- https://cdn.elifesciences.org/articles/78561/elife-78561-fig1-data3-v2.pdf
-
Figure 1—source data 4
Raw data of Figure 1d.
- https://cdn.elifesciences.org/articles/78561/elife-78561-fig1-data4-v2.xlsx
Figure 1—figure supplement 1
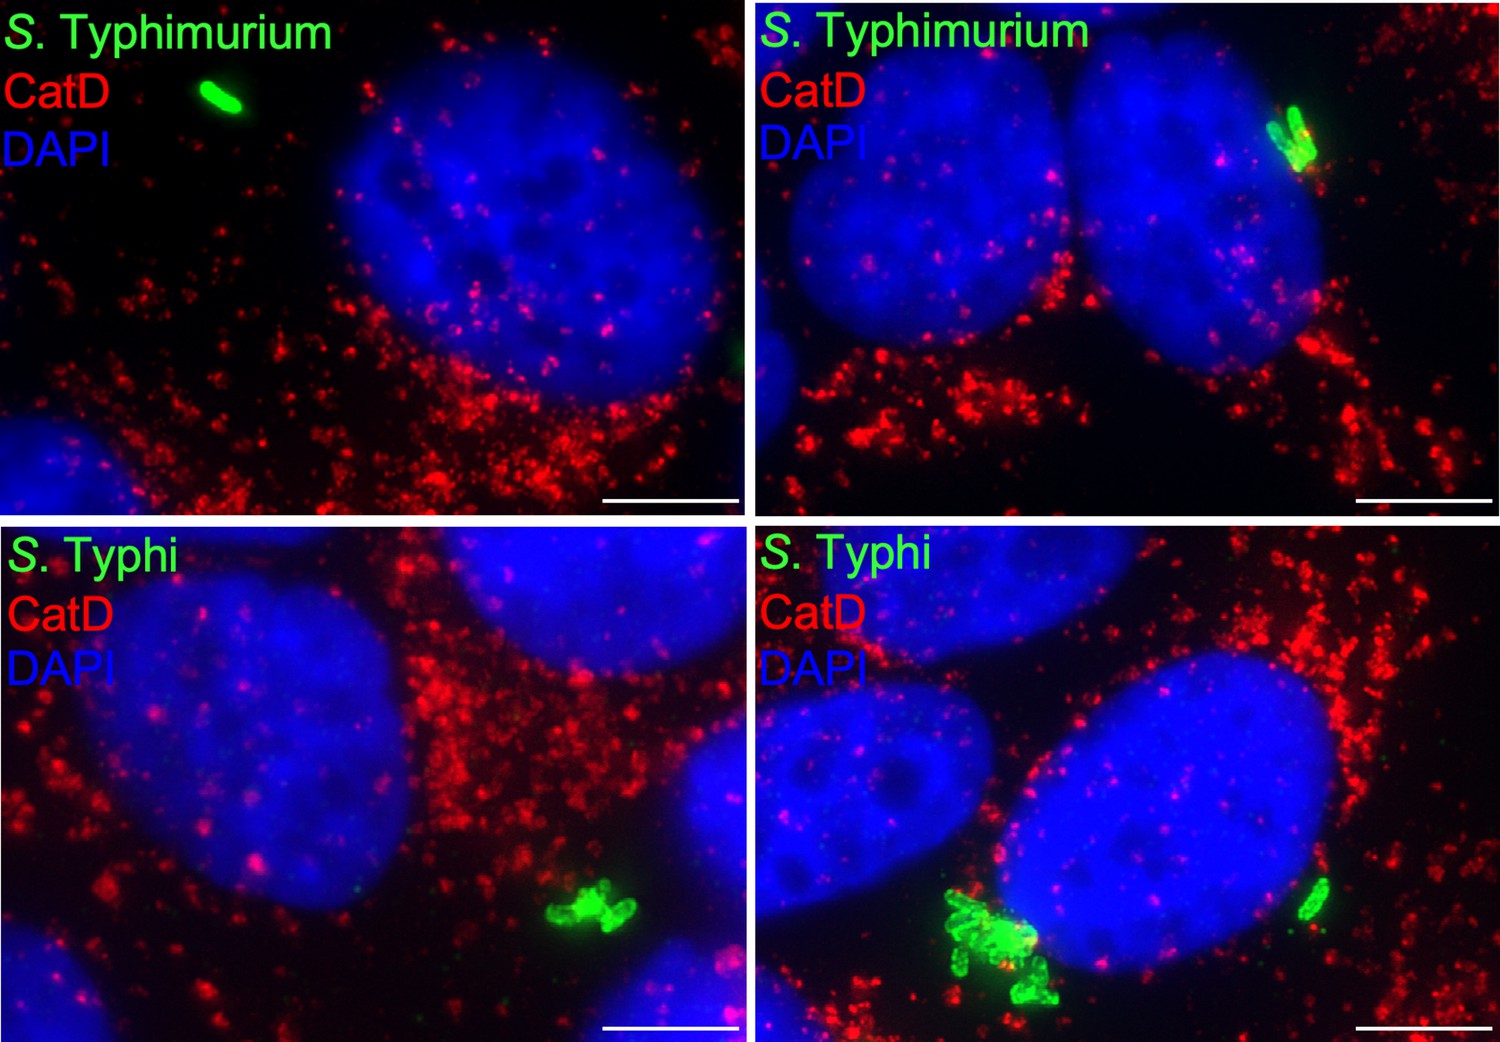
Cells infected with either Salmonella Typhimurium (top panels) or S. Typhi (lower panels) were fixed at 24 hr post infection, stained with antibodies directed to cathepsin D (CatD) (red) and Salmonella LPS (green), and examined under a fluorescence microscope for co-localization.
Bar: 5 µm.
Figure 2 with 3 supplements
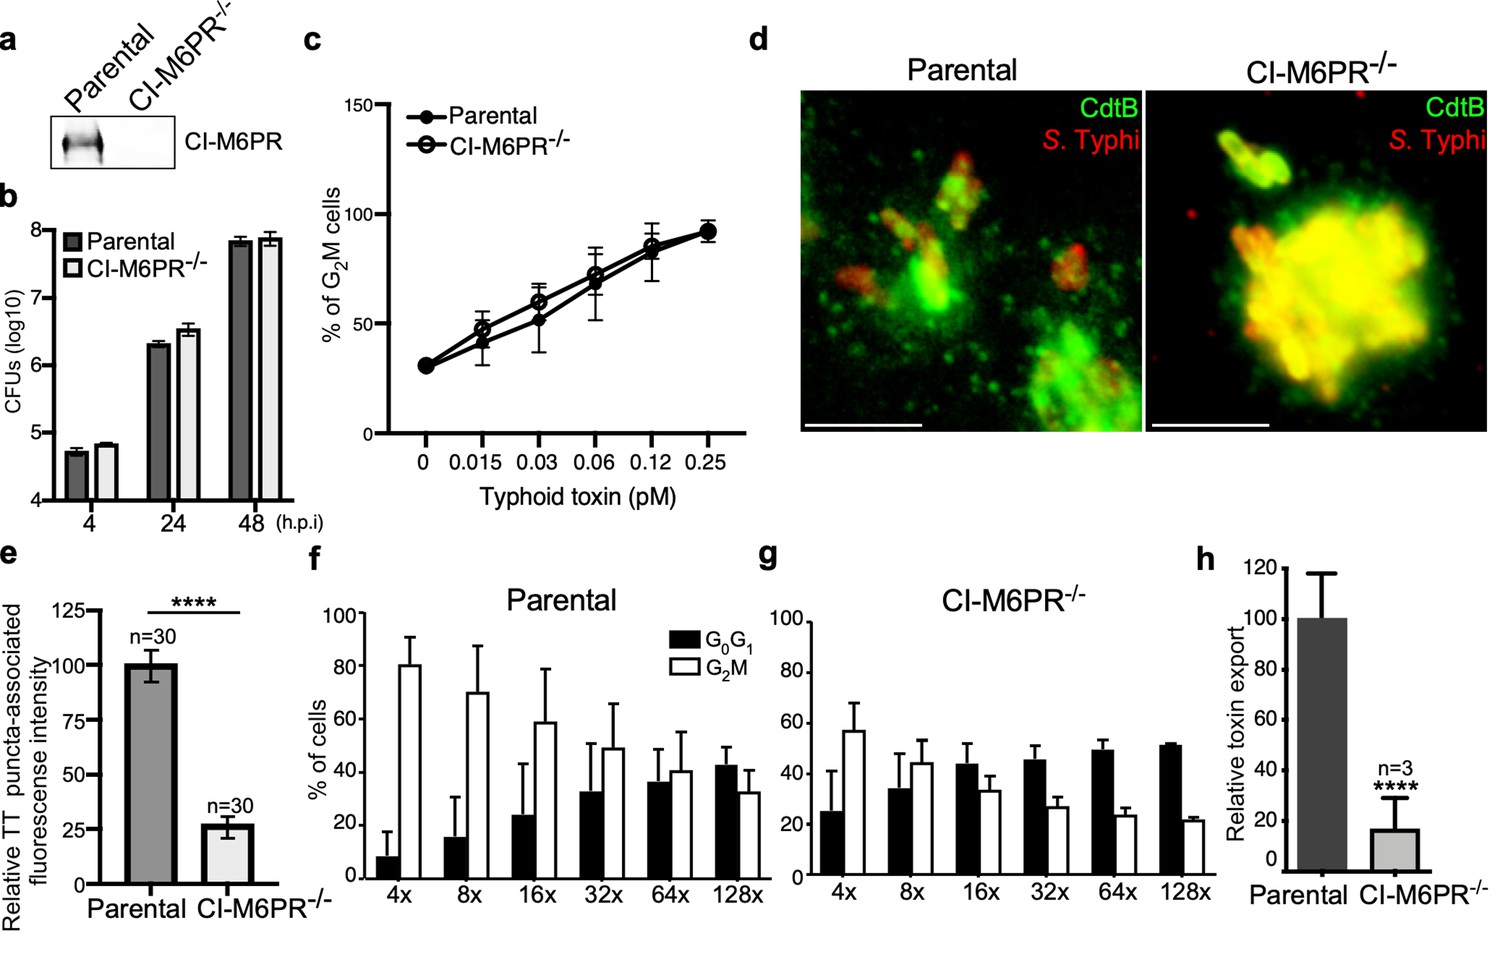
CI-M6PR is the typhoid toxin cargo receptor for packaging into vesicle transport carriers.
(a) Immunoblot analyses of CI-M6PR expression in parental HEK293T and CI-M6PR-deficient cells generated by CRISPR/Cas9 genome editing. (b) Intracellular survival of Salmonella Typhi in parental HEK293T and CI-M6PR-deficient cells. Cells were infected with S. Typhi with a multiplicity of infection of 30, and CFUs were enumerated at 4, 24, and 48 hr after infection. Values are the mean ± SD of three independent experiments. CFU = colony-forming units; SD = standard deviation. (c) Toxicity of typhoid toxin in parental HEK293T and CI-M6PR-deficient cells. Cells were treated with a serial dilution of purified typhoid toxin and the typhoid toxin intoxication was evaluated by examining the proportion of cells in G2/M as a consequence of typhoid toxin-mediated DNA damage. The data shown are the mean ± SD of three independent experiments. (d and e) Typhoid toxin transport carrier formation in parental HEK293T and CI-M6PR-deficient cells. Cells were infected with a S. Typhi strain expressing 3xFLAG epitope-tagged CdtB and stained with antibodies against the FLAG epitope (green) and S. Typhi LPS (red) (d). Scale bar, 5 μm. The quantification of typhoid toxin-associated fluorescent puncta, a measure of typhoid toxin carrier intermediates in infected cells, is shown in (e). Values represent relative fluorescence intensity and are the mean ± SEM of one of three independent experiments. ****: p<0.0001, unpaired two-sided t test. The results of two additional experiments are shown in Figure 2—figure supplement 1. (f–h) Quantification of typhoid toxin export into the infection medium. Infection media obtained from S. Typhi-infected HEK293T parental (f) or CI-M6PR-deficient cells (g) were serially diluted as indicated and applied to uninfected HEK293T cells. The cell cycle profile of treated cells was analyzed by flow cytometry, and the percentage of cells at the G2/M phase, a measure of typhoid toxin toxicity, was determined. Values are the mean ± SD of three independent experiments. The relative toxicity of the different samples, shown in (h), was measured by determining the percentage of cells in the G2/M phase from the results of the dilution of infection media experiments (shown in f and g) fitted by nonlinear regression. Values were normalized relative to those of the parental cells, which was considered to be 100 and are the mean ± SD of three independent experiments. ****: p<0.0001, unpaired two-sided t test. CI-M6PR: cation independent mannose-6-phosphate receptor; TT: typhoid toxin.
-
Figure 2—source data 1
Unprocessed CdtB western blot.
- https://cdn.elifesciences.org/articles/78561/elife-78561-fig2-data1-v2.pdf
-
Figure 2—source data 2
Raw data of Figure 2b–h.
- https://cdn.elifesciences.org/articles/78561/elife-78561-fig2-data2-v2.xlsx
Figure 2—figure supplement 1
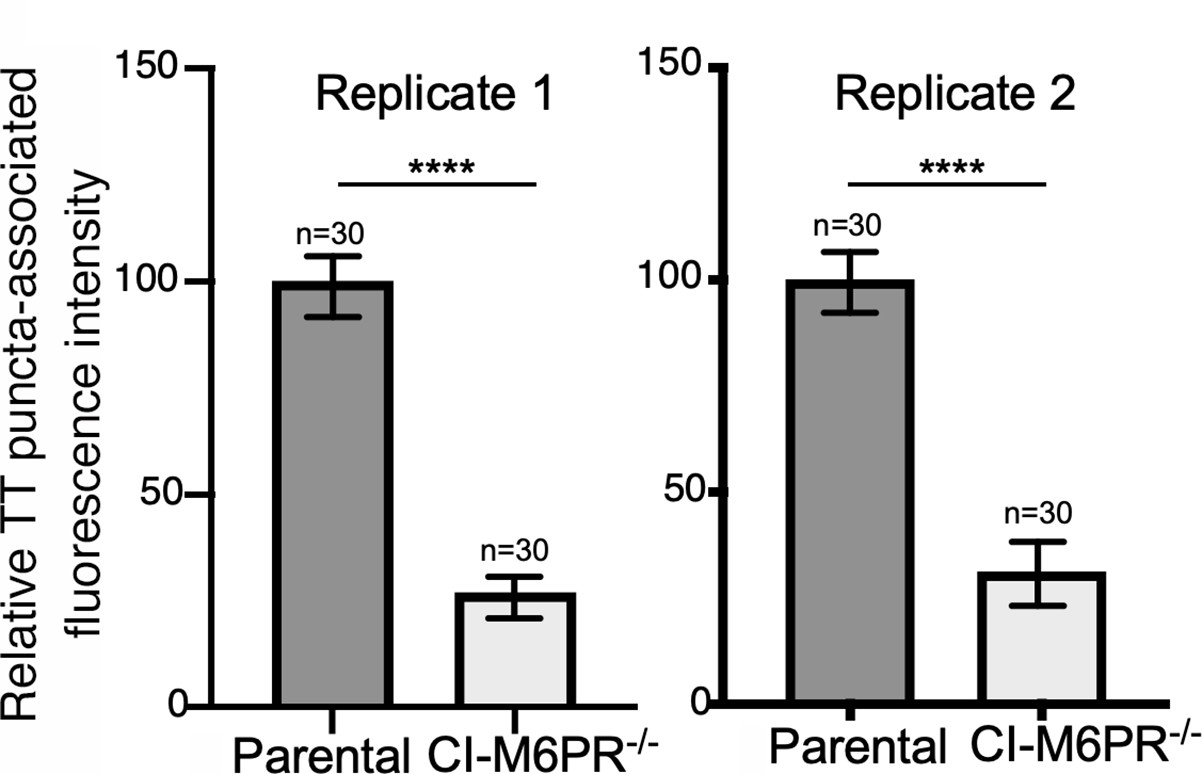
Typhoid toxin transport carrier formation in parental HEK293T and cation-independent mannose-6-phosphate receptor (CI-M6PR)-deficient cells.
Quantification of the intensity of typhoid toxin-associated fluorescent puncta associated with typhoid toxin carrier intermediates in the indicated infected cells. Values represent relative fluorescence intensity and are the mean ± SEM. ****: p<0.0001, unpaired two-sided t test. These are two replicates of the experiment shown in Figure 2d and e.
Figure 2—figure supplement 2
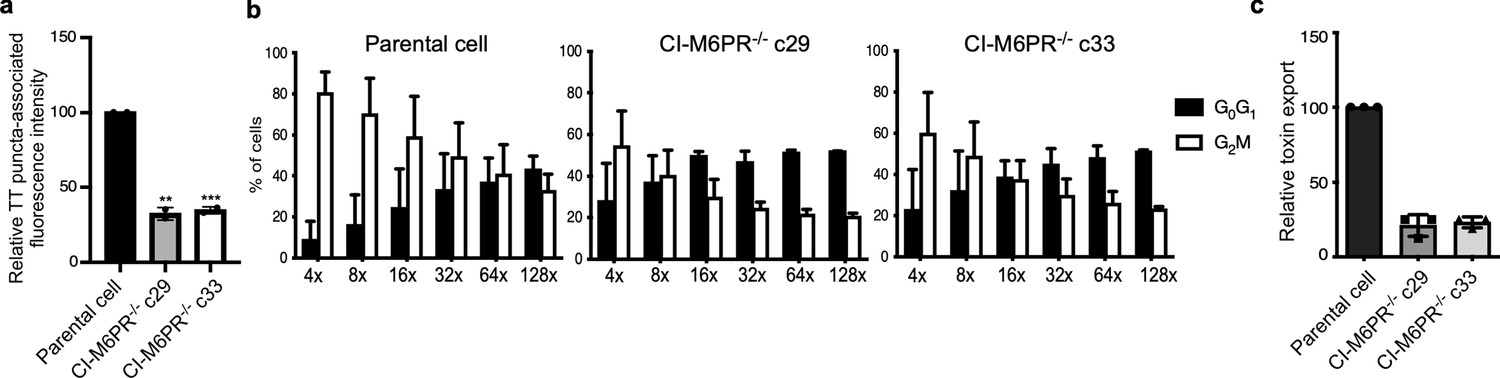
Analysis of independently isolated clones of the CRISP-Cas9-generated CI-M6PR-/- cells shown in Figure 2.
(a) Quantification of the intensity of typhoid toxin-associated fluorescent puncta associated with typhoid toxin carrier intermediates in parental HEK293T and CI-M6PR-deficient-cell clones (c29 and c33) infected with Salmonella Typhi. Values represent relative fluorescence intensity and are the mean ± SEM of two independent experiments. (b and c) Quantification of typhoid toxin export into the infection medium of parental HEK293T and CI-M6PR-deficient cell clones (c29 and c33) infected with S. Typhi. (b) Infection media were serially diluted as indicated and applied to uninfected HEK293T cells. The cell cycle profile of treated cells was analyzed by flow cytometry, and the percentage of cells at the G2/M phase, a measure of typhoid toxin toxicity, was determined. Values are the mean ± SD of three independent experiments. (c) The relative toxicity of the different samples was measured by determining the percentage of cells in the G2/M phase from the results of the dilution of infection media experiments (shown in b) fitted by nonlinear regression. Values were normalized relative to those of the parental cells, which was considered to be 100 and are the mean ± SD of three independent experiments. ****: p<0.0001, unpaired two-sided t test. CI-M6PR: cation independent mannose-6-phosphate receptor; TT: typhoid toxin.
Figure 2—figure supplement 3
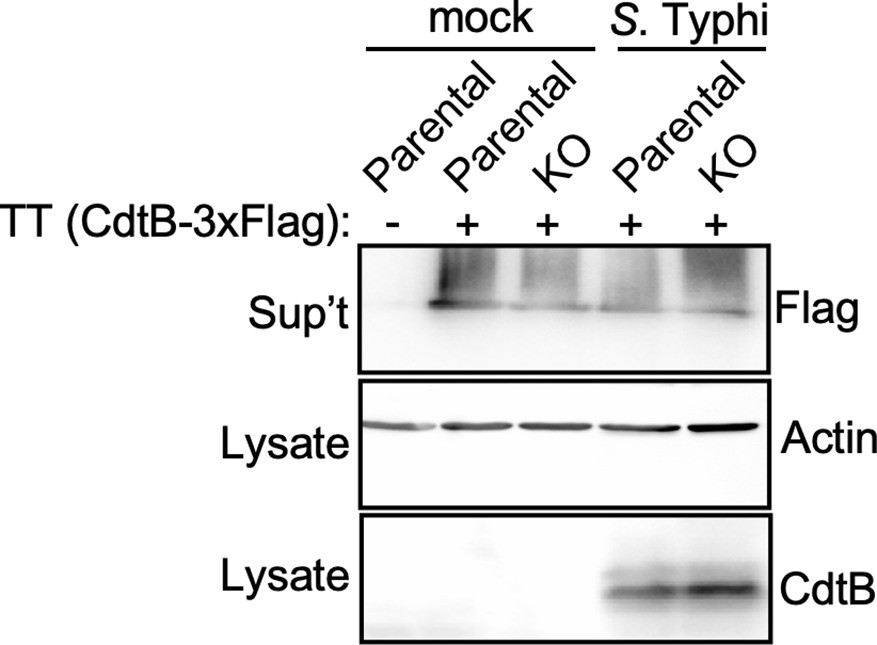
Analysis for the potential presence of proteases on the Salmonella Typhi infection media that could degrade typhoid toxin.
Parental HEK293T and cation-independent mannose-6-phosphate receptor (CI-M6PR) -/- (KO) cells were mock treated or infected with S. Typhi. Twenty-four hours after infection, infection media was collected and added to purified typhoid toxin and incubated for 60 min. Samples were then concentrated by chloroform-methanol precipitation and, along with the respective cell lysates, were examined by western blot with an antibody directed to the FLAG tag present in the CdtB subunit of typhoid toxin, and an antibody to actin as a loading control.
-
Figure 2—figure supplement 3—source data 1
Unprocessed CdtB, Flag, and actin western blots.
- https://cdn.elifesciences.org/articles/78561/elife-78561-fig2-figsupp3-data1-v2.pdf
Figure 3 with 7 supplements
Typhoid toxin export requires the specific vacuolar compartment that harbors Salmonella Typhi.
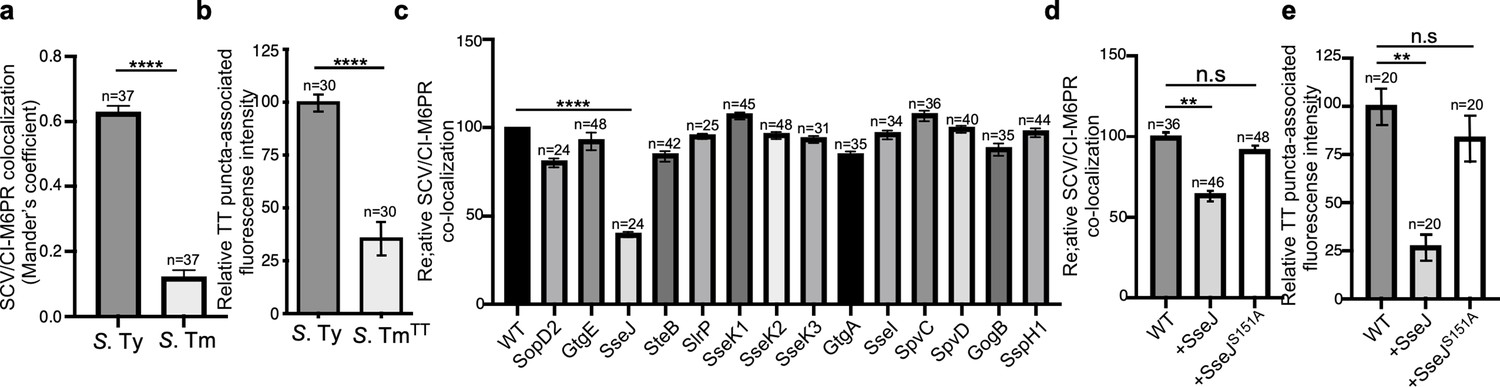
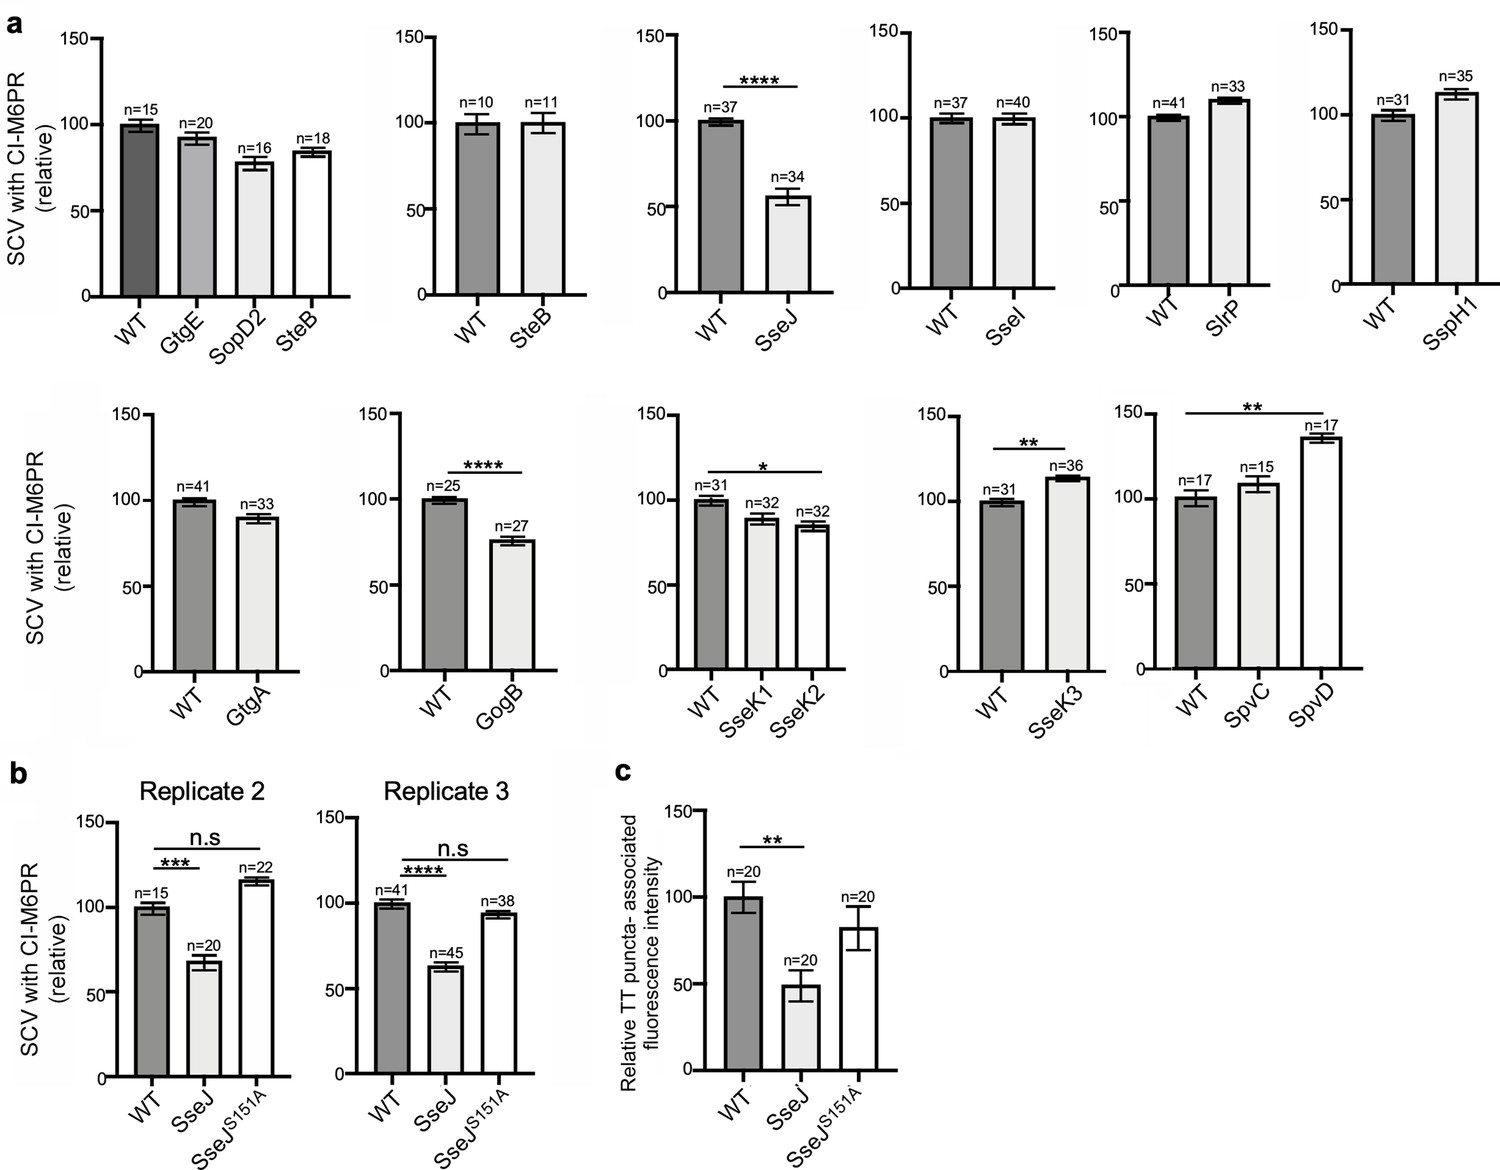
(a) Quantification of CI-M6PR recruitment to the Salmonella-containing vacuoles. Cells infected with either S. Typhi (S. Ty) or S. Typhimurium (S. Tm) were fixed at 24 hr post infection, stained with antibodies directed to CI-M6PR and Salmonella LPS, and examined under a fluorescence microscope for co-localization. Values (Mander’s overlap coefficient) represent the degree of co-localization between CI-M6PR and Salmonella-containing vacuoles and are the mean ± SEM of one representative experiment of three independent experiments. ****: p<0.0001, unpaired two-sided t test. The results of two additional experiments are shown in Figure 3—figure supplement 1. (b) Quantification of the intensity of typhoid toxin-associated fluorescent puncta associated with typhoid toxin carrier intermediates in infected cells. Cells infected with either S. Typhi or the S. Typhimurium strain expressing FLAG-tagged CdtB and 24 hr after infection, cells were fixed and stained with differentially labeled antibodies against CdtB and Salmonella LPS. Values represent relative fluorescence intensity associated with typhoid toxin carriers and are the mean ± SEM of one representative experiment. ****: p<0.0001, unpaired two-sided t test. The results of an additional independent experiment are shown in Figure 3—figure supplement 2. (c) Quantification of CI-M6PR recruitment to the Salmonella-containing vacuoles. Cells infected with S. Typhi strains expressing the indicated S. Typhimurium effector proteins were fixed at 24 hr post infection and then stained as described above. Values (Mander’s overlap coefficient) represent the relative recruitment of CI-M6PR to the SCV and are the mean ± SEM. ****: p<0.0001, two-sided Student’s t test. The results of an additional independent experiment are shown in Figure 3—figure supplement 3. (d) Quantification of relative CI-M6PR recruited to Salmonella-containing vacuoles in cells infected with S. Typhi expressing either wild-type SseJ or its catalytic mutant SseJS151A. Infected cells were fixed and then stained as indicated in (c). Values (Mander’s overlap coefficient) represent the relative recruitment of CI-M6PR to the SCV and are the mean ± SD. **: p<0.01, unpaired two-sided t test. n.s.: difference not statistically significant. The results of two additional independent experiments are shown in Figure 3—figure supplement 3b. (e) Quantification of the intensity of typhoid toxin-associated fluorescent puncta associated with typhoid toxin carrier intermediates in cells infected with S. Typhi expressing either wild-type SseJ or its catalytic mutant SseJS151A. Infected cells were fixed and then stained as described in (b). Values represent relative fluorescence intensity and are the mean ± SEM. **: p<0.01, unpaired two-sided t test. n.s.: difference not statistically significant. The results of an additional independent experiment are shown in Figure 3—figure supplement 3c. SCV: Salmonella-containing vacuole; CI-M6PR: cation-independent mannose-6-phosphate receptor; TT: typhoid toxin.
-
Figure 3—source data 1
Raw data of Figure 3a–e.
- https://cdn.elifesciences.org/articles/78561/elife-78561-fig3-data1-v2.xlsx
Figure 3—figure supplement 1
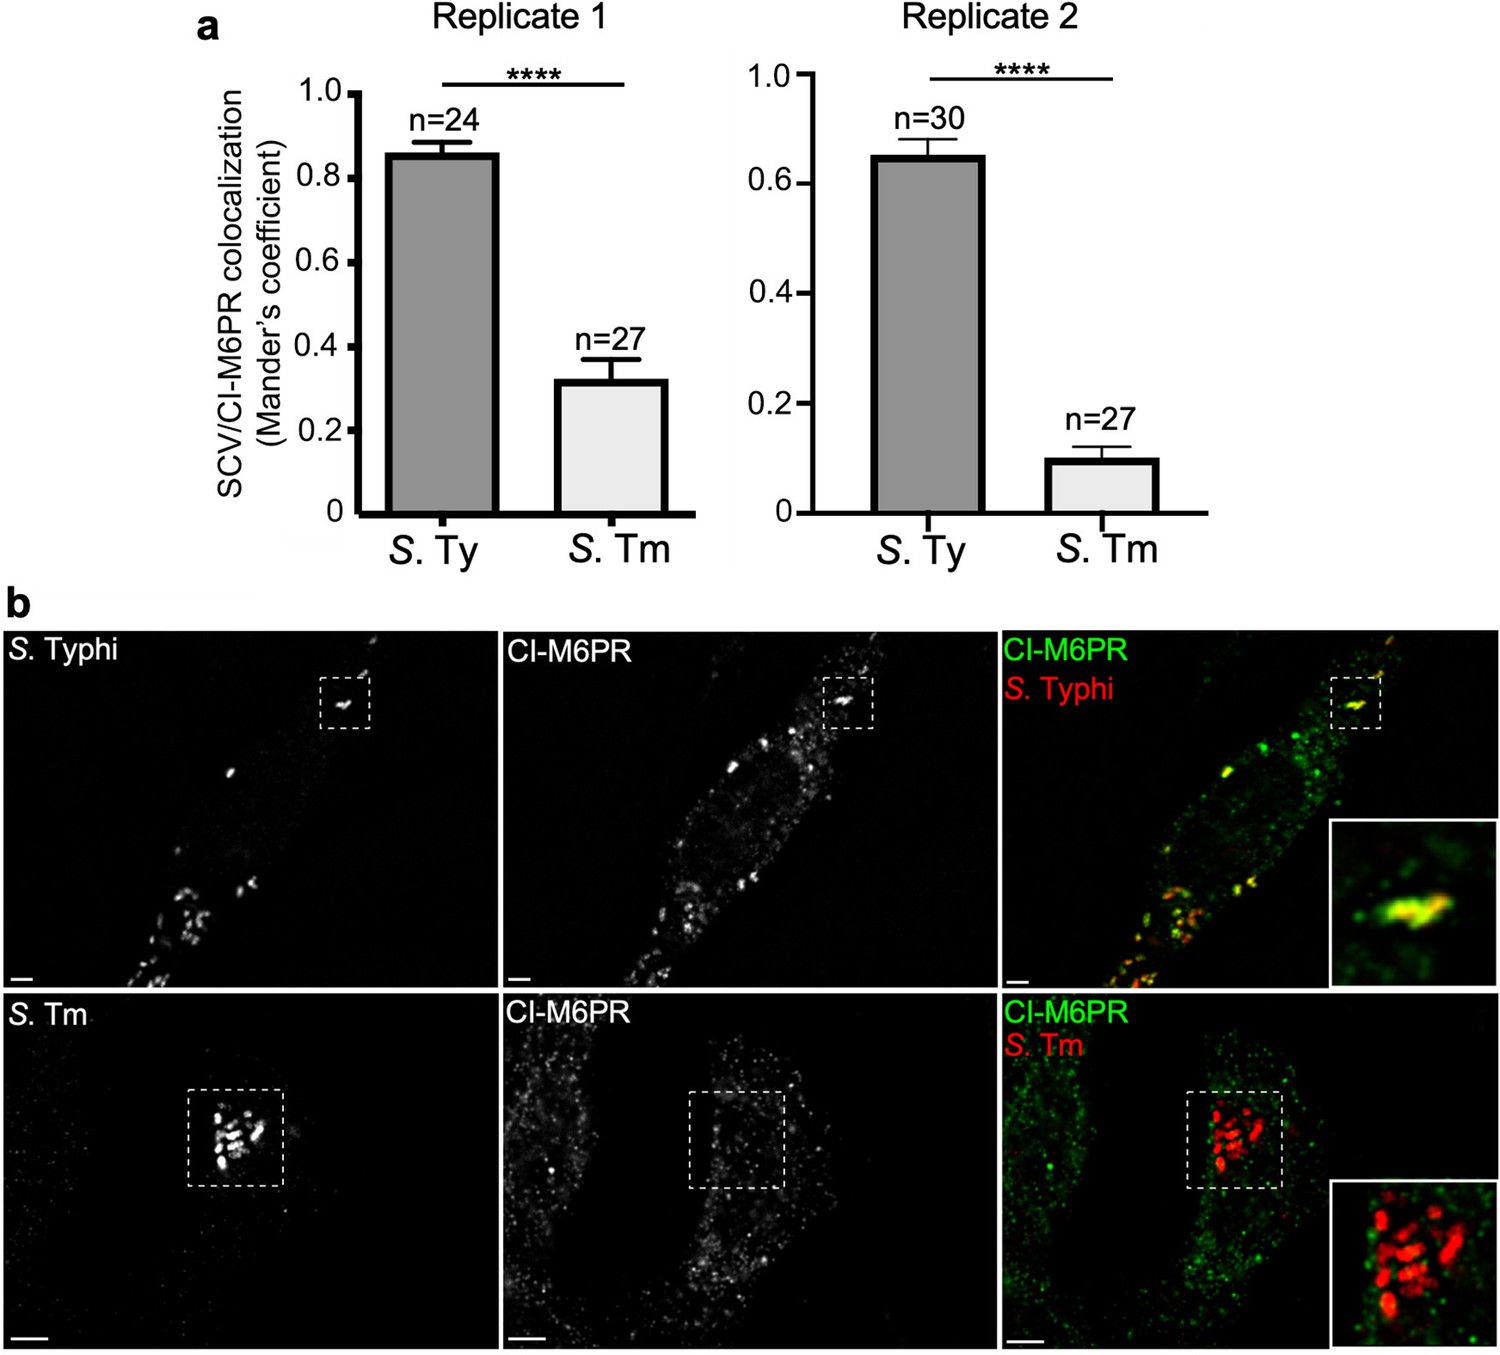
Quantification of cation-independent mannose-6-phosphate receptor (CI-M6PR) recruitment to the Salmonella Typhi or S. Typhimurium-containing vacuoles.
(a and b) Cells infected with either S. Typhi (S. Ty) or S. Typhimurium (S. Tm) were fixed at 24 hr post infection, stained with antibodies directed to CI-M6PR (green) and Salmonella LPS (red), and examined under a fluorescence microscope for co-localization. Values shown in (a) (Mander’s overlap coefficient) represent the degree of co-localization between CI-M6PR and Salmonella-containing vacuoles and are the mean ± SEM. ****: p<0.0001, unpaired two-sided t test. The results shown are from two replicates of the experiment shown in Figure 3a. Representative images are shown in (b). Scale bar, 5 µm.
Figure 3—figure supplement 2
Typhoid toxin vesicle carrier intermediates in cells infected with S. Typhimurium expressing typhoid toxin.
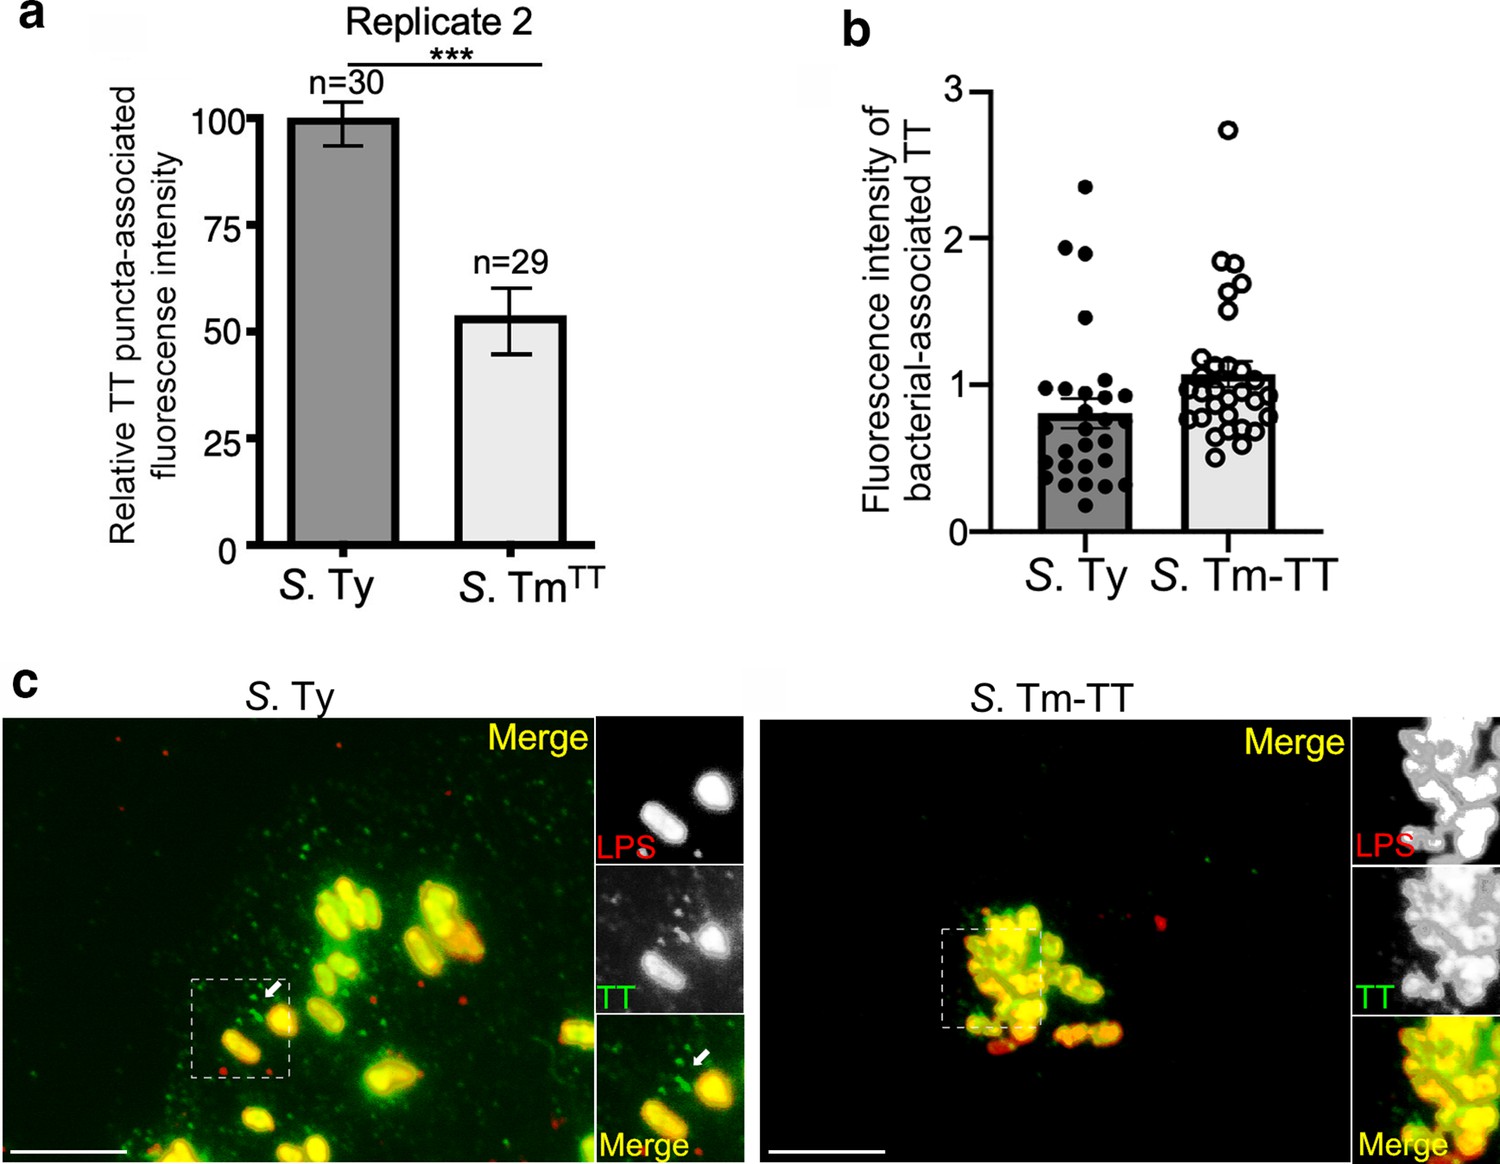
(a–c) Quantification of the intensity of typhoid toxin-associated fluorescent puncta associated with typhoid toxin carrier intermediates in cells infected with S. Typhi (S. Ty) or S. Typhimurium expressing typhoid toxin (S. Tm-TT). Values represent relative puncta- (a) or total bacteria-associated (b) fluorescence intensity. Examples of fluorescent images are shown in (c). Scale bar, 5 µm.
Figure 3—figure supplement 3
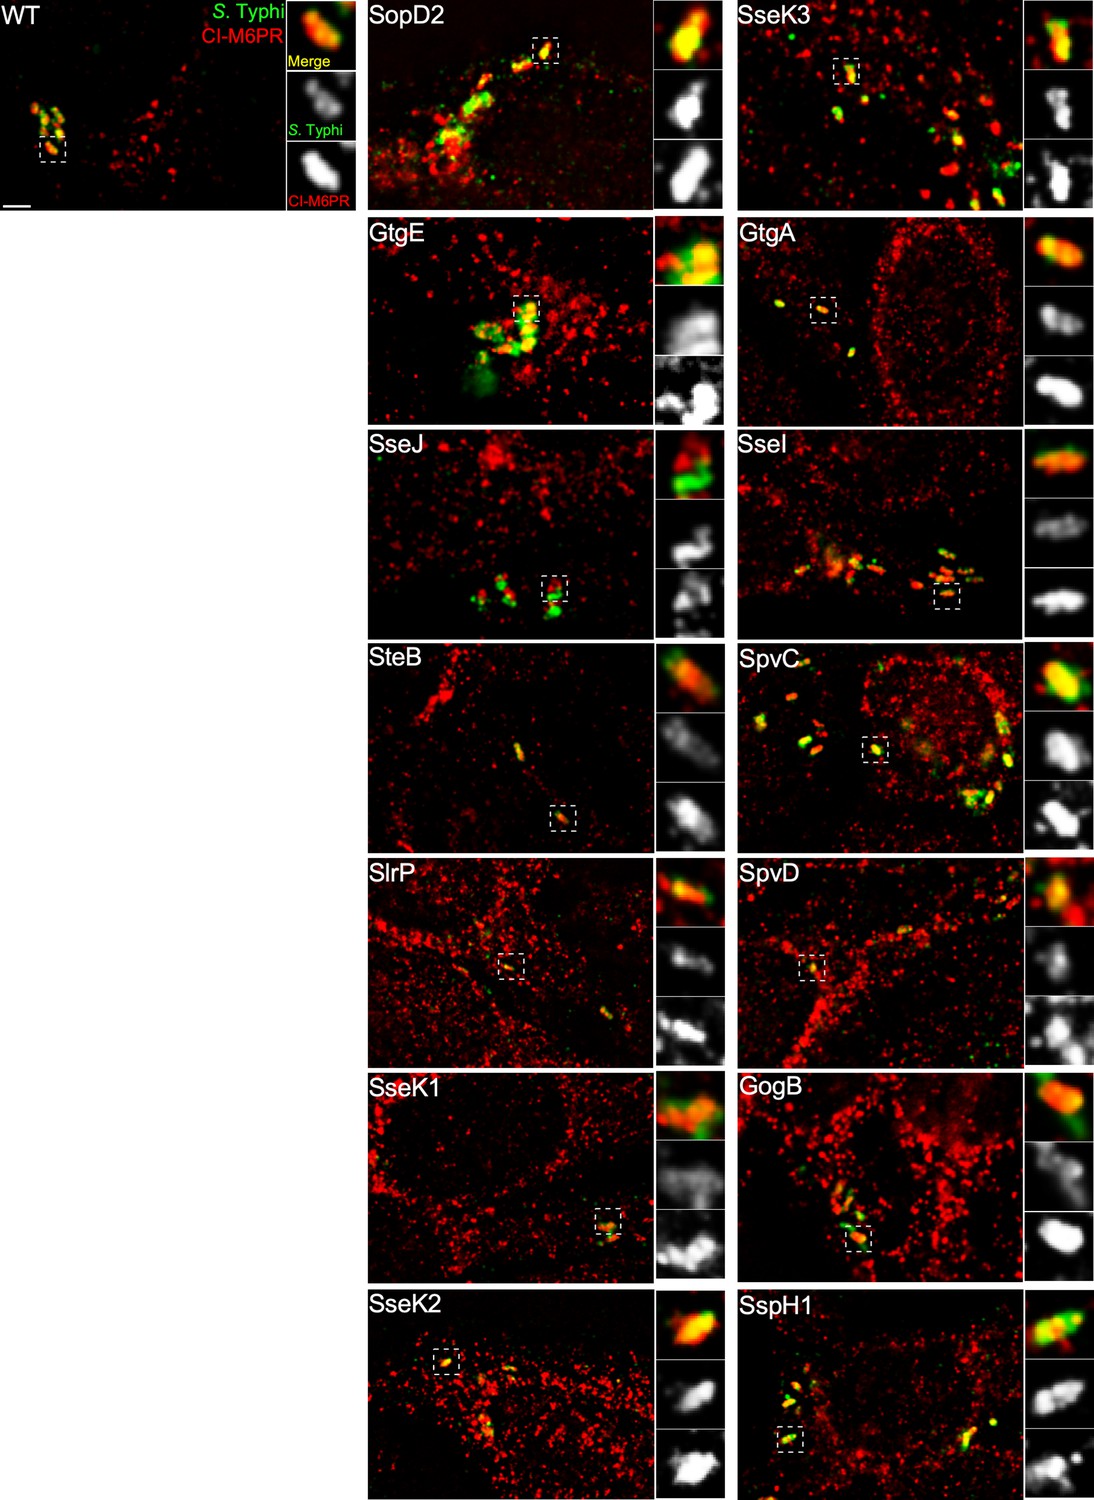
Effect of the expression of Salmonella Typhimurium effectors on S. Typhi’s ability to recruit cation-independent mannose-6-phosphate receptor (CI-M6PR) to its vacuolar compartment.
(a) Quantification of CI-M6PR recruitment to the Salmonella-containing vacuoles. Cells infected with S. Typhi strains expressing the indicated S. Typhimurium effector proteins were fixed at 24 hr post infection and then stained with antibodies against CI-M6PR and LPS. Values (Mander’s overlap coefficient) represent the relative recruitment of CI-M6PR to the SCV and are the mean ± SEM. ****: p<0.0001, **: p<0.01, *: p<0.05; unpaired two-sided t test. The results shown are from a replicate of the experiment shown in Figure 3c. (b) Quantification of relative CI-M6PR recruited to Salmonella-containing vacuoles in cells infected with S. Typhi expressing either wild-type SseJ or its catalytic mutant SseJS151A. Values are the mean ± SEM; ***: p<0.001, ****: p<0.0001; unpaired two-sided t test. n.s.: difference not statistically significant. The results shown are from a replicate of the experiment shown in Figure 3d. (c) Quantification of the intensity of typhoid toxin-associated fluorescent puncta associated with typhoid toxin carrier intermediates in cells infected with S. Typhi expressing either wild-type SseJ or its catalytic mutant SseJS151A. Values represent relative fluorescence intensity and are the mean ± SEM. **: p<0.01, unpaired two-sided t test. n.s.: difference not statistically significant. The results shown are from a replicate of the experiment shown in Figure 3e.
Figure 3—figure supplement 4
Effect of the expression of Salmonella Typhimurium effectors on the ability of S. Typhi to recruit cation-independent mannose-6-phosphate receptor (CI-M6PR) to its vacuolar compartment.
Cells infected with S. Typhi strains expressing the indicated S. Typhimurium effector proteins were fixed at 24 hr post infection and then stained with antibodies against CI-M6PR (red) and Salmonella LPS (green). WT: wild-type S. Typhi with the empty plasmid vector used to express the different effectors. Scale bar, 5 µm.
Figure 3—figure supplement 5
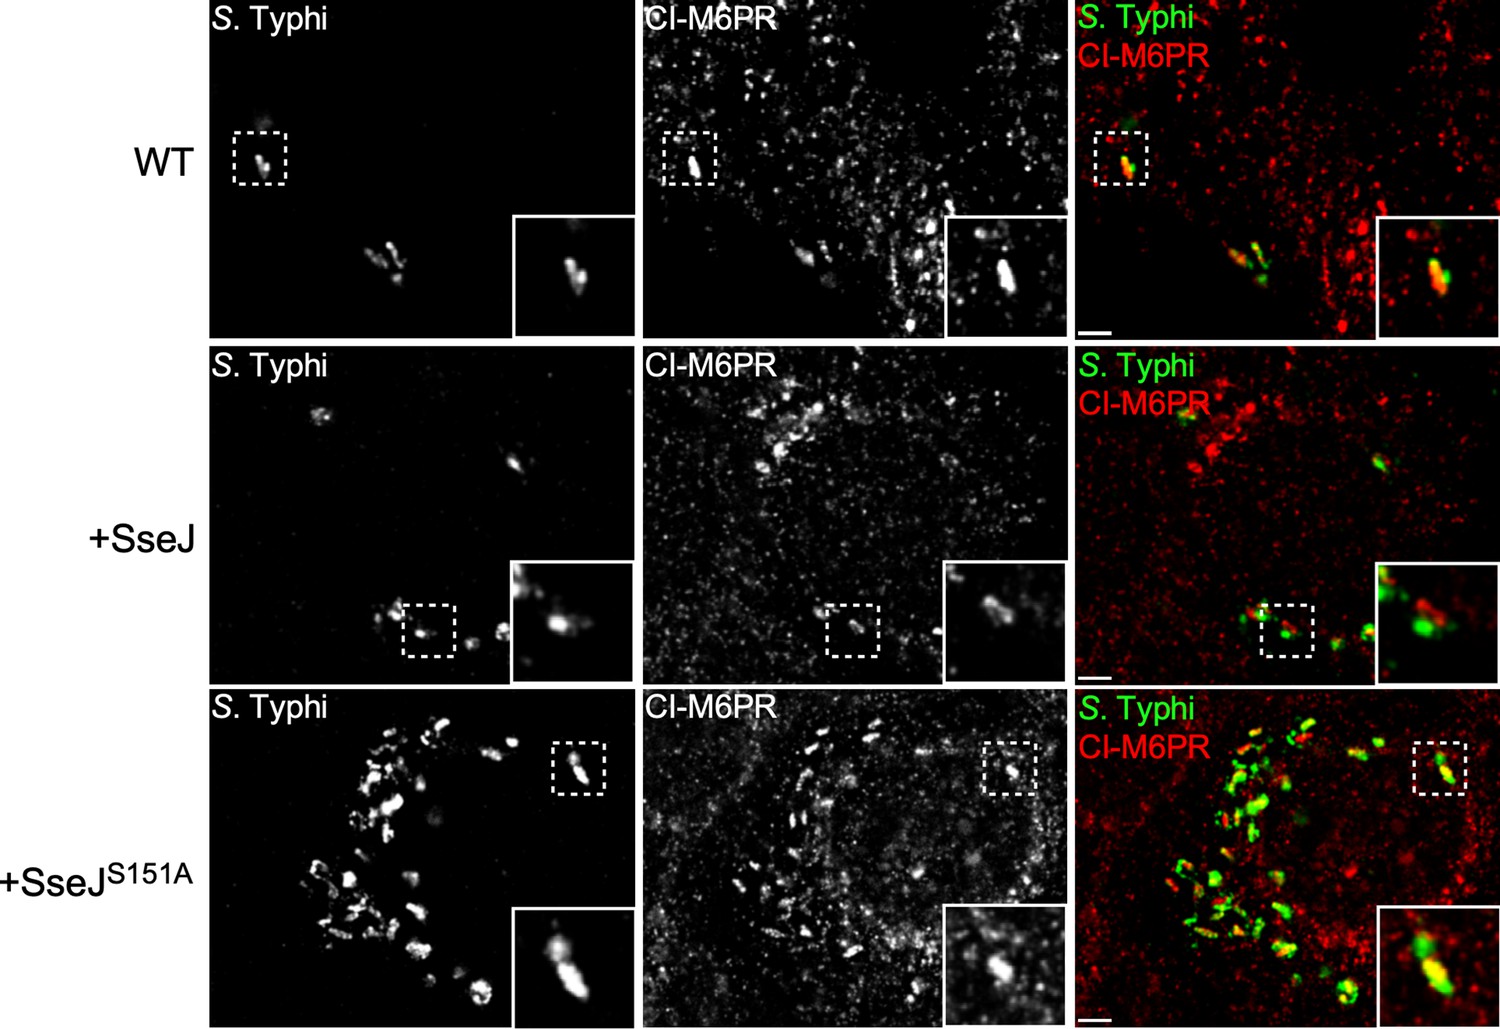
Effect of the expression of Salmonella Typhimurium SseJ or its catalytic SseJS151A mutant on S. Typhi’s ability to recruit cation-independent mannose-6-phosphate receptor (CI-M6PR) to its vacuolar compartment.
Cells infected with S. Typhi strains expressing SseJ or its catalytic mutant (SseJS151A) were fixed at 24 hr post infection and then stained with antibodies against CI-M6PR (green) and Salmonella LPS (red). WT: wild-type S. Typhi with the empty plasmid vector used to express the different effectors. Scale bar, 5 µm.
Figure 3—figure supplement 6
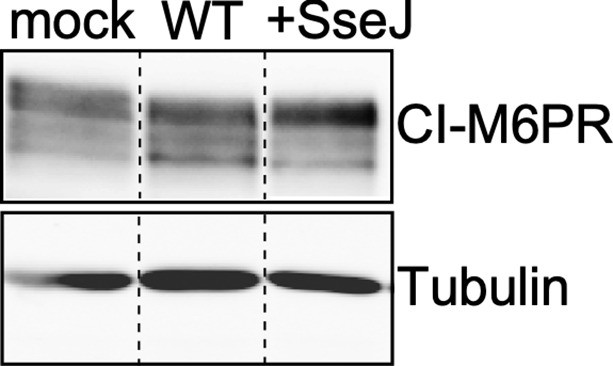
Levels of CI-M6PR in cells infected with wild-type (WT) Salmonella Typhi or the same strain expressing the S. Typhimurium effector SseJ.
Cultured cells were mock-infected or infected with wild-type S. Typhi (WT) or the same strain expressing the S. Typhimurium effector SseJ (+SseJ). Twenty-four hours after infection, cells were lysed and analyzed by western blot with antibodies directed to tubulin (as a loading control) and cation-independent mannose-6-phosphate receptor (CI-M6PR).
-
Figure 3—figure supplement 6—source data 1
Unprocessed cation-independent mannose-6-phosphate receptor (CI-M6PR) and tubulin western blots.
- https://cdn.elifesciences.org/articles/78561/elife-78561-fig3-figsupp6-data1-v2.pdf
Figure 3—figure supplement 7
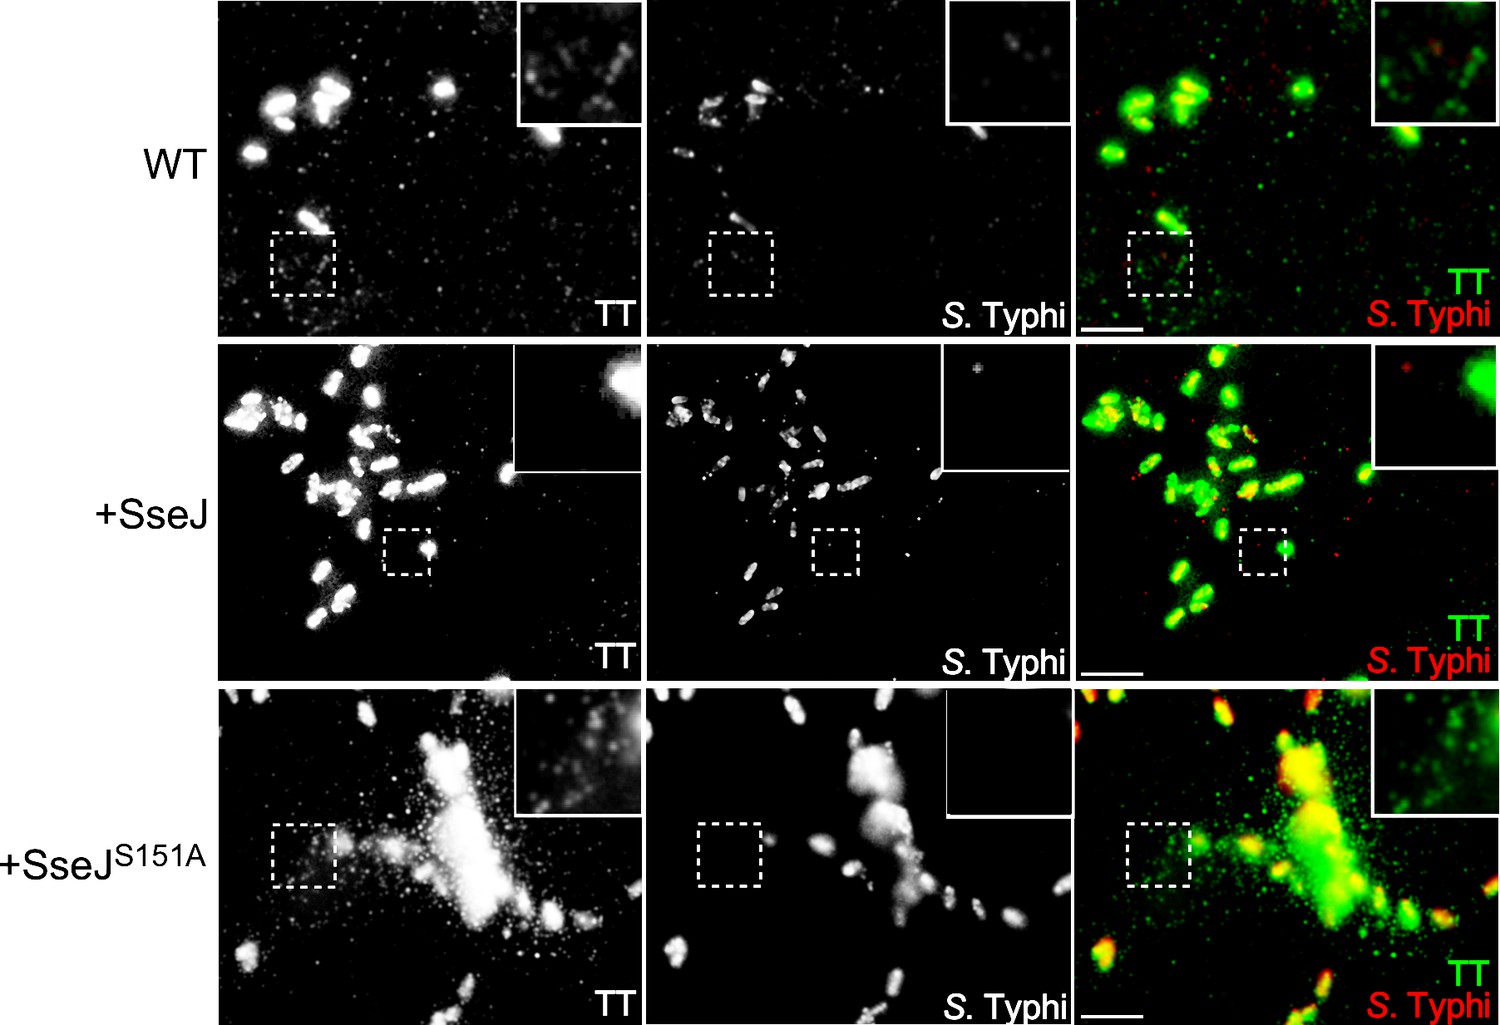
Effect of the expression of Salmonella Typhimurium SseJ or its catalytic SseJS151A mutant on the formation of typhoid toxin transport carrier intermediates.
Cultured cells were infected with wild-type S. Typhi or S. Typhi expressing the S. Typhimurium effector SseJ or its catalytic mutant SseJS151A. Twenty-four hours after infection, cells were fixed and stained with antibodies directed to a FLAG epitope (present in the CdtB subunit of typhoid toxin) (green) and Salmonella LPS (red). Highlighted areas show the presence (or absence in the case of the strain expressing SseJ) of fluorescent puncta associated with typhoid toxin transport carriers. Scale bar, 5 µm.
Figure 4 with 6 supplements

COPII drives the formation of typhoid toxin export carriers.
(a) Western blot analysis of the expression of typhoid toxin in parental HEK293T cells and derivatives deficient in SEC23B (an inner coat protein of COPII), AP4M1 (AP4 subunit Mu-1), CLTC (clathrin heavy chain), or AP3B1 (AP3 subunit Beta-1). Cells were infected with S. Typhi expressing FLAG-tagged CdtB and 24 hr after infection, cells were lysed and analyzed by western blot with antibodies directed to the FLAG epitope and the Salmonella protein RecA. (b) Quantification of the intensity of fluorescent puncta associated with typhoid toxin carrier intermediates in parental HEK293T and the indicated deficient cells. Values represent relative fluorescence intensity and are the mean ± SEM. ****: p<0.0001, unpaired two-sided t test. n.s.: difference not statistically significant. The results of an additional independent experiment are shown in Figure 4—figure supplement 2. (c and d) Quantification of typhoid toxin export into the infection medium. Infection media obtained from S. Typhi-infected HEK293T parental and the indicated deficient cells were serially diluted as indicated and applied to uninfected HEK293T cells. The cell cycle profile of treated cells was analyzed by flow cytometry, and the percentage of cells in the G2/M phase, a measure of typhoid toxin toxicity, was determined. Values are the mean ± SD of three independent experiments. The relative toxicity of the different samples, shown in (d), was measured by determining the percentage of cells in the G2/M phase from the results of the dilution of infection media experiments (shown in c) fitted by nonlinear regression. Values were normalized relative to those of the parental cells, which was considered to be 100 and are the mean ± SD of three independent experiments. ****: p<0.0001, unpaired two-sided t test. (e) Quantification of the intensity of fluorescent puncta associated with typhoid toxin carrier intermediates in parental HEK293T and Sar1B-deficient cells. Values represent relative fluorescence intensity and are the mean ± SEM. *: p<0.05, unpaired two-sided t test. The results of an additional independent experiment are shown in Figure 4—figure supplement 2. (f) Western blot analysis of the expression of typhoid toxin in parental HEK293T and Sar1B-deficient cells. Cells were infected with S. Typhi expressing FLAG-tagged CdtB and the levels of typhoid toxin were evaluated by western blot 24 hr after infection as indicated in (a). (g and h) Quantification of typhoid toxin export into the infection medium of parental HEK293T and Sar1B-deficient cells after infection with S. Typhi. Values are the mean ± SD of three independent experiments (g). The relative toxin export is shown in (h) and was determined as described in (c) and (d). Values are the mean ± SD of three independent experiments. **: p<0.01, unpaired two-sided t test. (i) Western blot analysis of the interaction of typhoid toxin with Sec23A. HEK293T cells transiently transfected with a plasmid-expressing GFP-tagged Sec23A were infected with either wild-type S. Typhi (multiplicity of infection [MOI] = 30) or its isogenic spiA mutant (MOI = 90), which is defective in its SPI-2-encoded type III secretion system. Twenty-four hours after infection, cells were lysed and the interaction between typhoid toxin and Sec23A was probed by immunoprecipitation with anti-FLAG M2 affinity gel and immunoblotting with anti-CdtB and anti-GFP antibodies. (j) Western blot analysis of the interaction between typhoid toxin and Sec23A in parental HEK293T and CI-M6PR-deficient cells. Parental HEK293T and CI-M6PR-deficient cells were transiently transfected with a plasmid-expressing GFP-tagged Sec23A followed by infection with wild-type S. Typhi as described in (i). Cells were lysed at 24 hr post infection and subjected to immunoprecipitation with an anti-FLAG M2 antibody, and immunoblotting with anti-CdtB and anti-GFP antibodies. CI-M6PR: cation-independent mannose-6-phosphate receptor; WCL: whole-cell lysates; IP: immunoprecipitates; KO: knockout; TT: typhoid toxin.
-
Figure 4—source data 1
Unprocessed CdtB and RecA western blots.
- https://cdn.elifesciences.org/articles/78561/elife-78561-fig4-data1-v2.pdf
-
Figure 4—source data 2
Raw data of Figure 4b–e and g–h.
- https://cdn.elifesciences.org/articles/78561/elife-78561-fig4-data2-v2.xlsx
-
Figure 4—source data 3
Unprocessed CdtB and Sec23 western blots.
- https://cdn.elifesciences.org/articles/78561/elife-78561-fig4-data3-v2.pdf
-
Figure 4—source data 4
Unprocessed CdtB and Sec23 western blots.
- https://cdn.elifesciences.org/articles/78561/elife-78561-fig4-data4-v2.pdf
Figure 4—figure supplement 1
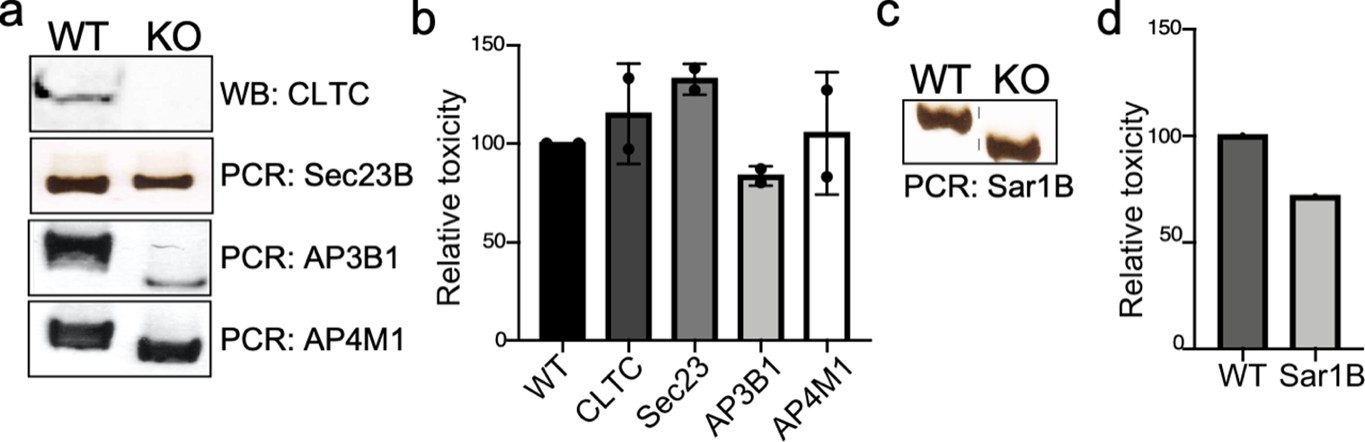
Genotypic and phenotypic characterization of CRISPR/Cas9-generated deficient cell lines.
(a and c) Genomic DNA or whole-cell lysates were obtained from the parental HEK293T and CRISPR/Cas9-edited cell lines and analyzed by western blot with specific antibodies or by PCR. (b and d) The ability of typhoid toxin to intoxicate the edited cell lines was also assessed as indicated in Materials and methods. Cells were treated with a serial dilution of purified typhoid toxin and the typhoid toxin intoxication was evaluated by examining the proportion of cells in G2/M as a consequence of typhoid toxin-mediated DNA damage. The data shown are the mean ± SD of two independent measurements and have been standardized considering the values for the parental cell (wild type [WT]) to be 100.
-
Figure 4—figure supplement 1—source data 1
Unprocessed western blot and DNA gels of genotyping of indicated cell lines.
- https://cdn.elifesciences.org/articles/78561/elife-78561-fig4-figsupp1-data1-v2.pdf
-
Figure 4—figure supplement 1—source data 2
Unprocessed DNA gels of genotyping of indicated cell lines.
- https://cdn.elifesciences.org/articles/78561/elife-78561-fig4-figsupp1-data2-v2.pdf
Figure 4—figure supplement 2
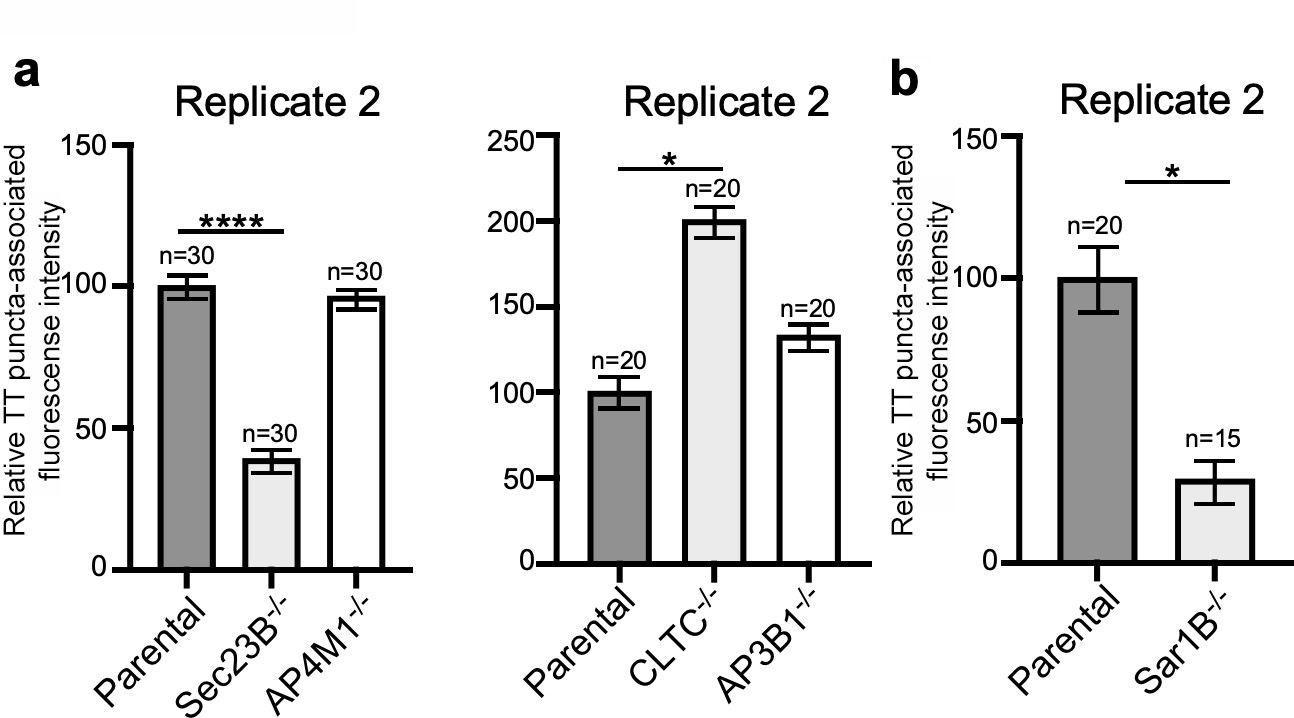
Independent experiments of Figure 4b and e.
(a and b) Quantification of the intensity of fluorescent puncta associated with typhoid toxin carrier intermediates in parental HEK293T and the indicated deficient cells. Values represent relative fluorescence intensity and are the mean ± SEM. ****: p<0.0001, unpaired two-sided t test. n.s: difference not statistically significant. The results shown are from replicates of the experiments shown in Figure 4b and e.
Figure 4—figure supplement 3
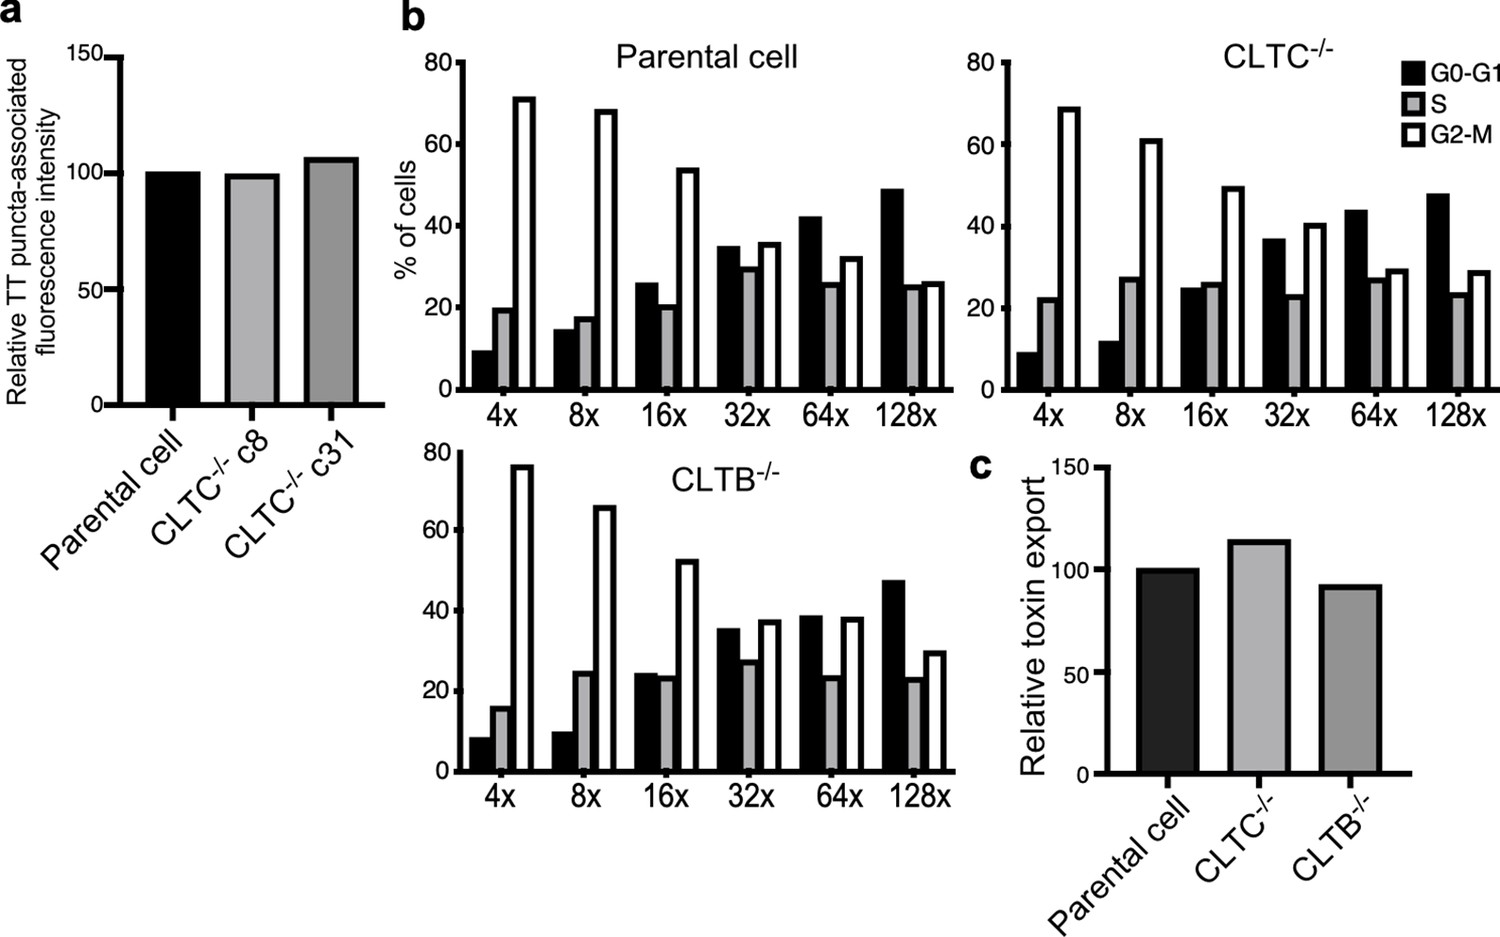
Analysis of independent clones of the CRISPR-Cas9-generated CLTB- and CLTC-deficient cells shown in Figure 4.
(a) Quantification of the intensity of fluorescent puncta associated with typhoid toxin carrier intermediates in parental HEK293T and CLTC-deficient-cell clones (c8 and c31) infected with Salmonella Typhi. Values represent relative fluorescence intensity and are the mean ± SEM. (b and c) Quantification of typhoid toxin export into the infection medium of parental HEK293T and CLTC (clone c8)- or CLTB (clone c2)-deficient-cells infected with S. Typhi. (b) Infection media were serially diluted as indicated and applied to uninfected HEK293T cells. The cell cycle profile of treated cells was analyzed by flow cytometry, and the percentage of cells at the G2/M phase, a measure of typhoid toxin toxicity, was determined. (c) Relative toxin export was determined by measuring the relative toxicity of the different samples, which was determined by determining the percentage of cells in the G2/M phase from the results of the dilution of infection media experiments (shown in b) fitted by nonlinear regression. Values were normalized relative to those of the parental cells, which was considered to be 100.
Figure 4—figure supplement 4
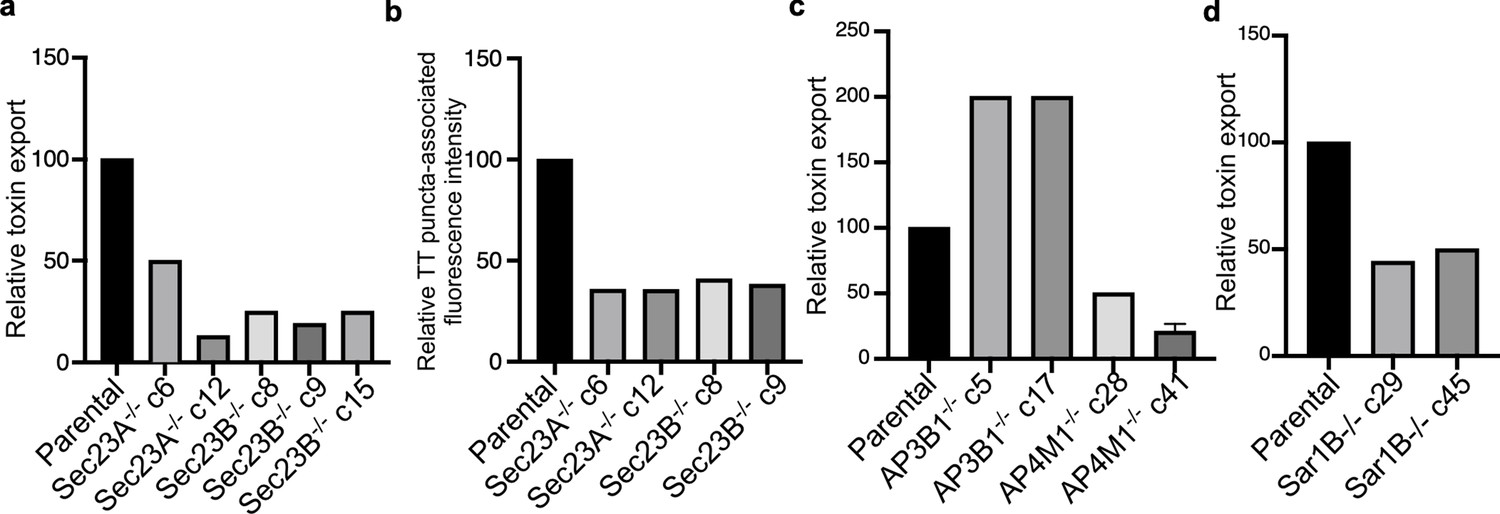
Analysis of independent clones of the CRISP-Cas9-generated Sec23A-, Sec23B-, AP3B1-, AP4M1-, and Sar1B-deficient cells shown in Figure 4.
Toxin export (a,c, and d) and typhoid toxin-associated fluorescent puncta (b) in parental HEK293T and the indicated CRISP-Cas9-generated deficient clones were measured as indicated in Figure 4. Values in (a), (c), and (d) represent the relative toxicity of the different samples measured by determining the percentage of cells in the G2/M phase from the results of dilution of infection media experiments fitted by nonlinear regression; they were normalized relative to those of the parental cells, which was considered to be 100. Values in (b) represent relative fluorescence intensity normalized relative to those of the parental cells, which was considered to be 100.
Figure 4—figure supplement 5
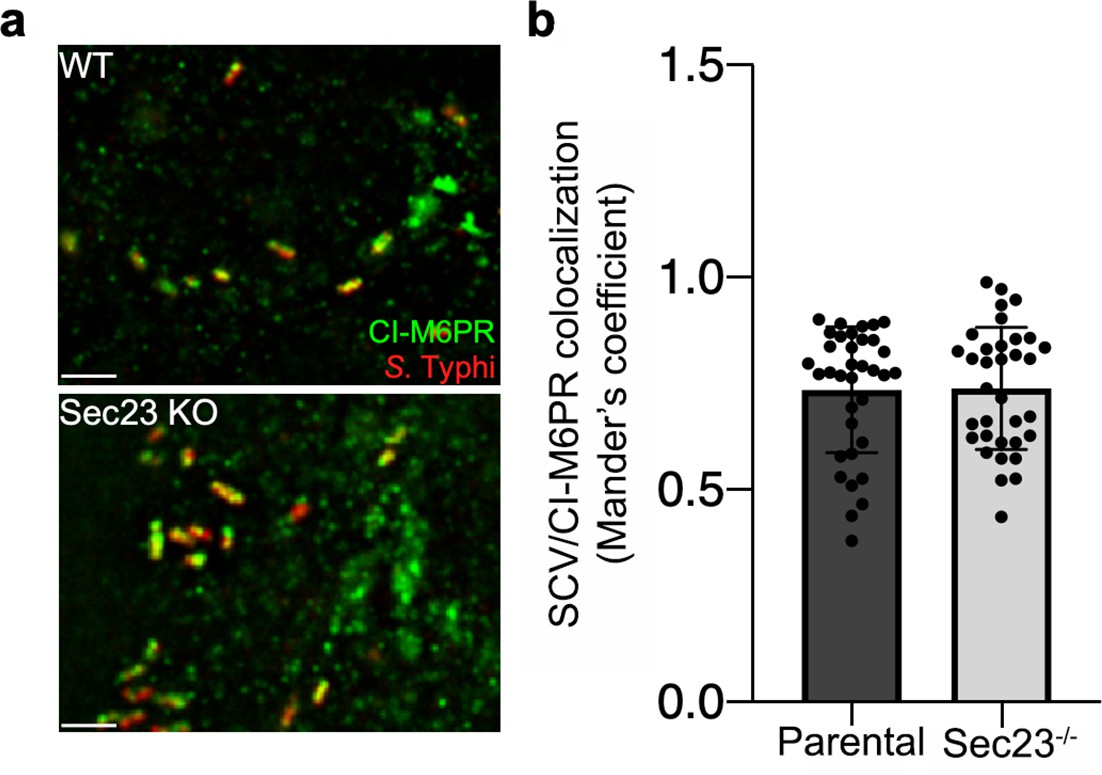
Co-localization of the Salmonella Typhi-containing vacuole and cation-independent mannose-6-phosphate receptor (CI-M6PR) in Sec23B-defficient cells.
(a and b) Parental HECK293T or Sec23B-deficient cells were infected with S. Typhi for 24 hr and examined by immunofluorescence with antibodies to S. Typhi (red) and CI-M6PR (green). The quantification of the co-localization is shown in (b). Values (Mander’s overlap coefficient) represent the degree of co-localization between CI-M6PR and S. Typhi and are the mean ± SEM. Scale bar, 5 µm.
-
Figure 4—figure supplement 5—source data 1
Raw data of Figure 4—figure supplement 5b.
- https://cdn.elifesciences.org/articles/78561/elife-78561-fig4-figsupp5-data1-v2.xlsx
Figure 4—figure supplement 6
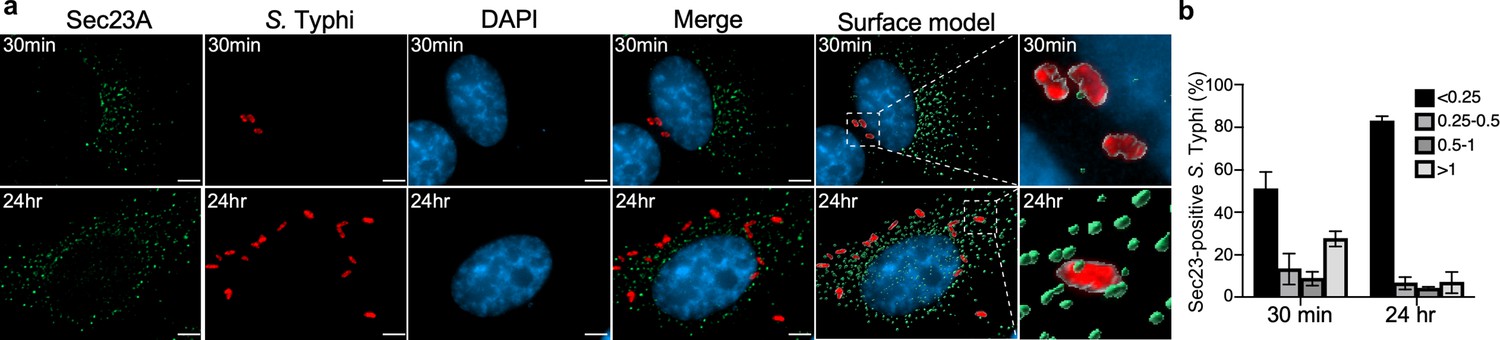
Co-localization of the Salmonella Typhi-containing vacuole and Sec23A.
(a) Henle-407 cells were transiently transfected with a plasmid-expressing GFP-tagged Sec23A and infected with S. Typhi for 30 min or 24 hr. At indicated time points, culture cells were fixed with paraformaldehyde and examined by immunofluorescence with antibodies to S. Typhi (red) and Sec23A (green). Fluorescence microscopy images were analyzed by ClearView-CPU and Surface modes in Imaris to create 3D objects for measuring distances between S. Typhi-containing vacuoles and Sec23A. The distance between the fluorophores of S. Typhi-containing vacuole and Sec23A shown in (b) was distributed into four groups (below 0.25; 0.25–0.5; 0.5–1; and above 1 µm length). Scale bar, 5 µm.
Figure 5 with 3 supplements
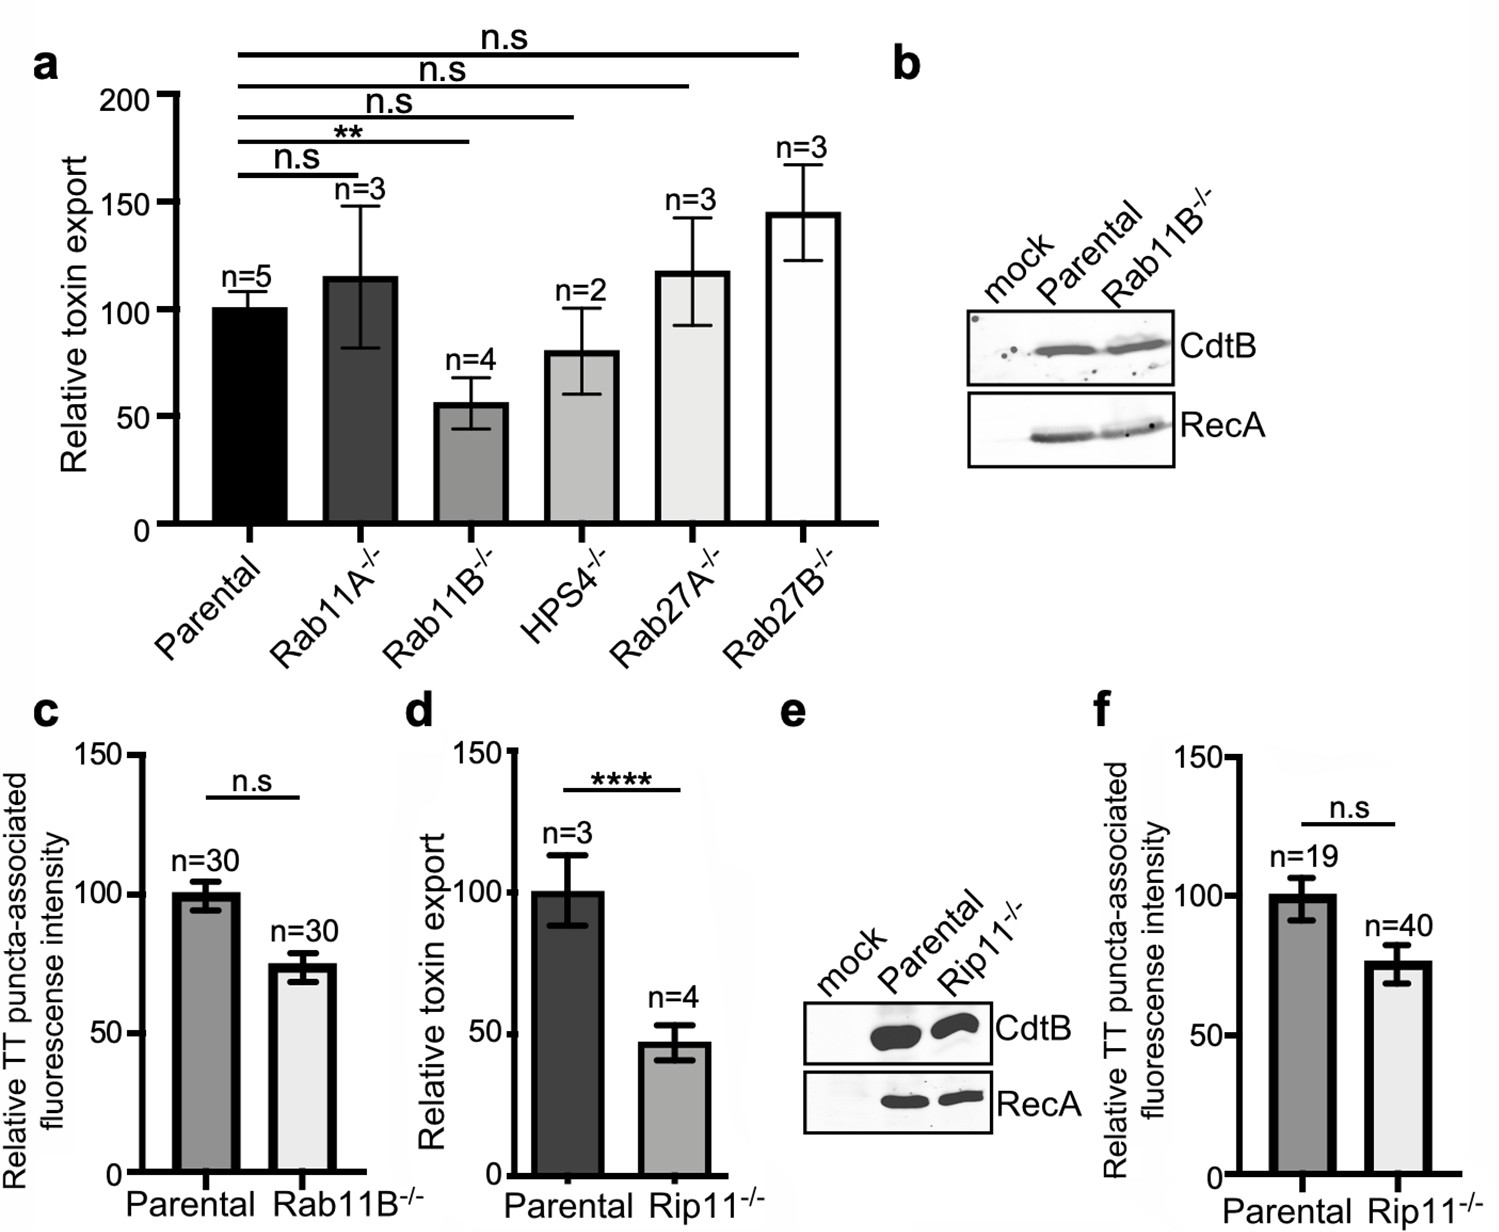
Rab11B and Rip11 regulate the transport of typhoid toxin vesicle carriers.
(a) Typhoid toxin export into the infection medium. The quantification of the levels of typhoid toxin in the infection media was carried out by serial dilutions as indicated in the legend for Figure 2. Infection media obtained from Salmonella Typhi-infected HEK293T parental and the indicated deficient cells were serially diluted and applied to uninfected HEK293T cells. The cell cycle profile of treated cells was analyzed by flow cytometry, and the percentage of cells in the G2/M phase, a measure of typhoid toxin toxicity, was determined. The relative toxicity was determined by the percentage of cells at the G2/M phase after treatment with the different of the infection media fitted by nonlinear regression. Values were normalized relative to wild-type cells, which was considered to be 100 and are the mean ± SD of three independent experiments. **: p<0.01, unpaired two-sided t test. n.sd: differences not statistically significant. (b) Western blot analysis of the expression of typhoid toxin in parental HEK293T and Rab11B-deficient cells. Cells were infected with S. Typhi expressing FLAG-tagged CdtB, lysed 24 hr after infection and analyzed by western blot with antibodies directed to the FLAG epitope and the Salmonella protein RecA. (c and f) Quantification of the intensity of fluorescent puncta associated with typhoid toxin carrier intermediates in parental HEK293T and Rab11B- (c) or Rip11-deficient (f) cells. Values represent relative fluorescence intensity and are the mean ± SEM. n.s: differences not statistically significant. The results of an additional independent experiment are shown in Figure 5—figure supplement 2. (e) Western blot analysis of the expression of typhoid toxin in parental HEK293T and Rip11-deficient cells carried out as indicated in (b). (d) Relative typhoid toxin export in Rip11-deficient cells. Relative toxin export was determined as indicated in (a). Values were normalized relative to parental cells, which was considered to be 100, and are the mean ± SEM. ****: p<0.0001, unpaired two-sided t test. TT: typhoid toxin.
-
Figure 5—source data 1
Raw data of Figure 5a, c–d and f.
- https://cdn.elifesciences.org/articles/78561/elife-78561-fig5-data1-v2.xlsx
-
Figure 5—source data 2
Unprocessed CdtB and RecA western blots.
- https://cdn.elifesciences.org/articles/78561/elife-78561-fig5-data2-v2.pdf
-
Figure 5—source data 3
Unprocessed CdtB and RecA western blots.
- https://cdn.elifesciences.org/articles/78561/elife-78561-fig5-data3-v2.pdf
Figure 5—figure supplement 1
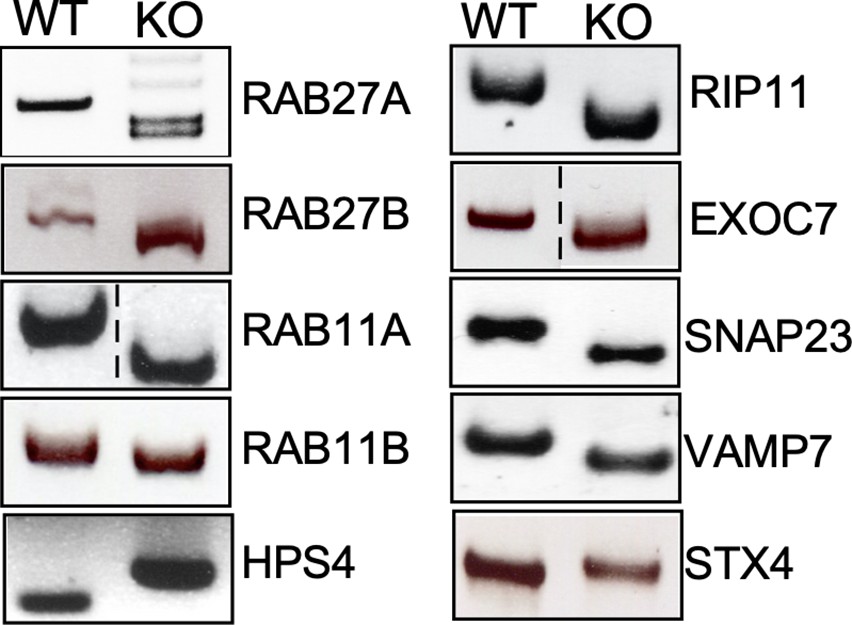
Genotyping of the indicated CRISPR/Cas9-edited cell lines.
Genomic DNA was obtained from the parental HEK293T and CRISPR/Cas9-edited cell lines and analyzed by PCR.
-
Figure 5—figure supplement 1—source data 1
Unprocessed DNA gels of genotyping of indicated cell lines.
- https://cdn.elifesciences.org/articles/78561/elife-78561-fig5-figsupp1-data1-v2.pdf
-
Figure 5—figure supplement 1—source data 2
Unprocessed DNA gels of genotyping of indicated cell lines.
- https://cdn.elifesciences.org/articles/78561/elife-78561-fig5-figsupp1-data2-v2.pdf
Figure 5—figure supplement 2
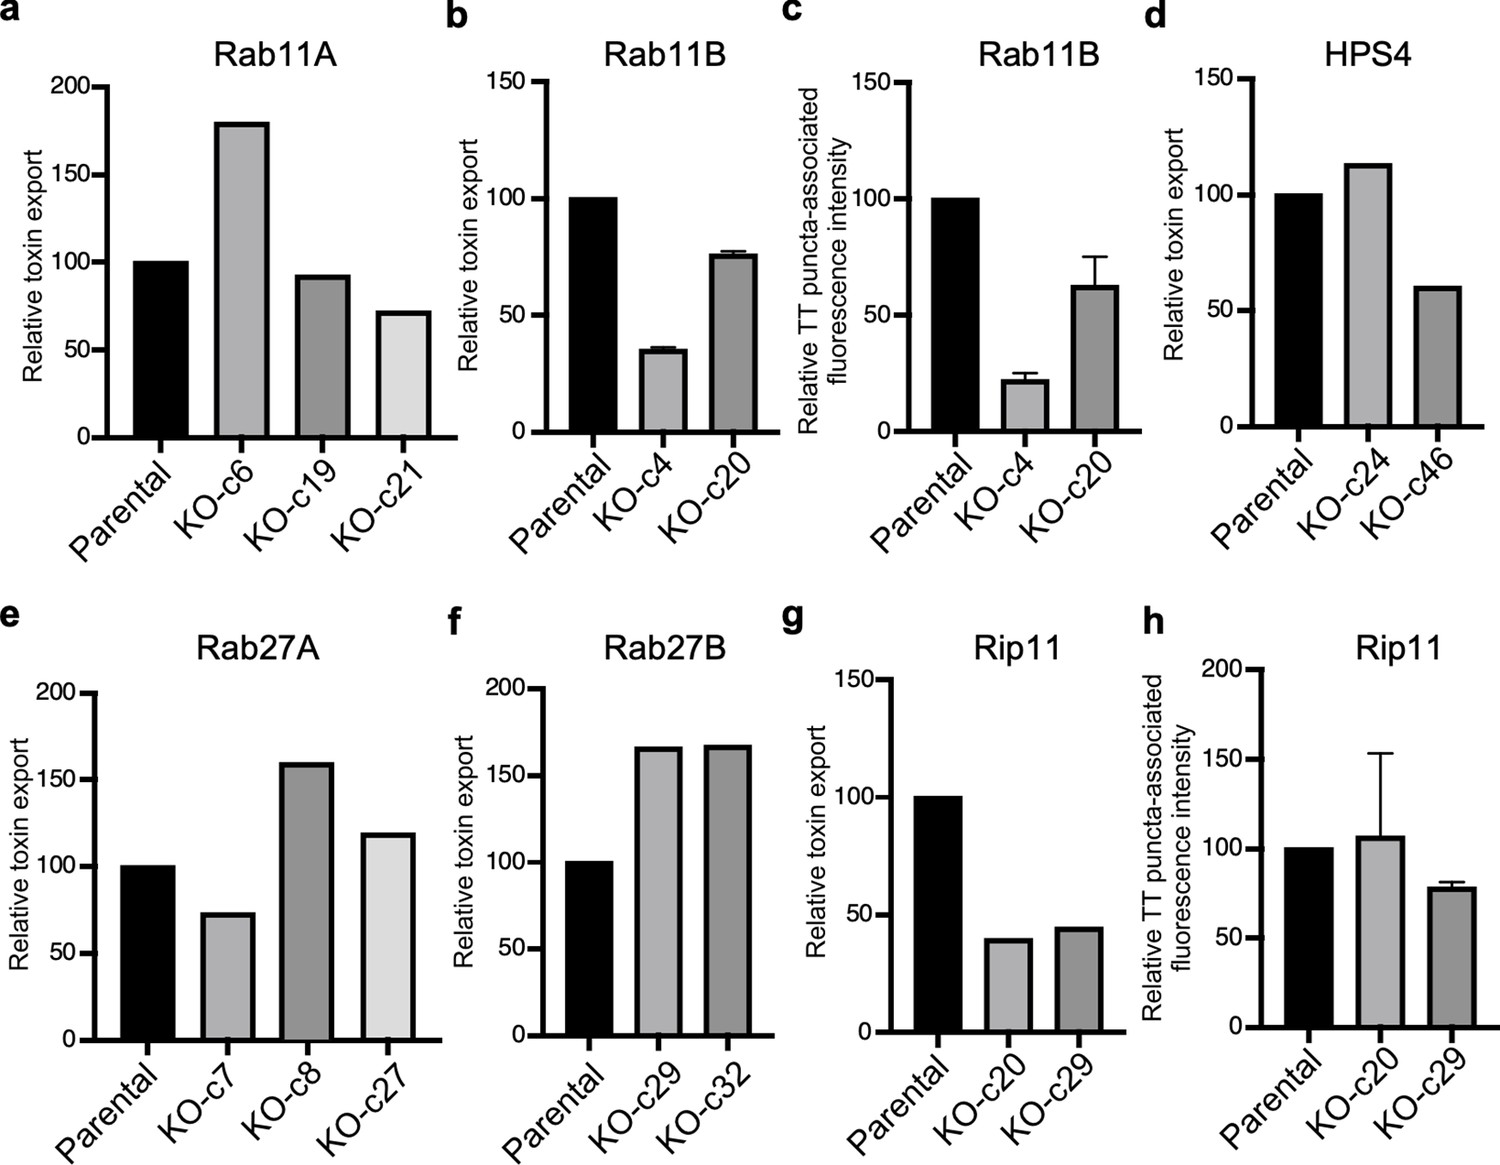
Analysis of independent clones of the CRISPR-Cas9-generated Rab27A-, Rab27B-, and Rip11-deficient cells shown in Figure 5.
Toxin export (a, b, d, e, f, and g) and typhoid toxin-associated fluorescent puncta (c and h) in parental HEK293T and the indicated CRISPR-Cas9-generated deficient clones were measured as indicated in Figure 5. Values in a, b, d, e, f, and g represent the relative toxicity of the different samples measured by determining the percentage of cells in the G2/M phase from the results of dilution of infection media experiments fitted by nonlinear regression; they were normalized relative to those of the parental cells, which was considered to be 100, and are the mean ± SD of two independent experiments (b). Values in (c and h) represent relative fluorescence intensity associated with typhoid toxin transport carriers and are the mean ± SEM.
Figure 5—figure supplement 3
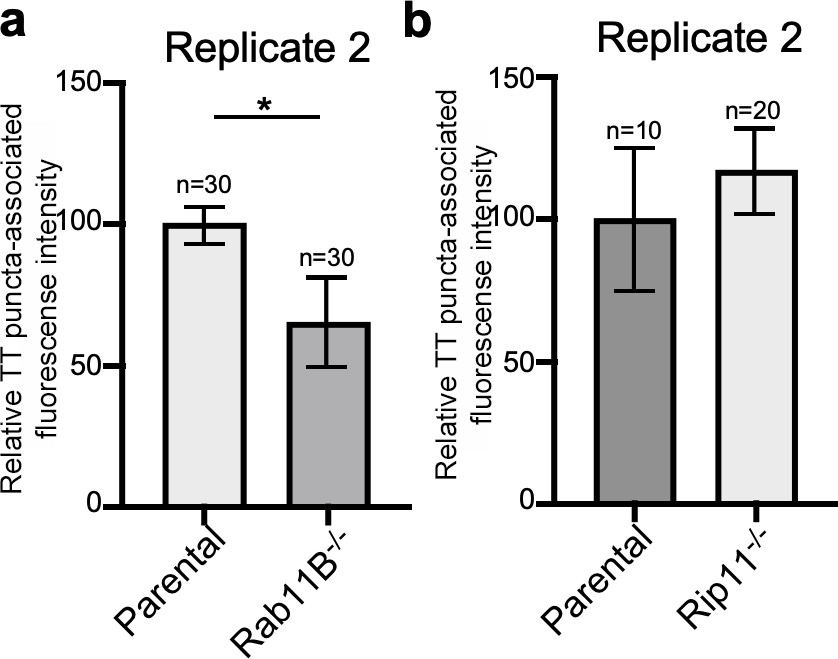
Rab11B and Rip11 regulate the transport of typhoid toxin vesicle carriers.
Quantification of the intensity of fluorescent puncta associated with typhoid toxin carrier intermediates in parental HEK293T and Rab11B- (a) or Rip11-defficient (b) cells. Values represent relative fluorescence intensity and are the mean ± SEM. *: p<0.05, unpaired two-sided t test. The results shown are from replicates of the experiments shown in Figure 5c and d.
Figure 6 with 2 supplements
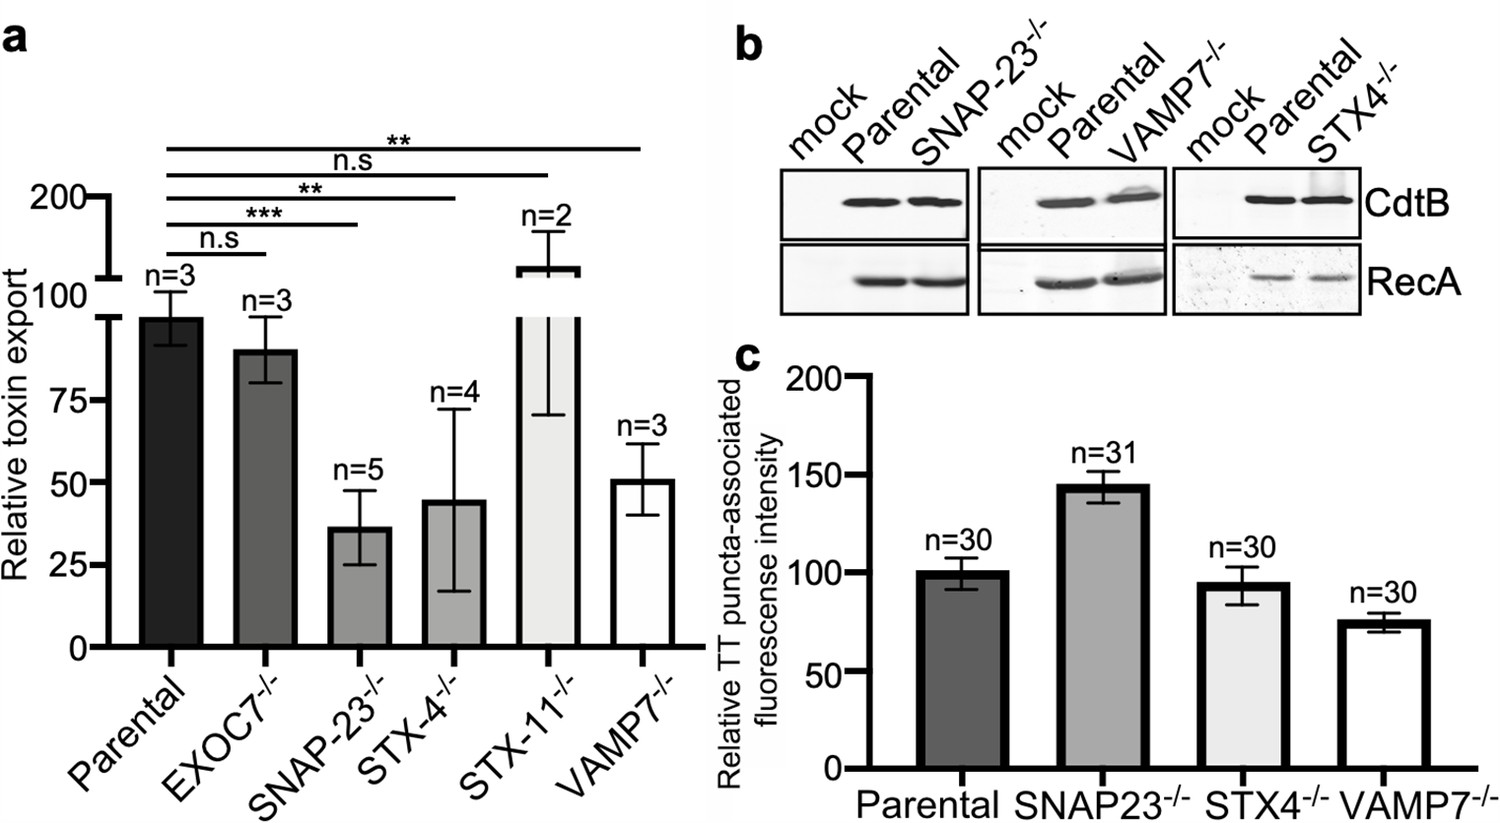
VAMP7, SNAP23, and STX4 control the last steps of typhoid toxin export.
(a) Quantification of typhoid toxin export into the infection medium. Infection media obtained from Salmonella Typhi-infected HEK293T parental and the indicated deficient cells were serially diluted and applied to uninfected HEK293T cells. The cell cycle profile of treated cells was analyzed by flow cytometry, and the percentage of cells at the G2/M phase, a measure of typhoid toxin toxicity, was determined. The relative toxicity was determined by the percentage of cells at the G2/M phase from the dilution of infection media fitted by nonlinear regression. Values were normalized relative to parental cells, which was considered to be 100 and are the mean ± SD. ***: p<0.001; **: p<0.01, unpaired two-sided t test. (b) Western blot analysis of the expression of typhoid toxin in parental HEK293T and the SNAP-23-, VAMP7-, and STX4-deficient cells. Cells were infected with S. Typhi expressing FLAG-tagged CdtB, lysed after 24 hr of infection, and analyzed by western blot with antibodies directed to FLAG and the Salmonella protein RecA. (c) Quantification of the intensity of fluorescent puncta associated with typhoid toxin carrier intermediates in parental HEK293T and the indicated deficient cells. Cells were infected with a S. Typhi strain expressing FLAG-tagged CdtB and the levels of fluorescence associated with typhoid toxin carriers were determined 24 hr after infection. Values represent relative fluorescence intensity and are the mean ± SEM. n.s: differences not statistically significant. The results of an additional independent experiment are shown in Figure 5—figure supplement 3. TT: typhoid toxin.
-
Figure 6—source data 1
Raw data of Figure 6a and c.
- https://cdn.elifesciences.org/articles/78561/elife-78561-fig6-data1-v2.xlsx
-
Figure 6—source data 2
Unprocessed CdtB and RecA western blots.
- https://cdn.elifesciences.org/articles/78561/elife-78561-fig6-data2-v2.pdf
Figure 6—figure supplement 1
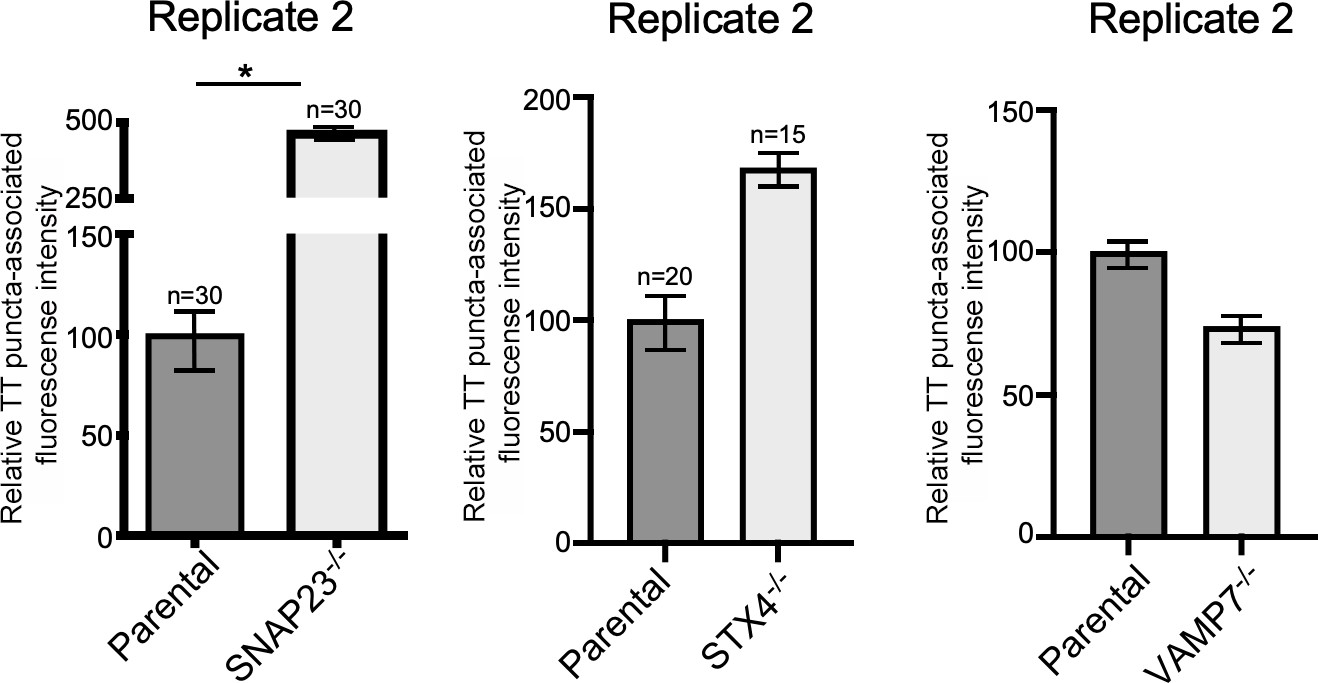
VAMP7, SNAP23, and STX4 control the last steps of typhoid toxin export.
Quantification of the intensity of fluorescent puncta associated with typhoid toxin carrier intermediates in parental HEK293T and the indicated deficient cells. Cells were infected with a Salmonella Typhi strain expressing FLAG-tagged CdtB (to visualize typhoid toxin) and the levels of fluorescence associated with typhoid toxin carriers were determined 24 hr after infection. Values represent relative fluorescence intensity and are the mean ± SEM. *: p<0.05, unpaired two-sided t test. The results shown are from replicates of the experiments shown in Figure 6c.
Figure 6—figure supplement 2
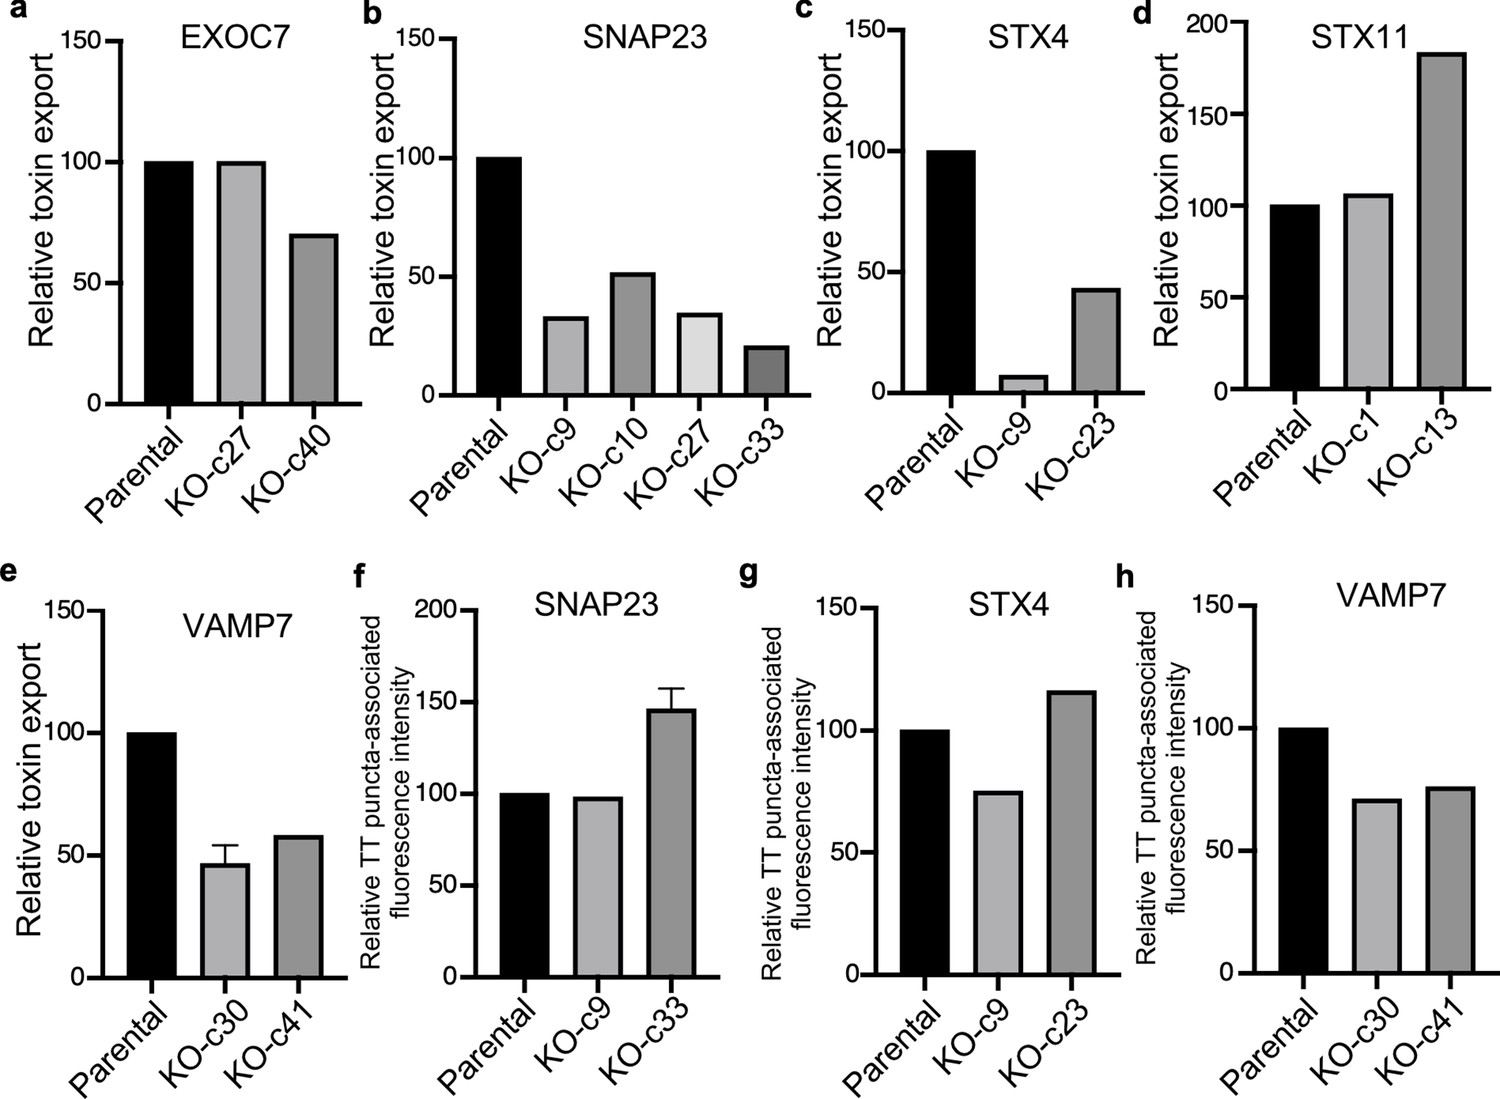
Analysis of independent clones of the CRISP-Cas9-generated EXOC7-, SNAP23-, STX4- STX11-, and VAMP7-deficient cells shown in Figure 6.
Toxin export (a–e) and typhoid toxin-associated fluorescent puncta (f–h) in parental HEK293T and the indicated CRISPR-Cas9-generated deficient clones were measured as indicated in Figure 6. Values in (a–g) represent the relative toxicity of the different samples measured by determining the percentage of cells in the G2/M phase from the results of dilution of infection media experiments fitted by nonlinear regression; they were normalized relative to those of the parental cells, which was considered to be 100. Values in (e and f) represent relative fluorescence intensity and are the mean ± SEM.
Figure 7
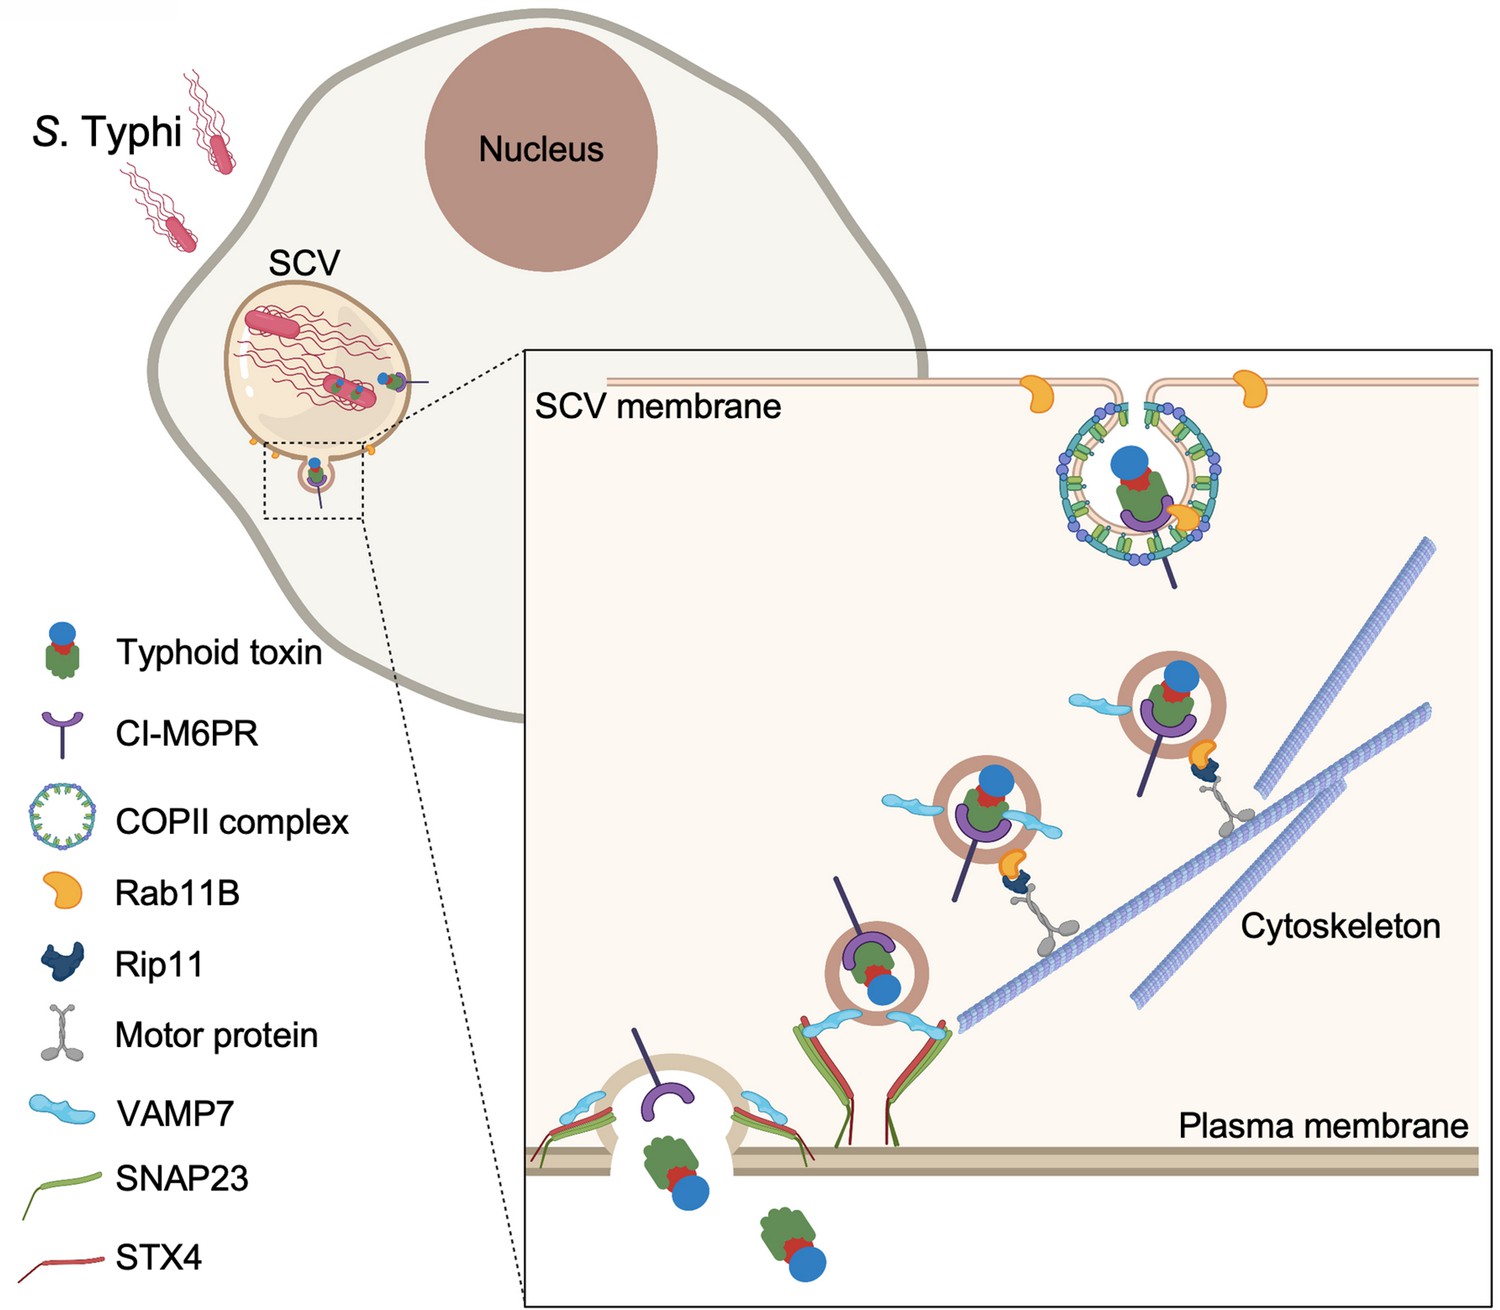
Model for typhoid toxin export from Salmonella Typhi-infected cells.
Mediated by the action of effector proteins of its two type III secretion systems, Salmonella Typhi gains access to host cells and builds an intracellular niche that allows its replication and survival. Within this intracellular niche, S. Typhi expresses typhoid toxin, which is secreted to the lumen of the Salmonella-containing vacuole by a type X secretion system. Though interaction with its glycan-receptor-binding B subunit, typhoid toxin engages cation-independent mannose-6-phosphate receptor (CI-M6PR), which acts as its sorting receptor and mediates its packaging into vesicle transport carriers aided by COPII complex and Rab11b. The vesicle carriers are transported to the cell periphery by motor proteins engaging the Rab11b-interacting protein Rip11. On the cell periphery, the vesicle carriers undergo exocytosis by fusing to the plasma membrane, a process mediated by SNARE proteins VAMP7 on the vesicle carriers and SNAP23 and STX4 on the plasma membrane.
Tables
Key resources table
| Reagent type (species) or resource | Designation | Source or reference | Identifiers | Additional information |
|---|---|---|---|---|
| Gene (Salmonella enterica serovar Typhi) | cdtB | PMID:18191792; MicrobesOnline Database | STY1886 | |
| Gene (S. Typhi) | pltA | PMID:18191792; MicrobesOnline Database | STY1890 | |
| Gene (S. Typhi) | pltB | PMID:18191792; MicrobesOnline Database | STY1891 | |
| Gene (Salmonella enterica serovar Typhimurium) | SopD2 | MicrobesOnline Database | STM0972 | |
| Gene (Salmonella enterica serovar Typhimurium) | GtgE | MicrobesOnline Database | STM1055 | |
| Gene (Salmonella enterica serovar Typhimurium) | SseJ | MicrobesOnline Database | STM1631 | |
| Gene (Salmonella enterica serovar Typhimurium) | SteB | MicrobesOnline Database | STM14_1970 | |
| Gene (Salmonella enterica serovar Typhimurium) | SlrP | MicrobesOnline Database | STM0800 | |
| Gene (Salmonella enterica serovar Typhimurium) | SseK1 | MicrobesOnline Database | STM4157 | |
| Gene (Salmonella enterica serovar Typhimurium) | SseK2 | MicrobesOnline Database | STM2137 | |
| Gene (Salmonella enterica serovar Typhimurium) | SseK3 | MicrobesOnline Database | STM14_2428 | |
| Gene (Salmonella enterica serovar Typhimurium) | GtgA | MicrobesOnline Database | STM14_1166 | |
| Gene (Salmonella enterica serovar Typhimurium) | SseL | MicrobesOnline Database | STM2287 | |
| Gene (Salmonella enterica serovar Typhimurium) | SpvC | KEGG Database | STM14_5561 | |
| Gene (Salmonella enterica serovar Typhimurium) | SpvD | KEGG Database | STM14_5560 | |
| Gene (Salmonella enterica serovar Typhimurium) | GogB | MicrobesOnline Database | STM2584 | |
| Gene (Salmonella enterica serovar Typhimurium) | SspH1 | MicrobesOnline Database | STM14_1483 | |
| Cell line (Homo sapiens) | Henle-407 | Roy Curtiss laboratory collection | Cell line maintained in Jorge Galan’s lab | |
| Cell line (Homo sapiens) | HEK293T | American Type Culture Collection (ATCC) | Cell line maintained in Jorge Galan’s lab | |
| Strain, strain background (Salmonella enterica serovar Typhi) | ISP2825 | PMID:1879916 | ||
| Strain, strain background (Salmonella enterica serovar Typhimurium) | SL1344 | PMID:1879916 | ||
| Recombinant DNA reagent | WT typhoid toxin; pSB5496 | This paper | Vector(pET28b) to express pltA-pltB-cdtB-3xflag-His in the E. coli BL21 cells | |
| Recombinant DNA reagent | Mutant typhoid toxin (PltBS35A toxin); pSB5497 | This paper | Vector(pET28b) to express pltA-pltB S35A-cdtB-3xflag-His in the E. coli BL21 cells | |
| Recombinant DNA reagent | pWSK-SopD2 | PMID:28742135 | STM0972 | |
| Recombinant DNA reagent | pWSK-GtgE | PMID:28742135 | STM1055 | |
| Recombinant DNA reagent | pWSK-SseJ | PMID:28742135 | STM1631 | |
| Recombinant DNA reagent | pWSK-SteB | PMID:28742135 | STM14_1970 | |
| Recombinant DNA reagent | pWSK-SlrP | PMID:28742135 | STM0800 | |
| Recombinant DNA reagent | pWSK-SseK1 | PMID:28742135 | STM4157 | |
| Recombinant DNA reagent | pWSK-SseK2 | PMID:28742135 | STM2137 | |
| Recombinant DNA reagent | pWSK-SseK3 | PMID:28742135 | STM14_2428 | |
| Recombinant DNA reagent | pWSK-GtgA | PMID:28742135 | STM14_1166 | |
| Recombinant DNA reagent | pWSK-SseL | PMID:28742135 | STM2287 | |
| Recombinant DNA reagent | pWSK-SpvC | PMID:28742135 | STM14_5561 | |
| Recombinant DNA reagent | pWSK-SpvD | PMID:28742135 | STM14_5560 | |
| Recombinant DNA reagent | pWSK-GogB | PMID:28742135 | STM2584 | |
| Recombinant DNA reagent | pWSK-SspH1 | PMID:28742135 | STM14_1483 | |
| Recombinant DNA reagent | pWSK-SseJS151A; pSB5848 | This paper | The plasmid to express mutant SseJS151A in Salmonella Typhi | |
| Recombinant DNA reagent | pEGFP-Sec23A | Addgene; PMID:10825291 | ||
| Recombinant DNA reagent | px459-CI-M6PR | This paper | sgRNA | gRNA sequence: CGGACTGAAGCTGGTGCGCA |
| Recombinant DNA reagent | px459-Sec23B | This paper | sgRNA | gRNA sequence: TACAATTGAGTACGTGATAC |
| Recombinant DNA reagent | px459-AP4m1 | This paper | sgRNA | gRNA sequence: CTCTTTGACCTCAGCAGCGT |
| Recombinant DNA reagent | px459-CLTC | This paper | sgRNA | gRNA sequence: TCGTTTTCAGGAGCATCTCC |
| Recombinant DNA reagent | px459-AP3B1 | This paper | sgRNA | gRNA sequence: AAAGAAGAAGCCGTATACTA |
| Recombinant DNA reagent | px459-Sar1B | This paper | sgRNA | gRNA sequence: AATGTGCCTATACTGATTCT |
| Recombinant DNA reagent | px459-Rab11A | This paper | sgRNA | gRNA sequence: CATTTCGAGTAAATCGAGAC |
| Recombinant DNA reagent | px459-Rab11B | This paper | sgRNA | gRNA sequence: GAGCAAGAGCACCATCGGCG |
| Recombinant DNA reagent | px459-HPS4 | This paper | sgRNA | gRNA sequence: GAAGGCGATCCAACAAGAGC |
| Recombinant DNA reagent | px459-Rab27A | This paper | sgRNA | gRNA sequence: AGTGGCTCCATCCGGCCCAC |
| Recombinant DNA reagent | px459-Rab27B | This paper | sgRNA | gRNA sequence: TCCTGGCCCTCGGGGATTCA |
| Recombinant DNA reagent | px459-Rip11 | This paper | sgRNA | gRNA sequence: GGTCAAACATACTGGCGCTC |
| Recombinant DNA reagent | px459-Exoc7 | This paper | sgRNA | gRNA sequence: TGACGAAGGCACTGACGCAG |
| Recombinant DNA reagent | px459-SNAP23 | This paper | sgRNA | gRNA sequence: AAGACAACATGGGGAGATGG |
| Recombinant DNA reagent | px459-STX-4 | This paper | sgRNA | gRNA sequence: TGGTGCACCCGGGCACGGCA |
| Recombinant DNA reagent | px459-STX-11 | Other | A gift from Dr Craig Roy’s lab | |
| Recombinant DNA reagent | px459-VAMP7 | This paper | sgRNA | gRNA sequence: TTCTGAATGAGATAAAGAAG |
| Antibody | Anti-FLAG M2 (mouse monoclonal) | Sigma-Aldrich | SI-F3165-1MG | IF (1: 5000) WB (1:10,000) |
| Antibody | Anti-S. Typhi (rabbit polyclonal) | Sifin | TS1605 | IF (1:10,000) |
| Antibody | Anti-IGF-II Receptor/CI-M6PR (D3V8C) (rabbit monoclonal) | Cell Signaling Technology (CST) | #14364 | IF (1:500) WB (1:500) |
| Antibody | Anti-GFP (rabbit polyclonal) | GeneTex | GTX113617 | WB (1:10,000) |
| Antibody | Anti-GFP (mouse monoclonal) | GeneTex | GTX628528 | WB (1:10,000) |
| Antibody | Goat anti-mouse IgG1 Alexa-Fluor 488 (goat polyclonal) | Thermo Fisher Scientific | A21121 | IF (1:2000) |
| Antibody | Goat anti-rabbit IgG (H+L) Alexa-Fluor 594 (goat polyclonal) | Thermo Fisher Scientific | A11012 | IF (1:2000) |
| Software, algorithm | ImageJ with Microbe J plug-in | http://rsbweb.nih.gov/ij/; PMID:27572972 | ||
| Software, algorithm | R software | https://www.r-project.org/; PMID:30357717 | ||
| Software, algorithm | Imaris | https://imaris.oxinst.com/ |
Additional files
-
Transparent reporting form
- https://cdn.elifesciences.org/articles/78561/elife-78561-transrepform1-v2.docx
-
Supplementary file 1
List of strains used in this study.
- https://cdn.elifesciences.org/articles/78561/elife-78561-supp1-v2.docx
-
Supplementary file 2
List of plasmids used in this study.
- https://cdn.elifesciences.org/articles/78561/elife-78561-supp2-v2.docx
-
Source data 1
Unprocessed western blots.
- https://cdn.elifesciences.org/articles/78561/elife-78561-data1-v2.pdf
Download links
A two-part list of links to download the article, or parts of the article, in various formats.
Downloads (link to download the article as PDF)
Open citations (links to open the citations from this article in various online reference manager services)
Cite this article (links to download the citations from this article in formats compatible with various reference manager tools)
Typhoid toxin sorting and exocytic transport from Salmonella Typhi-infected cells
eLife 11:e78561.
https://doi.org/10.7554/eLife.78561


