Starting to have sexual intercourse is associated with increases in cervicovaginal immune mediators in young women: a prospective study and meta-analysis
- Department of Obstetrics and Gynecology, University of Washington, United States
- Vaccine and Infectious Disease Division, Fred Hutchinson Cancer Research Center, United States
- Department of Laboratory Medicine & Pathology, University of Washington, United States
- Department of Global Health, University of Washington, United States
- Centre for Virus Research, Kenya Medical Research Institute, Kenya
- Centre for Clinical Research, Kenya Medical Research Institute, Kenya
- Department of Medicine, University of Washington, United States
- Department of Epidemiology, University of Washington, United States
- Department of Epidemiology, Milken Institute School of Public Health, The George Washington University, United States
- Department of Clinical Sciences, Unit of Tropical Bacteriology, Institute of Tropical Medicine, Belgium
- Department of Community Health, Jomo Kenyatta University of Agriculture and Technology, Kenya
Figures
Figure 1
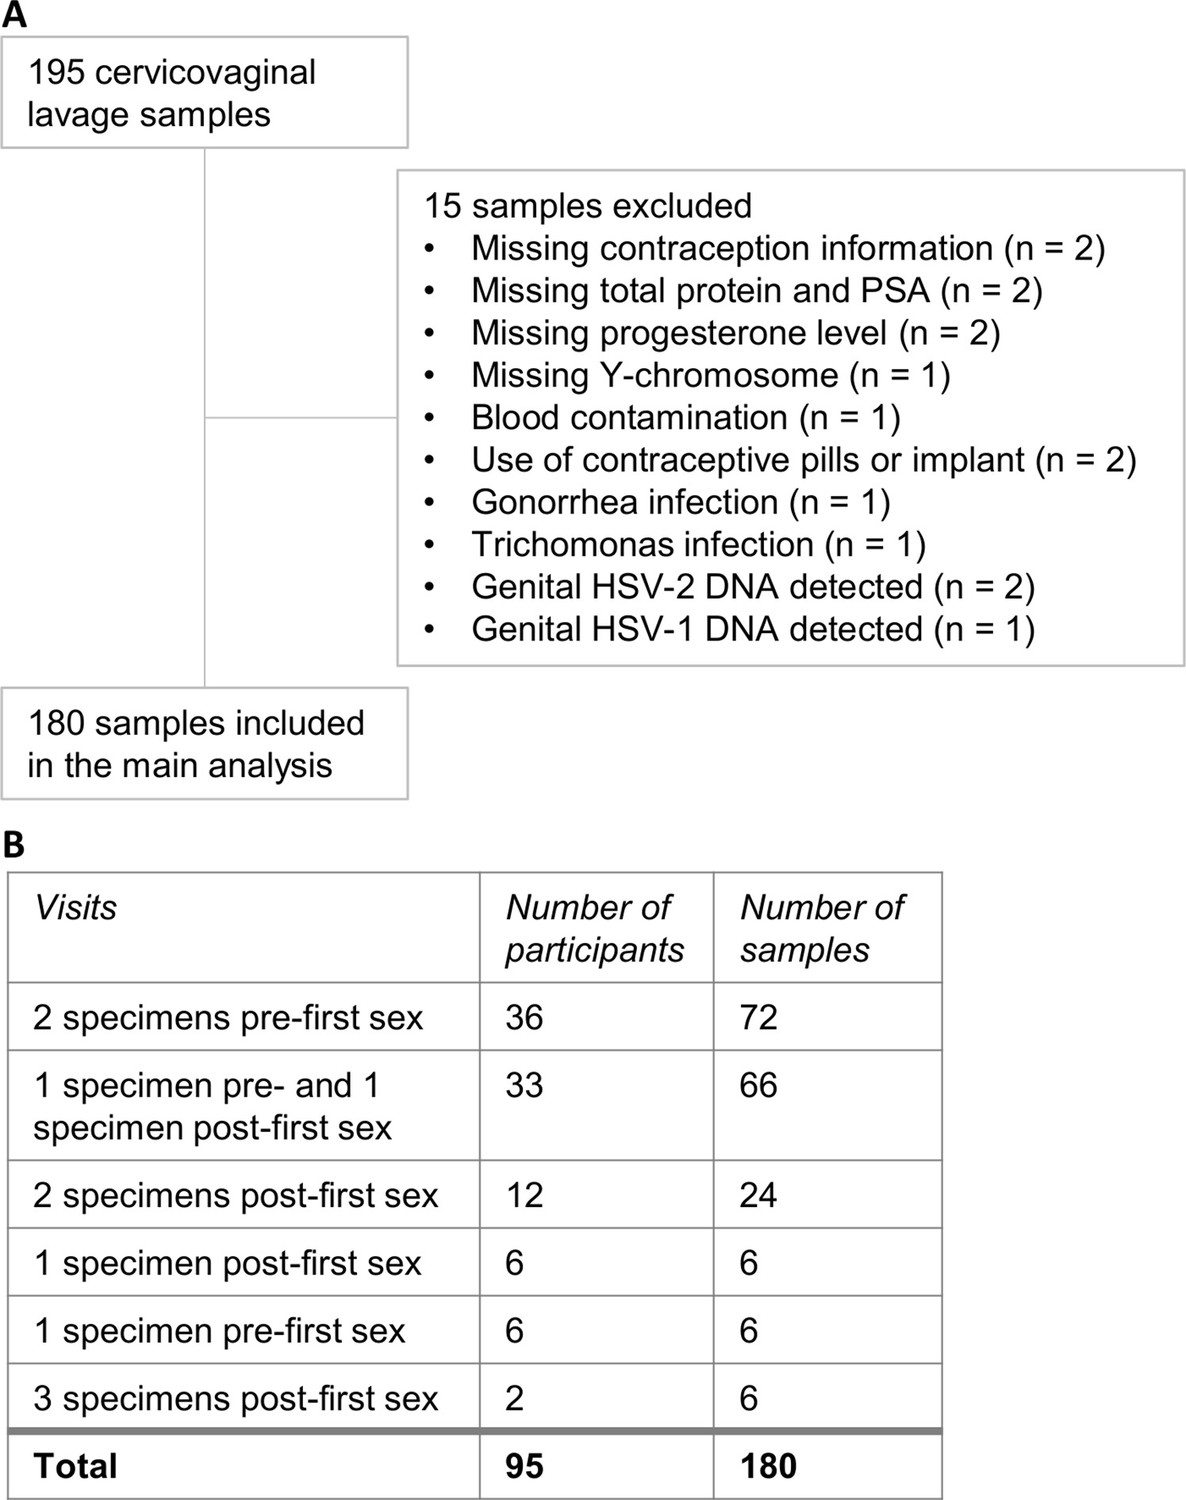
Cervicovaginal lavage sample selection.
(A) Cervicovaginal lavage sample selection, collected from adolescent girls and young women in a longitudinal cohort study. (B) Timepoints for collection of cervicovaginal lavage specimens pre- and post-first sexual intercourse.
Figure 2
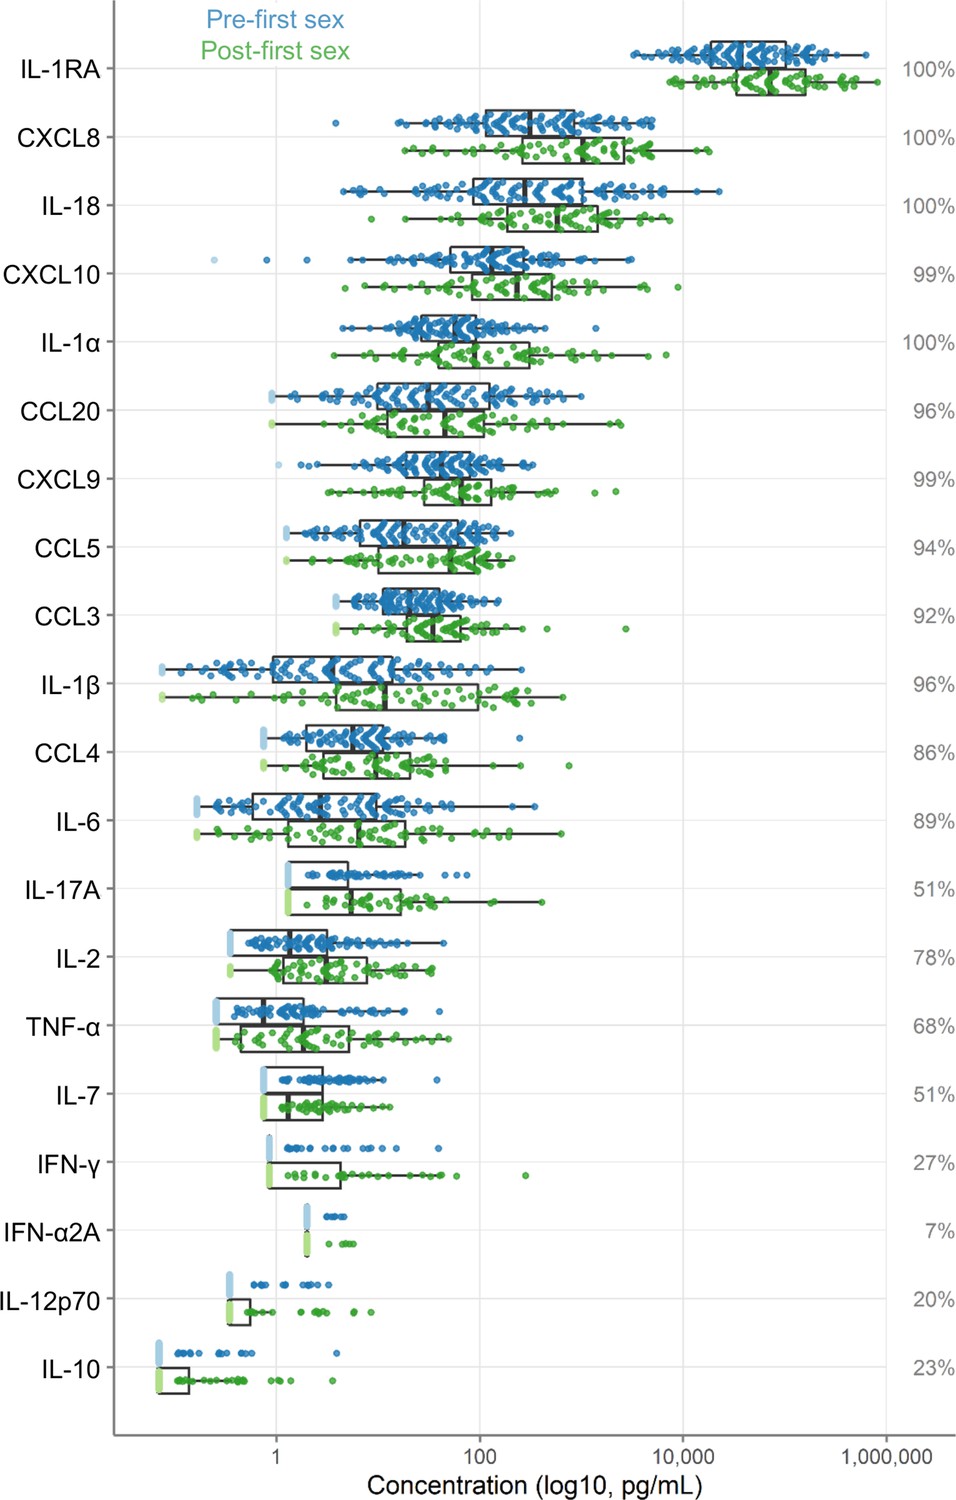
Immune factor concentrations in pg/mL from cervicovaginal lavage specimens from adolescent girls and young women, comparing specimens from before and after first sexual intercourse.
Blue indicates specimens prior to first sex, and green indicates samples after first sex. Specimens below the limit of detection are indicated as lighter colors and were set to half the limit of detection. Percentages indicate the percent of samples within the detectable range of the assays. The boxes range from the 25th to 75th percentiles of the data, with the middle vertical line indicating the median. The whiskers stretch to the values no farther from the edge of the box than 1.5 times the interquartile range. The sample size is 180 specimens from 95 participants.
Figure 3
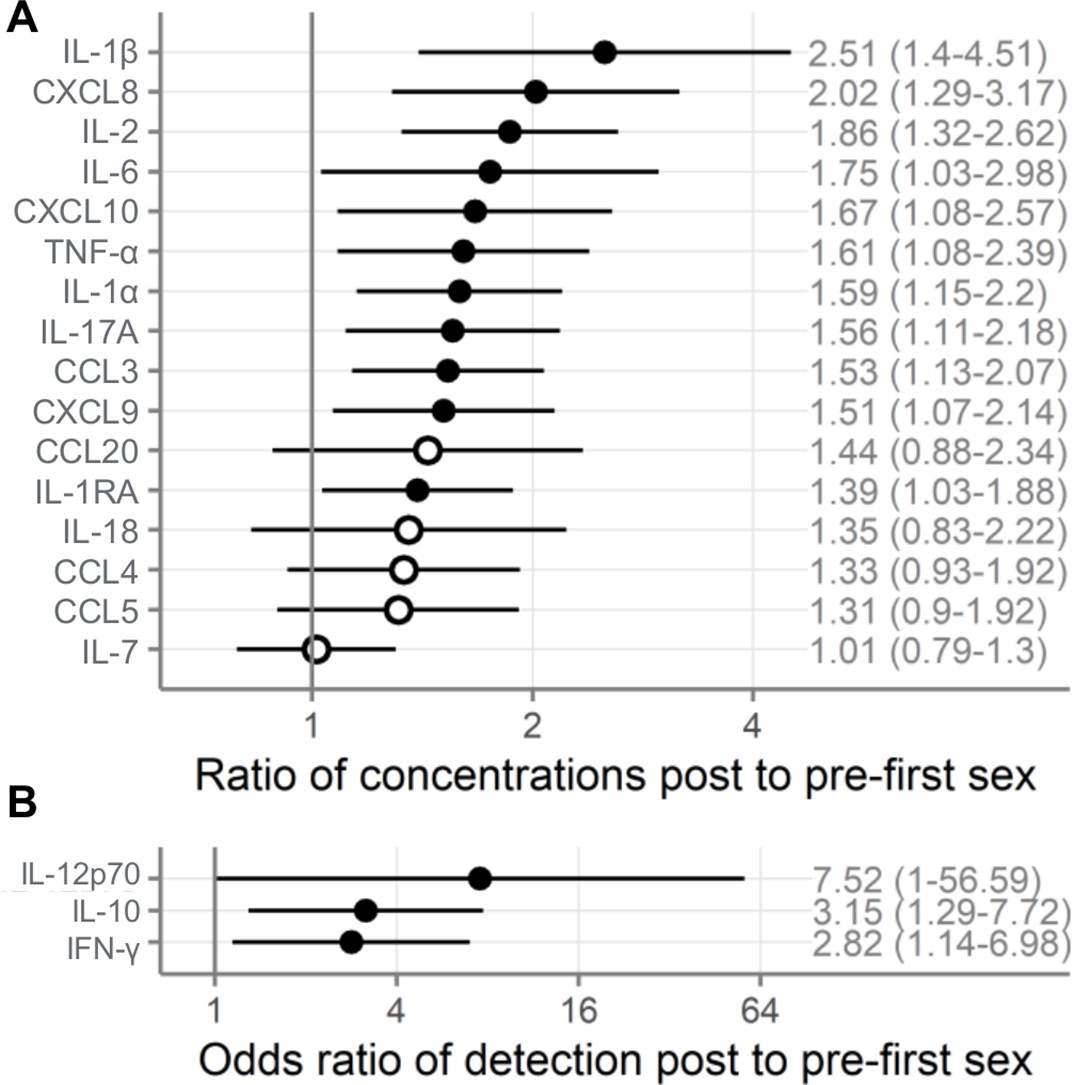
Comparison of immune mediators in cervicovaginal lavage samples pre- and post-first sexual intercourse.
Univariate mixed-effect models with first sex as fixed effect and participant as random effects. Symbols indicate the mean and horizontal lines indicate the 95% confidence intervals. Filled symbols indicate p<0.05, while open symbols indicate p≥0.05. Vertical lines at 1 indicate no difference between pre- and post-first sex. (A) Multiplicative ratio of post-first sex concentrations (pg/mL) to pre-first sex concentrations on a log scale. A value of 1 indicates no difference, and numbers higher than 1 indicate greater quantities of immune mediators post-first sex. Ratios and 95% confidence intervals are shown at right. The ratio is calculated as 2^mean log2 difference shown in Table 2. ( B) Odds ratio (on a log scale) comparing the odds of the immune mediator being detected above the lower limit of detection (for immune mediators detected in fewer than half of the samples). A value of 1 indicates no difference, and numbers higher than 1 indicate greater detection of immune mediators post-first sex. Ratios and 95% confidence intervals are shown at right. The sample size is 180 specimens from 95 participants.
Figure 4

Concentration of immune mediators in cervicovaginal lavage samples relative to day of first sex.
Each symbol depicts the concentration in a single sample. Black lines show the slopes from mixed-effect models with days since first sex as fixed effect and participant as random effects with linear splines using a knot at day 0. Concentrations are shown in pg/mL on a log10 scale. The sample size is 80 pre-first sex samples from 59 participants and 60 post-first sex samples from 49 participants.
Figure 5
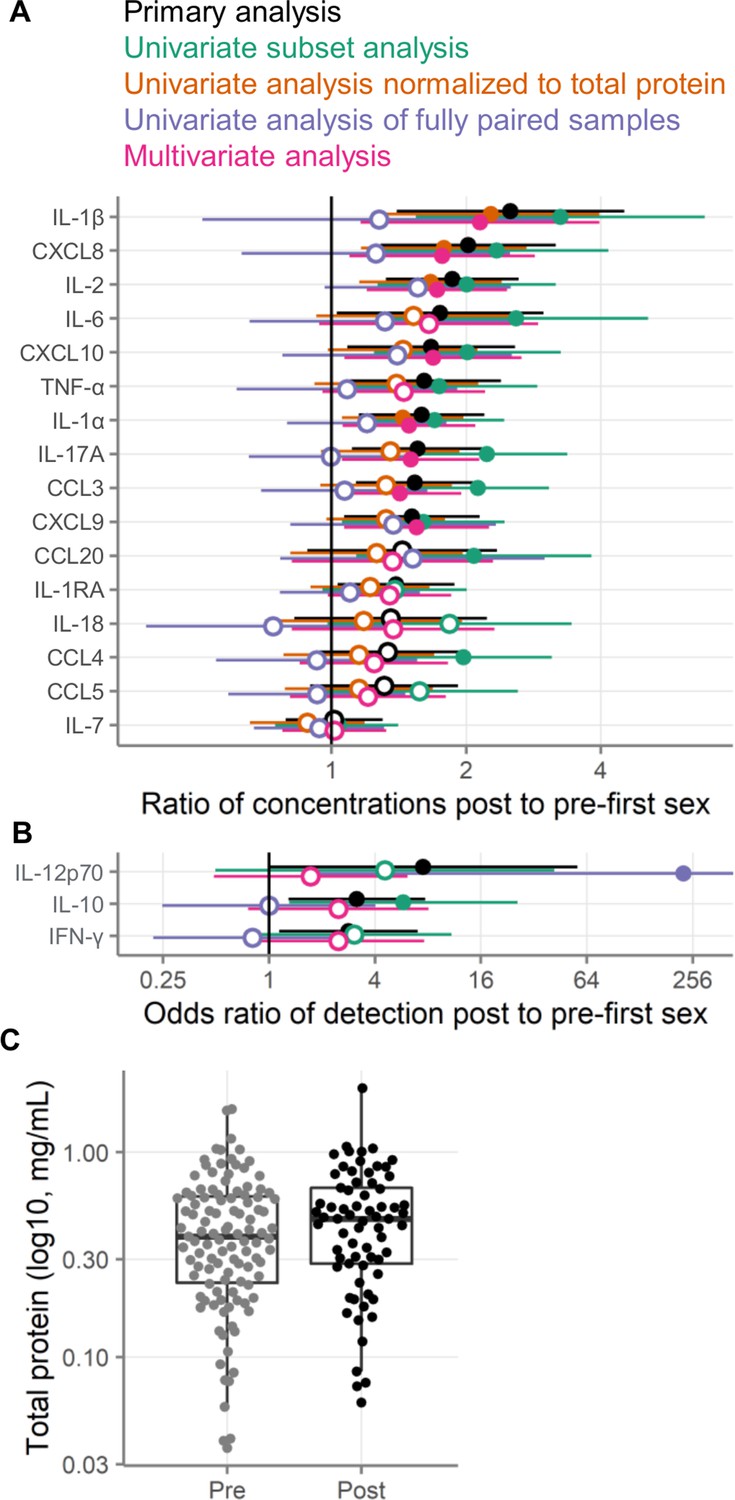
Alternative analysis strategies for the association of first sexual intercourse and quantities of cervicovaginal immune mediators.
Filled symbols indicate p-value <0.05, and open symbols indicate p-values ≥0.05. Vertical lines at 1 indicate no difference between pre- and post-first sex. Black symbols show the same primary analysis as Figure 3. Green symbols show the primary, univariate models applied to a subset of samples negative for pregnancy, contraception, bacterial vaginosis (BV), chlamydia, and HSV-2. Orange symbols show the primary univariate analysis performed on concentrations normalized to total protein concentrations (pg/mg protein). Purple symbols show the primary analysis repeated on only those samples from participants who provided both pre- and post-first sex samples. Pink symbols show a multivariate analysis adjusted for age, education, income, urban/rural residence, and roof type. (A) Multiplicative ratio of post-first sex concentrations to pre-first sex concentrations (pg/mL) on a log scale. A value of 1 indicates no difference, and numbers greater than 1 indicate higher values post-sex. (B) Odds ratio (on a log scale) for the immune mediator being detected above the lower limit of detection. A value of 1 indicates no difference, and numbers greater than 1 indicate higher odds of detection post-sex. Symbols indicate the mean, and horizontal lines indicate the 95% confidence intervals. The error bar for the fully paired analysis of IL-12 extends off-scale. (C) Total protein concentrations in cervicovaginal lavage specimens. The boxes range from the 25th to 75th percentiles of the data, with the middle horizontal line indicating the median. The whiskers stretch to the values no farther from the edge of the box than 1.5 times the interquartile range. The sample size is 180 specimens from 95 participants.
Figure 6
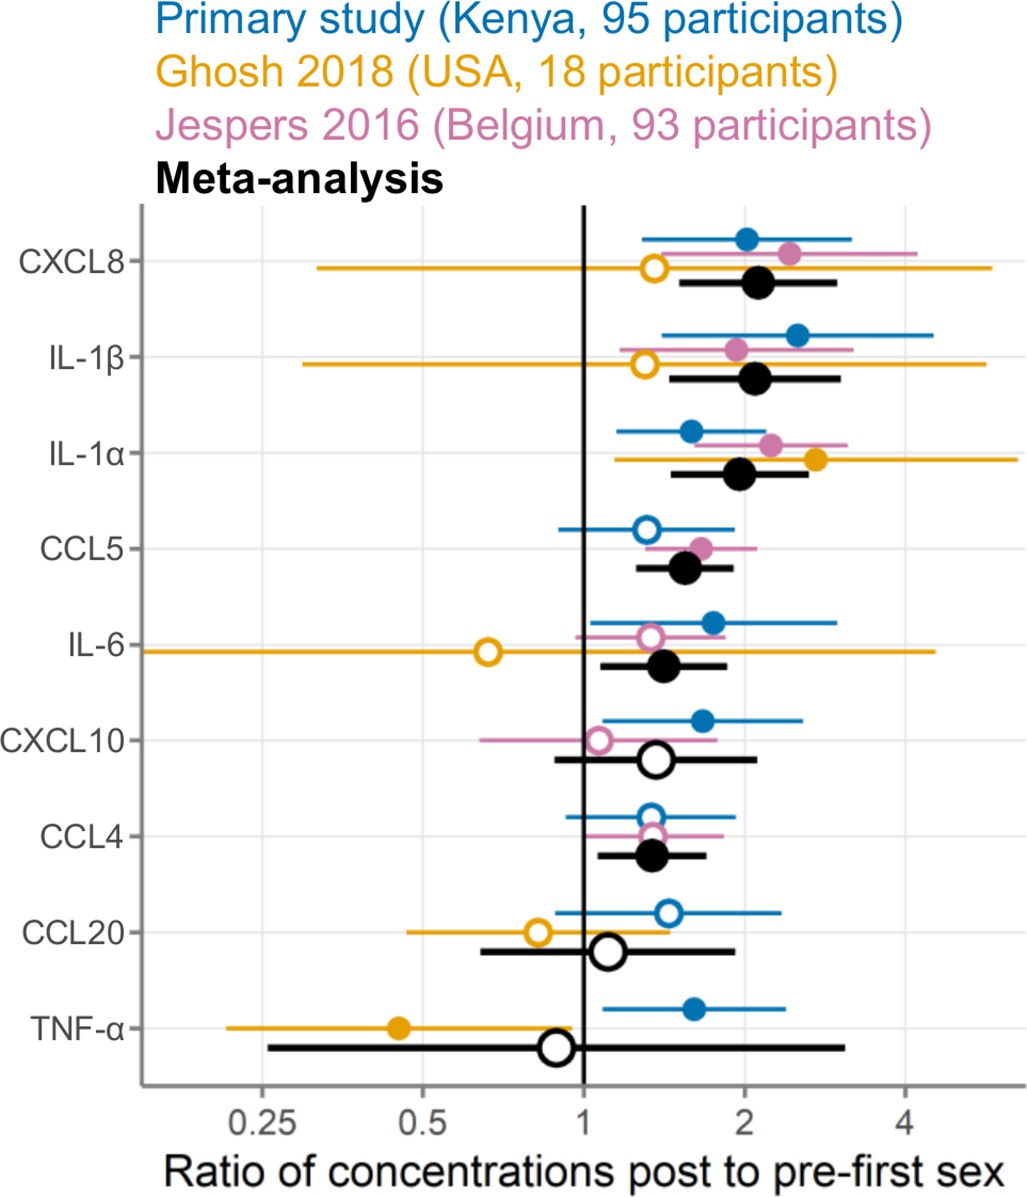
Meta-analysis comparing three studies measuring cervicovaginal immune mediators in adolescent girls and young women before and after first sexual intercourse.
Multiplicative ratio of post-first sex concentrations to pre-first sex concentrations (pg/mL) on a log scale. A value of 1 indicates no difference, and numbers greater than 1 indicate higher values post-first sex. Symbols indicate the mean, and horizontal lines indicate the 95% confidence intervals. Filled symbols indicate p-value <0.05 while open symbols indicate p-values ≥0.05. Vertical lines at 1 indicate no difference between pre- and post-first sex. Colors indicate the source of the data (blue, primary study; gold, Ghosh 2018; pink, Jespers 2016; black, meta-analysis).
Tables
Key resources table
| Reagent type (species) or resource | Designation | Source or reference | Identifiers | Additional information |
|---|---|---|---|---|
| Biological sample (Homo sapiens) | Cervicovaginal lavage samples | This paper | The dataset is included in Source code 1 | |
| Commercial assay or kit | Quantifiler Duo DNA Quantification Kit | Thermo Fisher | Catalog# 4387746 | |
| Commercial assay or kit | Pierce BCA Protein Assay Kit | Thermo Fisher | Catalog# 23225 | |
| Commercial assay or kit | MIG R-Plex assay | Meso Scale Discovery | Catalog# F210I | |
| Commercial assay or kit | RANTES R-Plex assay | Meso Scale Discovery | Catalog# F21ZN | |
| Commercial assay or kit | IL-1RA U-Plex assay | Meso Scale Discovery | Catalog# K151XPK | |
| Commercial assay or kit | IFN-γ U-Plex assay | Meso Scale Discovery | Catalog# K151TTK | |
| Commercial assay or kit | IL-10 U-Plex assay | Meso Scale Discovery | Catalog# K151TZK | |
| Commercial assay or kit | IL-12p70 U-Plex assay | Meso Scale Discovery | Catalog# K151UAK | |
| Commercial assay or kit | IL-1β U-Plex assay | Meso Scale Discovery | Catalog# K151TUK | |
| Commercial assay or kit | IL-2 U-Plex assay | Meso Scale Discovery | Catalog# K151TVK | |
| Commercial assay or kit | IL-6 U-Plex assay | Meso Scale Discovery | Catalog# K151TXK | |
| Commercial assay or kit | IL-8 U-Plex assay | Meso Scale Discovery | Catalog# K151TYK | |
| Commercial assay or kit | TNF-α U-Plex assay | Meso Scale Discovery | Catalog# K151UCK | |
| Commercial assay or kit | IFN-a2a U-Plex assay | Meso Scale Discovery | Catalog# K151VHK | |
| Commercial assay or kit | IL-17a U-Plex assay | Meso Scale Discovery | Catalog# K151UTK | |
| Commercial assay or kit | IL-18 U-Plex assay | Meso Scale Discovery | Catalog# K151VJK | |
| Commercial assay or kit | IL-1α U-Plex assay | Meso Scale Discovery | Catalog# K151UNK | |
| Commercial assay or kit | IL-7 U-Plex assay | Meso Scale Discovery | Catalog# K151UPK | |
| Commercial assay or kit | IP-10 U-Plex assay | Meso Scale Discovery | Catalog# K151UFK | |
| Commercial assay or kit | MIP-1a U-Plex assay | Meso Scale Discovery | Catalog# K151UJK | |
| Commercial assay or kit | MIP-1β U-Plex assay | Meso Scale Discovery | Catalog# K151UKK | |
| Commercial assay or kit | MIP-3α U-Plex assay | Meso Scale Discovery | Catalog# K151UZK | |
| Commercial assay or kit | Human Kallikrein 3/PSA DuoSet ELISA | R&D Systems | Catalog# DY1344 | |
| Software, algorithm | R Project for Statistical Computer | R Core Team | RRID:SCR_001905 | |
| Software, algorithm | R package: lmerTest | Comprehensive R Archive Network | RRID:SCR_015656 | |
| Software, algorithm | R package: meta | Comprehensive R Archive Network | RRID:SCR_019055 | |
| Software, algorithm | R package: tidyverse | Comprehensive R Archive Network | RRID:SCR_019186 | |
| Other | Ghosh 2018 dataset | Ghosh et al., 2018 | The dataset is included in Source code 1 | |
| Other | Jespers 2016 dataset | Jespers et al., 2016 | The dataset is included in Source code 1 |
Table 1
Comparison of social, demographic, and biological characteristics of adolescent girls and young women at timepoints of cervicovaginal lavage specimens selected for the study.
Each participant can appear in this table more than once. Pregnant indicates pregnant at the time of sample collection. All participants listed here were negative for HSV-1 and HSV-2 genital DNA (indicative of active infection). Mixed effect regression models included a random intercept for participant.
| Pre-first sex timepointsN=111 specimens* | Post-first sex timepointsN=69 specimens* | p-Value | |
|---|---|---|---|
| Age (years) | 18.80 (17.80, 19.45) | 19.30 (18.60, 19.80) | <0.001† |
| Education at enrollment‡ | 0.934§ | ||
| Completed high school | 18 (16%) | 12 (17%) | |
| In high school | 93 (84%) | 57 (83%) | |
| Income at enrollment‡ | 0.876§ | ||
| No regular income | 57 (51%) | 43 (62%) | |
| Regular income | 54 (49%) | 26 (38%) | |
| Residence at enrollment‡ | 0.575§ | ||
| Rural | 72 (65%) | 28 (41%) | |
| Urban | 39 (35%) | 41 (59%) | |
| Roof material at enrollment‡ | 0.814§ | ||
| Not tile or metal | 10 (9%) | 1 (1.4%) | |
| Tile or metal | 101 (91%) | 68 (99%) | |
| Menstrual phase | |||
| Luteal | 39 (35%) | 26 (38%) | 0.73§ |
| Follicular | 64 (58%) | 35 (51%) | 0.36§ |
| Other | 8 (7.2%) | 8 (12%) | 0.21§ |
| Pregnant | -¶ | ||
| Negative | 111 (100%) | 64 (93%) | |
| Positive | 0 (0%) | 5 (7.2%) | |
| Contraception | -¶ | ||
| None | 111 (100%) | 54 (78%) | |
| Emergency pills | 0 (0%) | 4 (5.8%) | |
| Condoms | 0 (0%) | 11 (16%) | |
| Y-chromosome | -¶ | ||
| Negative | 111 (100%) | 55 (80%) | |
| Positive | 0 (0%) | 14 (20%) | |
| Prostate-specific antigen | -¶ | ||
| Negative | 111 (100%) | 67 (97%) | |
| Positive | 0 (0%) | 2 (2.9%) | |
| Bacterial vaginosis | |||
| Negative (Nugent score 0–3) | 102 (92%) | 54 (78%) | 0.08§ |
| Intermediate (4–6) | 6 (5.4%) | 6 (8.7%) | 0.82§ |
| Positive (7–10) | 3 (2.7%) | 9 (13%) | 0.02§ |
| Chlamydia | -¶ | ||
| Negative | 111 (100%) | 59 (86%) | |
| Positive | 0 (0%) | 10 (14%) | |
| HSV-1 | >0.9§ | ||
| Seronegative | 4 (3.6%) | 2 (2.9%) | |
| Seropositive | 107 (96%) | 67 (97%) | |
| HSV-2 | -¶ | ||
| Seronegative | 111 (100%) | 66 (96%) | |
| Seropositive | 0 (0%) | 3 (4.3%) | |
-
*
Statistics presented: median (IQR) or n (%).
-
†
Linear mixed effects regression.
-
‡
Time-invariant variables, with data only available from the enrollment visit.
-
§
Logistic mixed effects regression with binary combinations, comparing each category to all other samples (e.g. luteal compared to pooled follicular and other).
-
¶
Not tested for difference between groups because this variable can only be positive at post-first sex time points by definition.
Table 2
Comparison of immune mediators in cervicovaginal lavage samples pre- and post-first sexual intercourse.
Results of univariate mixed-effect models with first sex as fixed effect and participant as random effects. Mean log2 pg/mL difference values above 0 indicate higher concentrations post-first sex. Ratio indicates the multiplicative ratio of post over pre-sex (on a linear scale), so a ratio of 1 indicates no difference, ratios >1 indicate higher post, and ratios <1 indicate higher pre. The ratio is calculated as 2^mean log2 difference. Adjusted p-values are adjusted by Holm-Bonferroni for 19 immune mediators.
| Immune mediator | Mean log2 difference | Standard error | Ratio (95% CI) | p-Value | Adjusted p-value |
|---|---|---|---|---|---|
| IL-2 | 0.90 | 0.25 | 1.86 (1.32–2.62) | 4.7E-4 | 0.009 |
| IL-1β | 1.33 | 0.43 | 2.51 (1.4–4.51) | 0.002 | 0.044 |
| CXCL8 | 1.01 | 0.33 | 2.02 (1.29–3.17) | 0.003 | 0.045 |
| IL-1α | 0.67 | 0.24 | 1.59 (1.15–2.2) | 0.006 | 0.088 |
| CCL3 | 0.62 | 0.22 | 1.53 (1.13–2.07) | 0.006 | 0.091 |
| IL-17A | 0.64 | 0.25 | 1.56 (1.11–2.18) | 0.011 | 0.154 |
| TNF-α | 0.69 | 0.29 | 1.61 (1.08–2.39) | 0.020 | 0.236 |
| CXCL10 | 0.74 | 0.32 | 1.67 (1.08–2.57) | 0.021 | 0.236 |
| CXCL9 | 0.60 | 0.26 | 1.51 (1.07–2.14) | 0.021 | 0.236 |
| IL-1RA | 0.48 | 0.22 | 1.39 (1.03–1.88) | 0.032 | 0.258 |
| IL-6 | 0.81 | 0.39 | 1.75 (1.03–2.98) | 0.041 | 0.284 |
| CCL4 | 0.42 | 0.27 | 1.33 (0.93–1.92) | 0.124 | 0.621 |
| CCL20 | 0.53 | 0.36 | 1.44 (0.88–2.34) | 0.146 | 0.621 |
| CCL5 | 0.39 | 0.28 | 1.31 (0.9–1.92) | 0.166 | 0.621 |
| IL-18 | 0.44 | 0.36 | 1.35 (0.83–2.22) | 0.232 | 0.621 |
| IL-7 | 0.02 | 0.18 | 1.01 (0.79–1.3) | 0.921 | 0.921 |
Table 3
Comparison of immune mediators in cervicovaginal lavage samples pre- and post-first sexual intercourse.
Results of univariate mixed-effect models with first sex as fixed effect and participant as random effects. Log odds ratio values above 0 indicate that the immune mediator was more often detected post-first sex. Odds ratio indicates the odds ratio of detection for post over pre-sex (on a linear scale), so a ratio of 1 indicates no difference, ratios >1 indicate higher detection post, and ratios <1 indicate higher detection pre. Adjusted p-values are adjusted by Holm-Bonferroni for 19 immune mediators.
| Immune mediator | Log-odds | Standard error | Odds ratio (95% CI) | p-Value | Adjusted p-value |
|---|---|---|---|---|---|
| IL-10 | 1.15 | 0.46 | 3.15 (1.29–7.72) | 0.012 | 0.154 |
| IFN-γ | 1.04 | 0.46 | 2.82 (1.14–6.98) | 0.025 | 0.236 |
| IL-12p70 | 2.02 | 1.03 | 7.52 (1.00–56.59) | 0.050 | 0.300 |
Table 4
Change in concentration of immune mediators with time.
Results of mixed-effect models with 100 days since first sex as a fixed effect and participant as random effects, using a spline with a knot at 0 (the day of first sexual intercourse). The slope column indicates the change in log2 immune mediator concentration (pg/mL) per 100 days. A value of 1 would indicate an increase of 1 log2 pg/mL in 100 days, while a value of –1 would indicate a decrease of the same. The p-values test whether the post-first sex slope differs from the pre-first sex slope.
| Slope pre-first sex | Slope post-first sex | p-Value for difference between slopes | |||
|---|---|---|---|---|---|
| Slope | 95% CI | Slope | 95% CI | ||
| IL-2 | 0.0003 | (–0.1, 0.1) | 0.99 | (0.59, 1.39) | 0.00003 |
| IL-12p70 | –0.02 | (–0.07, 0.03) | 0.49 | (0.28, 0.69) | 0.00003 |
| IL-1β | –0.04 | (–0.21, 0.13) | 1.60 | (0.92, 2.29) | 0.0001 |
| IL-10 | 0.01 | (–0.05, 0.07) | 0.57 | (0.32, 0.81) | 0.0002 |
| CXCL8 | –0.03 | (–0.16, 0.09) | 1.09 | (0.57, 1.61) | 0.0002 |
| TNF-α | –0.01 | (–0.12, 0.1) | 0.98 | (0.52, 1.44) | 0.0002 |
| IL-17A | 0.04 | (–0.06, 0.14) | 0.93 | (0.51, 1.34) | 0.0003 |
| CCL4 | –0.03 | (–0.13, 0.07) | 0.75 | (0.33, 1.17) | 0.001 |
| IFN-γ | 0.03 | (–0.05, 0.11) | 0.62 | (0.28, 0.97) | 0.003 |
| IL-1α | 0.02 | (–0.09, 0.13) | 0.71 | (0.29, 1.13) | 0.005 |
| IL-6 | –0.08 | (–0.24, 0.08) | 0.88 | (0.24, 1.53) | 0.01 |
| CCL3 | 0.05 | (–0.03, 0.13) | 0.53 | (0.2, 0.87) | 0.01 |
| CCL20 | –0.10 | (–0.25, 0.06) | 0.69 | (0.07, 1.3) | 0.03 |
| CXCL9 | 0.01 | (–0.1, 0.12) | 0.54 | (0.1, 0.97) | 0.03 |
| CXCL10 | 0.03 | (–0.11, 0.18) | 0.70 | (0.14, 1.26) | 0.04 |
| IL-1RA | 0.07 | (–0.03, 0.18) | 0.54 | (0.14, 0.94) | 0.04 |
| IL-7 | –0.02 | (–0.09, 0.05) | 0.31 | (0.02, 0.59) | 0.04 |
| CCL5 | 0.09 | (–0.03, 0.22) | 0.56 | (0.08, 1.04) | 0.09 |
| IL-18 | 0.08 | (–0.06, 0.22) | 0.46 | (–0.12, 1.04) | 0.25 |
Table 5
Meta-analyses of immune mediator concentrations in cervicovaginal samples comparing pre- and post-first sexual intercourse.
Results of random effects meta-analyses using inverse variance pooling. Mean log2 difference values above 0 indicate higher concentrations post-first sex. Ratio indicates the multiplicative ratio of post over pre-sex (on a linear scale), so a ratio of 1 indicates no difference, ratios >1 indicate higher post, and ratios <1 indicate higher pre. Adjusted p-values are adjusted by Holm-Bonferroni for measuring nine immune mediators. I2 is a measure of heterogeneity between studies, with a proportion of 0 indicating that all between-study variation can be explained by random sampling and higher I2 proportions values indicating clinical, biological, or methodological diversity between studies.
| Immune mediator | Mean log2 difference | Standard error | Ratio (95% CI) | p-Value | Adjusted p-value | Number of studies | I2 |
|---|---|---|---|---|---|---|---|
| IL-1α | 0.97 | 0.22 | 1.96 (1.45–2.64) | 1.0E-5 | 9.1E-5 | 3 | 0.28 |
| CXCL8 | 1.08 | 0.25 | 2.12 (1.51–2.98) | 1.5E-5 | 1.2E-4 | 3 | 0 |
| CCL5 | 0.63 | 0.16 | 1.55 (1.25–1.91) | 5.2E-5 | 3.6E-4 | 2 | 0.05 |
| IL-1β | 1.06 | 0.27 | 2.09 (1.44–3.03) | 9.3E-5 | 5.6E-4 | 3 | 0 |
| IL-6 | 0.50 | 0.20 | 1.41 (1.07–1.86) | 0.013 | 0.066 | 3 | 0 |
| CCL4 | 0.42 | 0.17 | 1.34 (1.06–1.7) | 0.014 | 0.066 | 2 | 0 |
| CXCL10 | 0.45 | 0.32 | 1.36 (0.88–2.11) | 0.164 | 0.492 | 2 | 0.42 |
| CCL20 | 0.15 | 0.40 | 1.11 (0.64–1.92) | 0.712 | 1 | 2 | 0.54 |
| TNF-α | –0.17 | 0.92 | 0.89 (0.26–3.08) | 0.851 | 1 | 2 | 0.89 |
Author response table 1
| Linear | Logistic | ||||||
|---|---|---|---|---|---|---|---|
| Assay | Coef | Std. Error | P-value | Coef | Std. Error | P-value | Percent detectable |
| IL-12p70 | 0.24 | 0.14 | 0.08 | 2.02 | 1.03 | 0.05 | 20.0 |
| IL-10 | 0.32 | 0.16 | 0.05 | 1.15 | 0.46 | 0.01 | 22.8 |
| IFNγ | 0.49 | 0.20 | 0.02 | 1.04 | 0.46 | 0.02 | 26.7 |
| IL-17A | 0.64 | 0.25 | 0.01 | 0.80 | 0.34 | 0.02 | 50.6 |
| IL-7 | 0.02 | 0.18 | 0.92 | 0.37 | 0.34 | 0.27 | 50.6 |
| TNF | 0.69 | 0.29 | 0.02 | 0.90 | 0.44 | 0.04 | 68.3 |
| IL-2 | 0.90 | 0.25 | 0.0005 | 1.28 | 0.52 | 0.01 | 77.8 |
| CCL4 | 0.42 | 0.27 | 0.12 | 0.74 | 0.56 | 0.19 | 86.1 |
| IL-6 | 0.81 | 0.39 | 0.04 | 1.94 | 2.24 | 0.39 | 89.4 |
| CCL3 | 0.62 | 0.22 | 0.006 | 0.24 | 0.57 | 0.68 | 91.7 |
| CCL5 | 0.39 | 0.28 | 0.17 | -7.40 | 4.97 | 0.14 | 93.9 |
| CCL20 | 0.53 | 0.36 | 0.15 | 0.65 | 0.83 | 0.43 | 95.6 |
| IL-1b | 1.33 | 0.43 | 0.002 | 0.46 | 0.85 | 0.59 | 96.1 |
| CXCL10 | 0.74 | 0.32 | 0.02 | 32.92a | 8078958 | 1 | 99.4 |
| CXCL9 | 0.60 | 0.26 | 0.02 | 176.10a | 8078958 | 1 | 99.4 |
| CXCL8 | 1.02 | 0.33 | 0.003 | b | 100 | ||
| IL-1a | 0.67 | 0.24 | 0.006 | b | 100 | ||
| IL-1RA | 0.48 | 0.22 | 0.03 | b | 100 | ||
| IL-18 | 0.44 | 0.36 | 0.23 | b | 100 |
Additional files
-
Supplementary file 1
Results of analyses.
The results of the main analyses reported in the paper, including complete effect sizes, measures of variance, and p-values.
- https://cdn.elifesciences.org/articles/78565/elife-78565-supp1-v1.xlsx
-
Supplementary file 2
Systematic review search terms.
The search string used to query PubMed to identify potentially relevant articles for the systematic review.
- https://cdn.elifesciences.org/articles/78565/elife-78565-supp2-v1.docx
-
Supplementary file 3
Risk of bias assessment scale.
The scale used to assess the risk of bias in studies included in the meta-analysis. This scale was custom modified from the Newcastle-Ottawa Quality Assessment scale.
- https://cdn.elifesciences.org/articles/78565/elife-78565-supp3-v1.docx
-
Supplementary file 4
Plots of every meta-analysis separately.
Raw concentration data plots and forest plots for every immune mediator included in the meta-analysis section. The concentration plots show the measured immune mediator concentration for every sample in every study on a log10 scale, with samples from the same individual connected by lines. The forest plots show the effect size and weight in each study as well as the overall meta-estimate.
- https://cdn.elifesciences.org/articles/78565/elife-78565-supp4-v1.pdf
-
MDAR checklist
- https://cdn.elifesciences.org/articles/78565/elife-78565-mdarchecklist1-v1.docx
-
Source code 1
R code and raw data to reproduce the analysis.
An R project which cleans the raw data, runs all of the models reported in the paper, and generates the figures and tables.
- https://cdn.elifesciences.org/articles/78565/elife-78565-code1-v1.zip
-
Reporting standard 1
The preferred reporting items for a systematic review and meta-analysis of individual participant data (PRISMA-IPD) checklist.
The completed checklist indicating compliance with recommended PRISMA-IPD guidelines for performing a meta-analysis of individual participant data.
- https://cdn.elifesciences.org/articles/78565/elife-78565-repstand1-v1.docx
Download links
A two-part list of links to download the article, or parts of the article, in various formats.
Downloads (link to download the article as PDF)
Open citations (links to open the citations from this article in various online reference manager services)
Cite this article (links to download the citations from this article in formats compatible with various reference manager tools)
Starting to have sexual intercourse is associated with increases in cervicovaginal immune mediators in young women: a prospective study and meta-analysis
eLife 11:e78565.
https://doi.org/10.7554/eLife.78565


