DNA methylome combined with chromosome cluster-oriented analysis provides an early signature for cutaneous melanoma aggressiveness
- Unité de Service et de Recherche USR 3388, CNRS-Pierre Fabre, Epigenetic Targeting of Cancer (ETaC), France
- Cancer Epigenetics Group, Josep Carreras Leukemia Research Institute (IJC), Spain
- CNRS UMR 7196, INSERM U1154, Sorbone university- National museum of natural history (NMNH), France
- Cancer Research Center of Toulouse, UMR 1037, INSERM, Université Toulouse III Paul Sabatier, France
- Department of Translational Molecular Medicine, Saint John’s Cancer Institute, Providence Saint John's Health Center, United States
- Cancer Biology and Epigenetics Group, Research Center (CI-IPOP)/P.CCC Porto Comprehensive Cancer Center, Portuguese Oncology Institute of Porto (IPO Porto), Portugal
- Department of Pathology, Portuguese Oncology Institute of Porto (IPO Porto)/P.CCC Porto Comprehensive Cancer Center, Portugal
- Department of Pathology and Molecular Immunology, Biomedical Sciences Institute (ICBAS), University of Porto, Portugal
- Department of Experimental Oncology, Instituto Europeo di Oncologia, Italy
- Laboratory for Functional Genomics, Fondation Jean Dausset-CEPH, France
- Laboratory for Epigenetics and Environment, Centre National de Recherche en Génomique Humaine, CEA-Institut de Biologie François Jacob, France
- EpiCBio, Epigenetic Chemical Biology, Department Structural Biology and Chemistry, Institut Pasteur, CNRS UMR 3523, France
Figures
Figure 1 with 2 supplements
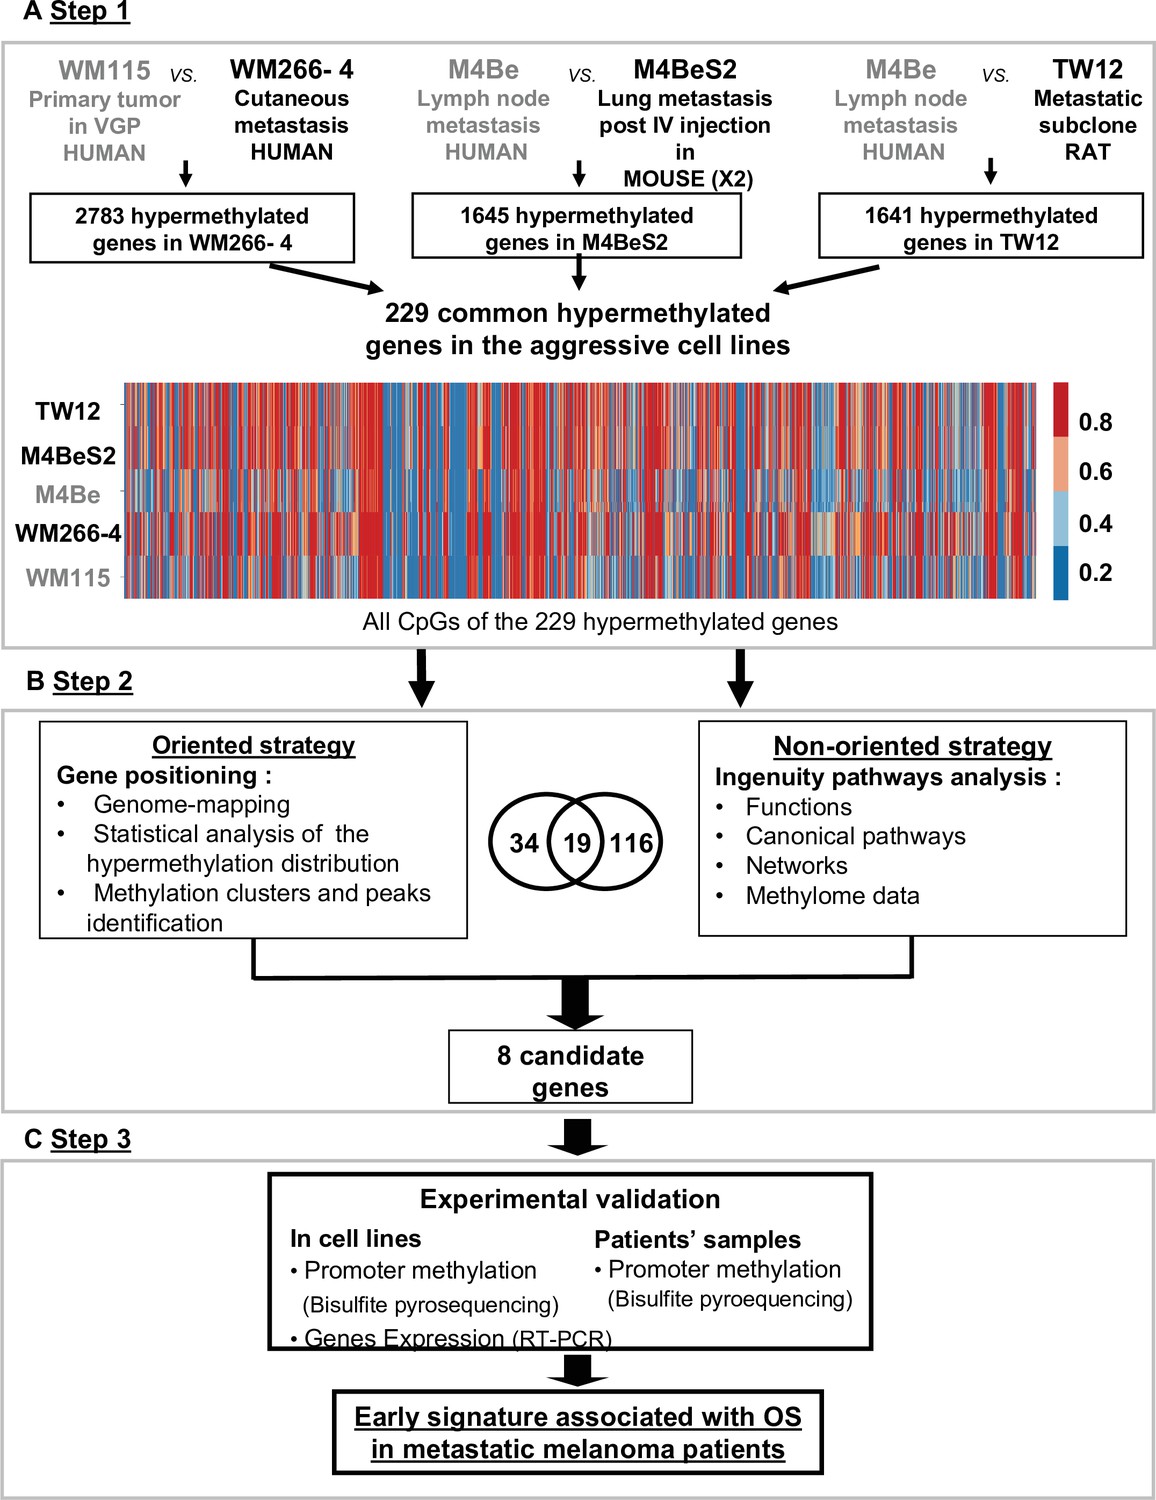
Strategy for identifying differentially methylated gene signatures of aggressive melanoma.
The strategy is based on the analysis of three pairs of human melanoma cell lines with an aggressive variant derived under different physiological contexts: human, mouse, and rat. In each pair, the cell line defined as more aggressive is indicated in bold characters. (A) Step 1: the methylation status of more than 480,000 CpG positions was compared in each cell line pair using the Illumina Infinium Human Methylation 450 K BeadChip technology. 229 common genes showing at least three CpGs positions with methylation levels increased by 20% in the aggressive cell line were retained (hypermethylated genes). (B) Step 2: two strategies for data analysis were used: the oriented strategy is based on a statistical analysis of the distribution of the hypermethylated genes across the genome, and the non-oriented strategy uses Ingenuity Pathway Analysis software to identify potential links to described networks and functions. (C) Step 3: experimental validation of the selected genes, by bisulfite pyrosequencing for DNA methylation and RT-PCR for gene expression, was performed in the WM115 and WM266-4 cell lines prior to analysis in patient samples. After applying this differential threshold to at least three CpG positions for each gene, we found that 2783, 1645, and 1641 genes were hypermethylated in WM266-4 vs WM115, M4BeS2 vs M4Be, and TW12 vs M4Be, respectively (A). 229 genes, comprising 5590 CpG sites, were common to all three pairs of cell lines. These 229 genes were further analysed using the human WM115/WM266-4 pair. 1287 (23%) CpGs were hypermethylated (>20%) in WM266-4 cells of which 788 (61%) were located in promoter regions (TSS1500-TSS200-5’UTR-first exon), 452 (35%) in gene bodies and 47 (4%) in 3’UTR regions.
Figure 1—figure supplement 1
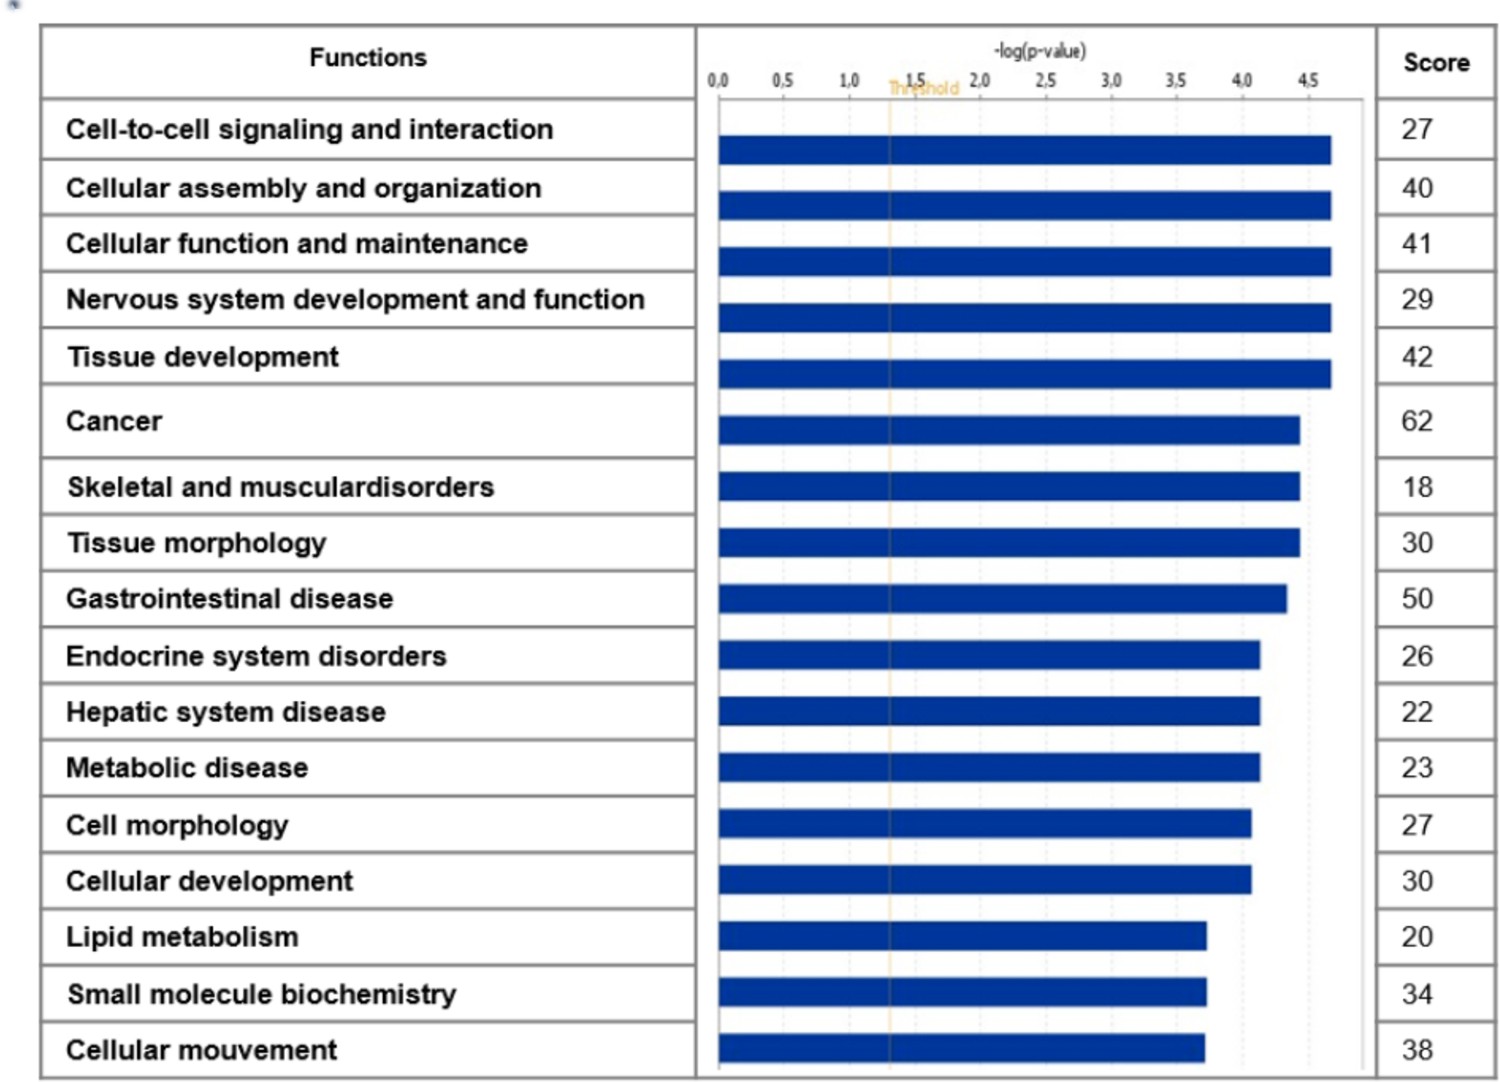
Top functions associated by Ingenuity Pathway Analysis (IPA) to the 229 hypermethylated genes in the aggressive cell lines.
Among the 229 genes, 116 were associated to IPA canonical functions. Column 1 indicates the top functions. Column 2 shows the −log(p-value) as horizontal histogram relative to the Fisher exact test p<0.05: −log (0.05=1.3 = threshold) used by IPA to classify the most representative functions. The score in column 3 corresponds to the number of genes among the 229 belonging to the associated function.
Figure 1—figure supplement 2
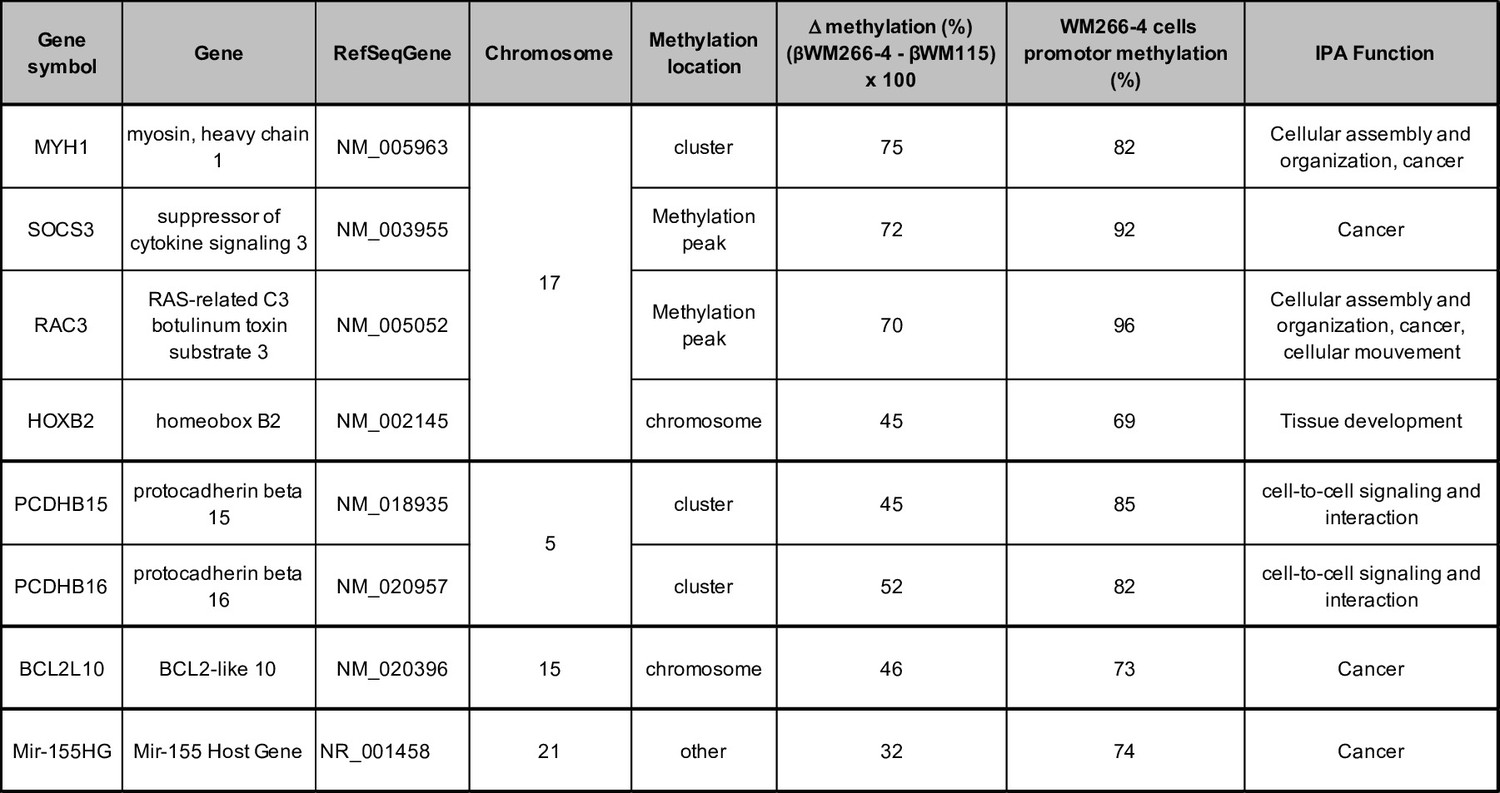
Detailed information of the eight selected genes.
Figure 2 with 3 supplements
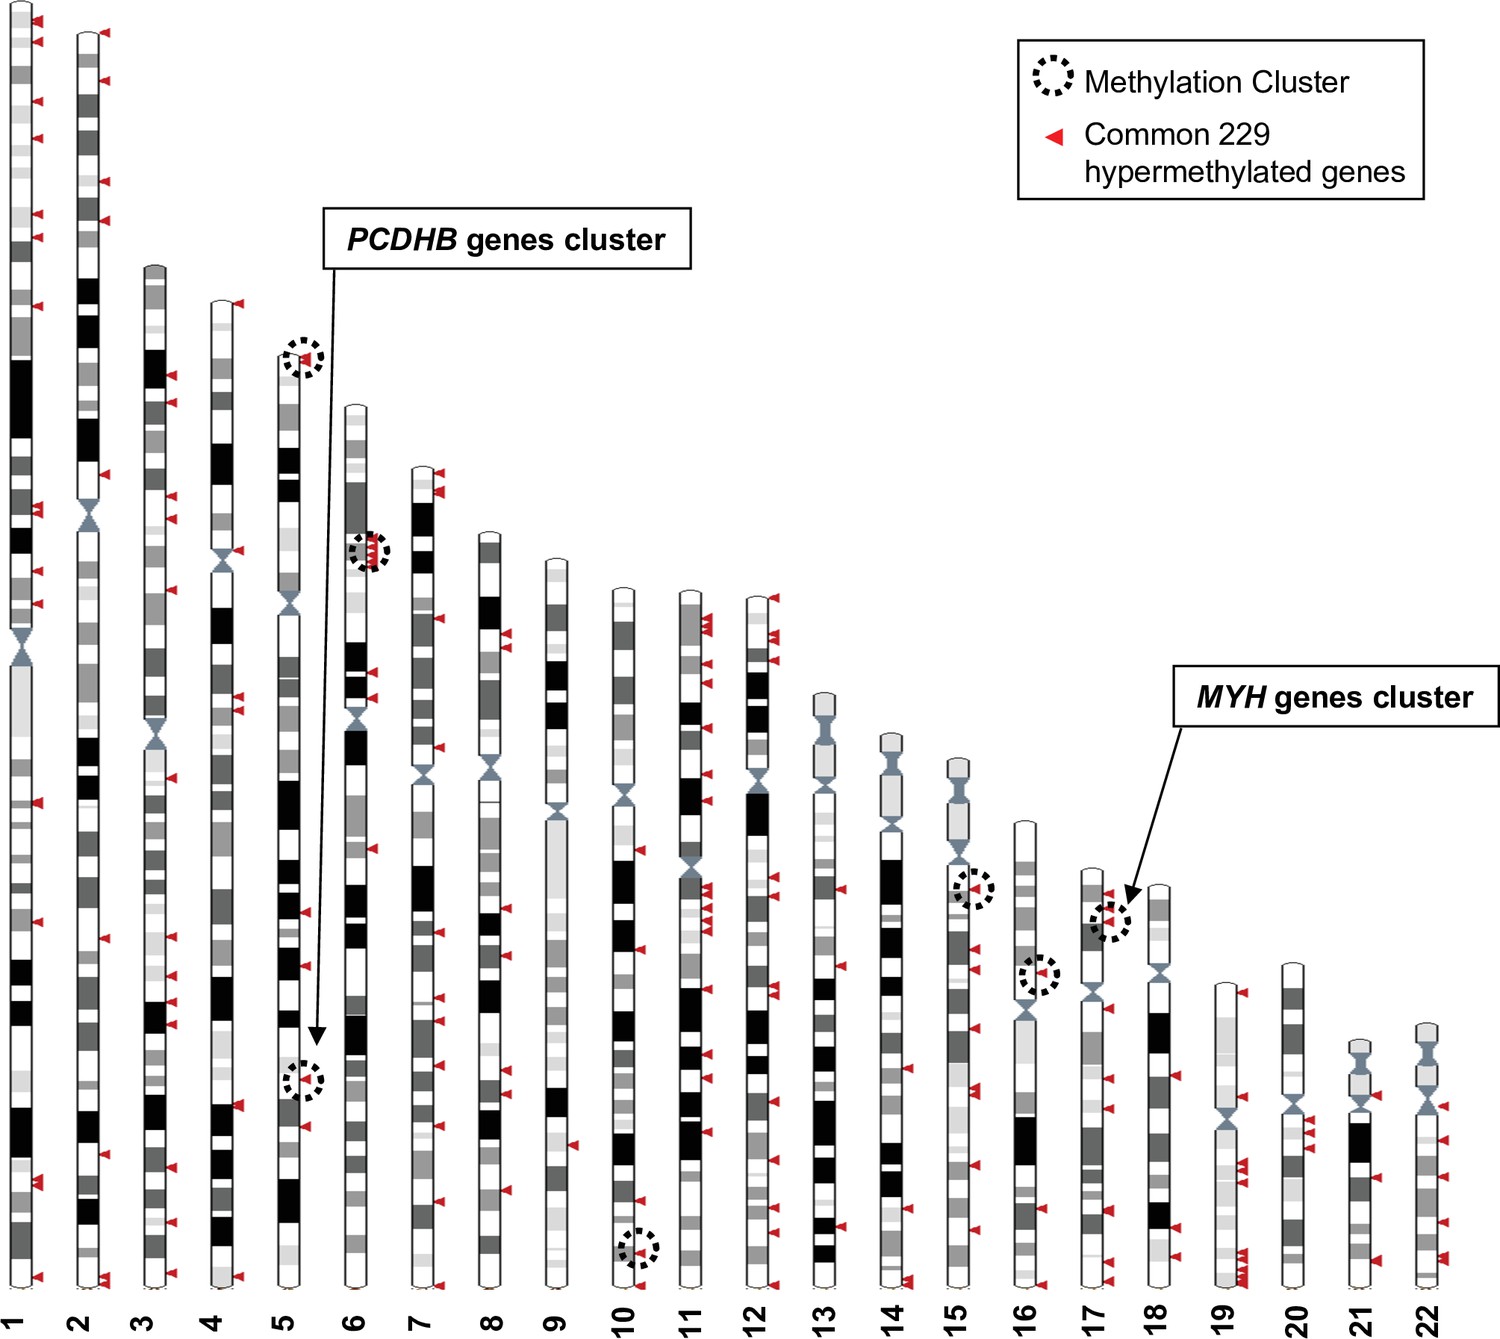
Genomic distribution of the 229 commonly hypermethylated genes in the more aggressive cell lines.
The Ensembl genome browser (http://www.ensembl.org, view on karyotype) was used to map the 229 hypermethylated genes to the human genome. Sex chromosomes were excluded from the analysis. Each arrowhead could correspond to several genes. Methylation clusters are indicated by dotted line circles. Chromosome 5 and 6 circles correspond to two clusters that are too close to be separated on this scale.
Figure 2—figure supplement 1
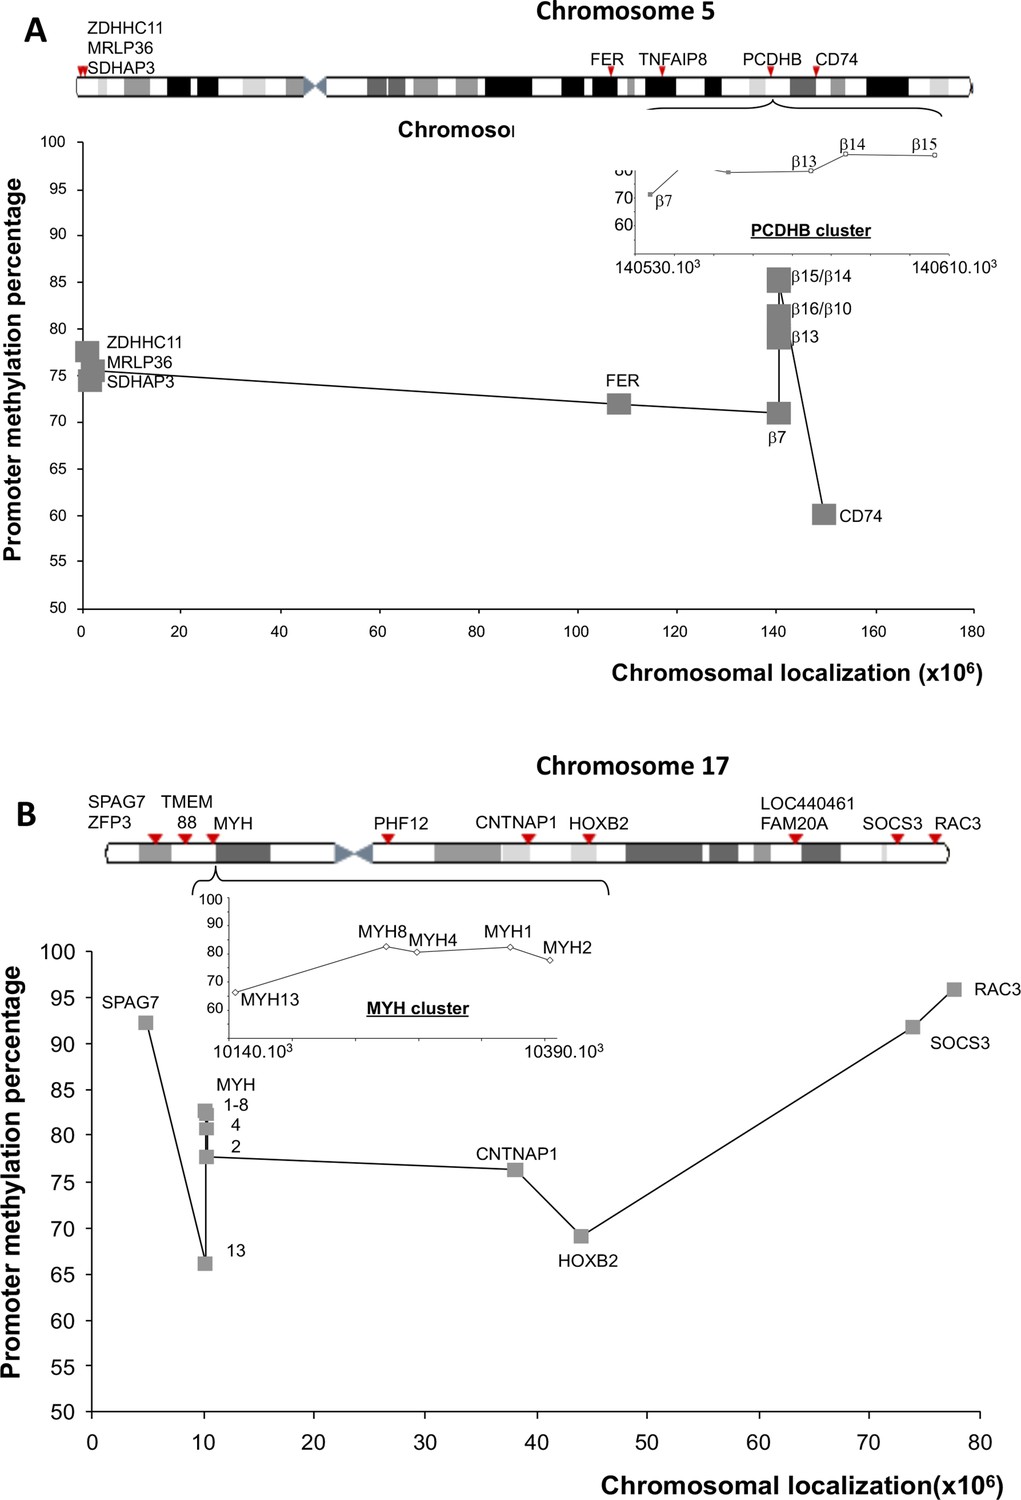
Examples of genomic localization of the genes hypermethylated in the most aggressive cell lines.
Promoter methylation scores correspond to the average methylation values at CpG positions located in the promoter regions showing an increased methylation above 20% in WM266-4 compared to WM115 cells. The genes are indicated on the ‘band giemsa-related’ representation (arrows). The graph shows genes with at least two CpGs in the promoter region with DNA methylation differences over 40% between WM266-4 and WM115 cells (grey squares). (A) Localization and promoter methylation score of nine hypermethylated genes found on chromosome 5. The PCDHB genes cluster is magnified in the insert. (B) Localization and promoter methylation score of 15 hypermethylated genes found on chromosome 17; five of them belong to the MYH1 cluster (insert).
Figure 2—figure supplement 2
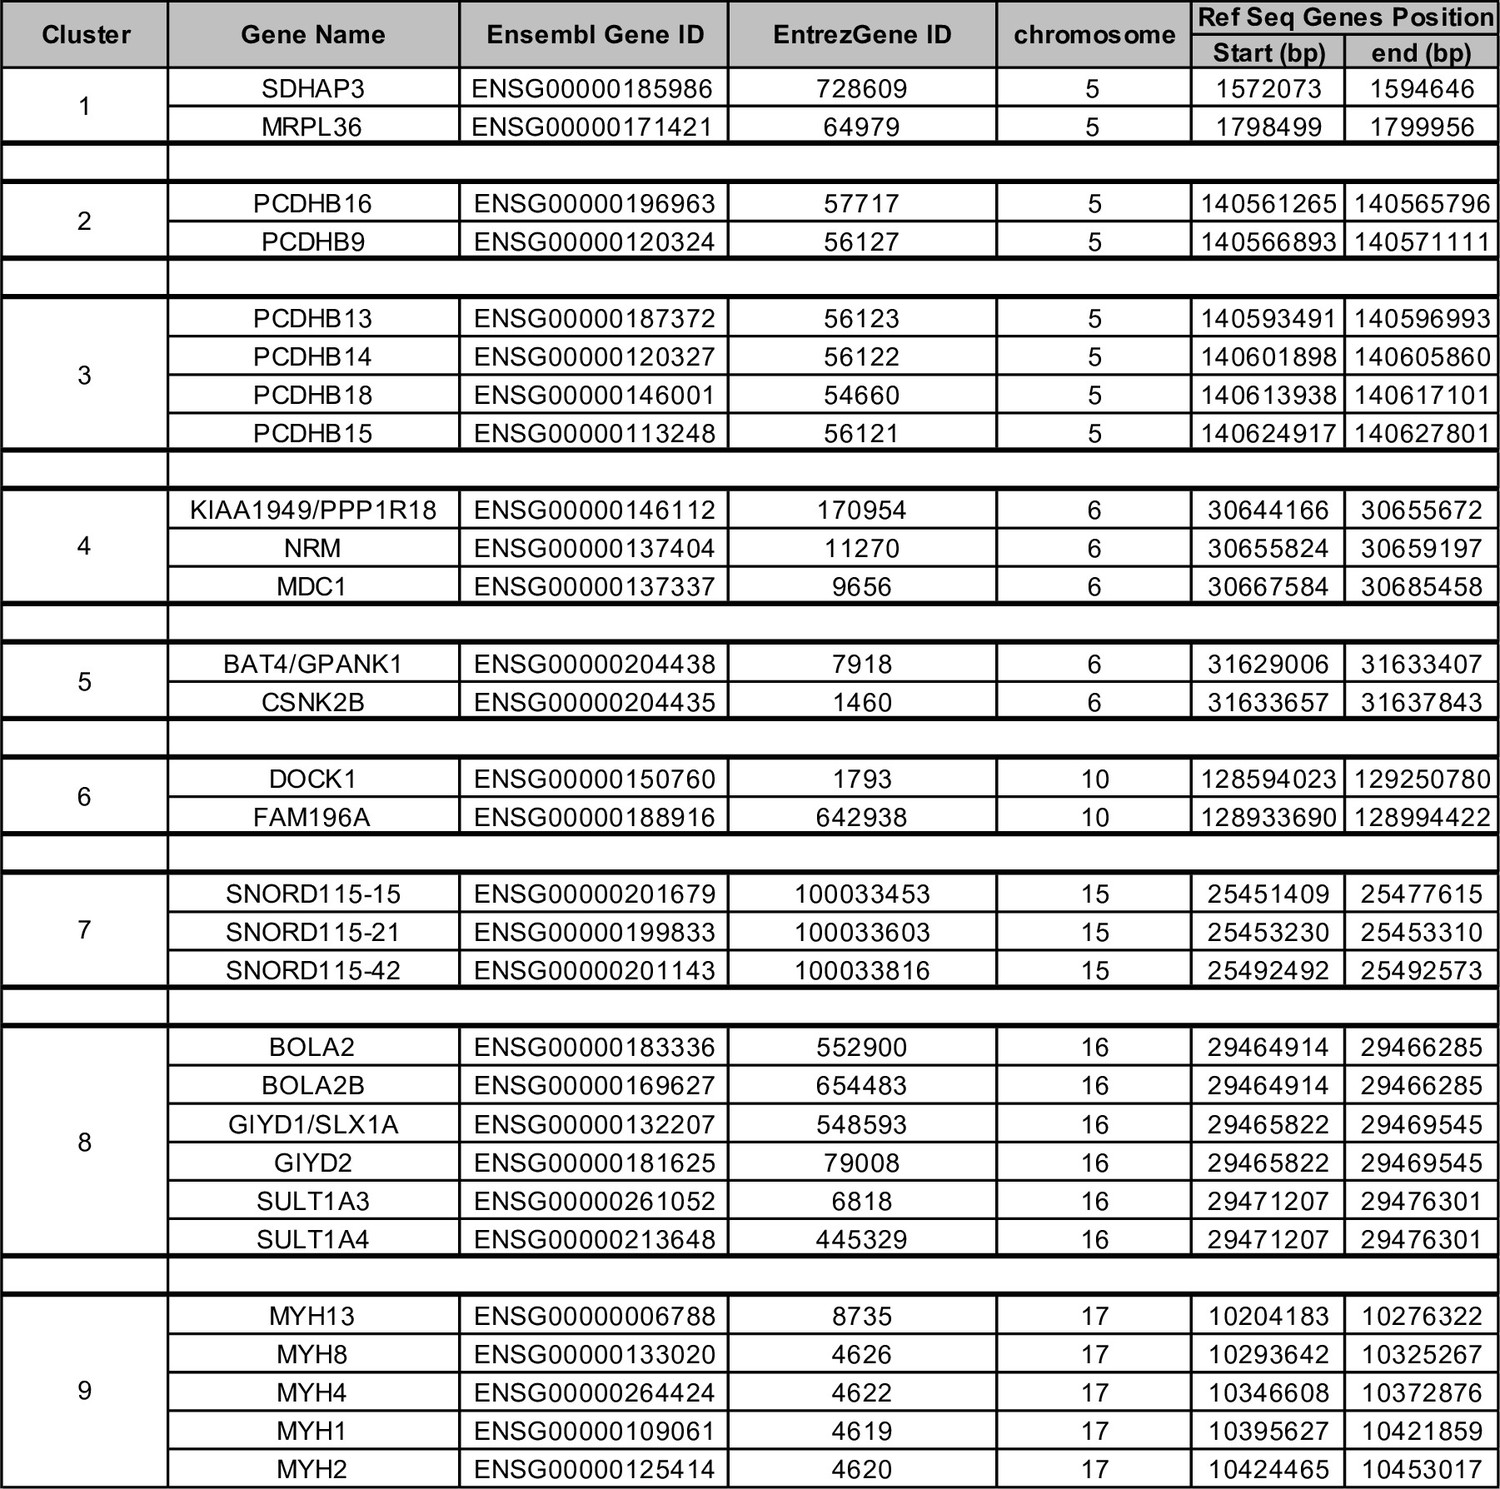
Clusters of hypermethylated genes identified by the oriented strategy.
Nine methylation clusters containing 29 genes on six chromosomes.
Figure 2—figure supplement 3
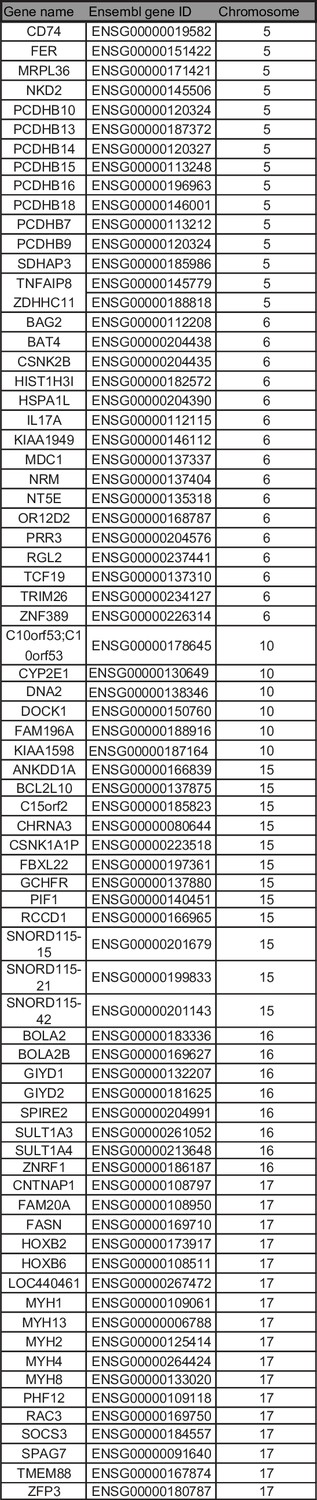
List of the 74 hypermethylated genes found on six chromosomes bearing at least one cluster.
Figure 3 with 1 supplement
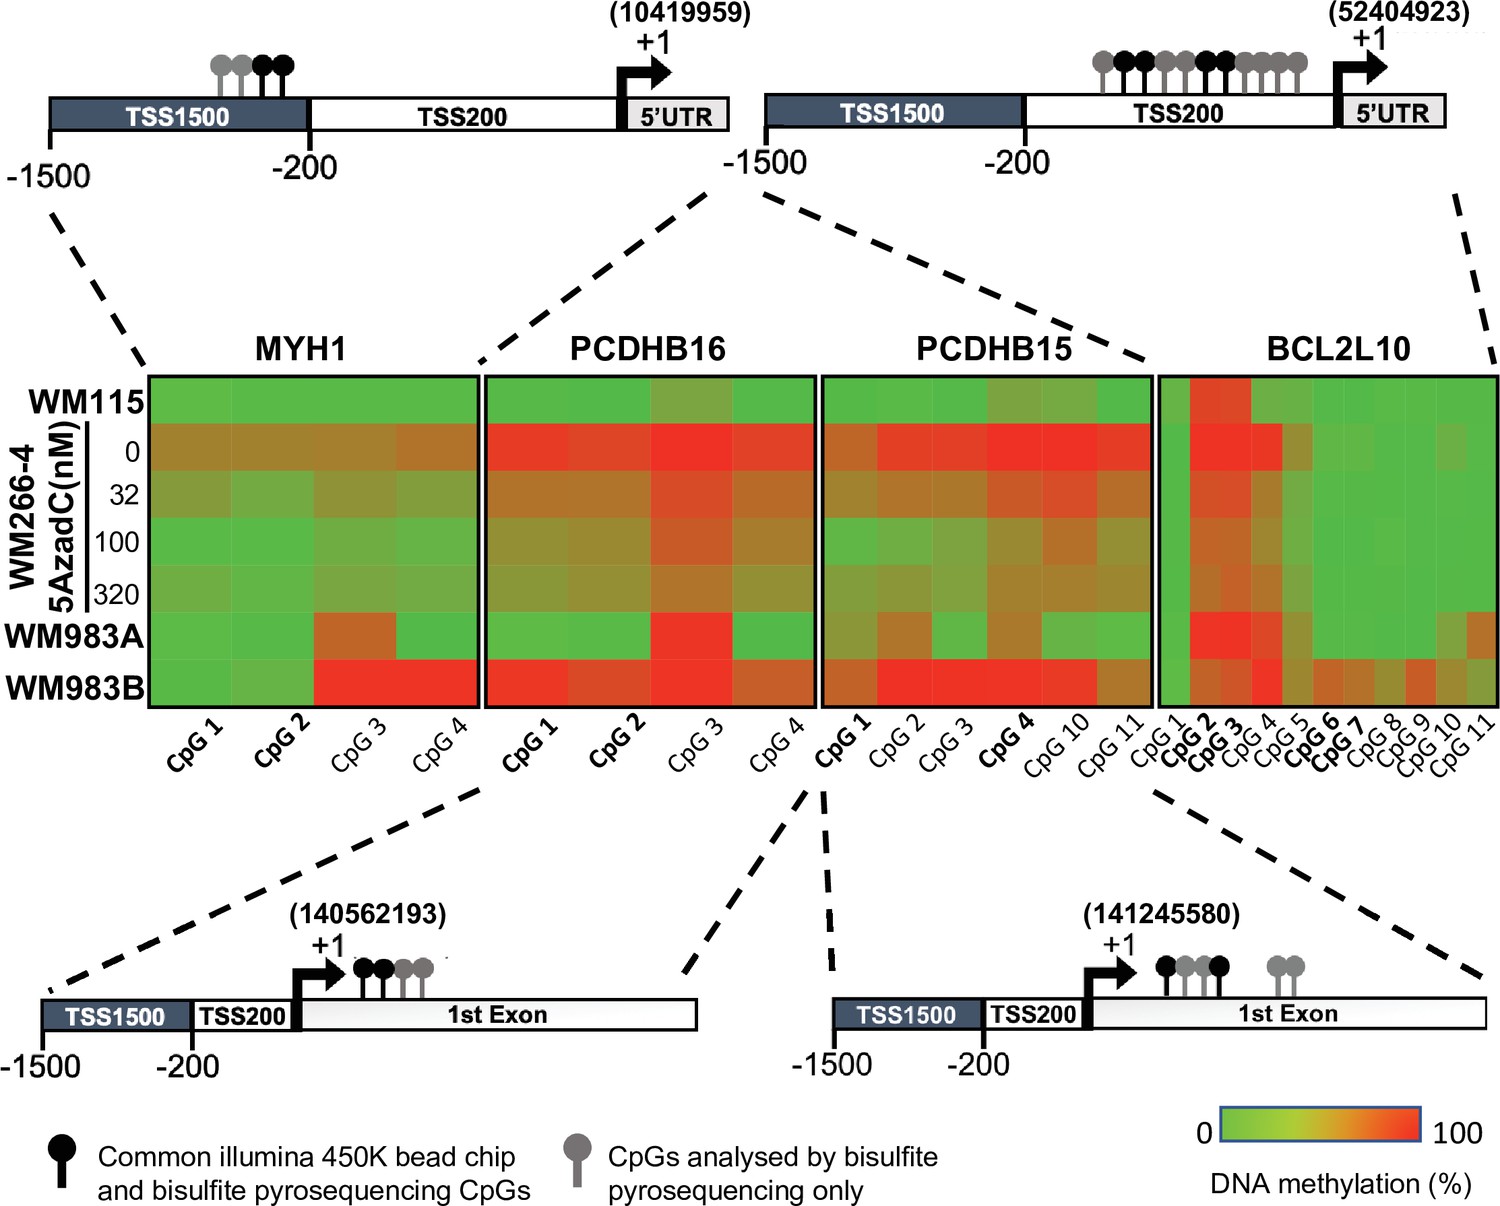
Promoter hypermethylation of the candidate genes in cell lines.
(A) Shown is the localization of all the CpGs analysed (lollipops) on the four selected genes (MYH1, PCDHB15, PCDHB16, and BCL2L10). The CpGs present on the 450 k array are in bold type (black lollipops). The heatmap indicates the DNA methylation percentage (red = 100 and green = 0) of the indicated CpGs in each gene and each cell line. WM115 and WM983A are primary cell lines derived from two patients. WM266-4 and WM983B are the cutaneous and lymph node metastasis counterpart. WM266-4 cells were treated with daily doses of 5AzadC (32, 100, and 320 nM) 72 hr before genomic DNA extraction.
Figure 3—figure supplement 1
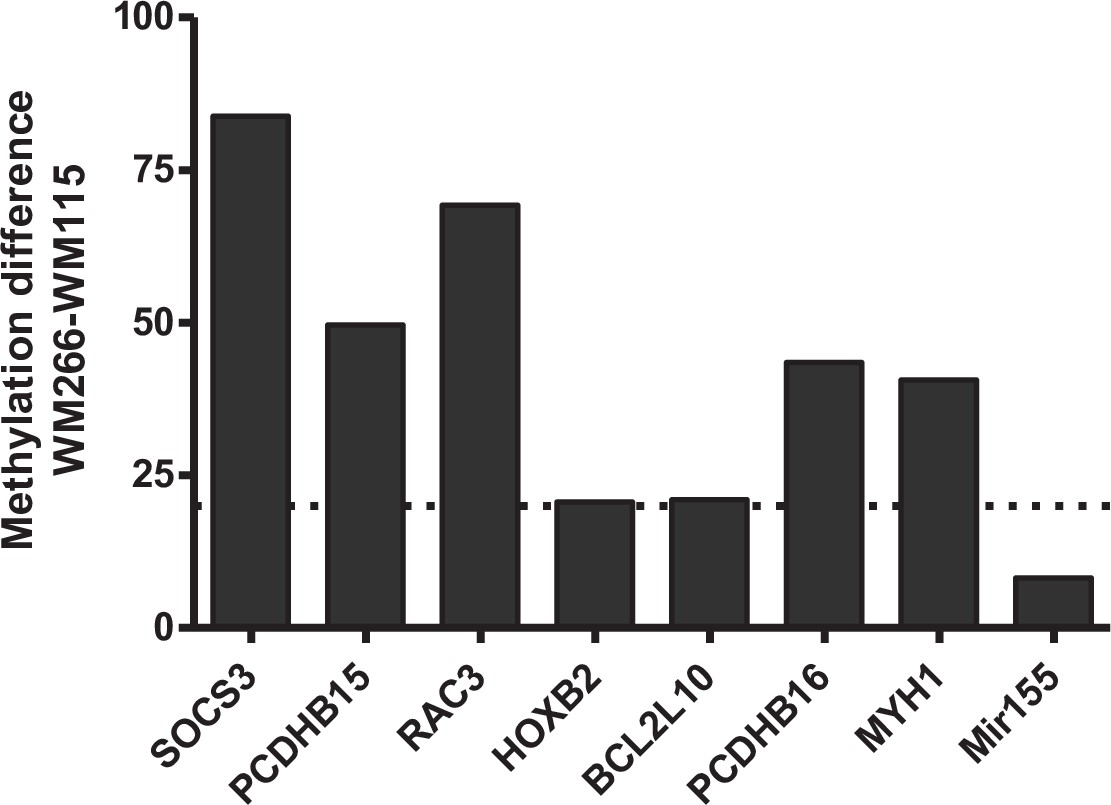
Promoter hypermethylation of the candidate genes in WM266-4 vs WM115 cells.
Hypermethylation (methylation difference ≥20%: dotted line) for all candidate genes analysed by bisulfite-pyrosequencing.
Figure 4 with 2 supplements
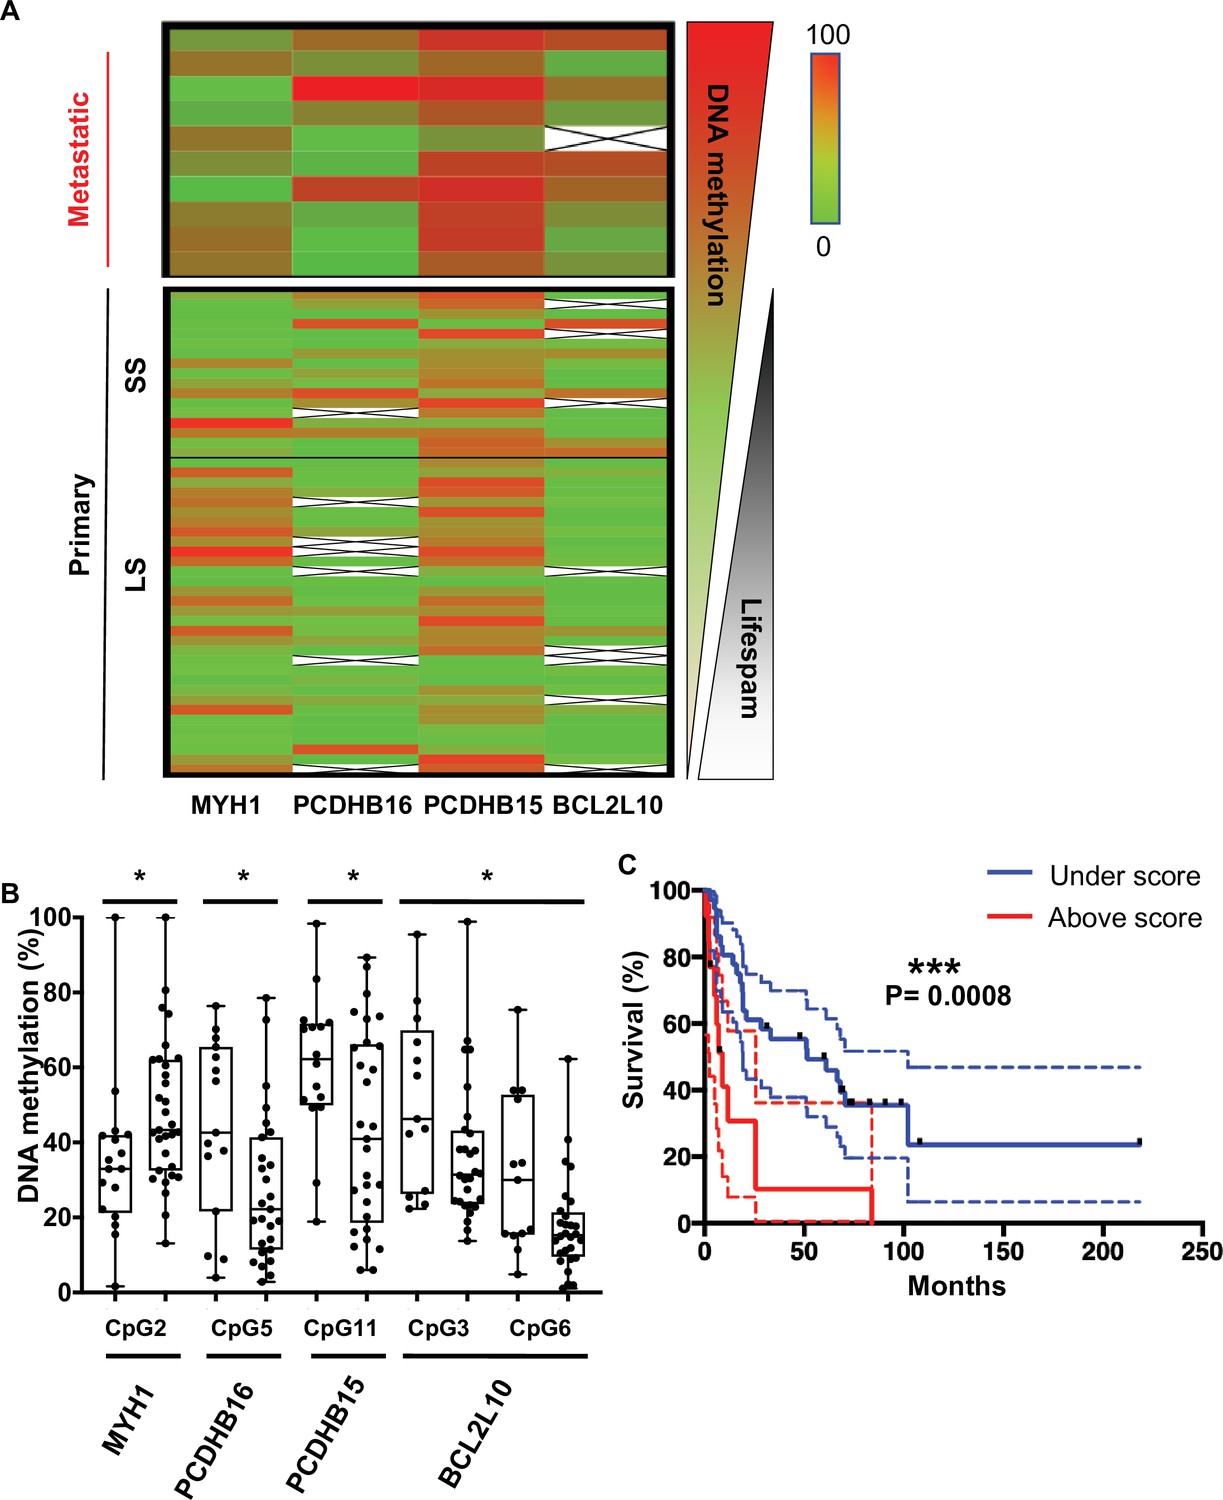
CpGs DNA methylation in primary melanomas predicts patient outcome.
(A) The heatmap shows the median DNA methylation of analysed CpGs for each gene in metastatic (n = 10) and primary (n = 49) patient samples. Primary samples are divided by a black line indicating the cut-off at 1 year between the short survival and long survival (SS [left] and LS [right]). (B) DNA methylation changes in selected CpGs between SS (left box) and LS (right box) patients, respectively (n = 49). Fisher test to analyse variances and t-test were performed, *p<0.05. (C) Kaplan–Meier curve of patients’ survival based on the methylation score calculated for the five CpGs reported in panel B. The methylation score = 2 corresponds to at least two CpGs that showed a methylation difference >15% when compared to the DNA methylation median of the primary metastasis.
Figure 4—figure supplement 1
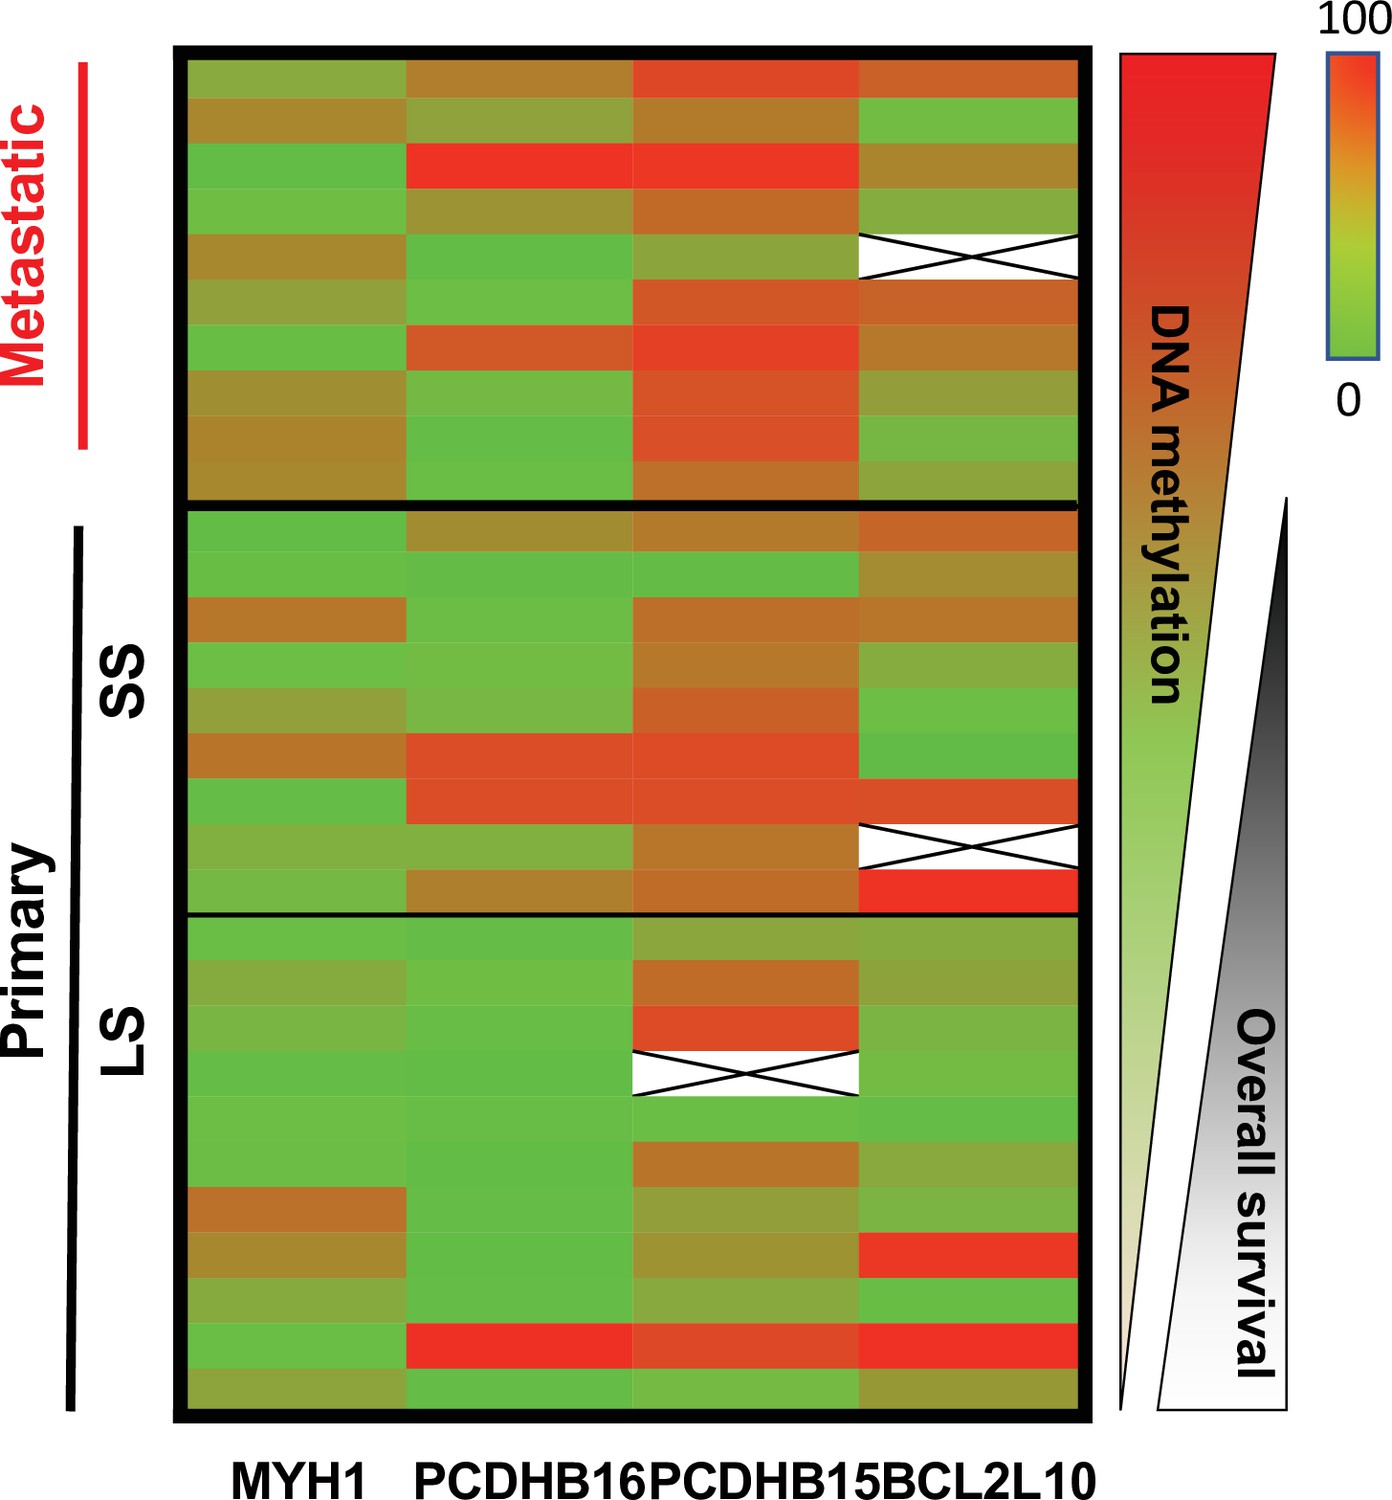
Heatmap of DNA methylation of MYH1, PCDHB16, PCDHB15, and BCL2L10 in the first set of 10 metastatic melanoma patient sample and 20 primary patient melanoma.
The median DNA methylation of the analysed CpG for each gene is indicated as percentage and overall survival in months. Primary samples are divided by a small black line indicating the cut-off at 1 year between the short survival and long overall survival (SS and LS).
Figure 4—figure supplement 2
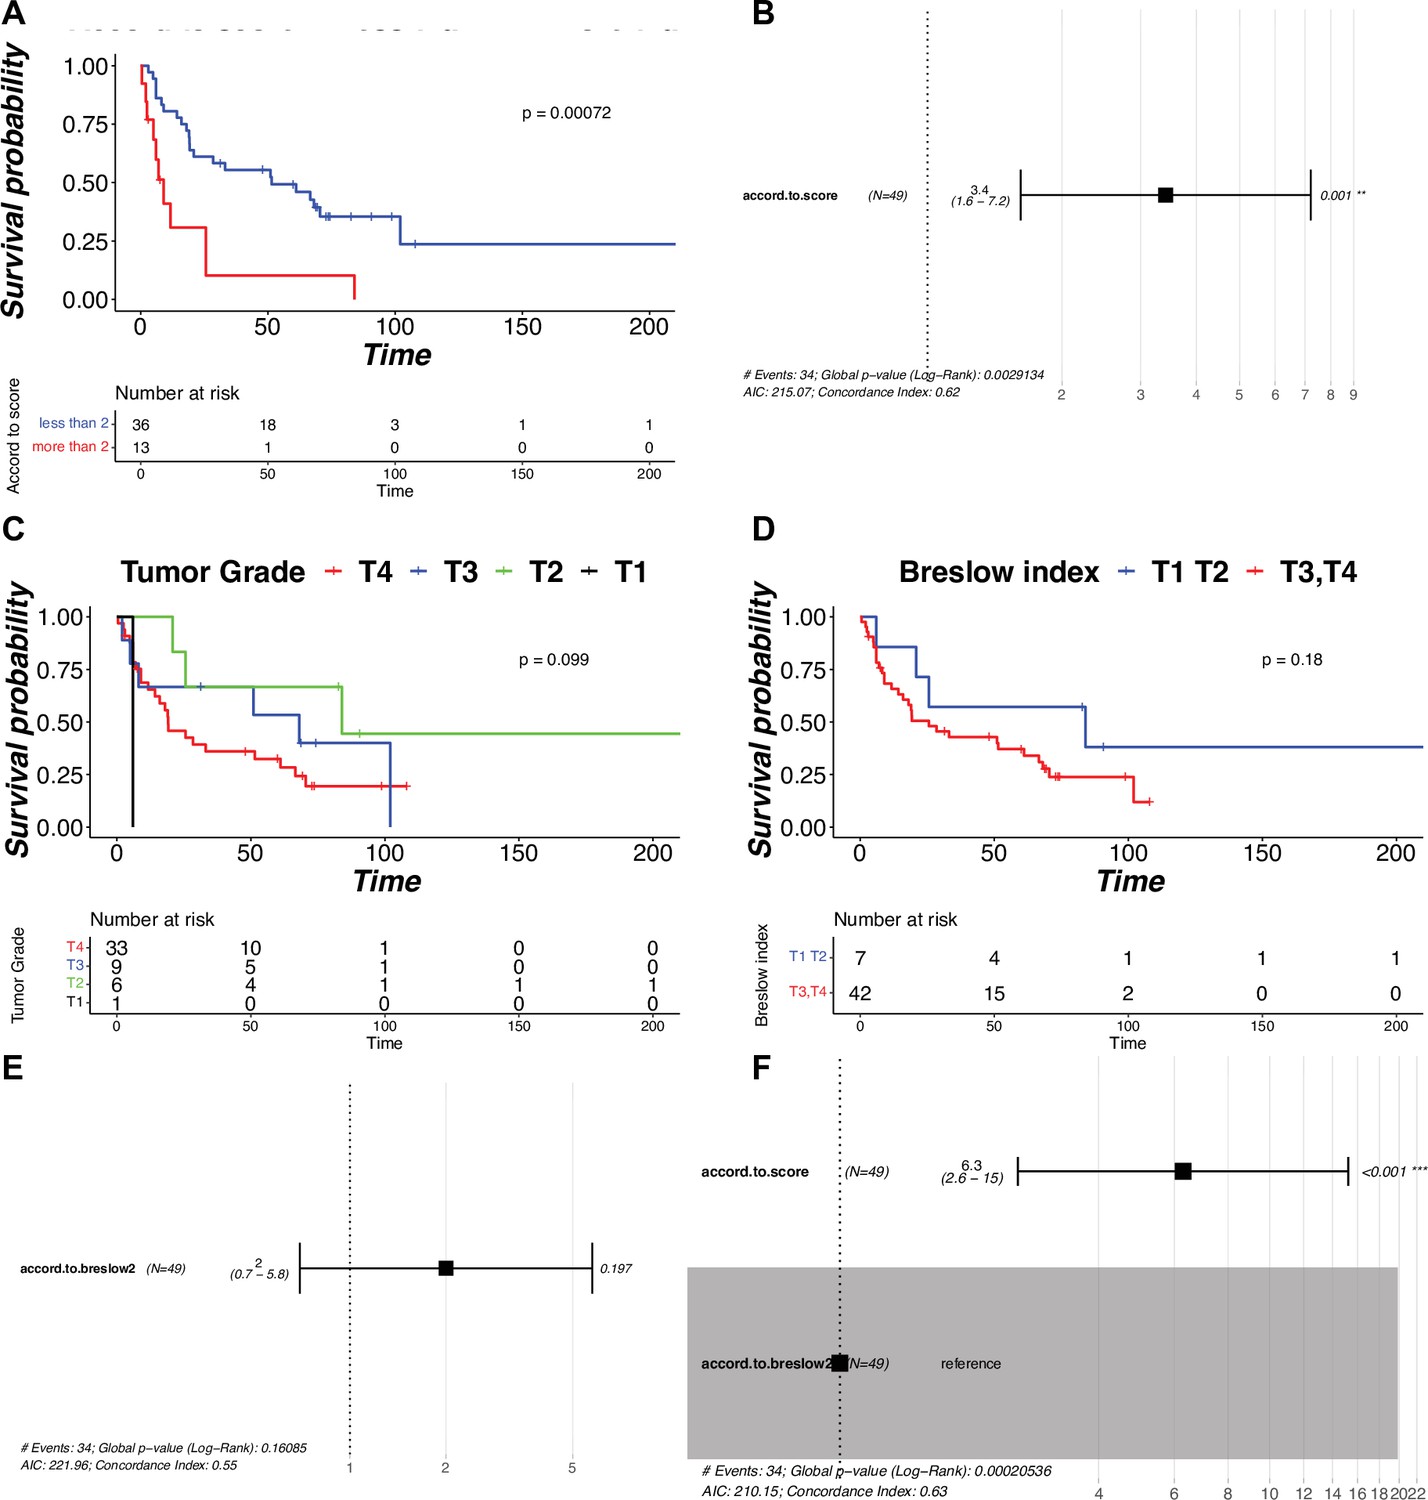
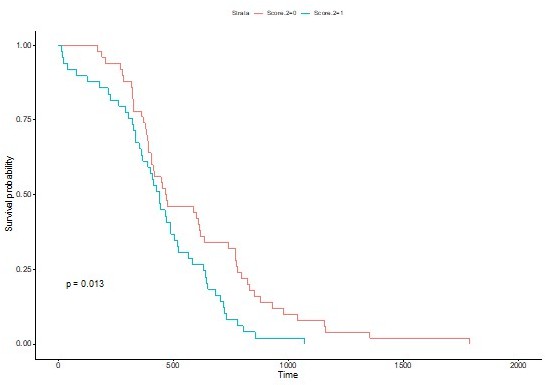
The DNA methylation score is a better prognostic factor than classical used clinical parameter Breslow index.
(A) Kaplan–Meier curve of patients based on the methylation score in the 49 primary melanoma samples. (B) Hazard ratio plot calculated from our methylation score on the 49 primary melanoma samples. (C) Kaplan–Meier curve of patients according to the primary tumour grade defined by the American Joint Committee on Cancer (AJCC) staging system of melanoma from Breslow index (primary tumour T1=less than 1 mm, T2=less than 2 mm, T3=between 2 and 4 mm, and T4=more than 4 mm). (D) Kaplan–Meier curve of patients based on the Breslow index in the 49 primary melanoma samples (less than 2 in blue: T1 and T2 grade; more than 2 in red: T3 and T4 grades). (E) Hazard ratio plot calculated from Breslow index on the 49 primary melanoma samples. Hazard ratio plot calculated from the interaction between our methylation score and the Breslow index on the 49 primary melanoma samples.
Author response image 1
Tables
Key resources table
| Reagent type (species) or resource | Designation | Source or reference | Identifiers | Additional information |
|---|---|---|---|---|
| Cell line (Homo sapiens) | WM115 | ATCC | CRL-1676 | |
| Cell line (Homo sapiens) | WM-266–4 | ATCC | CRL-1675 | |
| Cell line (Homo sapiens) | WM983A | Coriell Institute | WC00048 | |
| Cell line (Homo sapiens) | WM983B | Coriell Institute | WC00066 | |
| Cell line (Homo sapiens) | M4Be | Bailly and Doré, 1991 | Not applicable | |
| Cell line (Homo sapiens) | TW12 | Bailly and Doré, 1991; Bertucci et al., 2007; Thomas et al., 1995 | Not applicable | |
| Cell line (Homo sapiens) | M4BeS2 | Clark et al., 2000 | Not applicable | |
| Biological sample (Homo sapiens) | Department of Pathology, IUCT-O Toulouse Hospital (France) | Primary melanomas (n=12), lymph node metastases (n = 7), and cutaneous metastases (n=3) | ||
| Biological sample (Homo sapiens) | Department of Experimental Oncology, European Institute of Oncology, Milan (Italy) | Primary melanoma (n = 5) | ||
| Biological sample (Homo sapiens) | Saint John’s Cancer Institute (formerly John Wayne Cancer institute [USA]) | Primary melanomas (n=12) | ||
| Recombinant DNA reagent | Department of Pathology of the Portuguese Oncology Institute of Porto (IPO-Porto) | Primary melanomas (n=20) | ||
| Commercial assay or kit | DNeasy Tissue kit | Qiagen | 69504 | |
| Commercial assay or kit | QiaAmp kit | Qiagen | 965672 | |
| Commercial assay or kit | FFPE RNA/DNA Purification Plus Kit | FFPE RNA/DNA Purification Plus Kit | 54300 | |
| Commercial assay or kit | EpiTect 96 Bisulfite Kit | Qiagen | 59104 | |
| Commercial assay or kit | Infinium Human Methylation 450 K BeadChips | Illumina | WG-310–1003 | |
| Commercial assay or kit | PyroGold SQA reagent kit | Qiagen | 972824 | |
| Recombinant DNA reagent | HotStarTaq DNA polymerase | Qiagen | 203207 | |
| Software and algorithm | GenomeStudio | Illumina | Version 2011.1 | |
| Software and algorithm | R studio | RStudio, Inc | RStudio 2021.09.2 382 ‘Ghost Orchid’ Release. R version 4.1.2 | |
| Software and algorithm | PyroMark software | Qiagen | V1.0 | |
| Software and algorithm | GraphPad Prims8 | Dotmatics | Version 8 | |
| Software and algorithm | QIAGEN’s Ingenuity Pathway Analysis | Qiagen | 836508 |
Table 1
Clinical pathological features of primary melanoma patients.
| Variables | n (%) |
|---|---|
| Mean age (SD) | 66.40 (15.88) |
| Gender | |
| Male | 26 (53) |
| Female | 23 (47) |
| American Joint Committee on Cancer eighth stages | |
| IV | 12 (24) |
| III | 12 (24) |
| IIIA | 1 (2) |
| IIIB | 2 (4) |
| IIIC | 2 (4) |
| II | 2 (4) |
| IIA | 3 (6) |
| IIB | 6 (12) |
| IIC | 6 (12) |
| IB | 2 (4) |
| unknown | 1 (2) |
| Mutations | |
| NRAS | 1 (2) |
| BRAF | 6 (12) |
| Unknown | 42 (86) |
Additional files
-
Supplementary file 1
Ingenuity Pathway Analysis (IPA) software networks results.
- https://cdn.elifesciences.org/articles/78587/elife-78587-supp1-v2.xls
-
Supplementary file 2
Bisulphite pyrosequencing primer, sequences, and CpG location.
- https://cdn.elifesciences.org/articles/78587/elife-78587-supp2-v2.xls
-
Supplementary file 3
Survival data and signature score for each patient sample.
- https://cdn.elifesciences.org/articles/78587/elife-78587-supp3-v2.xlsx
-
MDAR checklist
- https://cdn.elifesciences.org/articles/78587/elife-78587-mdarchecklist1-v2.docx
-
Source code 1
R scripts.
- https://cdn.elifesciences.org/articles/78587/elife-78587-code1-v2.zip
Download links
A two-part list of links to download the article, or parts of the article, in various formats.
Downloads (link to download the article as PDF)
Open citations (links to open the citations from this article in various online reference manager services)
Cite this article (links to download the citations from this article in formats compatible with various reference manager tools)
DNA methylome combined with chromosome cluster-oriented analysis provides an early signature for cutaneous melanoma aggressiveness
eLife 11:e78587.
https://doi.org/10.7554/eLife.78587


