A high-throughput yeast display approach to profile pathogen proteomes for MHC-II binding
- Koch Institute for Integrative Cancer Research, United States
- Department of Biological Engineering, Massachusetts Institute of Technology, United States
- Computer Science and Artificial Intelligence Laboratory, Massachusetts Institute of Technology, United States
- Department of Electrical Engineering and Computer Science, Massachusetts Institute of Technology, United States
- Ragon Institute of MGH, MIT and Harvard, United States
Figures
Figure 1 with 1 supplement

Overview of library and selections.
(a) The defined library contains pathogen proteome peptides (length 15, sliding window 1). Poor binding peptides are displaced with addition of protease, competitor peptide, and HLA-DM. (b) Schematic of doped and undoped libraries: in the doped selection strategy, the library is added to a library of null, non-expressing constructs. (c) Representative flow plots showing enrichment of MHC-expressing yeast over rounds of selection for the library containing SARS-CoV-2 and SARS-CoV peptides on HLA-DR401.
Figure 1—figure supplement 1
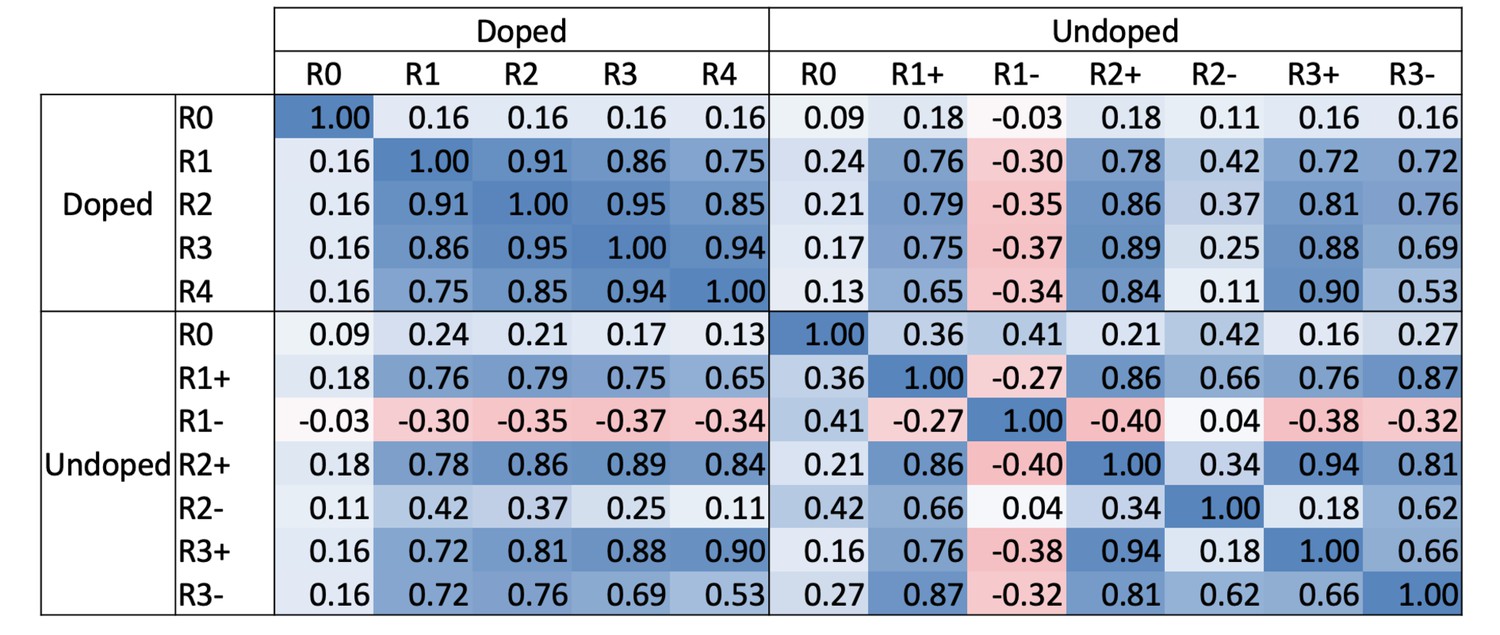
Correlations between selection rounds.
Pearson correlation for HLA-DR401 SARS-CoV-2 and SARS-CoV defined library members (+/- signs indicate enriched (+) or not enriched (-) yeast in undoped library; rounds of selection are indicated, e.g. ‘R1’ indicates ‘Round 1’ and ‘R0’ is the unselected ‘Round 0’ library).
Figure 2 with 3 supplements
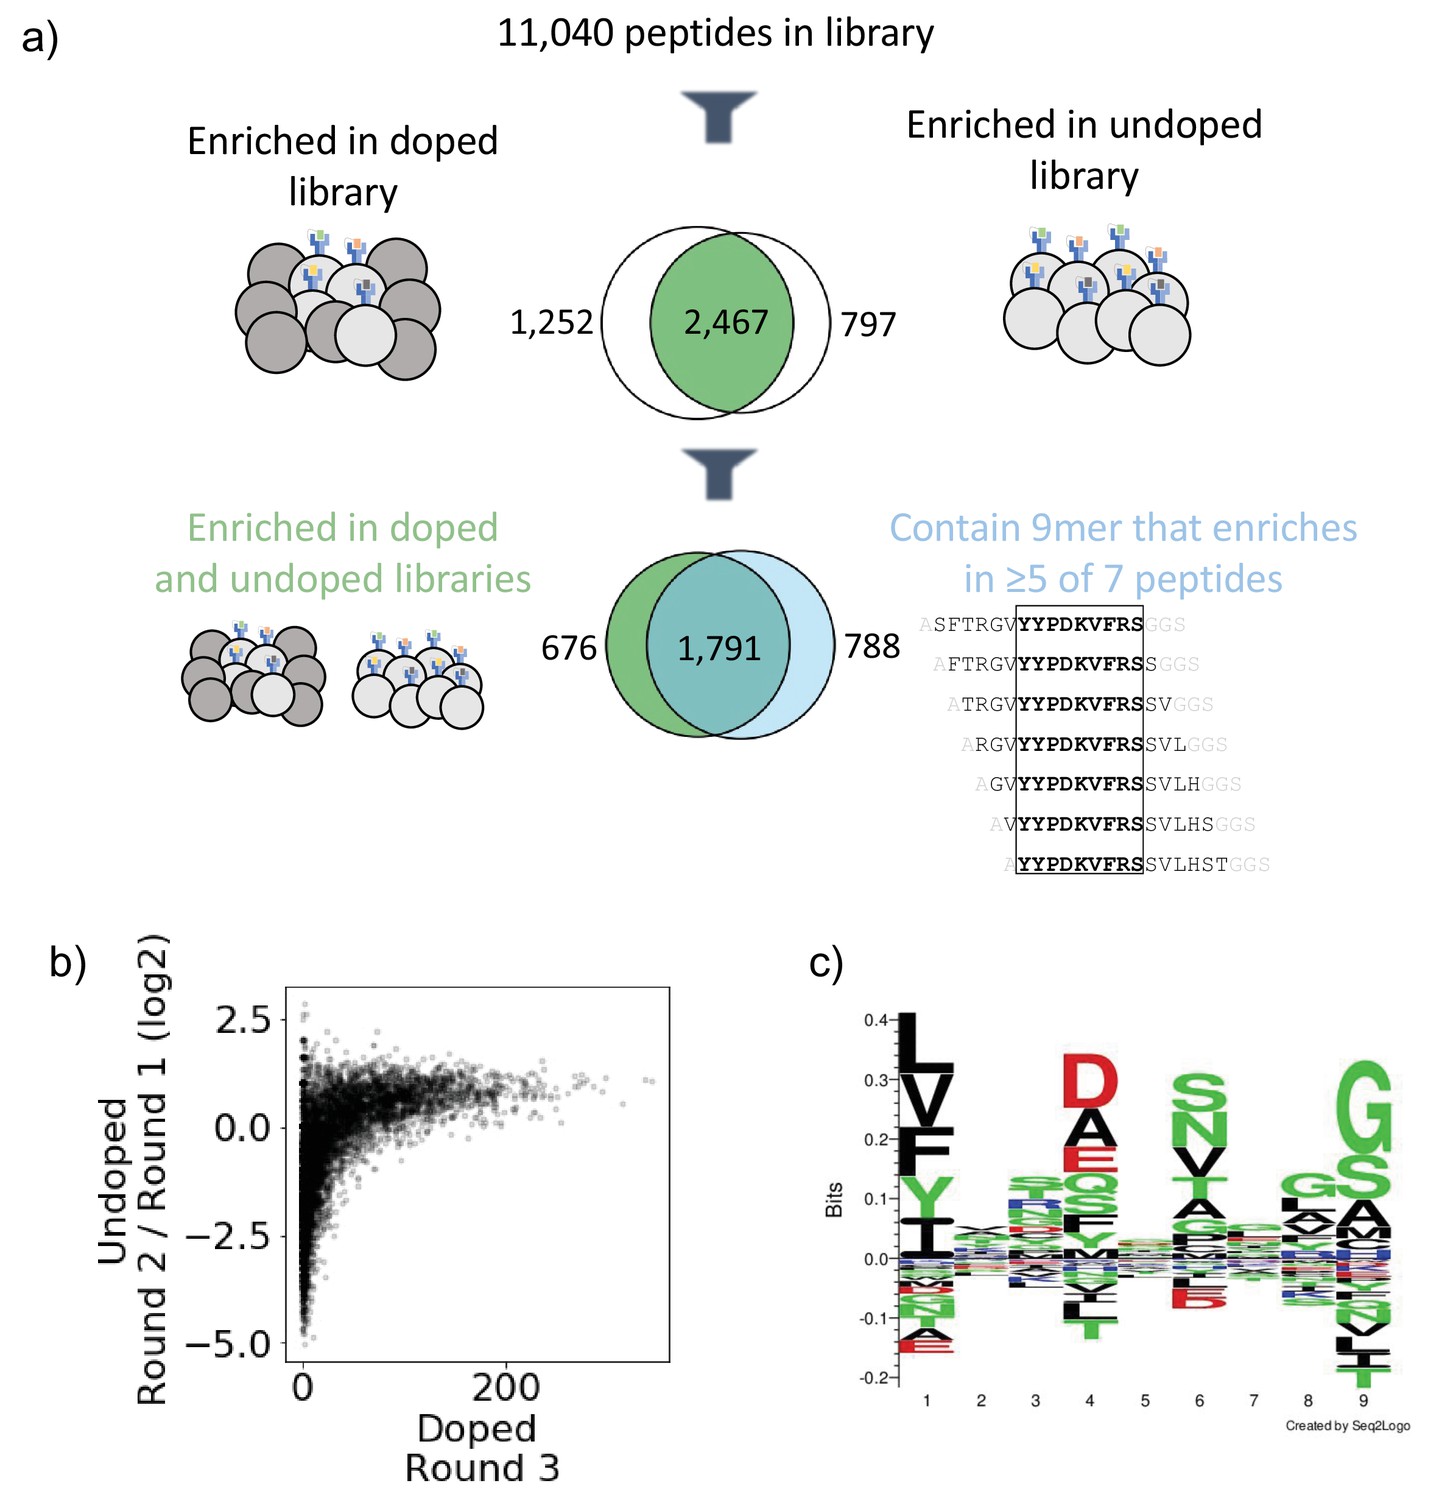
Output of selections and analysis of selection data.
(a) Overview of filtering peptides and correspondence between selection strategies for SARS-CoV and SARS-CoV-2 library on HLA-DR401. Peptides are filtered for enrichment in both doped and undoped libraries. Further, the relationship between these peptides and peptides which contain a 9mer that is enriched in five or more of the seven peptides containing it is shown. (b) Relationships between enrichment in doped and undoped libraries. Absolute counts following Round 3 of selection of the doped library are plotted against the log2 fold change between read fraction for peptides in Round 2 and Round 1. Data are shown for the library on HLA-DR401. (c) Sequence logo of 2467 peptides that enriched in both doped and undoped selected libraries for HLA-DR401. Registers are inferred with a position weight matrix-based alignment method. Logos were generated with Seq2Logo-2.0.
Figure 2—figure supplement 1
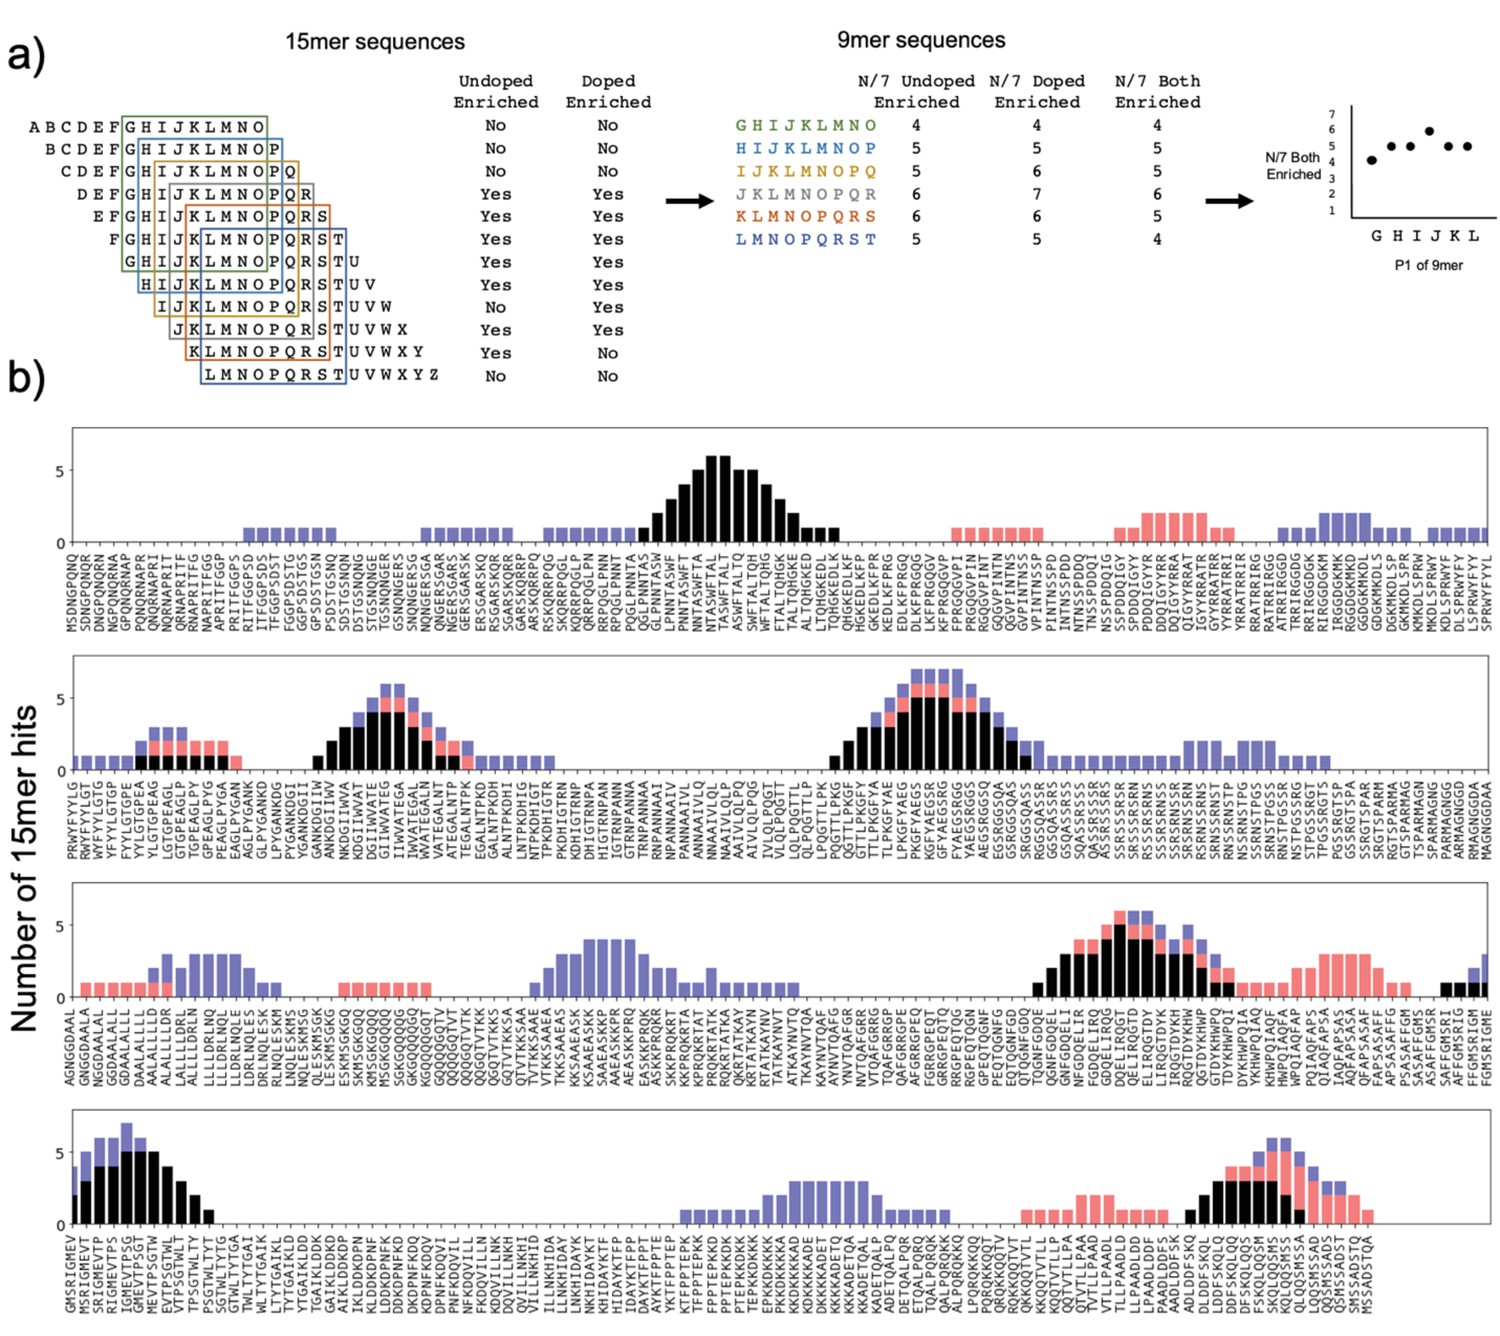
Utilizing overlapping peptides to call high-confidence peptides.
(a) Schematic showing use of overlapping 15mers, containing redundant 9mers. Each 9mer is present in seven 15mers; for each 9mer, we calculate how many of these seven 15mers enriched. (b) Number of peptides containing a given 9mer that are hits, for SARS-CoV-2 nucleocapsid on HLA-DR401. Black = hits in both undoped and doped libraries; blue = hits in undoped library only; red = hits in doped library only. Enrichment categories are stacked, for a maximum of seven 15mer hits, since each 9mer is present in seven 15mers.
Figure 2—figure supplement 2
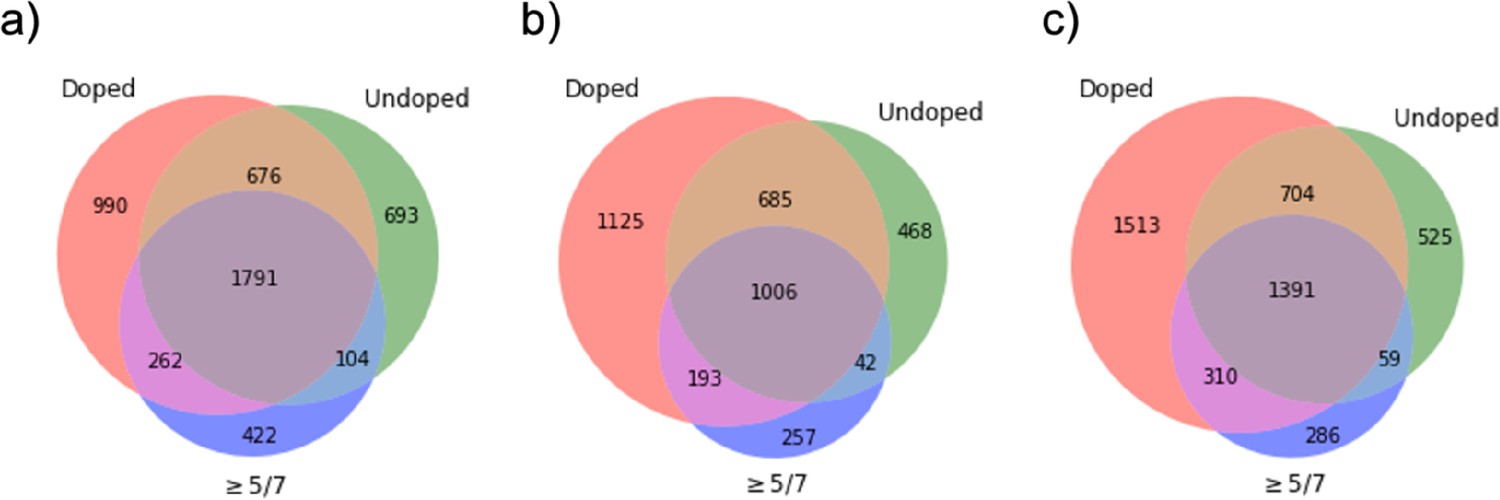
Full Venn diagrams.
Full Venn diagrams showing relationships between peptides which enriched in the doped library (‘Doped’) and undoped library (‘Undoped’), and contained a 9mer peptide which enriched in five or more of the seven 15mers containing it (‘≥5/7’), for (a) HLA-DR401, (b) HLA-DR402, and (c) HLA-DR404.
Figure 2—figure supplement 3
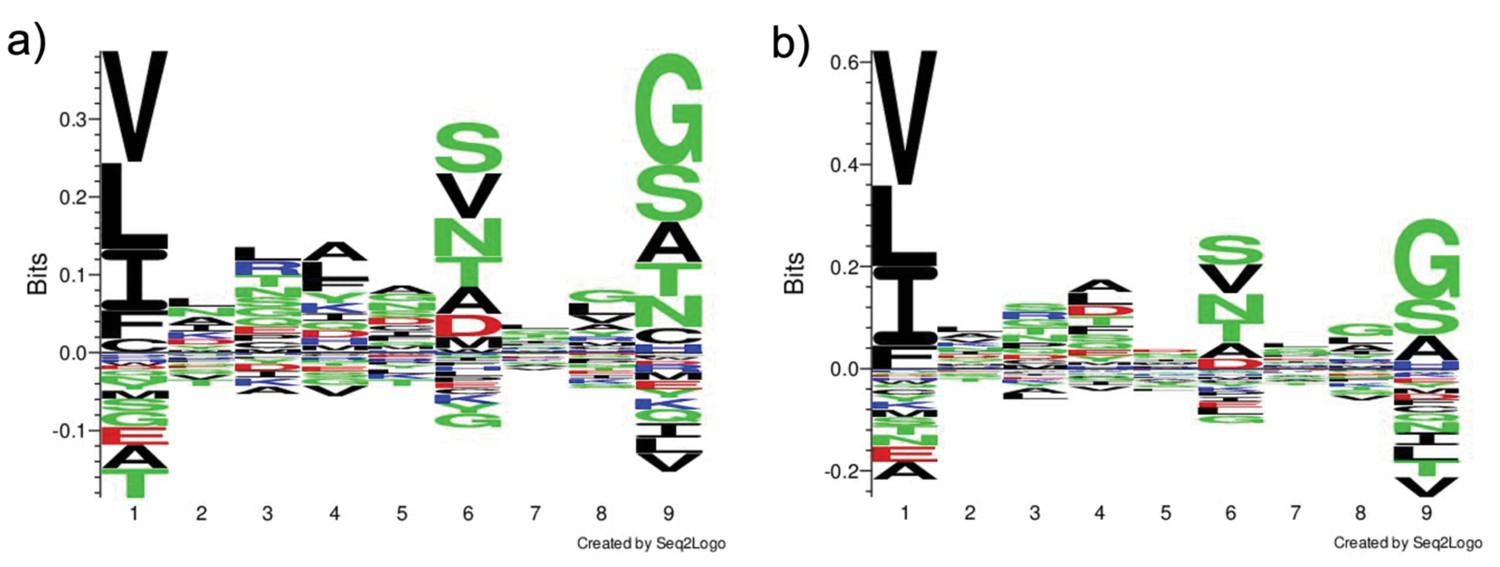
Sequence logo for HLA-DR402 and HLA-DR404.
(a) HLA-DR402: Sequence logo of 1690 peptides that enriched in both doped and undoped selections of the SARS-CoV and SARS-CoV-2 library for HLA-DR402. (b) HLA-DR404: Sequence logo of 2094 peptides that enriched in both doped and undoped selections of the SARS-CoV and SARS-CoV-2 library for HLA-DR404. Logos were generated with Seq2Logo-2.0.
Figure 3
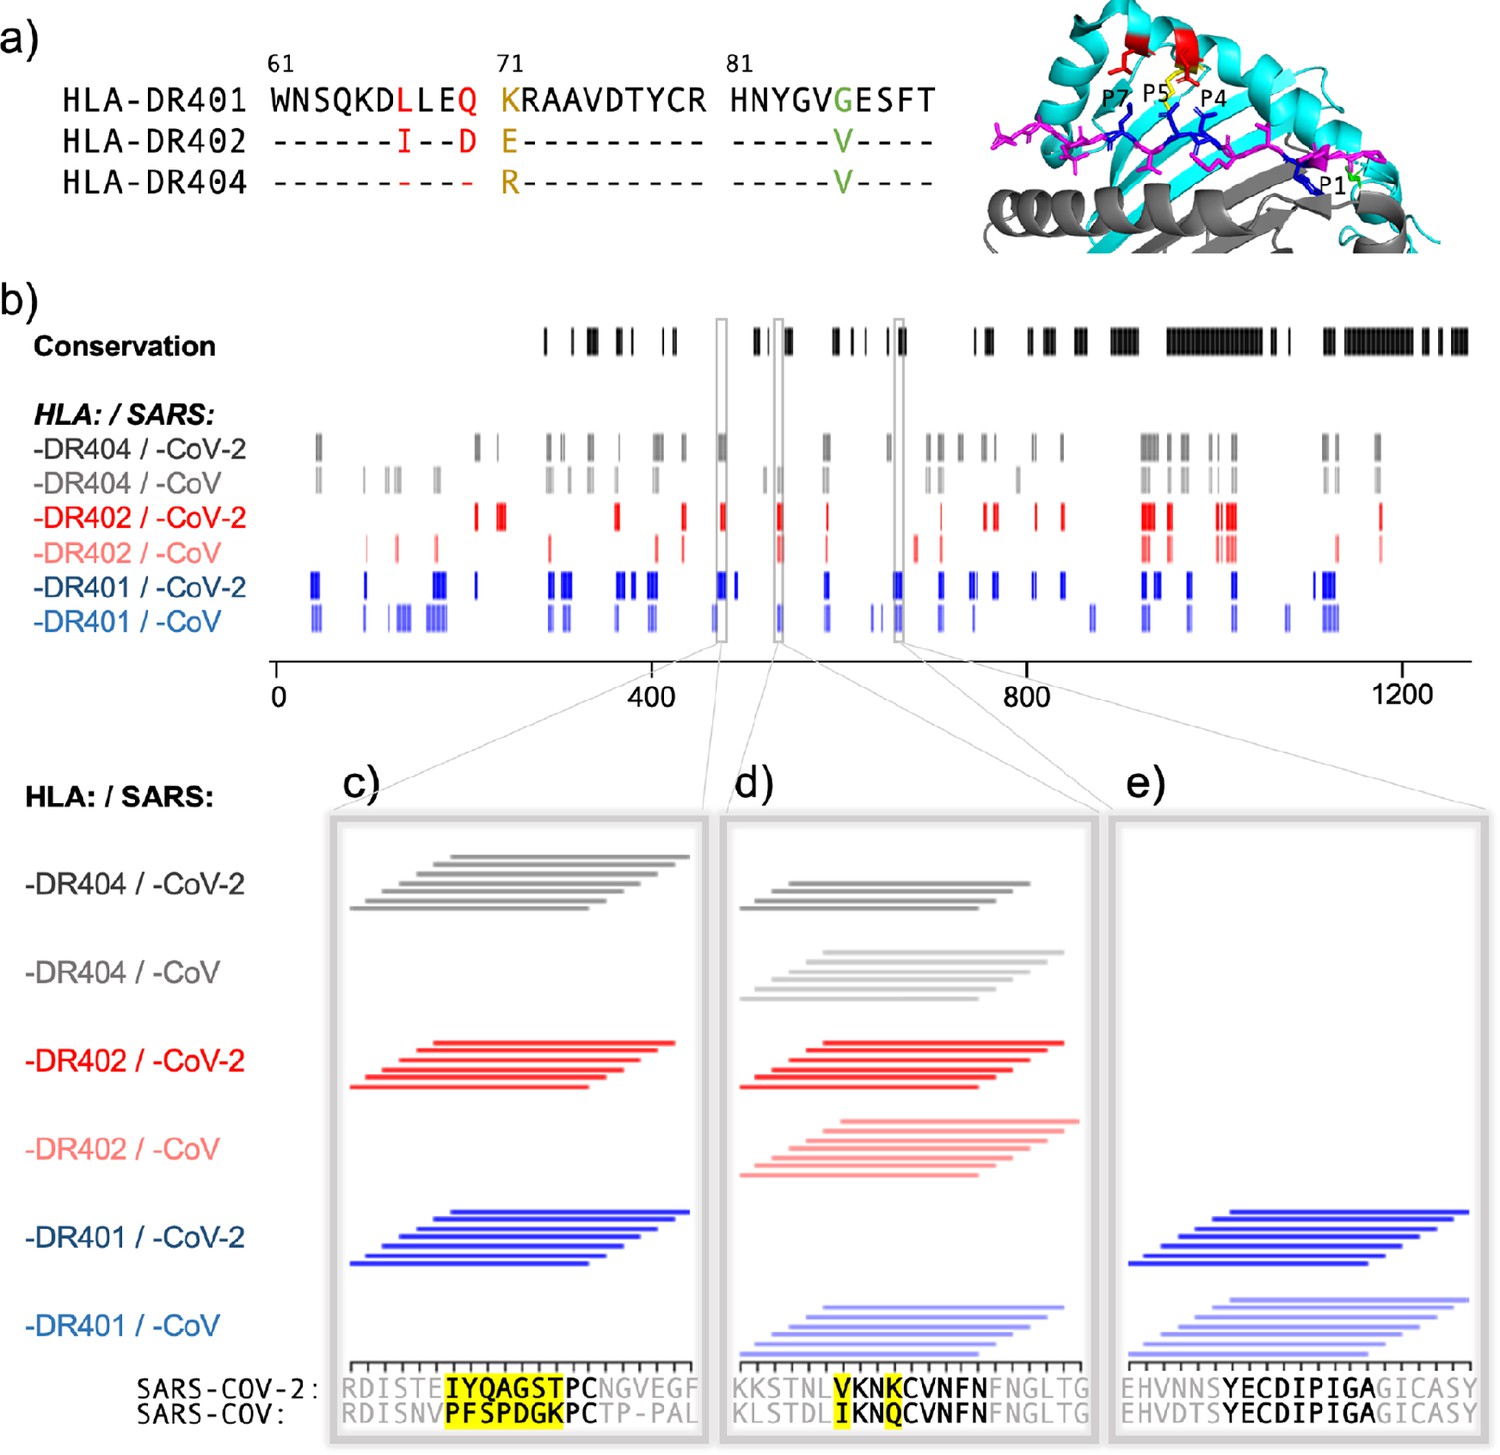
Comparing HLA-DR401, HLA-DR402, and HLA-DR404 for binding to related spike proteins from SARS-CoV-2 and SARS-CoV.
(a) Sequence alignment showing sequence differences in HLA-DR402 and HLA-DR404 compared to HLA-DR401 and highlighted on HLA-DR401 structure (PDB 1J8H). Colors are: red for amino acids shared between HLA-DR401 and HLA-DR404, green for amino acids shared between HLA-DR402 and HLA-DR404, and yellow for amino acids different in all three alleles. Affected peptide positions (P1, P4, P5, P7) are colored in blue and labelled on the structure. (b) Conservation and enrichment of 9mer peptides from SARS-CoV-2 and SARS-CoV spike proteins. Conserved 9mers are indicated in black. If a 9mer along the proteome enriched in five or more of the adjacent peptides containing it, its enrichment is indicated with a vertical line with color for allele (HLA-DR401: blue; HLA-DR402: red; HLA-DR404: gray) and opacity for virus (SARS-CoV-2: dark; SARS-CoV: light). (b–e) Zoomed regions show enrichment of individual 15mer peptides. Only peptides containing the bolded 9mer sequence are shown. Amino acids in the bolded 9mer that are not conserved between SARS-CoV-2 and SARS-CoV are highlighted in yellow.
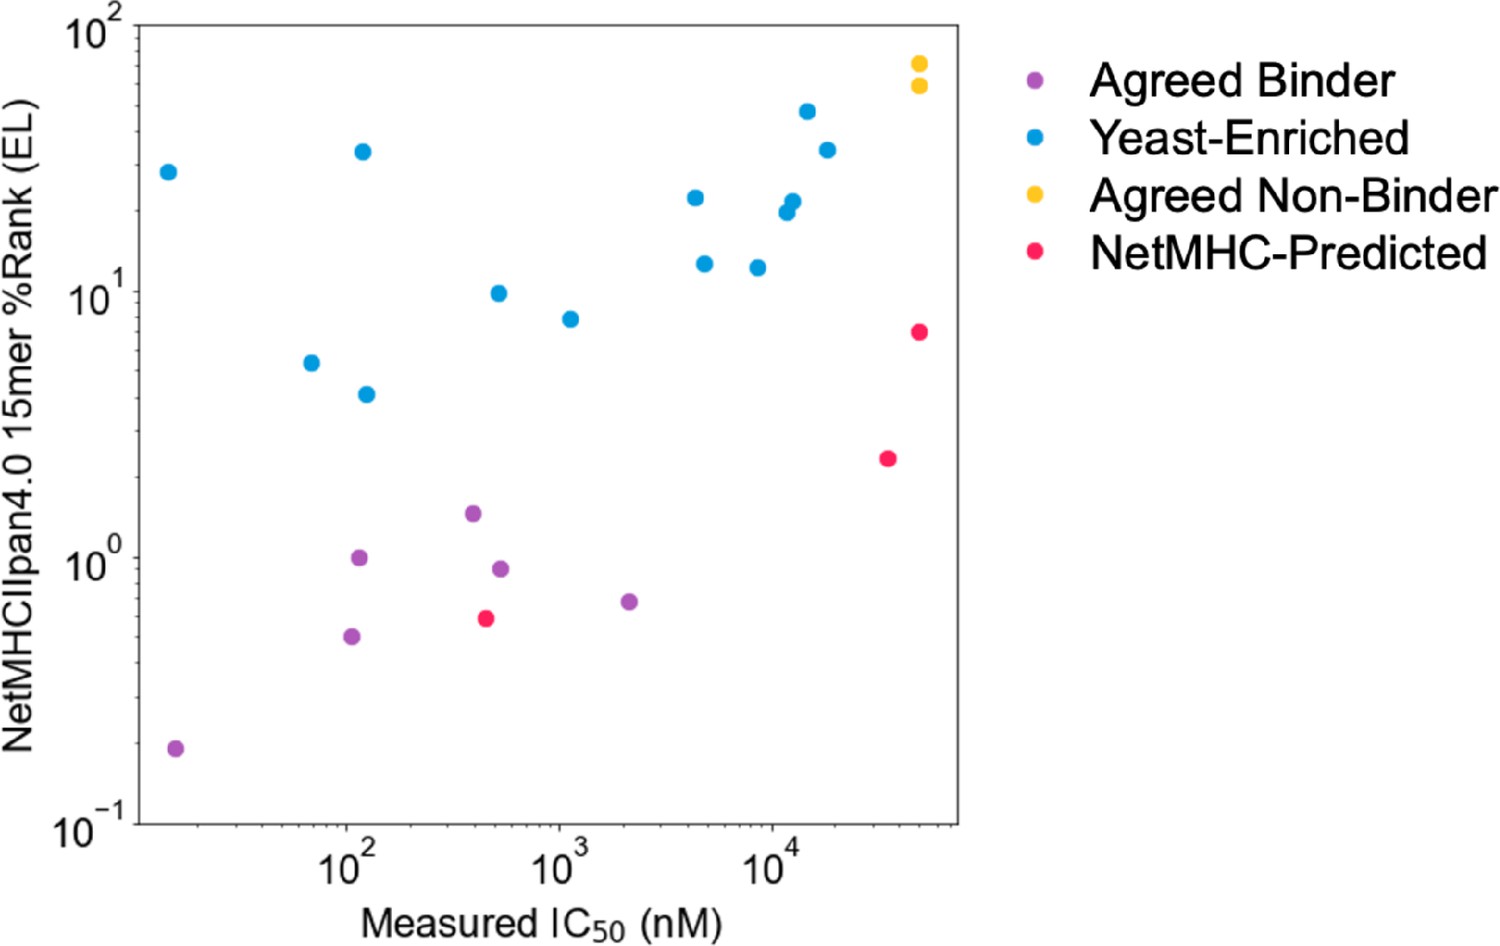
Figure 4 with 3 supplements

Comparing measured IC50 values and computational prediction.
Relationship between measured IC50 values and NetMHCIIpan4.0 predicted ranks in Eluted Ligand mode (EL) on invariant-flanked sequences. Data points are colored by label, and IC50 values ≥ 50 µM are set to 50 µM.
Figure 4—figure supplement 1
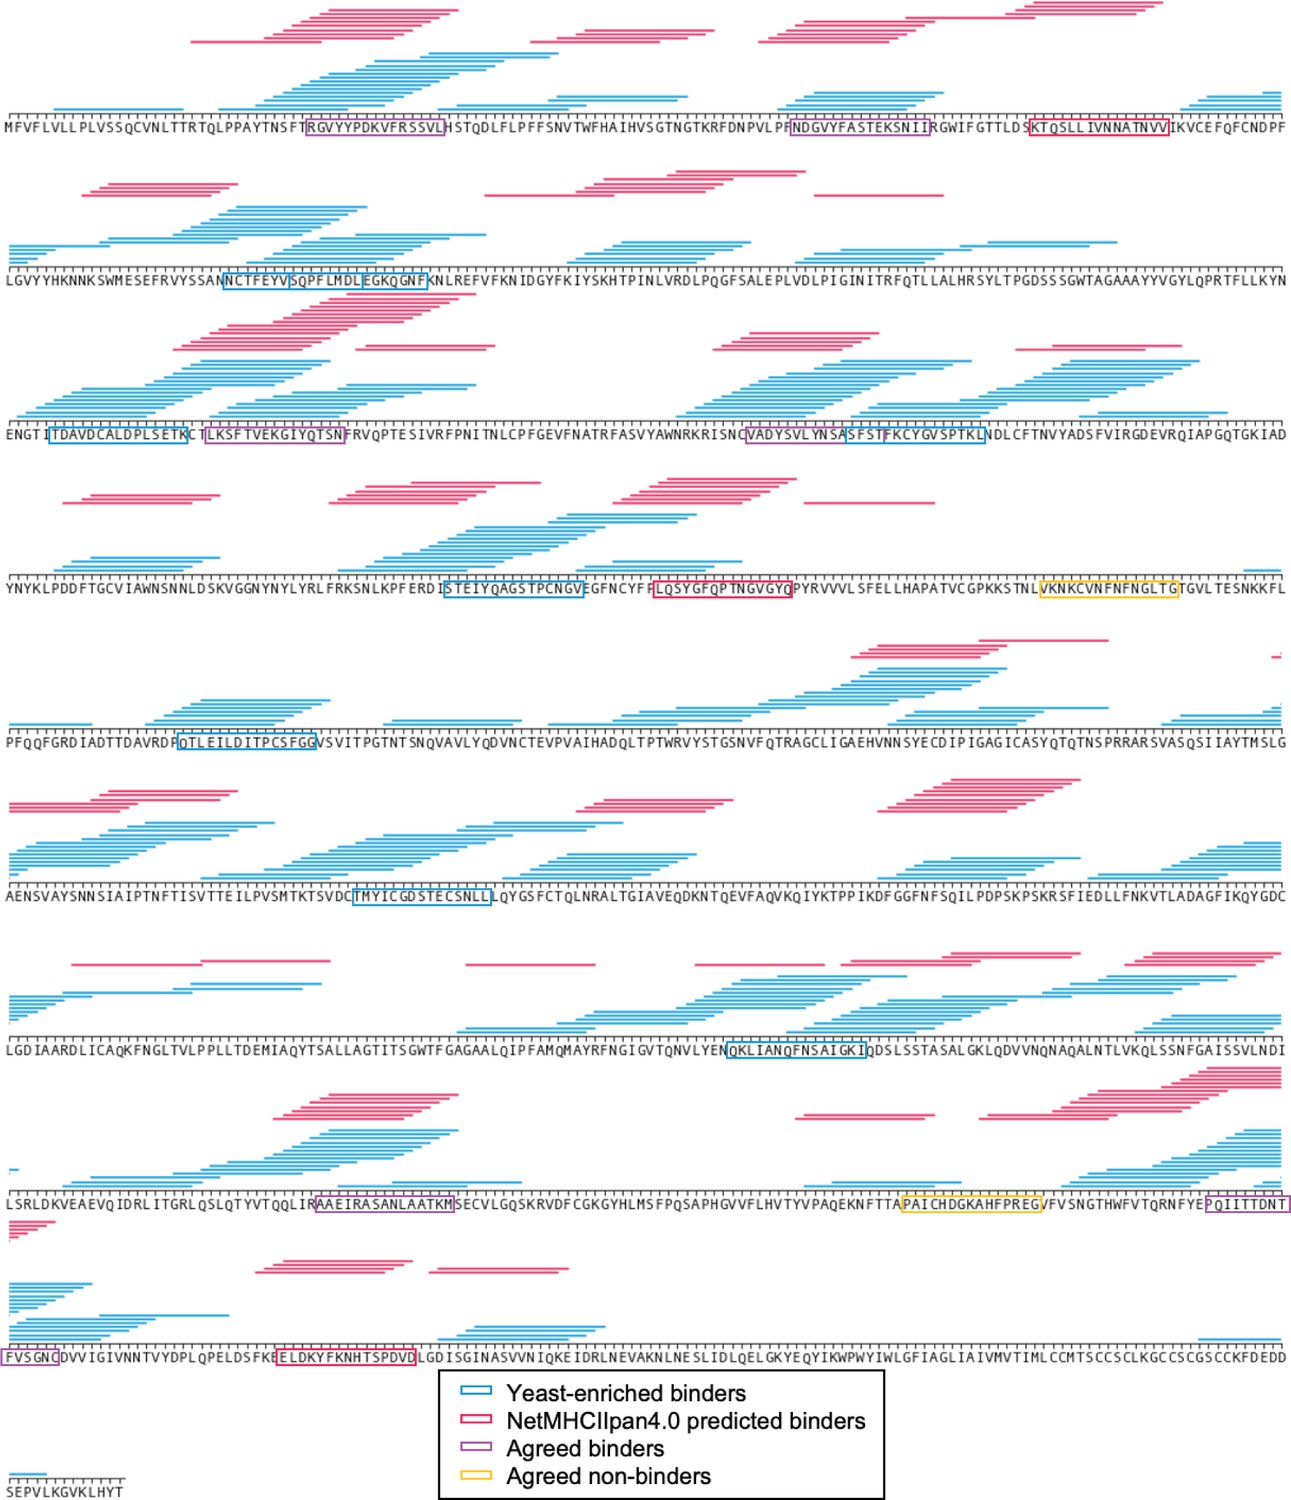
Comparing defined library selection with algorithmic predictions: SARS-CoV-2 spike protein.
15mer peptides which enriched for binding to HLA-DR401 in both the doped and undoped libraries are indicated with horizontal lines above the enriched 15mer sequence (blue). NetMHCIIpan4.0 predicted binders (rank ≤ 10%) on yeast-formatted peptides are shown in red. Boxed sequences are tested in subsequent fluorescent polarization experiments, and colored as indicated in the legend.
Figure 4—figure supplement 2
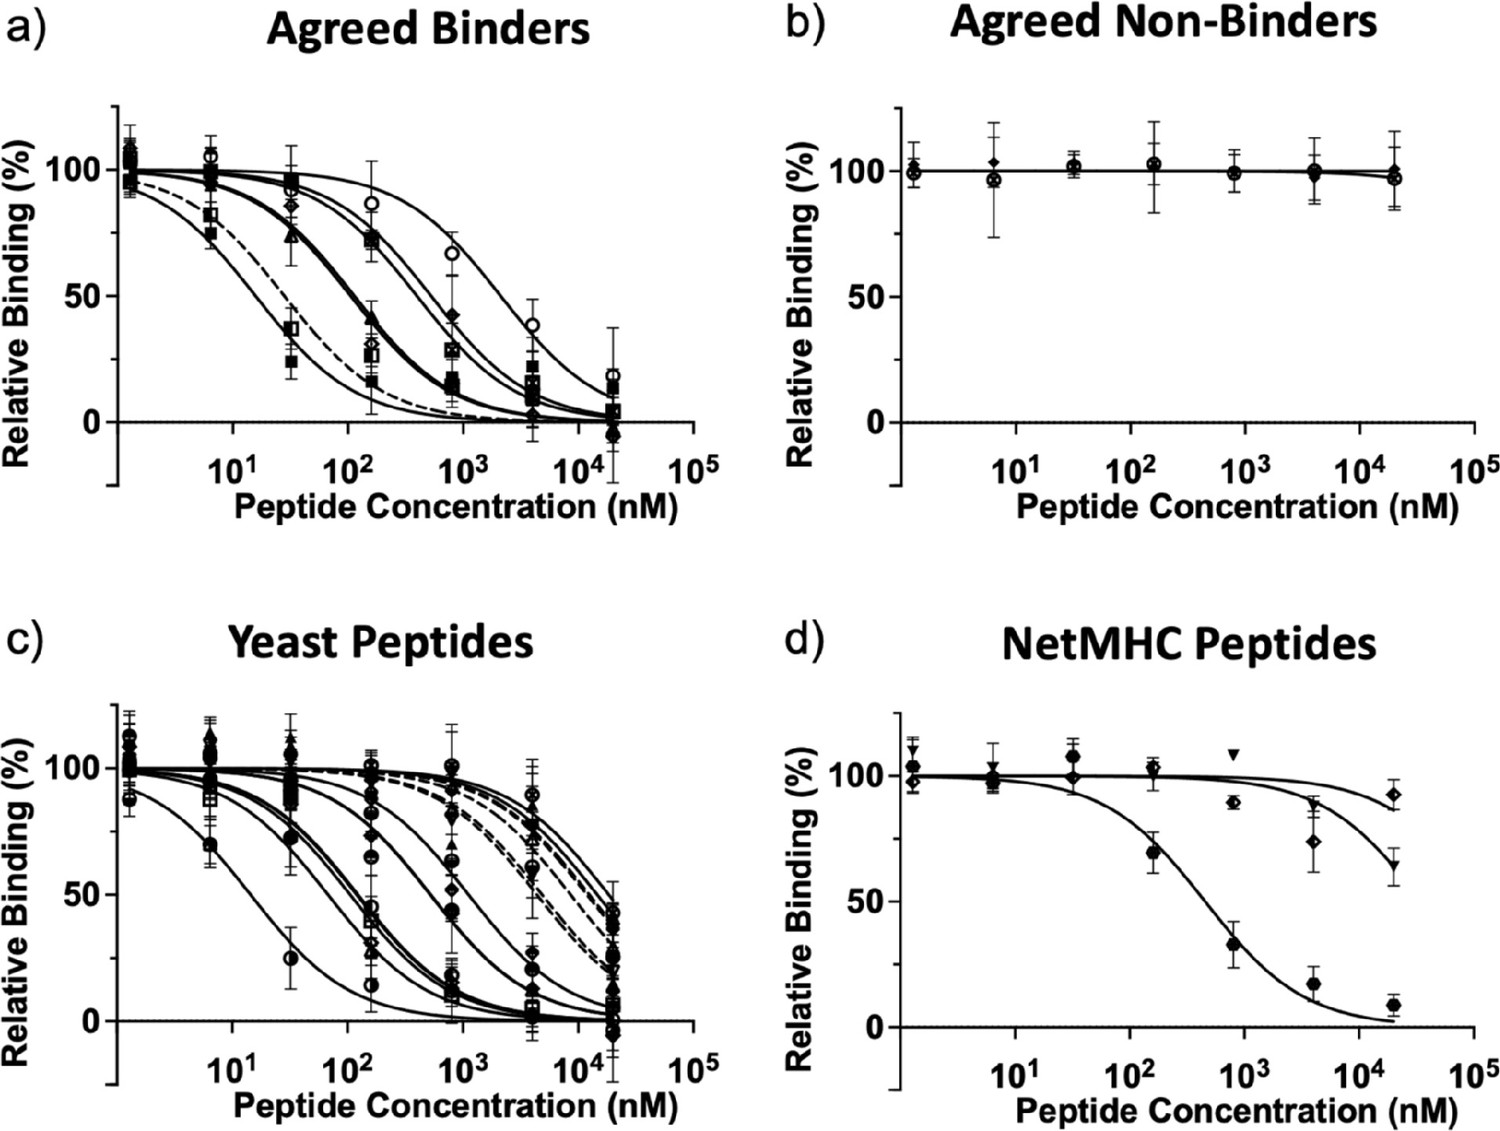
Titration curves for peptides tested via fluorescence polarization for binding to HLA-DR401, by category.
(a) Agreed binder peptides which are predicted to bind by NetMHCIIpan4.0 and enriched in yeast display experiments. Dashed line is the positive control HA peptide. (b) Agreed non-binder peptides which did not enrich in yeast display experiments and were not predicted to bind by NetMHCIIpan4.0. (c) Yeast enriched peptides from Table 2 and Table 3. Offset variants from Table 3 are dashed lines. (d) NetMHCIIpan4.0 predicted peptides which are not enriched in the yeast display library. Mean and standard deviation from three replicates are plotted for each peptide concentration. Source data are provided as Figure 4—figure supplement 2—source data 1.
-
Figure 4—figure supplement 2—source data 1
Fluorescence polarization measurements for peptide-HLA-DR401 binding.
- https://cdn.elifesciences.org/articles/78589/elife-78589-fig4-figsupp2-data1-v2.xlsx
Figure 4—figure supplement 3
Comparing measured IC50 values and prediction.
Relationship between measured IC50 values and NetMHCIIpan4.0 predicted ranks in Eluted Ligand mode (EL) on unflanked (native) 15mer sequences. Data points are colored by label, and IC50 values ≥ 50 µM are set to 50 µM.
Figure 5

Conservation and enrichment of dengue virus serotypes 1–4.
(a) Conservation and enrichment of 9mer peptides along four aligned dengue serotypes. All stretches of nine amino acids are compared across the four serotypes and conservation is indicated with a black vertical line (i.e. 2, 3, or 4 of four serotypes conserved). 9mers which enriched on HLA-DR401 are also indicated, colored by virus serotype. (b–d) Zoomed regions, showing enrichment for individual 15mer peptides to HLA-DR401. Only peptides which contain the bolded 9mer sequence are shown. Amino acids in the bolded 9mer that are not conserved between serotypes are highlighted in yellow. Insets show regions which are differently conserved and enriched: (b) non-conserved sequences with peptides from one serotype enriched; (c) conserved sequences enriched across all serotypes; (d) non-conserved sequences which are enriched.
Tables
Table 1
Summary of enriched peptides for each source protein, including: the number of unique 15mers which each enriched in both of the doped and undoped libraries; the number of unique 9mer cores identified by register inference in these enriched 15mers (native cores only, so linker-containing inferred cores excluded); and the number of unique enriched 15mers that contain 9mer sequences enriched in five or more of overlapping neighbors.
| Virus | Protein | Protein length(# of amino acids) | MHC allele | # of 15mers | # of 9mer cores | # of smoothed 15mers |
|---|---|---|---|---|---|---|
| SARS-CoV | Spike | 1255 | HLA-DR401 | 324 | 74 | 221 |
| HLA-DR402 | 217 | 65 | 110 | |||
| HLA-DR404 | 289 | 61 | 193 | |||
| SARS-CoV | Nucleocapsid | 422 | HLA-DR401 | 40 | 8 | 34 |
| HLA-DR402 | 34 | 13 | 12 | |||
| HLA-DR404 | 31 | 6 | 20 | |||
| SARS-CoV-2 | Spike | 1273 | HLA-DR401 | 305 | 67 | 221 |
| HLA-DR402 | 230 | 62 | 130 | |||
| HLA-DR404 | 290 | 64 | 217 | |||
| SARS-CoV-2 | Nucleocapsid | 419 | HLA-DR401 | 34 | 8 | 24 |
| HLA-DR402 | 33 | 10 | 15 | |||
| HLA-DR404 | 30 | 8 | 18 | |||
| SARS-CoV-2 | Replicase polyprotein 1ab | 7096 | HLA-DR401 | 1652 | 388 | 1204 |
| HLA-DR402 | 1104 | 325 | 678 | |||
| HLA-DR404 | 1368 | 350 | 890 | |||
| SARS-CoV-2 | Non-structural protein 8 | 121 | HLA-DR401 | 41 | 10 | 32 |
| HLA-DR402 | 21 | 7 | 17 | |||
| HLA-DR404 | 32 | 8 | 19 | |||
| SARS-CoV-2 | Protein 7a | 121 | HLA-DR401 | 27 | 8 | 18 |
| HLA-DR402 | 7 | 3 | 0 | |||
| HLA-DR404 | 13 | 2 | 6 | |||
| SARS-CoV-2 | Non-structural protein 6 | 61 | HLA-DR401 | 0 | 0 | 0 |
| HLA-DR402 | 1 | 1 | 0 | |||
| HLA-DR404 | 0 | 0 | 0 | |||
| SARS-CoV-2 | Membrane protein | 222 | HLA-DR401 | 40 | 7 | 29 |
| HLA-DR402 | 26 | 6 | 19 | |||
| HLA-DR404 | 23 | 7 | 21 | |||
| SARS-CoV-2 | Envelope small membrane protein | 75 | HLA-DR401 | 6 | 1 | 0 |
| HLA-DR402 | 7 | 3 | 0 | |||
| HLA-DR404 | 6 | 1 | 0 | |||
| SARS-CoV-2 | Protein 3a | 275 | HLA-DR401 | 22 | 4 | 11 |
| HLA-DR402 | 13 | 4 | 10 | |||
| HLA-DR404 | 10 | 2 | 0 | |||
| SARS-CoV-2 | Replicase polyprotein 1a | 4405 | HLA-DR401 | 948 | 228 | 658 |
| HLA-DR402 | 657 | 196 | 409 | |||
| HLA-DR404 | 865 | 222 | 582 | |||
| SARS-CoV-2 | ORF10 protein | 38 | HLA-DR401 | 6 | 1 | 6 |
| HLA-DR402 | 2 | 0 | 0 | |||
| HLA-DR404 | 5 | 1 | 5 | |||
| SARS-CoV-2 | Protein non-structural 7b | 43 | HLA-DR401 | 0 | 0 | 0 |
| HLA-DR402 | 0 | 0 | 0 | |||
| HLA-DR404 | 0 | 0 | 0 | |||
| SARS-CoV-2 | Uncharacterized protein 14 | 73 | HLA-DR401 | 8 | 4 | 6 |
| HLA-DR402 | 20 | 5 | 16 | |||
| HLA-DR404 | 22 | 4 | 21 | |||
| SARS-CoV-2 | Protein 9b | 97 | HLA-DR401 | 29 | 7 | 27 |
| HLA-DR402 | 35 | 6 | 31 | |||
| HLA-DR404 | 37 | 9 | 34 |
Table 2
Peptides selected for fluorescence polarization (FP) experiments for binding to HLA-DR401.
NetMHCIIpan4.0 predictions for HLA-DR401 binding are performed on 15mers plus invariant flanking residues (N-terminal Ala, C-terminal Gly-Gly-Ser) and percent rank values generated using Eluted Ligand mode. Fluorescence polarization is performed on native 15mer peptides without invariant flanking residues.
| Spike position | Peptide + flank(A + 15mer + GGS) | NetMHCIIpan4.0predicted core(A + 15mer + GGS) | NetMHCIIpan4.0 %Rank(A + 15mer + GGS) | 15mer affinity from FP (IC50, nM) | |
|---|---|---|---|---|---|
| Agreed Binders | 34–48 | ARGVYYPDKVFRSSVLGGS | YYPDKVFRS | 1.49 | 15.8 |
| 87–101 | ANDGVYFASTEKSNIIGGS | VYFASTEKS | 4.28 | 2117 | |
| 303–317 | ALKSFTVEKGIYQTSNGGS | FTVEKGIYQ | 8.41 | 396.9 | |
| 362–376 | AVADYSVLYNSASFSTGGS | YSVLYNSAS | 8.36 | 113.7 | |
| 1015–1029 | AAAEIRASANLAATKMGGS | IRASANLAA | 3.13 | 105.4 | |
| 1112–1126 | APQIITTDNTFVSGNCGGS | ITTDNTFVS | 7.32 | 527.0 | |
| Yeast-Enriched Binders | 165–179 | ANCTFEYVSQPFLMDLGGS | YVSQPFLMD | 64.83 | 14,652 |
| 172–186 | ASQPFLMDLEGKQGNFGGS | FLMDLEGKQ | 20.34 | 123.2 | |
| 286–300 | ATDAVDCALDPLSETKGGS | VDCALDPLS | 32.68 | 521.6 | |
| 373–387 | ASFSTFKCYGVSPTKLGGS | YGVSPTKLG | 16.59 | 18,452 | |
| 469–483 | ASTEIYQAGSTPCNGVGGS | IYQAGSTPC | 18.22 | 67.7 | |
| 580–594 | AQTLEILDITPCSFGGGGS | LEILDITPC | 62.00 | 119.9 | |
| 739–753 | ATMYICGDSTECSNLLGGS | YICGDSTEC | 70.91 | 14.4 | |
| 920–934 | AQKLIANQFNSAIGKIGGS | FNSAIGKIG | 20.47 | 1121 | |
| NetMHC-Predicted Binders | 113–127 | AKTQSLLIVNNATNVVGGS | IVNNATNVV | 8.74 | >50,000 |
| 492–506 | ALQSYGFQPTNGVGYQGGS | YGFQPTNGV | 4.11 | 454.7 | |
| 1151–1165 | AELDKYFKNHTSPDVDGGS | YFKNHTSPD | 5.74 | 35,510 | |
| Agreed Non-Binders | 534–548 | AVKNKCVNFNFNGLTGGGS | FNFNGLTGG | 57.13 | >50,000 |
| 1079–1093 | APAICHDGKAHFPREGGGS | ICHDGKAHF | 80.47 | >50,000 |
Table 3
Effects of peptide flanking sequences on NetMHCIIpan4.0 predictions for HLA-DR401 binding and measured fluorescence polarization (FP) values for overlapping peptides.
Yeast display-enriched peptides that are predicted to bind by NetMHCIIpan4.0 when without flanking residues, plus offset variants of these peptides, which are not predicted to bind, with or without flanking sequence. Yeast display register-inferred consensus cores are highlighted in bold. NetMHCIIpan4.0 percent rank values are generated using Eluted Ligand mode.
| Spike position | Sequence | NetMHCIIpan4.0 predicted core(A + 15mer + GGS) | NetMHCIIpan4.0 %Rank(A + 15mer + GGS) | NetMHCIIpan4.0 predicted core(15mer) | NetMHCIIpan4.0 %Rank(15mer) | 15mer affinity from FP (IC50, nM) |
|---|---|---|---|---|---|---|
| 172–186 | SQPFLMDLEGKQGNF | FLMDLEGKQ | 20.34 | FLMDLEGKQ | 4.1 | 123.2 |
| 173–187 | QPFLMDLEGKQGNFK | FLMDLEGKQ | 27.73 | FLMDLEGKQ | 12.21 | 8613 |
| 286–300 | TDAVDCALDPLSETK | VDCALDPLS | 32.68 | VDCALDPLS | 9.8 | 1154 |
| 287–301 | DAVDCALDPLSETKC | VDCALDPLS | 42.42 | VDCALDPLS | 22.57 | 4,393 |
| 469–483 | STEIYQAGSTPCNGV | IYQAGSTPC | 18.22 | IYQAGSTPC | 5.41 | 67.7 |
| 467–481 | DISTEIYQAGSTPCN | IYQAGSTPC | 11.47 | IYQAGSTPC | 12.61 | 4875 |
| 471–485 | EIYQAGSTPCNGVEG | YQAGSTPCN | 39.17 | YQAGSTPCN | 21.81 | 12,519 |
| 920–934 | QKLIANQFNSAIGKI | FNSAIGKIG | 20.47 | IANQFNSAI | 7.89 | 1495 |
| 921–935 | KLIANQFNSAIGKIQ | FNSAIGKIQ | 18.3 | IANQFNSAI | 19.79 | 11,937 |
Key resources table
| Reagent type (species) or resource | Designation | Source or reference | Identifiers | Additional information |
|---|---|---|---|---|
| Strain, strain background (Saccharomyces cerevisiae) | RJY100 | PMID:26333274 | ||
| Cell line (Trichoplusia ni) | High Five cells | Thermo Fisher | Cat#:B85502 | |
| Cell line (Spodoptera frugiperda) | Sf9 cells | Thermo Fisher | Cat#:11496015 | |
| Antibody | Anti-Myc-AlexaFluor647 (Mouse monoclonal) | Cell Signaling Technology | Cat#:2233 | Library selections: 1:100 |
| Recombinant DNA reagent | Peptide-MHC-II with cleavable peptide linker in pYal (plasmid) | PMID:32887877 | ||
| Recombinant DNA reagent | HLA-DR401 in pAcGP67a (plasmid) | PMID:32887877 | ||
| Recombinant DNA reagent | HLA-DM in pAcGP67a (plasmid) | PMID:32887877 | ||
| Peptide, recombinant protein | 3C protease | Other | Purified from Escherichia coli BL21 cells | |
| Software, algorithm | PandaSeq | PMID:22333067 | ||
| Software, algorithm | NetMHCIIpan4.0 | PMID:32406916 | ||
| Software, algorithm | Peptide register inference algorithm | This paper | See Code Availability | |
| Software, algorithm | Prism | GraphPad Prism software (http://www.graphpad.com/) | Version: 9.3 |
Additional files
-
Supplementary file 1
Data from generation and deep sequencing of yeast-displayed peptide-major histocompatibility complex (MHC) libraries.
(a) Peptide count data from deep sequencing of the SARS-CoV and SARS-CoV-2 libraries. (b) Inferred binding registers of enriched peptides from the SARS-CoV and SARS-CoV-2 libraries. (c) Peptide count data from deep sequencing of the dengue libraries. (d) Primer sequences utilized for generation and deep sequencing of yeast display libraries.
- https://cdn.elifesciences.org/articles/78589/elife-78589-supp1-v2.xlsx
-
MDAR checklist
- https://cdn.elifesciences.org/articles/78589/elife-78589-mdarchecklist1-v2.docx
Download links
A two-part list of links to download the article, or parts of the article, in various formats.
Downloads (link to download the article as PDF)
Open citations (links to open the citations from this article in various online reference manager services)
Cite this article (links to download the citations from this article in formats compatible with various reference manager tools)
A high-throughput yeast display approach to profile pathogen proteomes for MHC-II binding
eLife 11:e78589.
https://doi.org/10.7554/eLife.78589


