Pathogenic mutations in the chromokinesin KIF22 disrupt anaphase chromosome segregation
- Department of Molecular Physiology and Biophysics, University of Vermont, United States
- Laboratory Medicine and Pathology, Mayo Clinic, United States
- Pathology, St. Jude Children’s Research Hospital, United States
- Clinical Genomics, Mayo Clinic, United States
- Department of Biochemistry, University of Vermont, United States
- Biomedical Informatics, Mayo Clinic, United States
Figures
Figure 1
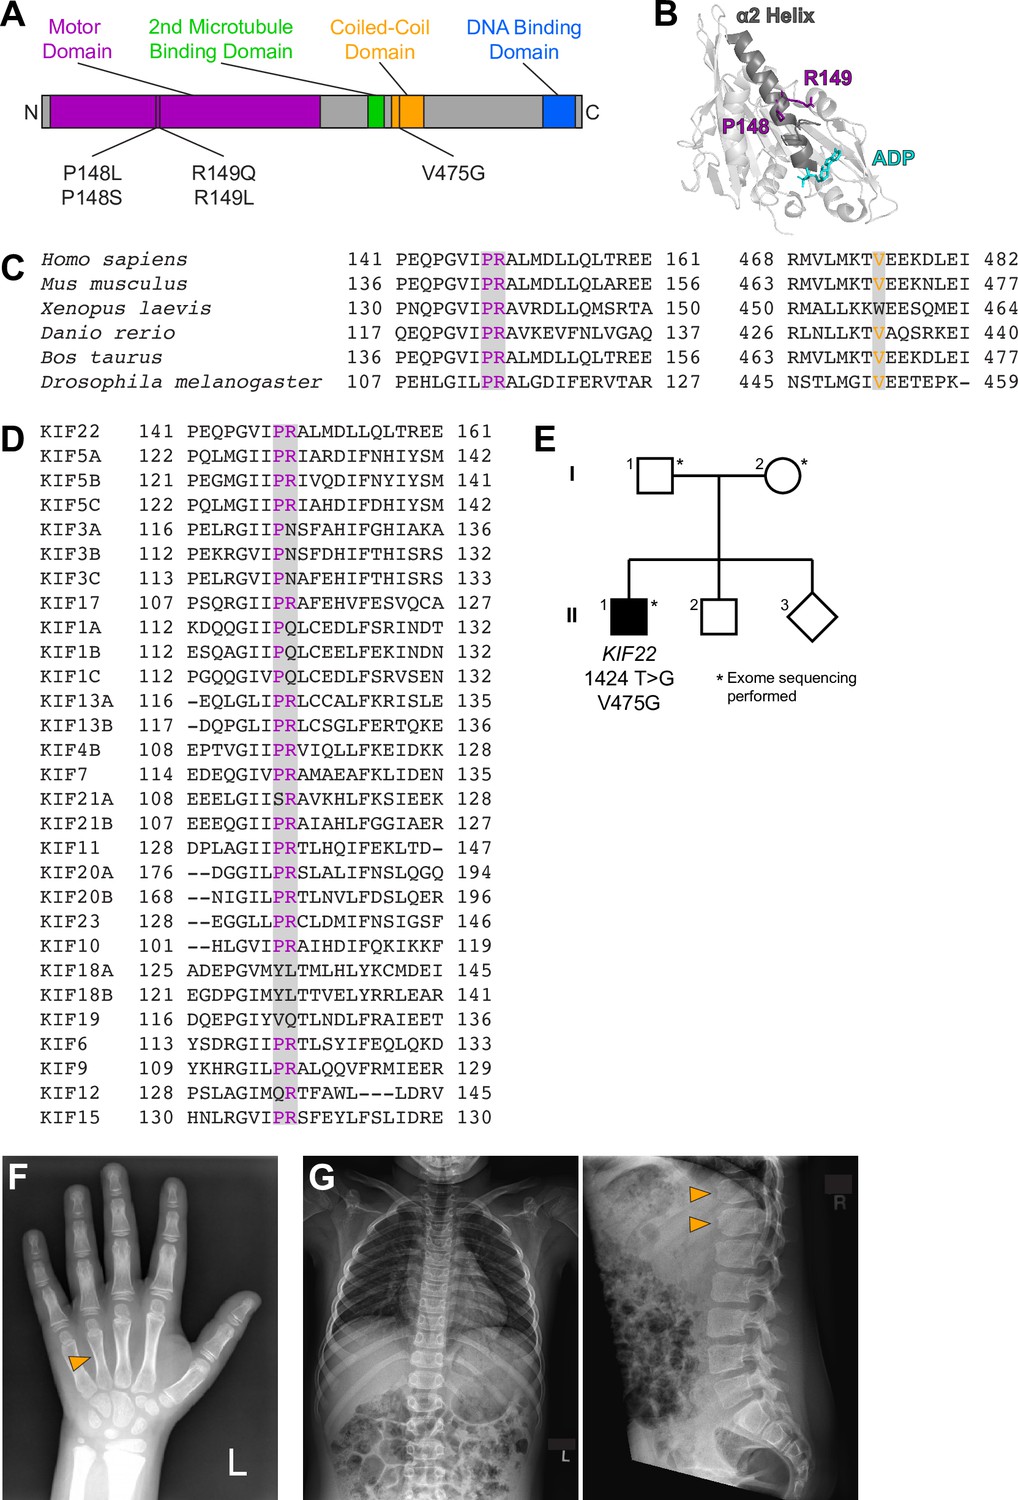
Identification of a novel pathogenic mutation in the tail of KIF22.
(A) Schematic of the domains of KIF22 with pathogenic mutations in the motor domain (magenta) and coiled-coil domain (yellow) indicated. (B) Location of amino acids P148 and R149 in the α2 helix of the KIF22 motor domain (PDB 6NJE). (C) Alignment of amino acid sequences of kinesin-10 family members to assess conservation of motor domain (P148 and R149, left) and coiled-coil domain (V475G, right) residues across species. (D) Alignment of amino acid sequences of human kinesin motors to assess conservation of motor domain residues across the kinesin superfamily. For (C, D), alignments were performed using Clustal Omega. (E) Pedigree identifying the de novo V475G (1424T>G) mutation. (F) Radiograph of the patient’s hand, posteroanterior view. Arrowhead indicates mild foreshortening of the fourth metacarpal. (G) Radiographs of the patient’s spine. Left: anteroposterior view, right: lateral view. Arrowheads indicate ‘bullet-shaped’ lower thoracic vertebrae.
Figure 2 with 2 supplements
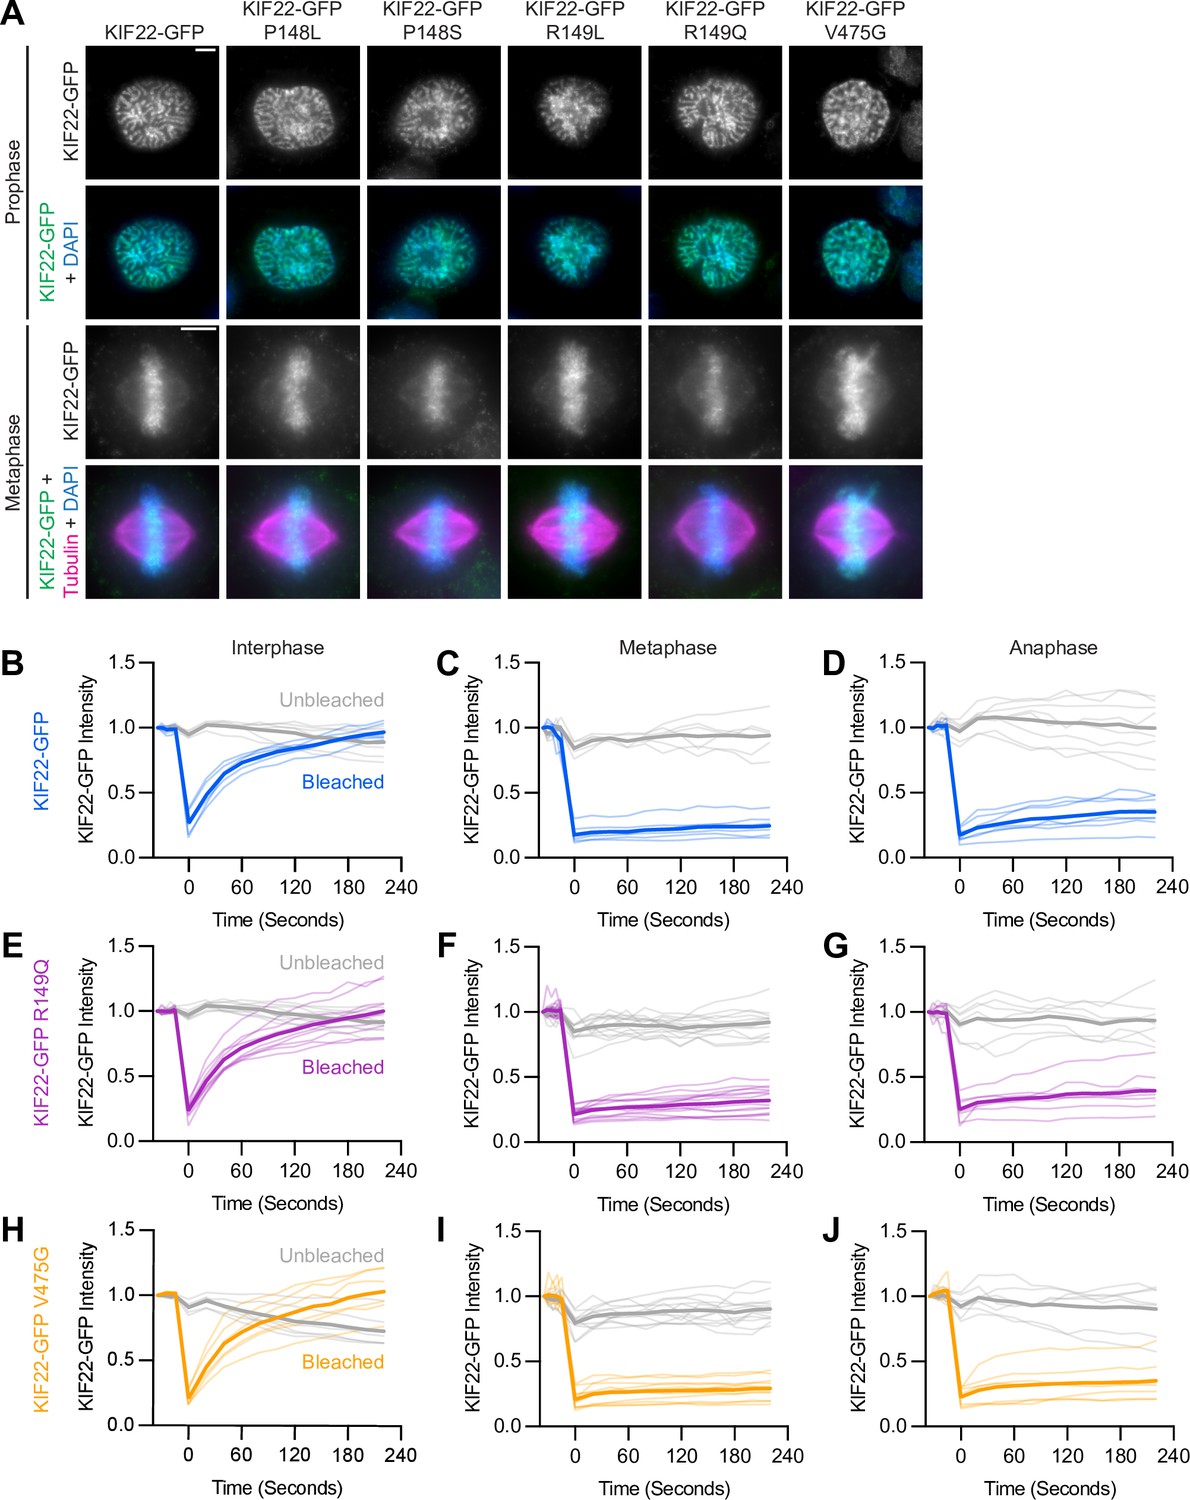
Pathogenic mutations in KIF22 do not disrupt the localization of the motor.
(A) Immunofluorescence images of HeLa-Kyoto cells expressing KIF22-GFP constructs in prophase (top two rows) and metaphase (bottom two rows). KIF22-GFP was visualized using an anti-GFP antibody. Images are maximum intensity projections in z of five frames at the center of the spindle (metaphase cells) or maximum intensity projections in z of two frames (prophase cells). Fixed approximately 24 hr after treatment with doxycycline to induce expression. Scale bars 5 μm. (B–J) Fluorescence recovery after photobleaching (FRAP) of KIF22-GFP (B–D), KIF22-GFP R149Q (E–G), and KIF22-GFP V475G (H–J) in interphase nuclei (B, E, H) or on metaphase (C, F, I) or anaphase (D, G, J) chromosomes. Bleaching occurred at time 0. Thin lines are traces from individual cells and thick lines represent means. Intensity values are normalized to the KIF22-GFP intensity in the first imaged frame before bleaching. Interphase measurements (B, E, H) obtained from six KIF22-GFP cells from four experiments, nine KIF22-GFP R149Q cells from five experiments, and six KIF22-GFP V475G cells from four experiments. Metaphase measurements (C, F, I) obtained from 6 KIF22-GFP cells from four experiments, 14 KIF22-GFP R149Q cells from five experiments, and 12 KIF22-GFP V475G cells from four experiments. Anaphase measurements (D, G, J) obtained from eight KIF22-GFP cells from four experiments, seven KIF22-GFP R149Q cells from five experiments, and seven KIF22-GFP V475G cells from three experiments. See Figure 2—source data 1.
-
Figure 2—source data 1
Fluorescence recovery after photobleaching (FRAP).
KIF22-GFP intensities measured in FRAP assays.
- https://cdn.elifesciences.org/articles/78653/elife-78653-fig2-data1-v2.zip
Figure 2—figure supplement 1
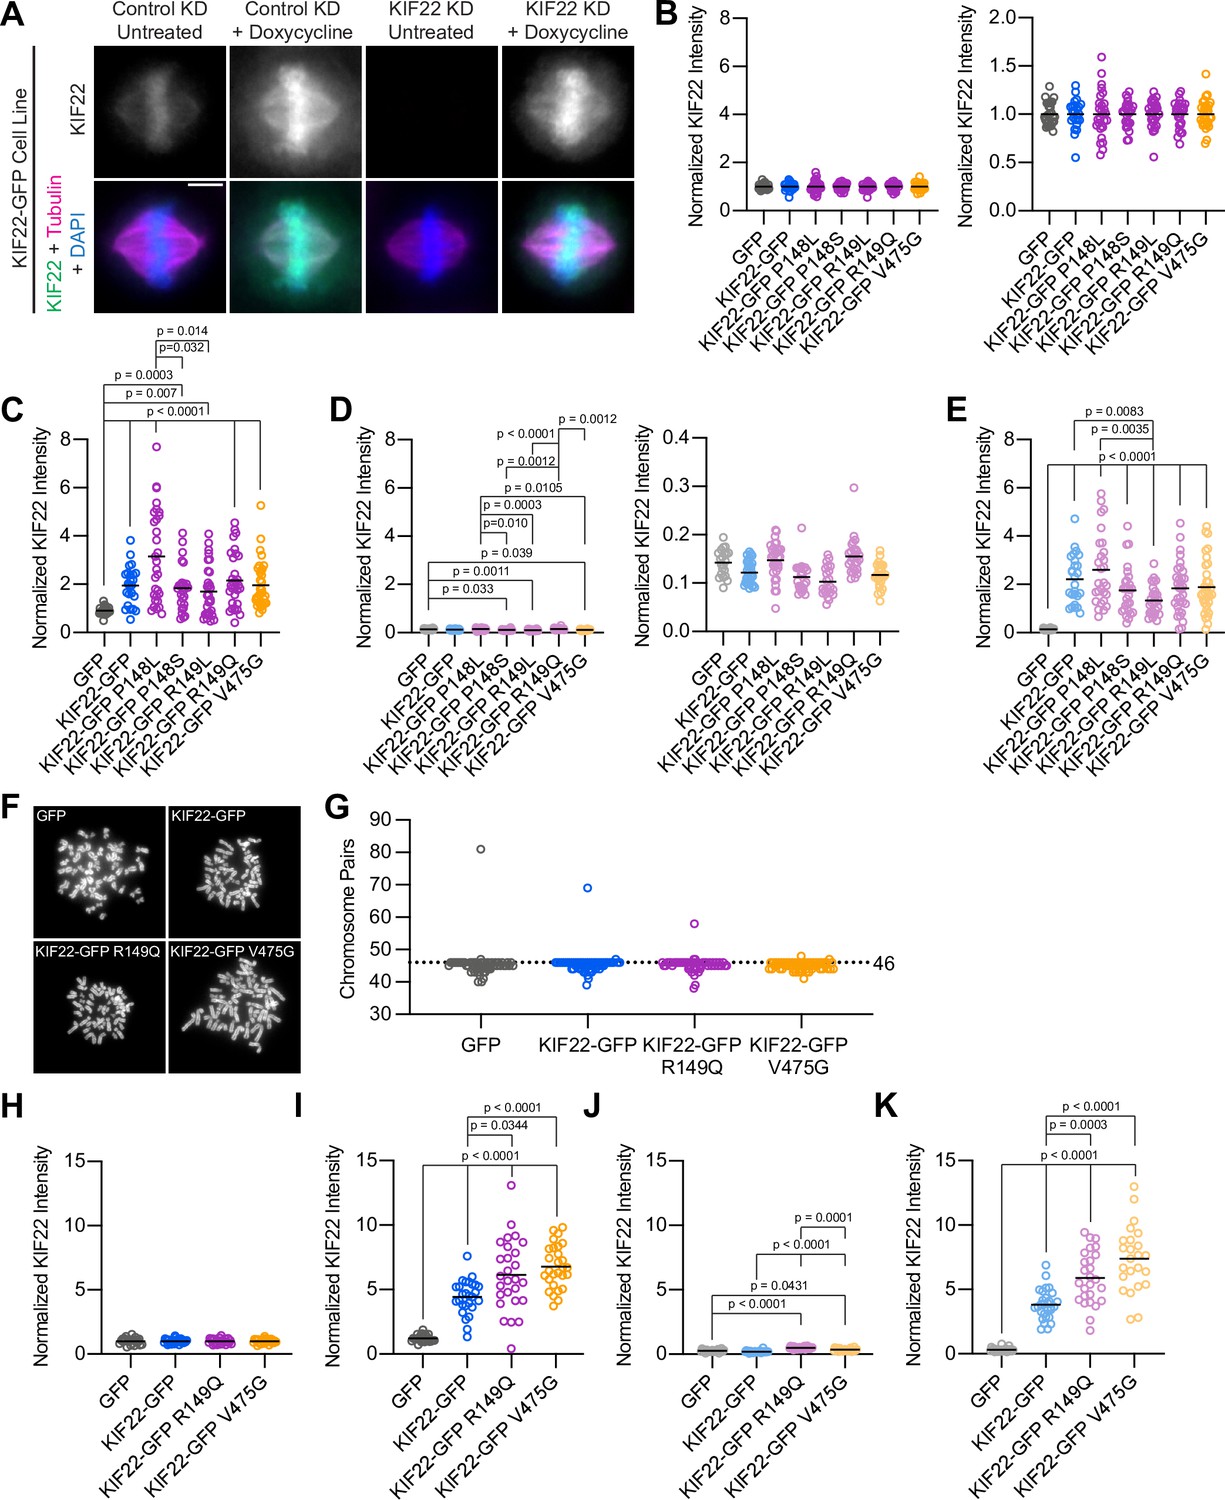
HeLa-Kyoto and RPE-1 stable cell lines express mutant KIF22.
(A) Immunofluorescence images of HeLa-Kyoto cells expressing KIF22-GFP under the control of a doxycycline inducible promoter. Images are maximum intensity projections in z of five frames at the center of the spindle. Fixed approximately 24 hr after siRNA transfection and treatment with doxycycline to induce expression. Scale bar 5 μm. KD: knockdown. (B–E) Quantification of KIF22 fluorescence intensity in untreated HeLa-Kyoto cells transfected with control siRNA (B), cells treated with doxycycline to induce expression and transfected with control siRNA (C), untreated cells transfected with KIF22 siRNA (D), and cells treated with doxycycline and transfected with KIF22 siRNA (E) normalized to the mean intensity of uninduced, control knockdown cells (endogenous KIF22 expression level) for each cell line (B). Data in (B, D) are presented with the same y-axis scale as data in (C, E) for comparison (left), and with independently scaled y-axes to show data variability (right). Twenty-seven GFP, 24 KIF22-GFP, 27 KIF22-GFP R149Q, 28 KIF22-GFP P148L, 25 KIF22-GFP P148S, 27 KIF22-GFP R149L, and 30 KIF22-GFP V475G untreated cells transfected with control siRNA (B), 24 GFP, 24 KIF22-GFP, 31 KIF22-GFP R149Q, 30 KIF22-GFP P148L, 27 KIF22-GFP P148S, 30 KIF22-GFP R149L, and 33 KIF22-GFP V475G doxycycline-treated cells transfected with control siRNA (C), 21 GFP, 31 KIF22-GFP, 27 KIF22-GFP R149Q, 32 KIF22-GFP P148L, 22 KIF22-GFP P148S, 22 KIF22-GFP R149L, and 25 KIF22-GFP V475G untreated cells transfected with KIF22 siRNA (D), 26 GFP, 26 KIF22-GFP, 32 KIF22-GFP R149Q, 28 KIF22-GFP P148L, 28 KIF22-GFP P148S, 27 KIF22-GFP R149L, and 33 KIF22-GFP V475G doxycycline-treated cells transfected with KIF22 siRNA (E) from three experiments. (F) DAPI-stained metaphase chromosome spreads from uninduced RPE-1 cell lines with inducible expression of GFP, KIF22-GFP, KIF22-GFP R149Q, or KIF22-GFP V475G. Scale bar 10 μm. Images are representative of three experiments. (G) Numbers of chromosome pairs counted in metaphase spreads prepared from RPE-1 stable cell lines. Dashed line indicates the expected chromosome number for diploid human cells (46). The mode for each cell line is 46. Fifty-five GFP, 58 KIF22-GFP, 53 KIF22-GFP R149Q, and 57 KIF22-GFP V475G spreads from three experiments. (H–K) Quantification of KIF22 fluorescence intensity in untreated RPE-1 cells transfected with control siRNA (H), cells treated with doxycycline to induce expression and transfected with control siRNA (I), untreated cells transfected with KIF22 siRNA (J), and cells treated with doxycycline and transfected with KIF22 siRNA (K) normalized to the mean intensity of uninduced, control knockdown cells for each cell line (H). Twenty-three GFP, 27 KIF22-GFP, 25 KIF22-GFP R149Q, and 27 KIF22-GFP V475G untreated cells transfected with control siRNA (H), 24 GFP, 27 KIF22-GFP, 27 KIF22-GFP R149Q, and 28 KIF22-GFP V475G doxycycline-treated cells transfected with control siRNA (I), 21 GFP, 24 KIF22-GFP, 24 KIF22-GFP R149Q, and 21 KIF22-GFP V475G untreated cells transfected with KIF22 siRNA (J), 24 GFP, 29 KIF22-GFP, 26 KIF22-GFP R149Q, and 24 KIF22-GFP V475G doxycycline-treated cells transfected with KIF22 siRNA (K) from three experiments. For (B–E) and (H–K), bars indicate means. P values from Brown-Forsythe and Welch ANOVA with Dunnett’s T3 multiple comparisons test. P values are greater than 0.05 for comparisons without a marked p value. See Figure 2—figure supplement 1—source data 1.
-
Figure 2—figure supplement 1—source data 1
HeLa-Kyoto and RPE-1 cell lines.
KIF22 expression levels in HeLa-Kyoto and RPE-1 cell lines. Counts of number of chromosomes in metaphase chromosome spreads prepared from RPE-1 acceptor cells.
- https://cdn.elifesciences.org/articles/78653/elife-78653-fig2-figsupp1-data1-v2.zip
Figure 2—figure supplement 2
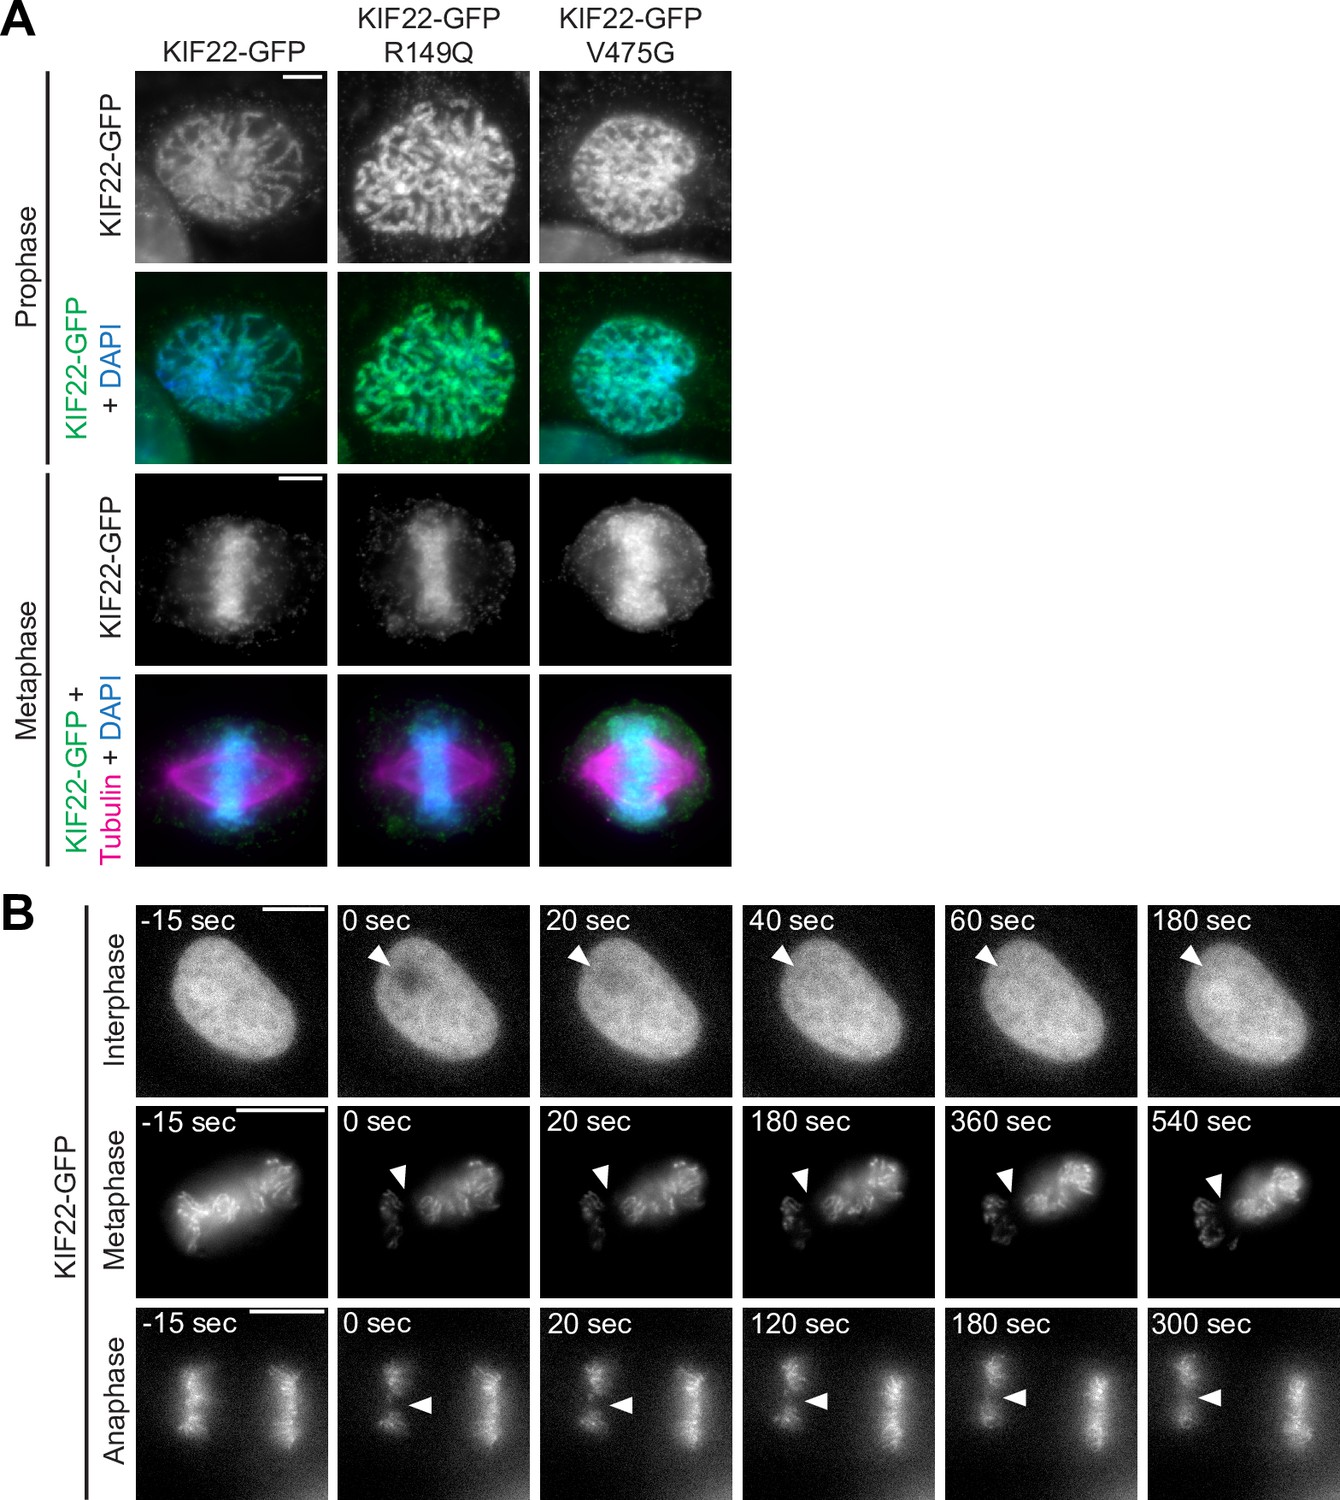
Pathogenic mutations in KIF22 do not disrupt the localization of the motor in RPE-1 cells.
(A) Immunofluorescence images of RPE-1 cells expressing KIF22-GFP constructs in prophase (top two rows) and metaphase (bottom two rows). KIF22-GFP was visualized using an anti-GFP antibody. Images are maximum intensity projections in z of five frames at the center of the spindle (metaphase cells) or maximum intensity projections in z of three frames (prophase cells). Fixed approximately 18 hr after treatment with doxycycline to induce expression. Scale bars 5 μm. (B) Time-lapse images of fluorescence recovery after photobleaching (FRAP) in HeLa-Kyoto cells expressing KIF22-GFP. Bleaching occurred at time 0, and arrowheads indicate bleached area. Scale bars 10 μm. Images are representative of three or more experiments.
Figure 3
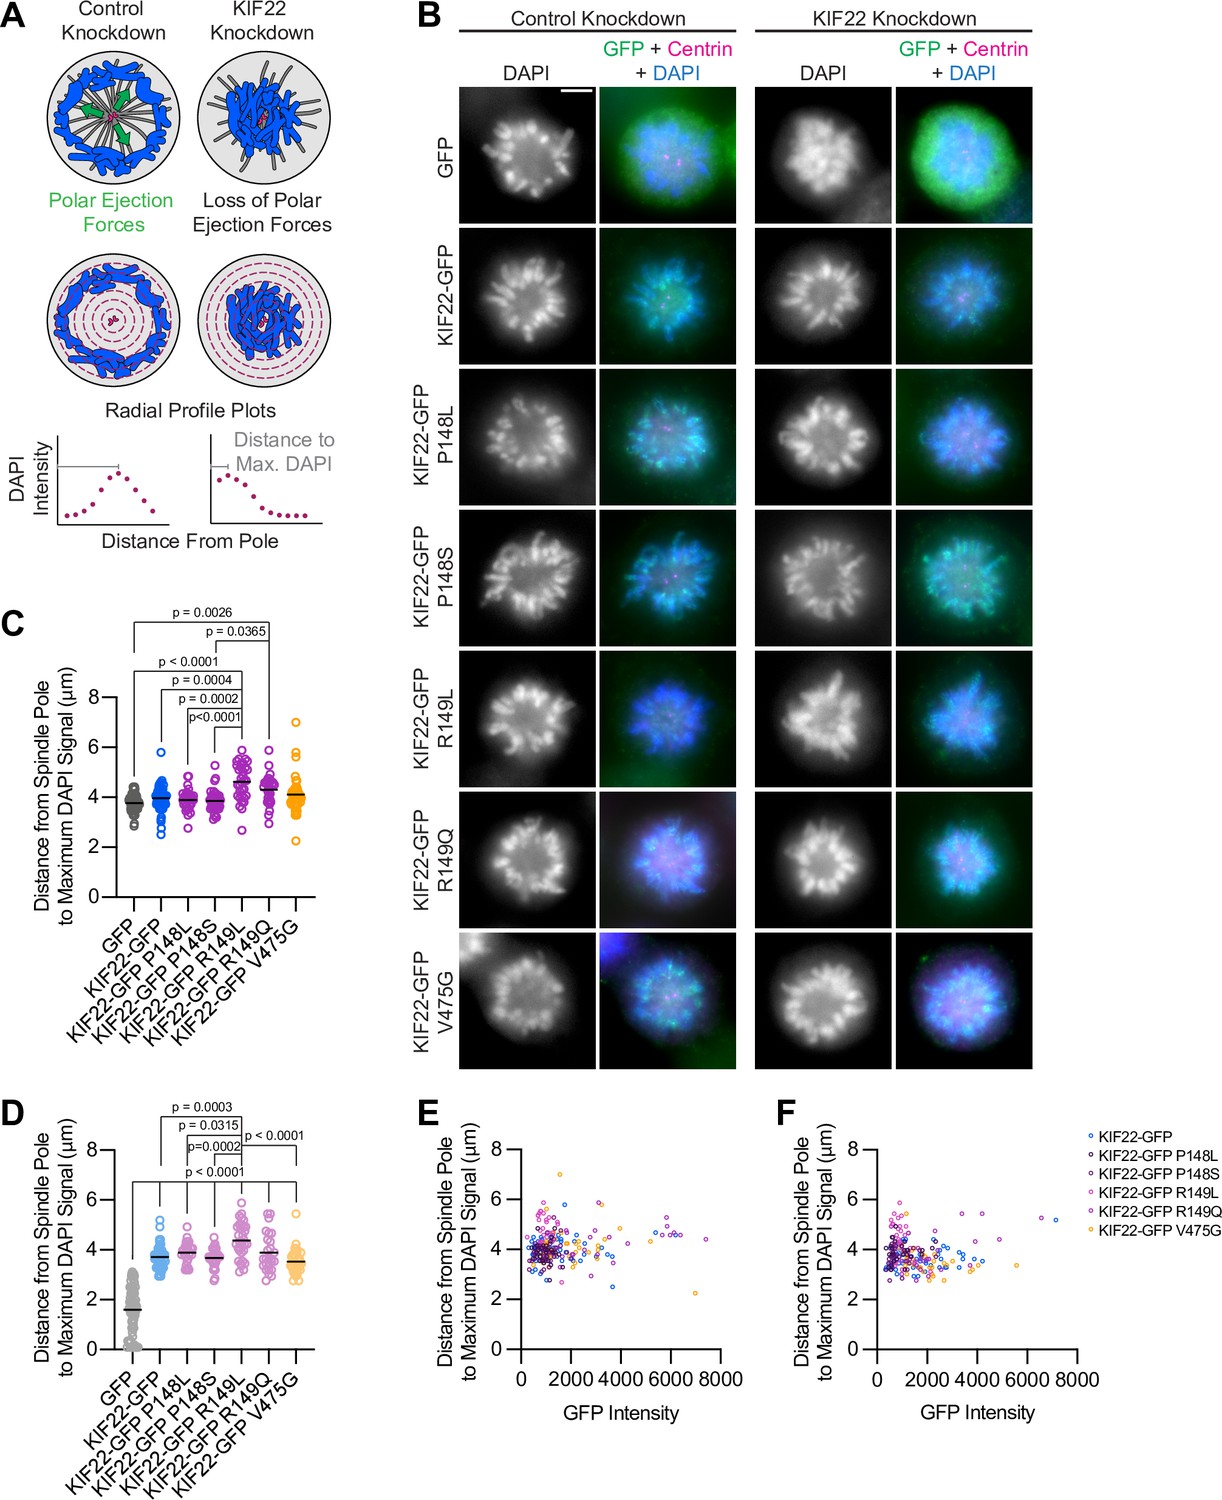
Pathogenic mutations in KIF22 do not reduce polar ejection forces.
(A) Schematic of changes in chromosome positions resulting from loss of polar ejection forces. In cells with monopolar spindles, both spindle poles (magenta) are positioned together and chromosomes (blue) are pushed toward the cell periphery by polar ejection forces (green) (left). In cells depleted of KIF22, polar ejection forces are reduced and chromosomes collapse in toward the center of the cell (right). Relative polar ejection forces were quantified using radial profile plots to measure the distance from the spindle pole to the maximum DAPI signal intensity. (B) Immunofluorescence images of monopolar HeLa-Kyoto cells. KIF22-GFP was visualized using an anti-GFP antibody. Fixed approximately 2–3 hr after treatment with monastrol and 24 hr after siRNA transfection and treatment with doxycycline to induce expression. Scale bar 5 μm. Images are representative of three or more experiments. (C) Distance from the spindle pole to the maximum DAPI signal, a measure of relative polar ejection force level, in cells transfected with control siRNA. Fifty-nine GFP cells from seven experiments, 69 KIF22-GFP cells from six experiments, 31 KIF22-GFP P148L cells from three experiments, 37 KIF22-GFP P148S cells from three experiments, 33 KIF22-GFP R149L cells from three experiments, 28 KIF22-GFP R149Q cells from three experiments, and 45 KIF22-GFP V475G cells from three experiments. (D) Distance from the spindle pole to the maximum DAPI signal in cells transfected with KIF22 siRNA. Seventy-five GFP cells from seven experiments, 57 KIF22-GFP from six experiments, 28 KIF22-GFP P148L cells from three experiments, 30 KIF22-GFP P148S cells from three experiments, 33 KIF22-GFP R149L cells from three experiments, 26 KIF22-GFP R149Q cells from three experiments, and 34 KIF22-GFP V475G cells. For (C, D), bars indicate means. P values from Brown-Forsythe and Welch ANOVA with Dunnett’s T3 multiple comparisons test. P values are greater than 0.05 for comparisons without a marked p value. (E, F) Background-subtracted GFP intensity plotted against the distance from the spindle pole to the maximum DAPI signal to assess dependence of polar ejection force generation on expression levels in cells transfected with control siRNA (E) (Pearson correlation coefficient 0.105, two-tailed p value 0.1031) or KIF22 siRNA (F) (Pearson correlation coefficient –0.005, two-tailed p value 0.9427). See Figure 3—source data 1.
-
Figure 3—source data 1
Polar ejection forces.
Measurements of relative polar ejection forces in HeLa-Kyoto cells expressing KIF22-GFP with pathogenic mutations.
- https://cdn.elifesciences.org/articles/78653/elife-78653-fig3-data1-v2.zip
Figure 4 with 1 supplement
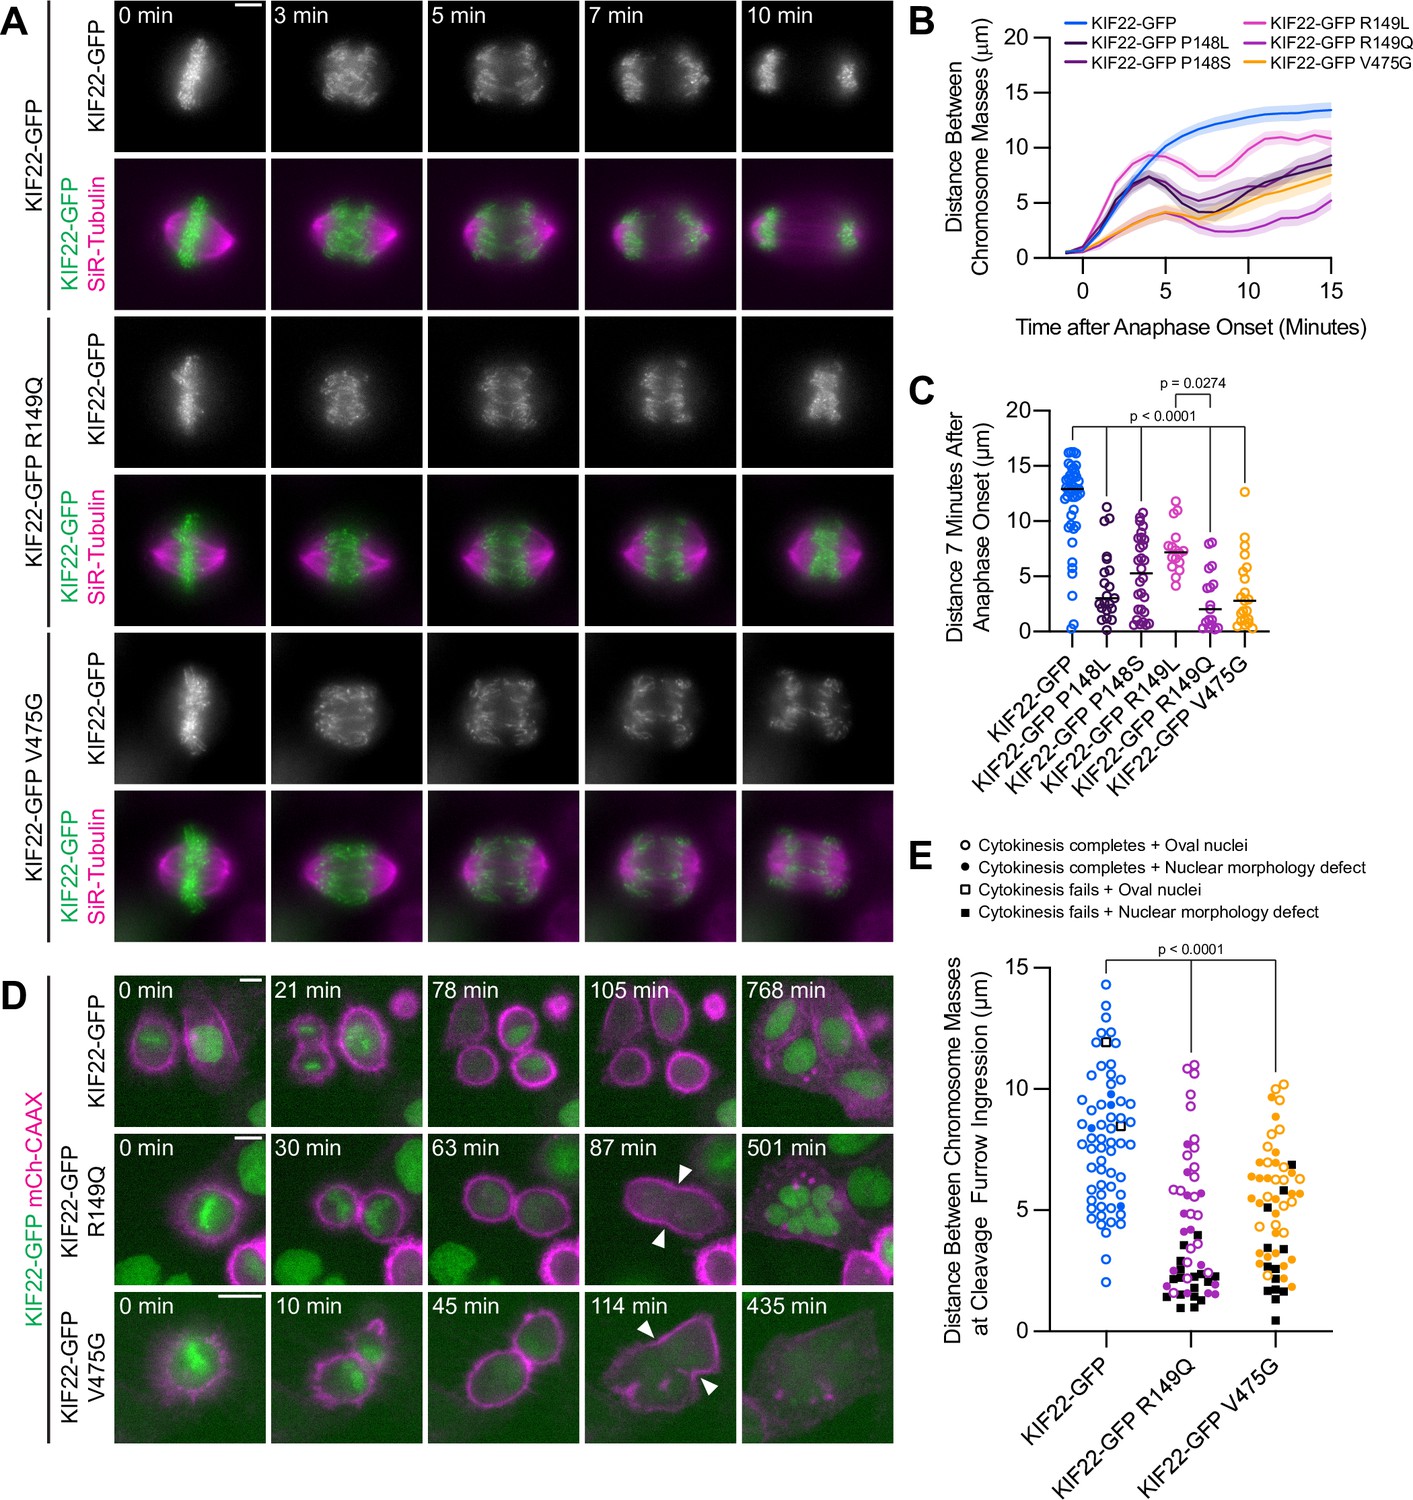
Pathogenic mutations in KIF22 disrupt anaphase chromosome segregation.
(A) Time-lapse images of dividing HeLa-Kyoto cells expressing KIF22-GFP R149Q or KIF22-GFP V475G. Times indicate minutes after anaphase onset. Images are maximum intensity projections in z through the entirety of the spindle. Imaged approximately 18 hr after treatment with doxycycline to induce expression. Scale bar 5 μm. Images are representative of three or more experiments. (B) Distance between separating chromosome masses throughout anaphase in HeLa-Kyoto cells. Lines represent the mean and the shaded area denotes SEM. Forty-three KIF22-GFP cells from 10 experiments, 21 KIF22-GFP P148L cells from 6 experiments, 28 KIF22-GFP P148S cells from 7 experiments, 16 KIF22-GFP R149L cells from 6 experiments, 17 KIF22-GFP R149Q cells from 4 experiments, and 21 KIF22-GFP V475G cells from 21 experiments. (C) Distance between separating chromosome masses 7 min after anaphase onset. Bars indicate medians. P values from Kruskal-Wallis test. P values are greater than 0.05 for comparisons without a marked p value. Data represent the same cell populations presented in (B). (D) Time-lapse images of dividing HeLa-Kyoto cells expressing mCherry (mCh)-CAAX to visualize cell boundaries. Times indicate minutes after anaphase onset. Arrowheads indicate cytokinesis failure. Imaged approximately 8 hr after treatment with doxycycline to induce expression and 24–32 hr after transfection with mCh-CAAX. Scale bars 20 μm. Images are representative of three or more experiments. (E) Distance between chromosome masses at the time of cleavage furrow ingression. P values from Kruskal-Wallis test. P values are greater than 0.05 for comparisons without a marked p value. Sixty-two KIF22-GFP cells from 10 experiments, 52 KIF22-GFP R149Q cells from 9 experiments, and 55 KIF22-GFP V475G cells from 9 experiments. See Figure 4—source data 1.
-
Figure 4—source data 1
Anaphase chromosome segregation and cytokinesis.
Distances between segregating chromosome masses during anaphase in HeLa-Kyoto cells expressing KIF22-GFP with pathogenic mutations. Rates of cytokinesis failure and distances between chromosomes masses at the time of furrow ingression.
- https://cdn.elifesciences.org/articles/78653/elife-78653-fig4-data1-v2.zip
Figure 4—figure supplement 1
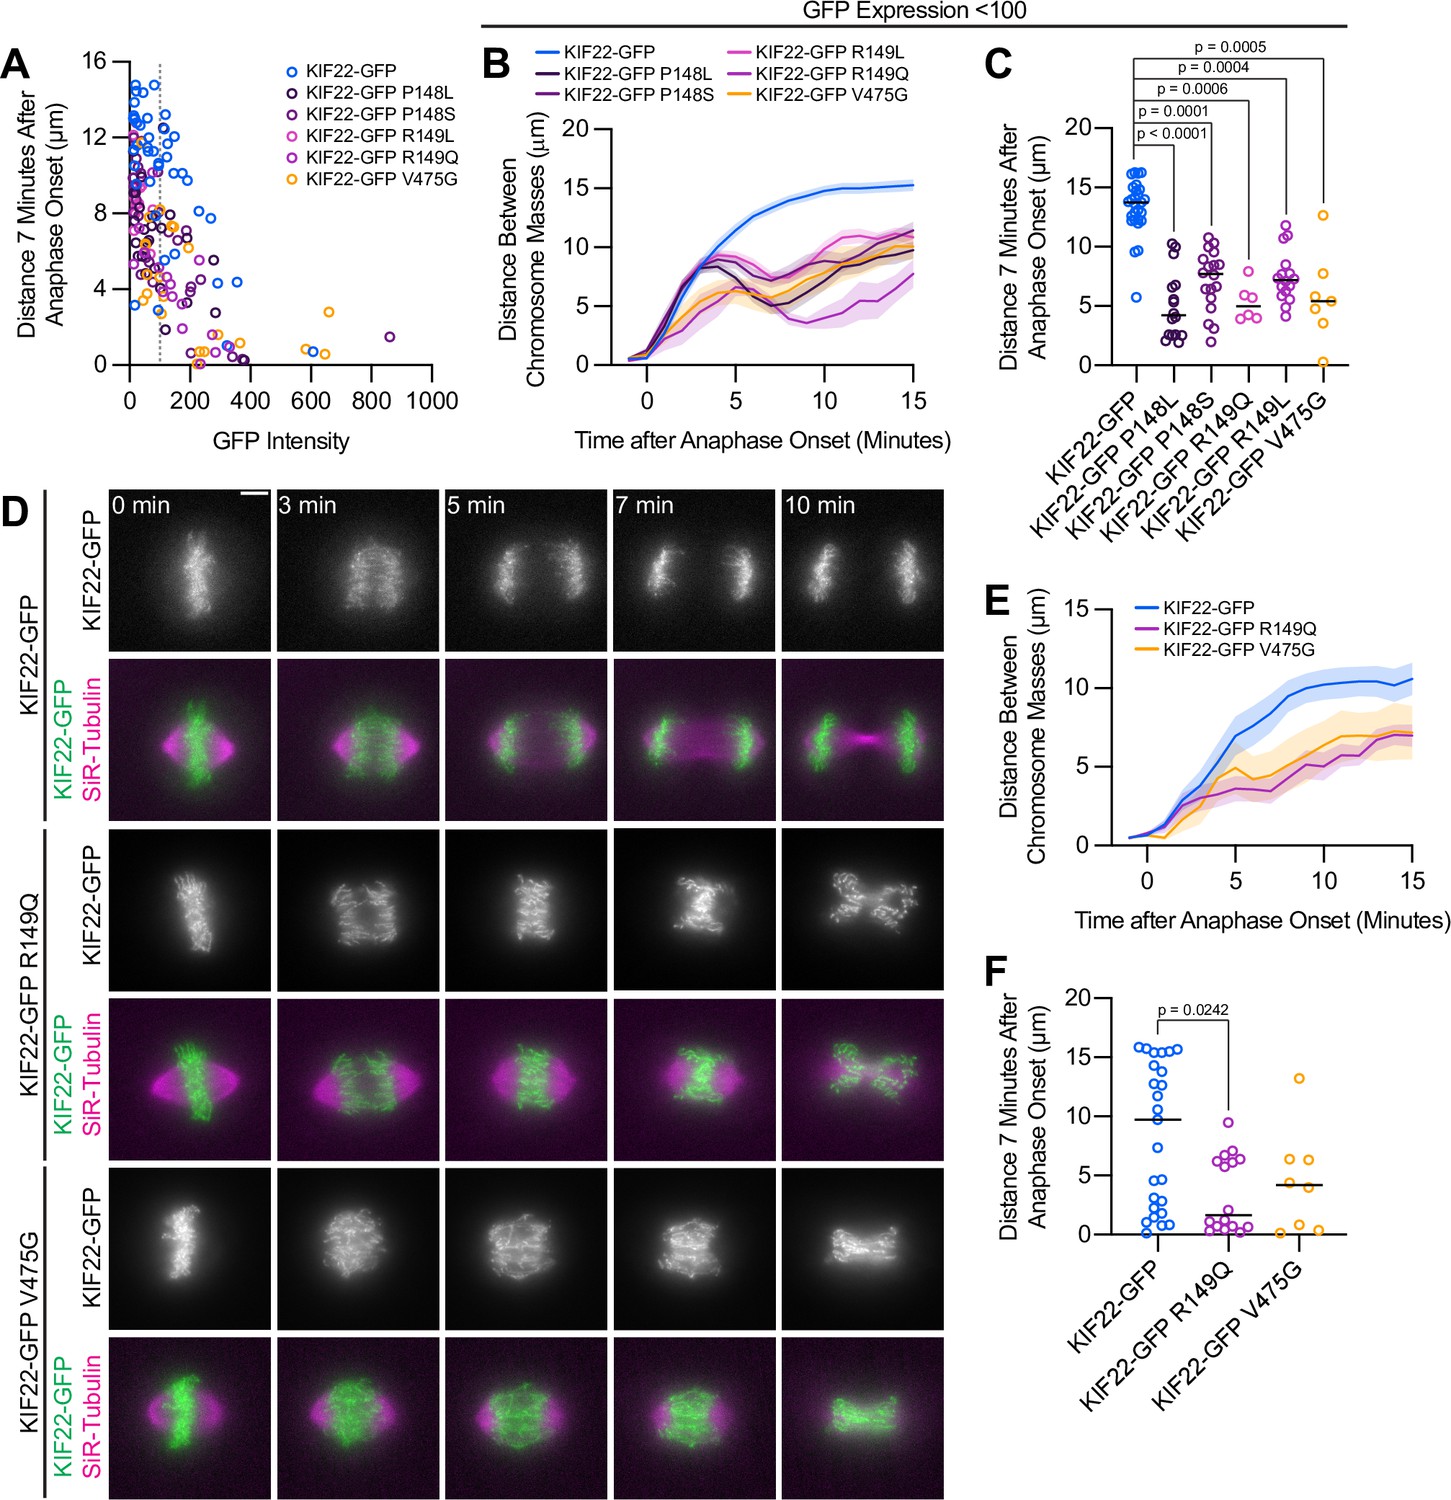
Anaphase recongression defects are KIF22-GFP expression level dependent and disrupt chromosome segregation in RPE1 cells.
(A) Background-subtracted GFP intensity plotted against the distance between separating chromosome masses at 7 min to assess dependence of recongression on expression level (Spearman correlation coefficient –0.6246, one-tailed p-value<0.0001). Gray dashed line indicates mean background subtracted GFP intensity of 100. Forty-three KIF22-GFP cells from 10 experiments, 21 KIF22-GFP P148L cells from 6 experiments, 28 KIF22-GFP P148S cells from 7 experiments, 16 KIF22-GFP R149L cells from 6 experiments, 17 KIF22-GFP R149Q cells from 4 experiments, and 21 KIF22-GFP V475G cells from 21 experiments. (B) Distance between separating chromosome masses of cells expressing lower levels of KIF22-GFP (mean background subtracted GFP intensity less than 100). Lines represent the mean and the shaded area denotes SEM. Twenty-seven KIF22-GFP cells from nine experiments, 16 KIF22-GFP P148L cells from six experiments, 18 KIF22-GFP P148S cells from six experiments, 16 KIF22-GFP R149L cells from six experiments, 6 KIF22-GFP R149Q cells from three experiments, and 7 KIF22-GFP V475G cells from three experiments. (C) Distance between separating chromosome masses 7 min after anaphase onset of cells expressing lower levels of KIF22-GFP (mean background subtracted GFP intensity less than 100). Bars indicate medians. P values from Kruskal-Wallis test. P values are greater than 0.05 for comparisons without a marked p value. Data represent the same cell populations presented in (B). (D) Time-lapse images of dividing RPE-1 cells expressing KIF22-GFP R149Q or KIF22-GFP V475G. Imaged approximately 12–18 hr after treatment with doxycycline to induce expression. Times indicate minutes after anaphase onset. Images are maximum intensity projections in z through the entirety of the spindle. Scale bar 5 μm. Images are representative of three or more experiments. (E) Distance between separating chromosome masses throughout anaphase in RPE-1 cells. Lines represent the mean and the shaded area denotes SEM. Twenty-five KIF22-GFP cells from seven experiments, 16 KIF22-GFP R149Q cells from six experiments, and 8 KIF22-GFP V475G cells from six experiments. (F) Distance between separating chromosome masses 7 min after anaphase onset in RPE-1 cells. Bars indicate medians. P value from Kruskal-Wallis test. P values are greater than 0.05 for comparisons without a marked p value. Data represent the same cell populations presented in (E). See Figure 4—figure supplement 1—source data 1.
-
Figure 4—figure supplement 1—source data 1
RPE-1 anaphase chromosome segregation.
Distances between segregating chromosome masses during anaphase in RPE-1 cells expressing KIF22-GFP with pathogenic mutations.
- https://cdn.elifesciences.org/articles/78653/elife-78653-fig4-figsupp1-data1-v2.zip
Figure 5
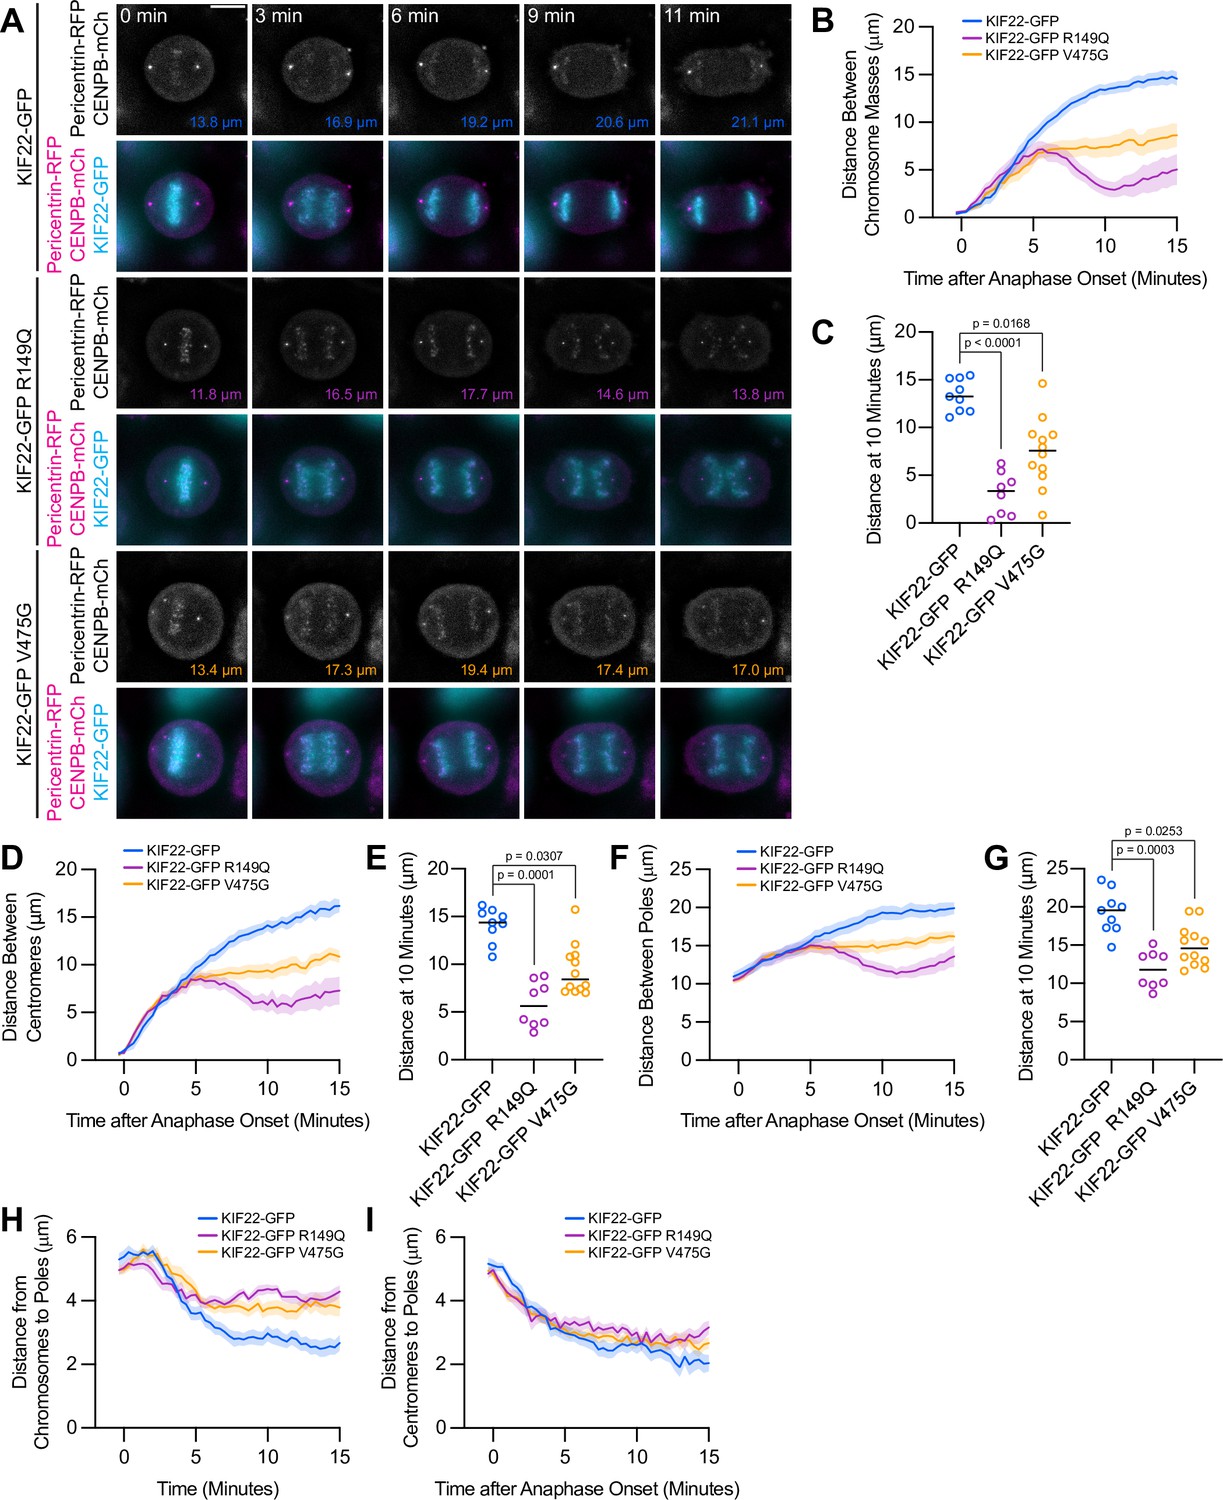
Mutations disrupt the separation of spindle poles in anaphase.
(A) Time-lapse images of dividing HeLa-Kyoto cells expressing pericentrin-RFP to mark the spindle poles and CENPB-mCh to mark centromeres. Times indicate minutes after anaphase onset. Colored distances in the bottom right of each grayscale image indicate the distance between the spindle poles in the image. Images are maximum intensity projections in z through the entirety of the spindle. Imaged approximately 24 hr after transfection and 12–18 hr after treatment with doxycycline to induce expression. Images depicting pericentrin-RFP and CENPB-mCh signal were background subtracted by duplicating each frame, applying a gaussian blur (Sigma-Aldrich 30 pixels), and subtracting this blurred image from the original. Scale bar 10 μm. Images are representative of three or more experiments. (B) Distance between separating chromosome masses throughout anaphase in HeLa-Kyoto cells. Lines represent the mean and the shaded area denotes SEM. (C) Distance between separating chromosome masses 10 min after anaphase onset in HeLa-Kyoto cells. Bars indicate medians. (D) Distance between centromeres (CENPB-mCh) throughout anaphase in HeLa-Kyoto cells. Lines represent the mean and the shaded area denotes SEM. (E) Distance between centromeres 10 min after anaphase onset in HeLa-Kyoto cells. Bars indicate medians. (F) Distance between spindle poles (pericentrin-RFP) throughout anaphase in HeLa-Kyoto cells. Lines represent the mean and the shaded area denotes SEM. (G) Distance between spindle poles 10 min after anaphase onset in HeLa-Kyoto cells. Bars indicate medians. Measurements from the same cells (9 KIF22-GFP cells from five experiments, 8 KIF22-GFP R149Q cells from four experiments, and 12 KIF22-GFP V475G cells from six experiments) are shown in (B–G). For (C, E, and G), p values from Kruskal-Wallis test. (H) Distance between chromosome masses and spindle poles throughout anaphase in HeLa-Kyoto cells. Lines represent the mean and the shaded area denotes SEM. (I) Distance between centromeres and spindle poles throughout anaphase in HeLa-Kyoto cells. Lines represent the mean and the shaded area denotes SEM. Measurements from the same cells (18 KIF22-GFP, 16 KIF22-GFP R149Q, and 24 KIF22-GFP V475G half-spindles) as in (B–G) are shown in (H) and (I). See Figure 5—source data 1.
-
Figure 5—source data 1
Spindle pole and centromere distances.
Distances between segregating chromosome masses, spindle poles, and centromeres during anaphase in HeLa-Kyoto cells expressing KIF22-GFP with pathogenic mutations.
- https://cdn.elifesciences.org/articles/78653/elife-78653-fig5-data1-v2.zip
Figure 6 with 1 supplement
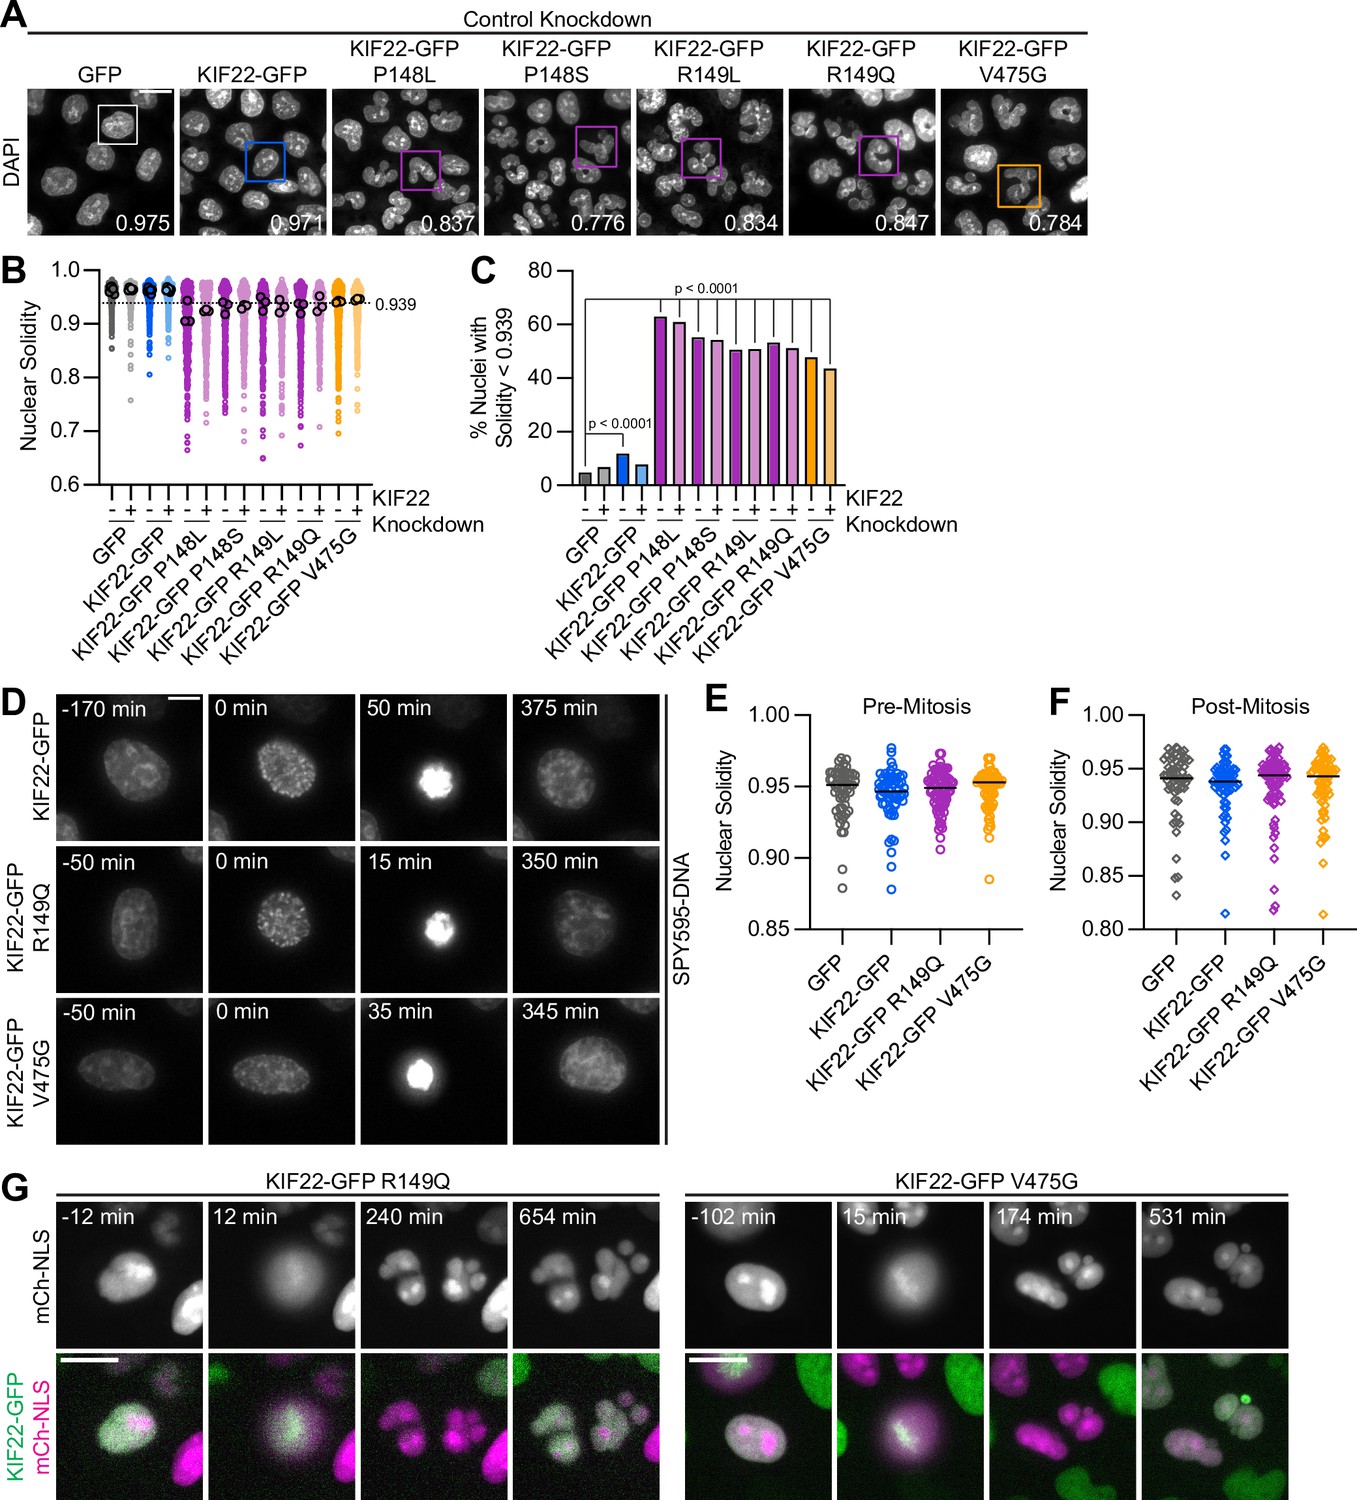
Division of cells expressing KIF22 with pathogenic mutations results in daughter cells with abnormally shaped nuclei.
(A) DAPI stained nuclei of cells expressing KIF22 with pathogenic mutations. Values in the bottom right of each image indicate the solidity of the boxed nucleus. Fixed approximately 24 hr after treatment with doxycycline to induce expression. Scale bar 20 μm. Images are representative of three or more experiments. (B) Measured solidity of nuclei in HeLa-Kyoto cell lines. Small circles represent the solidity of individual nuclei, and large circles with black outlines indicate the median of each experiment. A dashed line marks a solidity value of 0.939, the fifth percentile of solidity for control cells transfected with control siRNA and expressing GFP. (C) Percentage of nuclei with abnormal shape, indicated by a solidity value less than 0.939, the fifth percentile of control (control knockdown, GFP expression) cell solidity. A chi-square test of all data produced a p-value<0.0001. Plotted p values are from pairwise post hoc chi-square tests comparing control (control knockdown, GFP expression) cells to each other condition. Applying the Bonferroni correction for multiple comparisons, a p value of less than 0.00385 was considered significant. P values are greater than 0.00385 for comparisons without a marked p value. Data in (B) and (C) represent 1045 GFP cells transfected with control siRNA, 849 GFP cells transfected with KIF22 siRNA, 994 KIF22-GFP cells transfected with control siRNA, 980 KIF22-GFP cells transfected with KIF22 siRNA, 472 KIF22-GFP P148L cells transfected with control siRNA, 442 KIF22-GFP P148L cells transfected with KIF22 siRNA, 382 KIF22-GFP P148S cells transfected with control siRNA, 411 KIF22-GFP P148S cells transfected with KIF22 siRNA, 336 KIF22-GFP R149L cells transfected with control siRNA, 376 KIF22-GFP R149L cells transfected with KIF22 siRNA, 466 KIF22-GFP R149Q cells transfected with control siRNA, 359 KIF22-GFP R149Q cells transfected with KIF22 siRNA, 605 KIF22-GFP V475G cells transfected with control siRNA, and 386 KIF22-GFP V475G cells transfected with KIF22 siRNA. GFP and KIF22-GFP cells represent six experiments, data from all other cell lines represent three experiments. (D) Time-lapse images of HeLa-Kyoto cells treated with nocodazole and reversine and stained with SPY595-DNA to visualize chromosomes. Time indicates the number of minutes before or after chromosome condensation. Images are maximum intensity projections in z of two focal planes, one at the level of interphase nuclei and one at the level of mitotic chromosomes. Imaged approximately 8 hr after treatment with doxycycline to induce expression, 1.5–2 hr after treatment with SPY595-DNA, and 0.5–1 hr after treatment with nocodazole and reversine. Scale bar 10 μm. Images are representative of three or more experiments. (E) Nuclear solidity of HeLa-Kyoto cells treated with nocodazole and reversine. Measurements were made 15 min before chromosome condensation. (F) Nuclear solidity of HeLa-Kyoto cells treated with nocodazole and reversine. Measurements were made 100 min after chromosome decondensation. Data in (E) and (F) represent 56 GFP, 60 KIF22-GFP, 76 KIF22-GFP R149Q, and 67 KIF22-GFP V475G cells from three experiments per condition. For (E) and (F), bars indicate medians, and the Kruskal-Wallis test indicated no significant difference between groups. (G) Time-lapse images of HeLa-Kyoto cells expressing mCherry (mCh)-NLS to assess nuclear envelope integrity. Times indicate minutes before or after chromosome condensation. Imaged approximately 8 hr after treatment with doxycycline to induce expression and 24 hr after transfection with mCh-CAAX. Scale bar 20 μm. Images are representative of three or more experiments. See Figure 6—source data 1.
-
Figure 6—source data 1
Nuclear morphology.
Solidity of nuclei of HeLa-Kyoto cells expressing KIF22-GFP with pathogenic mutations. Solidity of nuclei of cells treated with nocodazole and reversine, measured before and after mitosis.
- https://cdn.elifesciences.org/articles/78653/elife-78653-fig6-data1-v2.zip
Figure 6—figure supplement 1
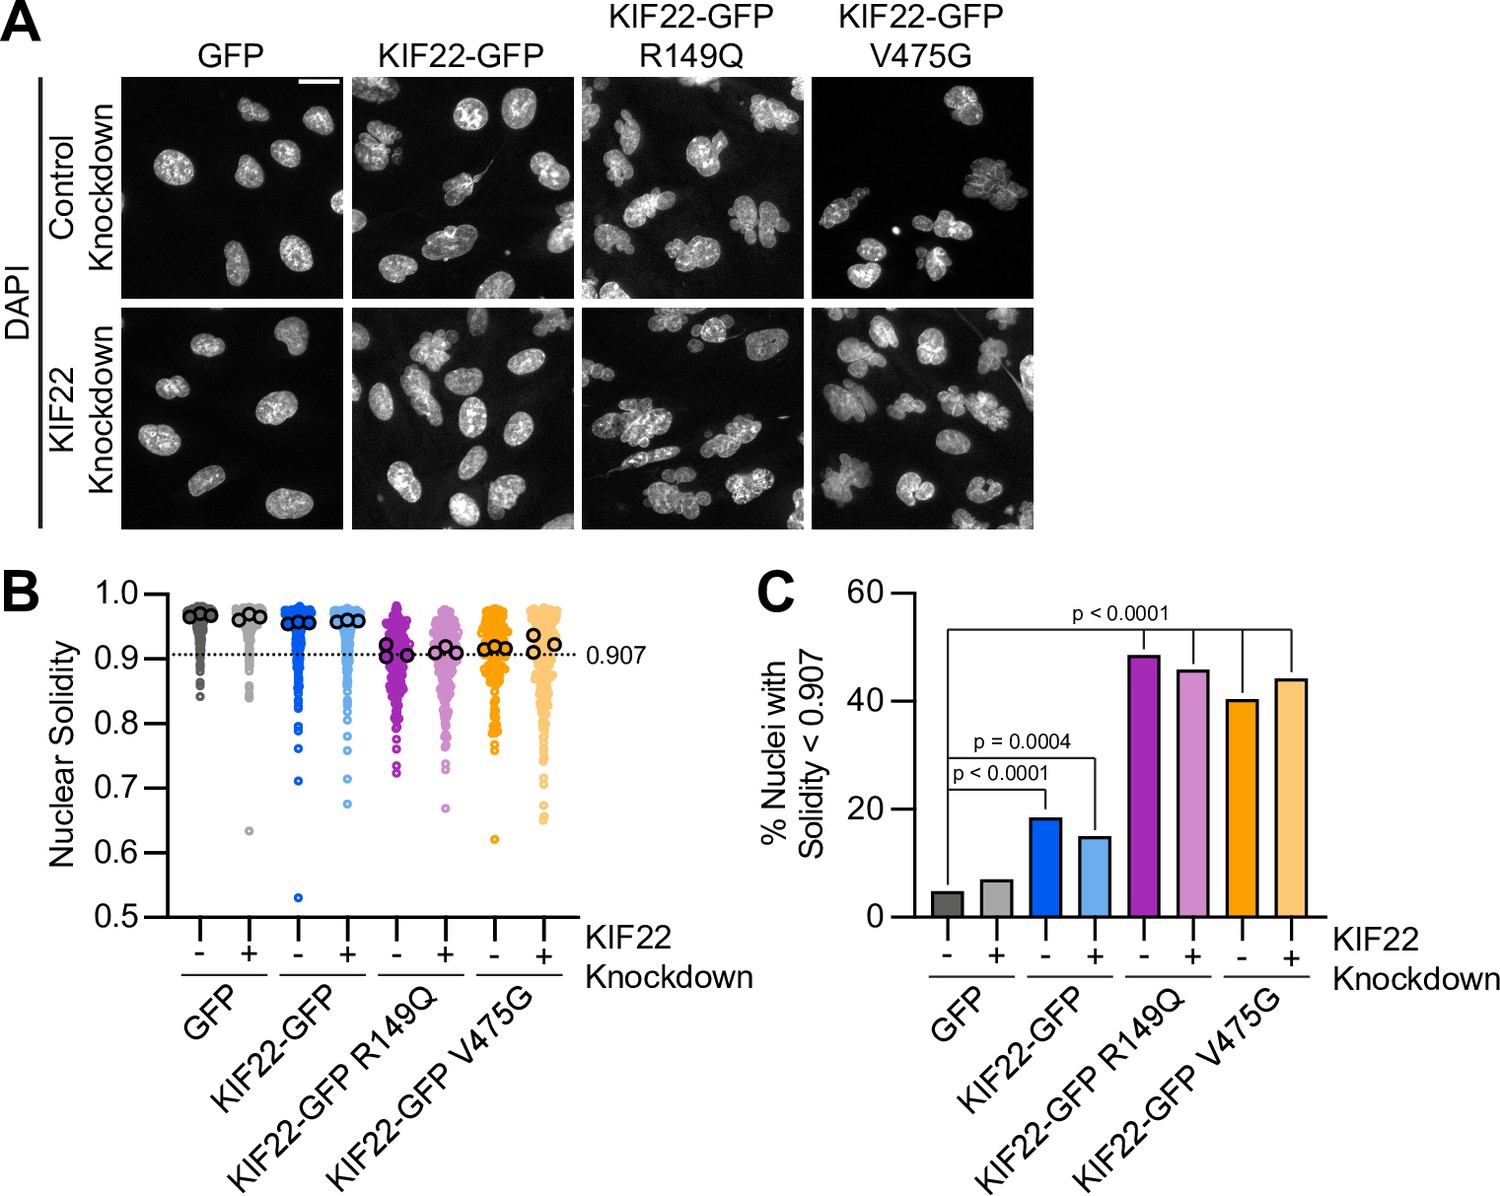
Mutations cause abnormally shaped nuclei in RPE1 cells.
(A) DAPI-stained nuclei of RPE-1 cells expressing KIF22-GFP with pathogenic mutations. Fixed approximately 24 hr after treatment with doxycycline to induce expression. Scale bar 20 μm. Images are representative of three or more experiments. (B) Measured solidity of nuclei in RPE-1 cell lines. Small circles represent the solidity of individual nuclei, and large circles with black outlines indicate the median of each experiment. A dashed line marks a solidity value of 0.907, the fifth percentile of solidity for control cells transfected with control siRNA and expressing GFP. (C) Percentage of nuclei with abnormal shape, indicated by a solidity value less than 0.907, the fifth percentile of control (control knockdown, GFP expression) cell solidity. A chi-square test of all data produced a p-value<0.0001. Plotted p values are from pairwise post hoc chi-square tests comparing control (control knockdown, GFP expression) cells to each other condition. Applying the Bonferroni correction for multiple comparisons, a p value of less than 0.00714 was considered significant. P values are greater than 0.00714 for comparisons without a marked p value. Data in (B) and (C) represent 206 GFP transfected with control siRNA, 200 GFP cells transfected with KIF22 siRNA, 233 KIF22-GFP cells transfected with control siRNA, 240 KIF22-GFP cells transfected with KIF22 siRNA, 214 KIF22-GFP R149Q cells transfected with control siRNA, 207 KIF22-GFP R149Q cells transfected with KIF22 siRNA, 146 KIF22-GFP V475G cells transfected with control siRNA, and 244 KIF22-GFP V475G cells transfected with KIF22 siRNA from three experiments. See Figure 6—figure supplement 1—source data 1.
-
Figure 6—figure supplement 1—source data 1
RPE-1 nuclear morphology.
Solidity of nuclei of RPE-1 cells expressing KIF22-GFP with pathogenic mutations.
- https://cdn.elifesciences.org/articles/78653/elife-78653-fig6-figsupp1-data1-v2.zip
Figure 7

Proliferation is reduced in cells expressing KIF22 with pathogenic mutations.
(A) Time-lapse bright field images of HeLa-Kyoto cells to assess proliferation rate. Scale bar 500 μm. Images are representative of three or more experiments. (B) Proliferation rates measured using automated bright field imaging. Lines represent the mean cell count, normalized to the number of cells at 0 hr, and the shaded area denotes SEM. Black outlined shapes indicate the predicted cell count for cell lines expressing pathogenic mutations at 48 hr if every cell doubled every 20.72 hr (the doubling time measured from 48 hr of control cell proliferation) (square), if the rate of cytokinesis failure limited proliferation and 30% of cells did not divide (diamond), and if the rate of nuclear morphology defects limited proliferation and 60% of cells did not divide (triangle). (C) Fold change of normalized cell counts after 96 hr. Bars indicate medians. P values from Kruskal-Wallis test. P values are greater than 0.05 for comparisons without a marked p value. Data in (B) and (C) represent 8 KIF22 knockdown, 11 GFP, 9 KIF22-GFP, 16 KIF22-GFP R149Q, and 8 KIF22-GFP V475G technical replicates from four experiments. (D) Time-lapse imaging of HeLa-Kyoto cells treated with doxycycline for 24 hr to induce expression of KIF22-GFP with pathogenic mutations and stained with SPY595-DNA. Arrowheads indicate cells with abnormally shaped nuclei that divide. Images are maximum intensity projections in z of two focal planes, one at the level of interphase nuclei and one at the level of mitotic chromosomes. Scale bars 20 μm. Images are representative of three or more experiments. (E) Nuclear morphology at the start of imaging (dark gray or blue, oval; light gray or blue; abnormal morphology) and outcome (gray, cell divides during the experiment; blue, the cell does not divide). The total number of dividing cells was compared between cell lines using the chi-square test (p<0.0001 across all conditions). Post hoc chi-square tests comparing all conditions to one another indicated that the proliferation rate of cells expressing KIF22-GFP R149Q is statistically different than that of cells expressing GFP (p=0.0025), KIF22-GFP (p=0.0003), or KIF22-GFP V475G (p<0.0001). Applying the Bonferroni correction for multiple comparisons, a p value of less than 0.008 was considered significant. P values are greater than 0.008 for all other comparisons. 2461 GFP, 2611 KIF22-GFP, 1890 KIF22-GFP R149Q, and 2346 KIF22-GFP V465G cells. See Figure 7—source data 1.
-
Figure 7—source data 1
Proliferation.
Cell counts measuring the proliferation of HeLa-Kyoto cells expressing KIF22-GFP with pathogenic mutations. Outcomes of divisions of cells with abnormal nuclear shape.
- https://cdn.elifesciences.org/articles/78653/elife-78653-fig7-data1-v2.zip
Figure 8 with 1 supplement
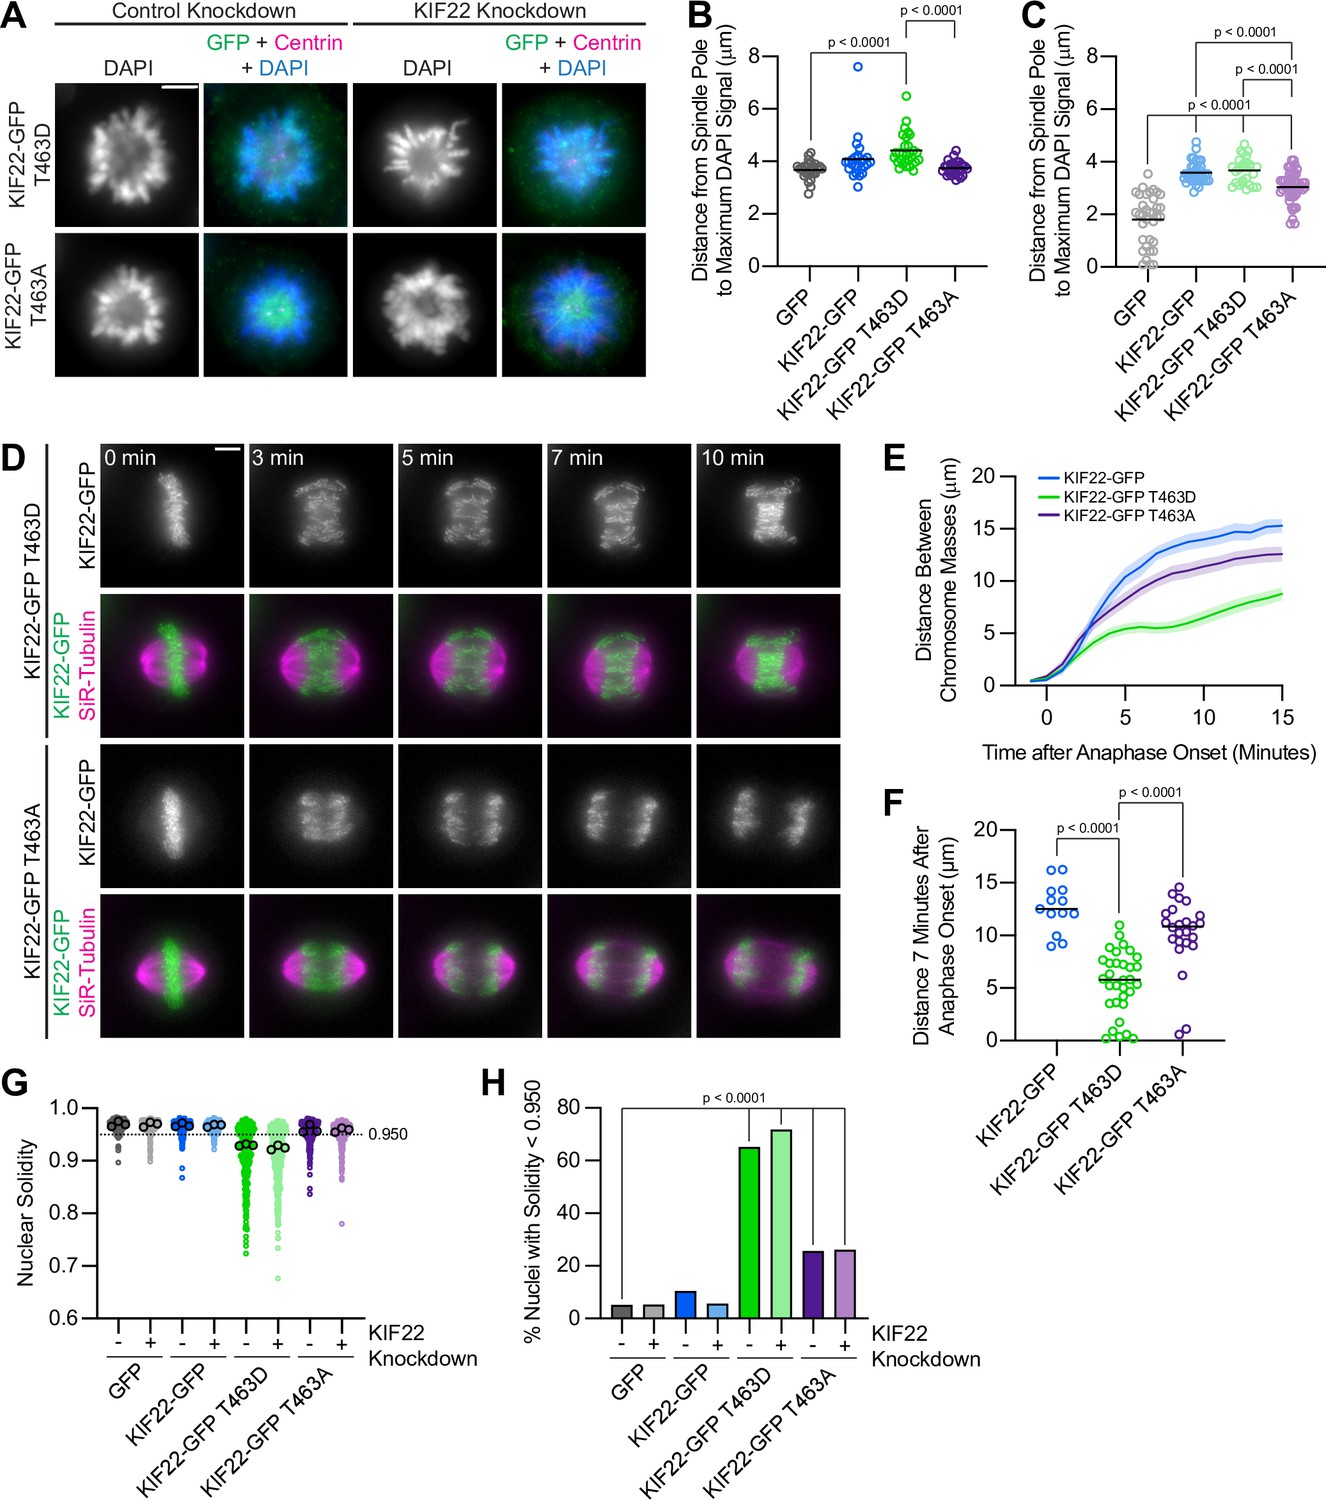
Phosphomimetic mutation of T463 phenocopies pathogenic mutations in KIF22.
(A) Immunofluorescence images of monopolar HeLa-Kyoto cells. KIF22-GFP was visualized using an anti-GFP antibody. Fixed approximately 2–3 hr after treatment with monastrol and 24 hr after siRNA transfection and treatment with doxycycline to induce expression. Scale bar 5 μm. Images are representative of three or more experiments. (B) Distance from the spindle pole to the maximum DAPI signal, a measure of relative polar ejection force level, between HeLa-Kyoto cell lines expressing KIF22-GFP with phosphomimetic and phosphonull mutations at T463. Twenty-six GFP cells from three experiments, 26 KIF22-GFP cells from three experiments, 29 KIF22-GFP T463D cells from three experiments, and 29 KIF22-GFP T463A cells from three experiments. (C) Distance from the spindle pole to the maximum DAPI signal in cells depleted of endogenous KIF22 and expressing KIF22-GFP with phosphomimetic and phosphonull mutations at T463. Thirty-five GFP cells from four experiments, 36 KIF22-GFP cells from four experiments, 27 KIF22-GFP T463D cells from three experiments, and 47 KIF22-GFP T463A cells from four experiments. For (B, C), bars indicate means. P values from Brown-Forsythe and Welch ANOVA with Dunnett’s T3 multiple comparisons test. P values are greater than 0.05 for comparisons without a marked p value. (D) Time-lapse images of dividing HeLa-Kyoto cells. Cells expressing KIF22-GFP T463D exhibit recongression of the chromosomes during anaphase. Times indicate minutes after anaphase onset. Images are maximum intensity projections in z through the entirety of the spindle. Imaged approximately 18 hr after treatment with doxycycline to induce expression. Scale bar 5 μm. Images are representative of three or more experiments. (E) Distance between separating chromosome masses throughout anaphase in HeLa-Kyoto cells. Lines represent the mean and the shaded area denotes SEM. Thirteen KIF22-GFP, 32 KIF22-GFP T463D, and 24 KIF22-GFP T463A cells from five experiments. (F) Distance between separating chromosome masses 7 min after anaphase onset. Bars indicate medians. P values from Kruskal-Wallis test. P values are greater than 0.05 for comparisons without a marked p value. Thirteen KIF22-GFP, 32 KIF22-GFP T463D, and 24 KIF22-GFP T463A cells from five experiments per condition. (G) Measured solidity of nuclei in HeLa-Kyoto cell lines. Small circles represent the solidity of individual nuclei, and large circles with black outlines indicate the median of each experiment. A dashed line marks a solidity value of 0.950, the fifth percentile of solidity for control cells transfected with control siRNA and expressing GFP. (H) Percentage of nuclei with abnormal shape, indicated by a solidity value less than 0.950, the fifth percentile of control (control knockdown, GFP expression) cell solidity. A chi-square test of all data produced a p-value<0.0001. Plotted p values are from pairwise post hoc chi-square tests comparing control (control knockdown, GFP expression) cells to each other condition. Applying the Bonferroni correction for multiple comparisons, a p value of less than 0.00714 was considered significant. P values are greater than 0.00714 for comparisons without a marked p value. Data in (G) and (H) represent 312 GFP cells transfected with control siRNA, 362 GFP cells transfected with KIF22 siRNA, 314 KIF22-GFP cells transfected with control siRNA, 320 KIF22-GFP cells transfected with KIF22 siRNA, 361 KIF22-GFP T463D cells transfected with control siRNA, 376 KIF22-GFP T463D cells transfected with KIF22 siRNA, 312 KIF22-GFP T463A cells transfected with control siRNA, and 376 KIF22-GFP T463A cells transfected with KIF22 siRNA from three experiments. See Figure 8—source data 1.
-
Figure 8—source data 1
T463 phosphomutants.
Measurements of relative polar ejection forces, distances between segregating chromosome masses, and nuclear solidity of HeLa-Kyoto cells expressing KIF22-GFP with mutations at T463.
- https://cdn.elifesciences.org/articles/78653/elife-78653-fig8-data1-v2.zip
Figure 8—figure supplement 1
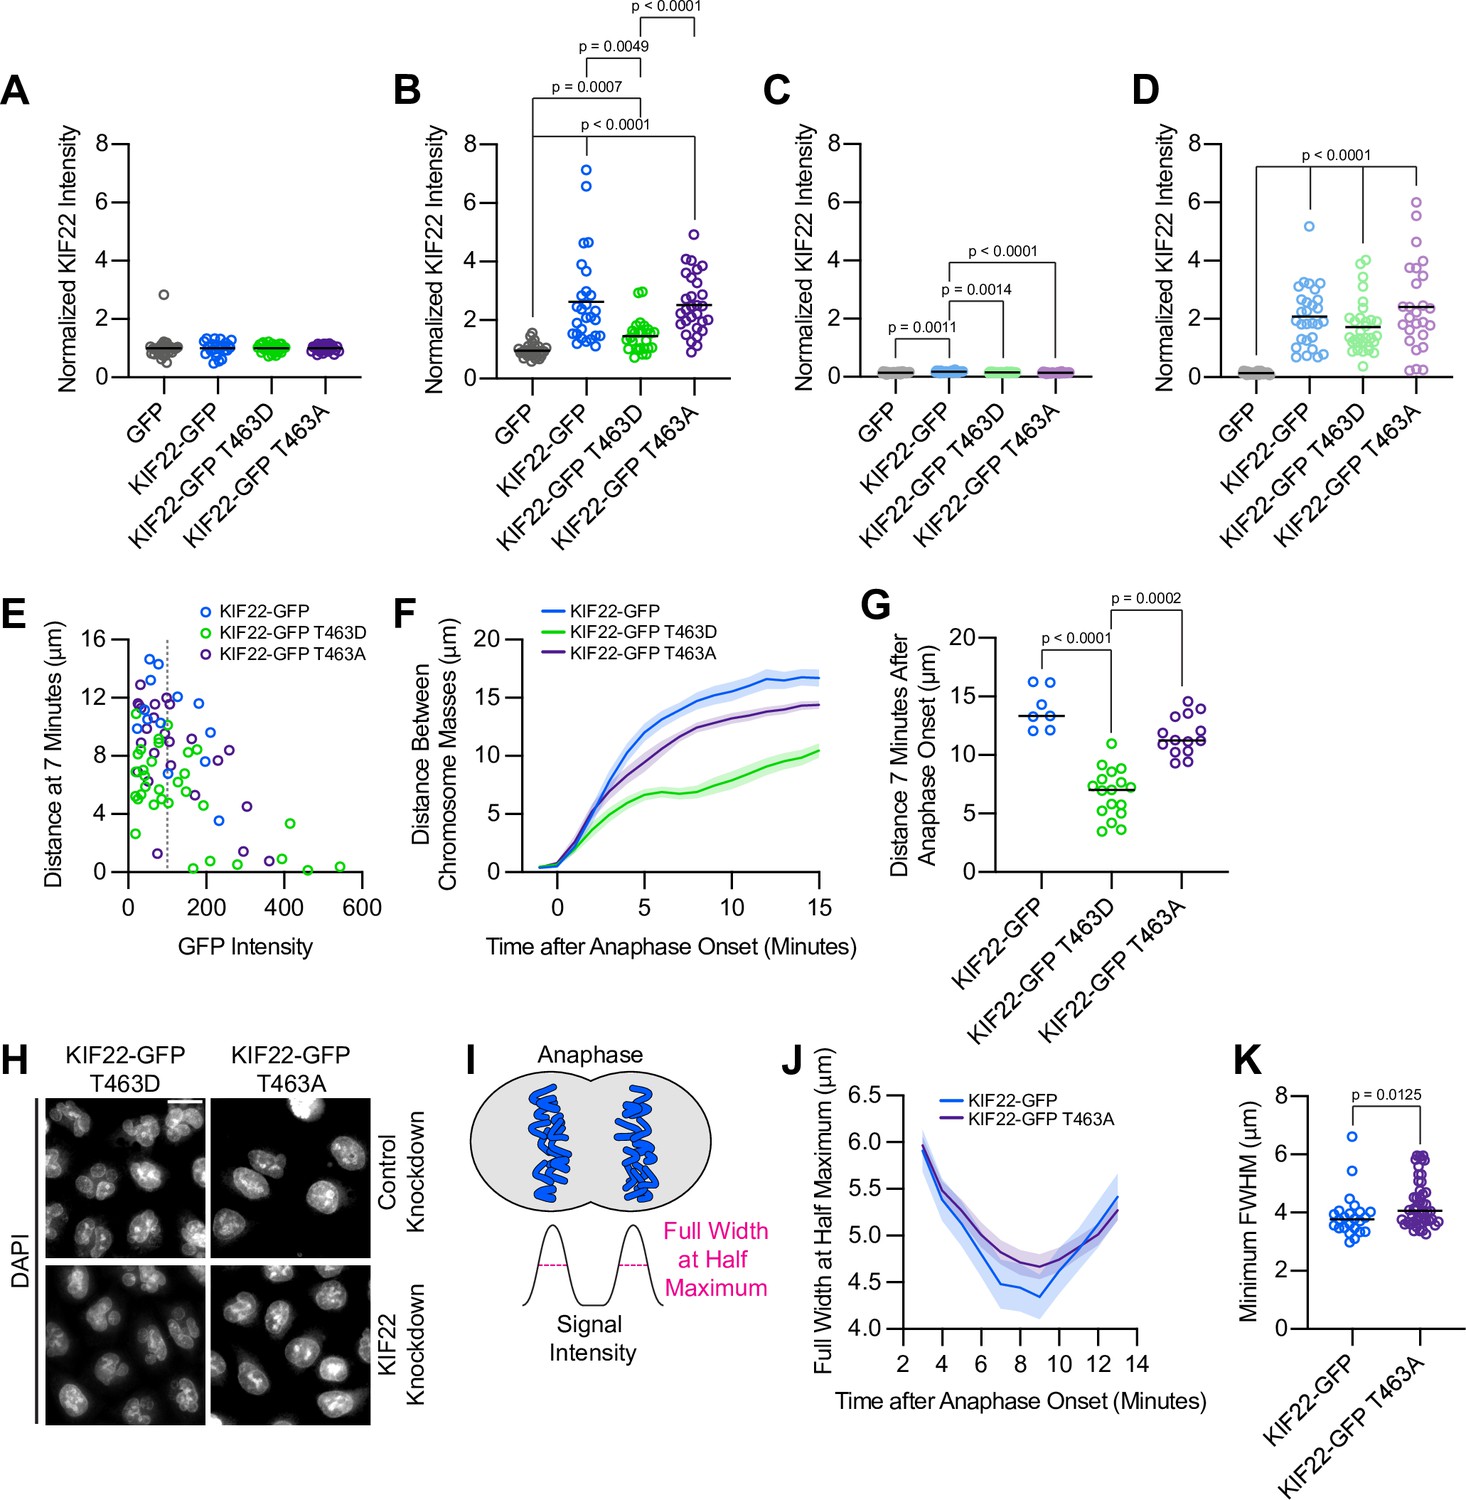
Cells expressing KIF22-GFP T463A have broader anaphase chromosome masses.
(A–D) Quantification of KIF22 fluorescence intensity in untreated HeLa-Kyoto cells transfected with control siRNA (A), cells treated with doxycycline to induce expression and transfected with control siRNA (B), untreated cells transfected with KIF22 siRNA (C), and cells treated with doxycycline and transfected with KIF22 siRNA (D) normalized to the mean intensity of uninduced, control knockdown cells (endogenous KIF22 expression level) for each cell line (A). Thirty-two GFP, 25 KIF22-GFP,28 KIF22-GFP T463D, and 31 KIF22-GFP T463A untreated cells transfected with control siRNA (A), 29 GFP, 27 KIF22-GFP, 27 KIF22-GFP T463D, and 29 KIF22-GFP T463A doxycycline-treated cells transfected with control siRNA (B), 25 GFP, 26 KIF22-GFP, 23 KIF22-GFP T463D, and 26 KIF22-GFP T463A untreated cells transfected with KIF22 siRNA (C), 28 GFP, 28 KIF22-GFP, 31 KIF22-GFP T463D, and 26 KIF22-GFP T463A doxycycline-treated cells transfected with KIF22 siRNA (D), from three experiments. Bars represent means. P values from Brown-Forsythe and Welch ANOVA with Dunnett’s T3 multiple comparisons test. P values are greater than 0.05 for comparisons without a marked p value. (E) Plotting background-subtracted GFP intensity against the distance between separating chromosome masses at 7 min indicates that this distance is dependent on expression level (Spearman correlation coefficient –0.3964, one-tailed p-value=0.0004). Gray dashed line indicates mean background subtracted GFP intensity of 100. Thirteen KIF22-GFP, 32 KIF22-GFP T463D, and 24 KIF22-GFP T463A cells from five experiments. (F) Distance between separating chromosome masses of cells expressing lower levels of KIF22-GFP (mean background subtracted GFP intensity less than 100). Lines represent the mean and the shaded area denotes SEM. Seven KIF22-GFP cells from four experiments, 17 KIF22-GFP T463D cells from five experiments, and 14 KIF22-GFP T463A cells from four experiments. (G) Distance between separating chromosome masses 7 min after anaphase onset of cells expressing lower levels of KIF22-GFP (mean background subtracted GFP intensity less than 100). Bars indicate medians. P values from Kruskal-Wallis test. P values are greater than 0.05 for comparisons without a marked p value. Seven KIF22-GFP cells from four experiments, 17 KIF22-GFP T463D cells from five experiments, and 14 KIF22-GFP T463A cells from four experiments. (H) DAPI-stained nuclei of Hela-Kyoto cells. Fixed approximately 24 hr after treatment with doxycycline to induce expression. Scale bar 20 μm. Images are representative of three or more experiments. (I) Schematic depicting the measurement of chromosome signal intensity in anaphase and the use of the full width at half maximum (FWHM) as a measure of anaphase chromosome mass broadness. (J) FWHM of the plotted intensities of separating chromosome masses of HeLa-Kyoto cells expressing KIF22-GFP or KIF22-GFP T463A. Lines represent the mean and the shaded area denotes SEM. (K) Minimum FWHM value, representing maximal anaphase chromosome compaction, between cells expressing KIF22-GFP and KIF22-GFP T463A. P value from Mann-Whitney test. Bars represent medians. Data in (J) and (K) represent 12 KIF22-GFP and 24 KIF22-GFP T463A cells (24 KIF22-GFP and 48 KIF22-GFP T463A chromosome masses) from five experiments. See Figure 8—figure supplement 1—source data 1.
-
Figure 8—figure supplement 1—source data 1
T463 KIF22 expression level.
KIF22 expression levels in HeLa-Kyoto cells expressing KIF22-GFP with mutations at T463. Broadness of segregating anaphase chromosome masses in cells expressing KIF22-GFP T463A.
- https://cdn.elifesciences.org/articles/78653/elife-78653-fig8-figsupp1-data1-v2.zip
Figure 9 with 3 supplements
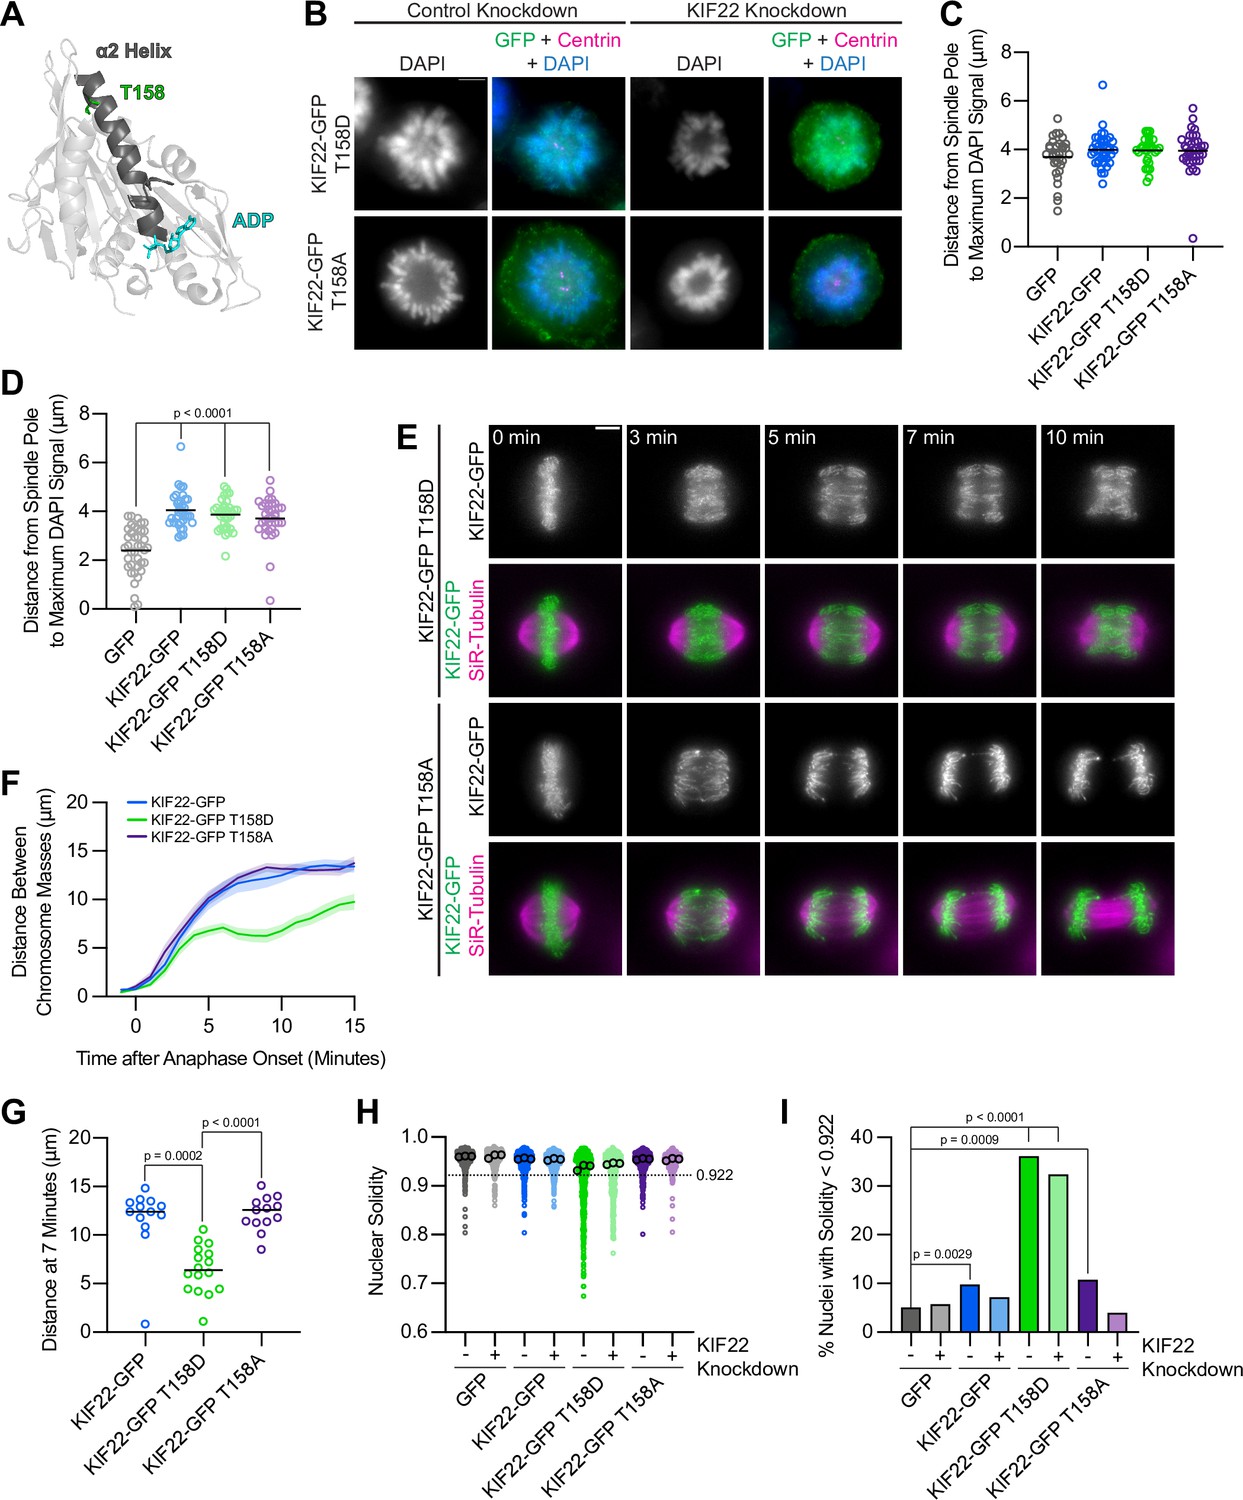
Mimicking phosphorylation of T158 in the motor domain affects KIF22 inactivation.
(A) Location of amino acid T158 in the α2 helix of the KIF22 motor domain (PDB 6NJE). (B) Immunofluorescence images of monopolar HeLa-Kyoto cells. KIF22-GFP was visualized using an anti-GFP antibody. Fixed approximately 2–3 hr after treatment with monastrol and 24 hr after siRNA transfection and treatment with doxycycline to induce expression. Scale bar 5 μm. Images are representative of three or more experiments. (C) Distance from the spindle pole to the maximum DAPI signal, a measure of relative polar ejection force level, in HeLa-Kyoto cell lines expressing KIF22-GFP with phosphomimetic and phosphonull mutations at T158. Thirty-three GFP, 40 KIF22-GFP, 31 KIF22-GFP T158D, and 36 KIF22-GFP T158A cells from three experiments. (D) Distance from the spindle pole to the maximum DAPI signal in cells depleted of endogenous KIF22 and expressing KIF22-GFP with phosphomimetic and phosphonull mutations at T158. Thirty-nine GFP, 35 KIF22-GFP, 34 KIF22-GFP T158D, and 34 KIF22-GFP T158A cells from three experiments. For (C, D), bars indicate means. P values from Brown-Forsythe and Welch ANOVA with Dunnett’s T3 multiple comparisons test. P values are greater than 0.05 for comparisons without a marked p value. (E) Time-lapse images of dividing HeLa-Kyoto cells. Cells expressing KIF22-GFP T158D exhibit recongression of the chromosomes during anaphase. Times indicate minutes after anaphase onset. Images are maximum intensity projections in z through the entirety of the spindle. Imaged approximately 18 hr after treatment with doxycycline to induce expression. Scale bar 5 μm. Images are representative of three or more experiments. (F) Distance between separating chromosome masses throughout anaphase in HeLa-Kyoto cells. Lines represent the mean and the shaded area denotes SEM. Thirteen KIF22-GFP, 16 KIF22-GFP T158D, and 13 KIF22-GFP T158A cells from five experiments. (G) Distance between separating chromosome masses 7 min after anaphase onset. Bars indicate medians. P values from Kruskal-Wallis test. P values are greater than 0.05 for comparisons without a marked p value. Thirteen KIF22-GFP, 16 KIF22-GFP T158D, and 13 KIF22-GFP T158A cells from five experiments. (H) Measured solidity of nuclei in HeLa-Kyoto cell lines. Small circles represent the solidity of individual nuclei, and large circles with black outlines indicate the median of each experiment. A dashed line marks a solidity value of 0.922, the fifth percentile of solidity for control cells transfected with control siRNA and expressing GFP. (I) Percentage of nuclei with abnormal shape, indicated by a solidity value less than 0.922, the fifth percentile of control (control knockdown, GFP expression) cell solidity. A chi-square test of all data produced a p-value<0.0001. Plotted p values are from pairwise post hoc chi-square tests comparing control (control knockdown, GFP expression) cells to each other condition. Applying the Bonferroni correction for multiple comparisons, a p value of less than 0.00714 was considered significant. P values are greater than 0.00714 for comparisons without a marked p value. Data in (H) and (I) represent 514 GFP control knockdown, 418 GFP KIF22 knockdown, 613 KIF22-GFP control knockdown, 584 KIF22-GFP KIF22 knockdown, 644 KIF22-GFP T158D control knockdown, 432 KIF22-GFP T158D KIF22 knockdown, 477 KIF22-GFP T158A control knockdown, and 427 KIF22-GFP T158A KIF22 knockdown cells from three experiments. See Figure 9—source data 1.
-
Figure 9—source data 1
T158 phosphomutants.
Measurements of relative polar ejection forces, distances between segregating chromosome masses, and nuclear solidity of HeLa-Kyoto cells expressing KIF22-GFP with mutations at T158.
- https://cdn.elifesciences.org/articles/78653/elife-78653-fig9-data1-v2.zip
Figure 9—figure supplement 1
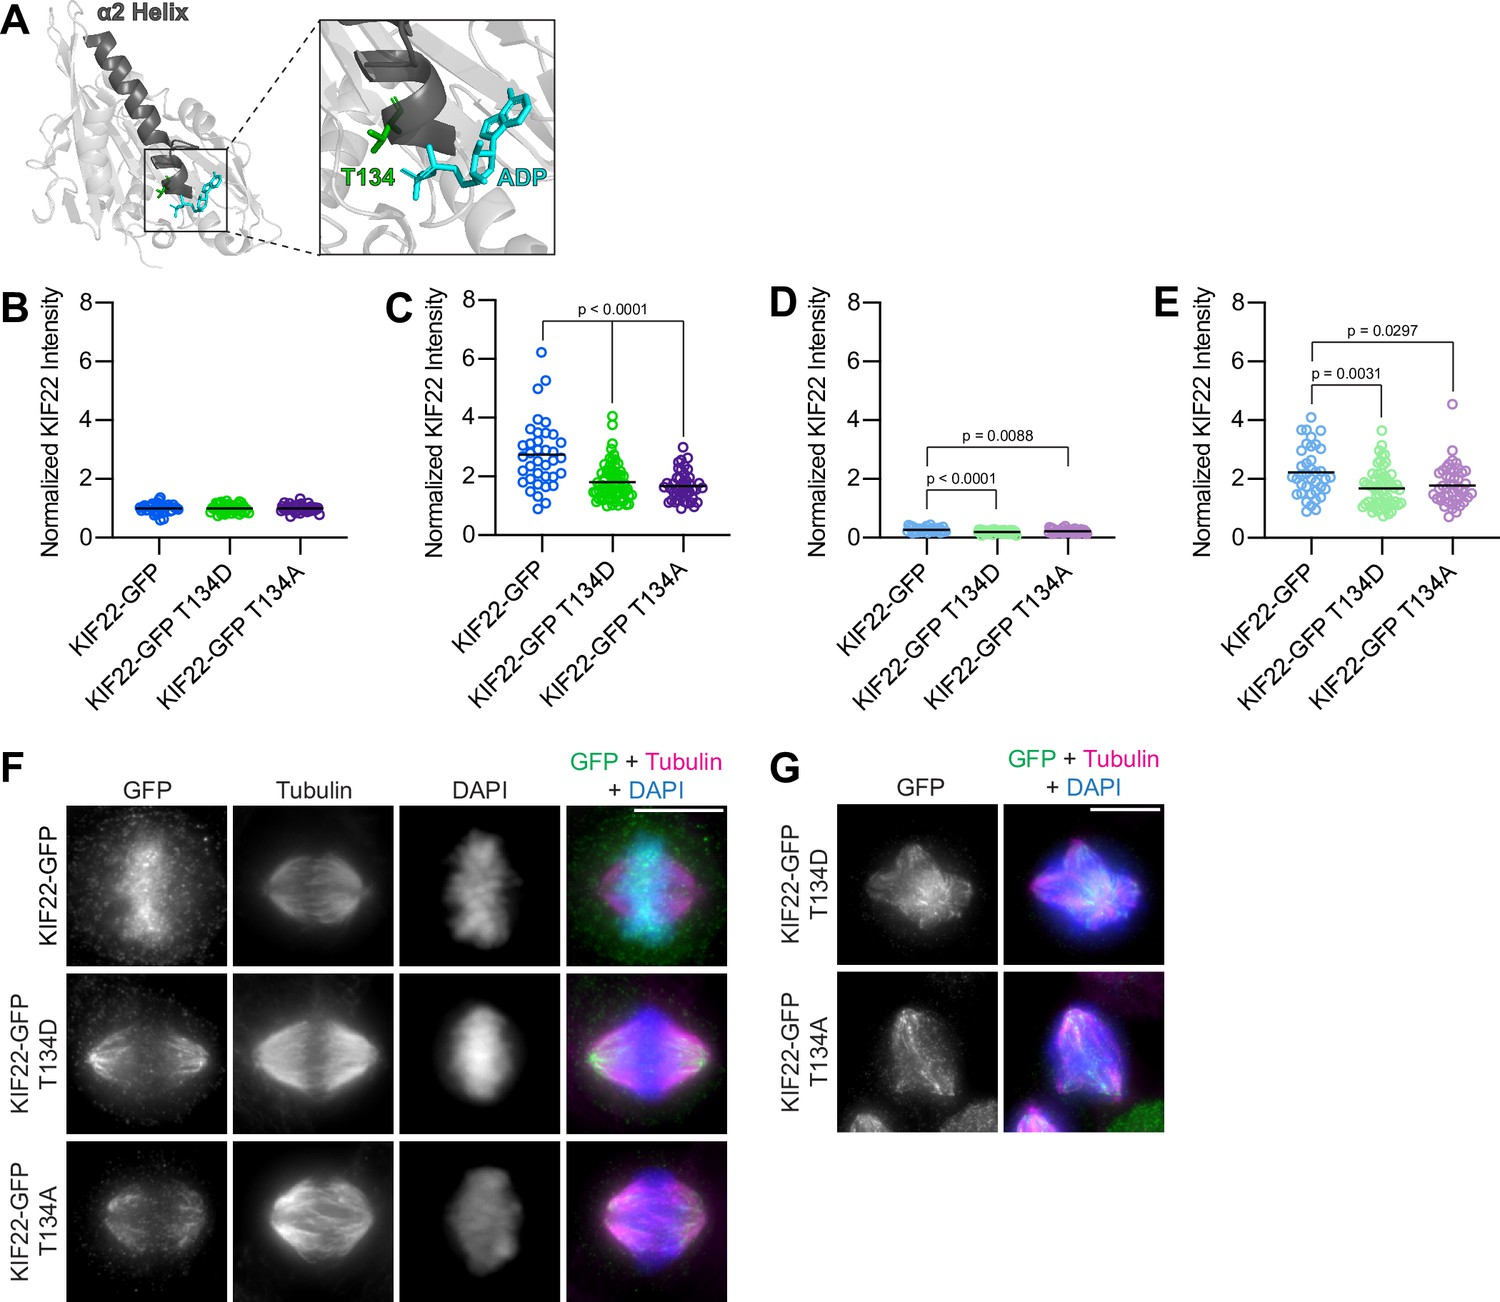
Mimicking phosphoregulation of T134 disrupts KIF22 localization.
(A) Location of amino acid T134 in the α2 helix of the KIF22 motor domain (PDB 6NJE). (B–E) Quantification of KIF22 fluorescence intensity in untreated HeLa-Kyoto cells transfected with control siRNA (B), cells treated with doxycycline to induce expression and transfected with control siRNA (C), untreated cells transfected with KIF22 siRNA (D), and cells treated with doxycycline and transfected with KIF22 siRNA (E) normalized to the mean intensity of uninduced, control knockdown cells (endogenous KIF22 expression level) for each cell line (B). Thirty-five KIF22-GFP, 38 KIF22-GFP T134D, and 34 KIF22-GFP T134A untreated cells transfected with control siRNA (B), 37 KIF22-GFP, 64 KIF22-GFP T134D, and 44 KIF22-GFP T134A doxycycline-treated cells transfected with control siRNA (C), 31 KIF22-GFP, 42 KIF22-GFP T134D, and 42 KIF22-GFP T134A untreated cells transfected with KIF22 siRNA (D), 38 KIF22-GFP, 60 KIF22-GFP T134D, and 46 KIF22-GFP T134A doxycycline-treated cells transfected with KIF22 siRNA (E), from three experiments. Bars represent means. P values from Brown-Forsythe and Welch ANOVA with Dunnett’s T3 multiple comparisons test. P values are greater than 0.05 for comparisons without a marked p value. (F) Immunofluorescence images of HeLa-Kyoto cells expressing KIF22-GFP constructs in metaphase. KIF22-GFP was visualized using an anti-GFP antibody. Images are maximum intensity projections in z. Fixed approximately 24 hr after treatment with doxycycline to induce expression. Scale bar 10 μm. (G) Immunofluorescence images of multipolar HeLa-Kyoto cells expressing KIF22-GFP T134D or KIF22-GFP T134A. Images are maximum intensity projections in z. Fixed approximately 24 hr after treatment with doxycycline to induce expression. Scale bar 10 μm. See Figure 9—figure supplement 1—source data 1.
-
Figure 9—figure supplement 1—source data 1
T134 phosphomutants.
KIF22 expression levels in HeLa-Kyoto cells expressing KIF22-GFP with mutations at T134.
- https://cdn.elifesciences.org/articles/78653/elife-78653-fig9-figsupp1-data1-v2.zip
Figure 9—figure supplement 2
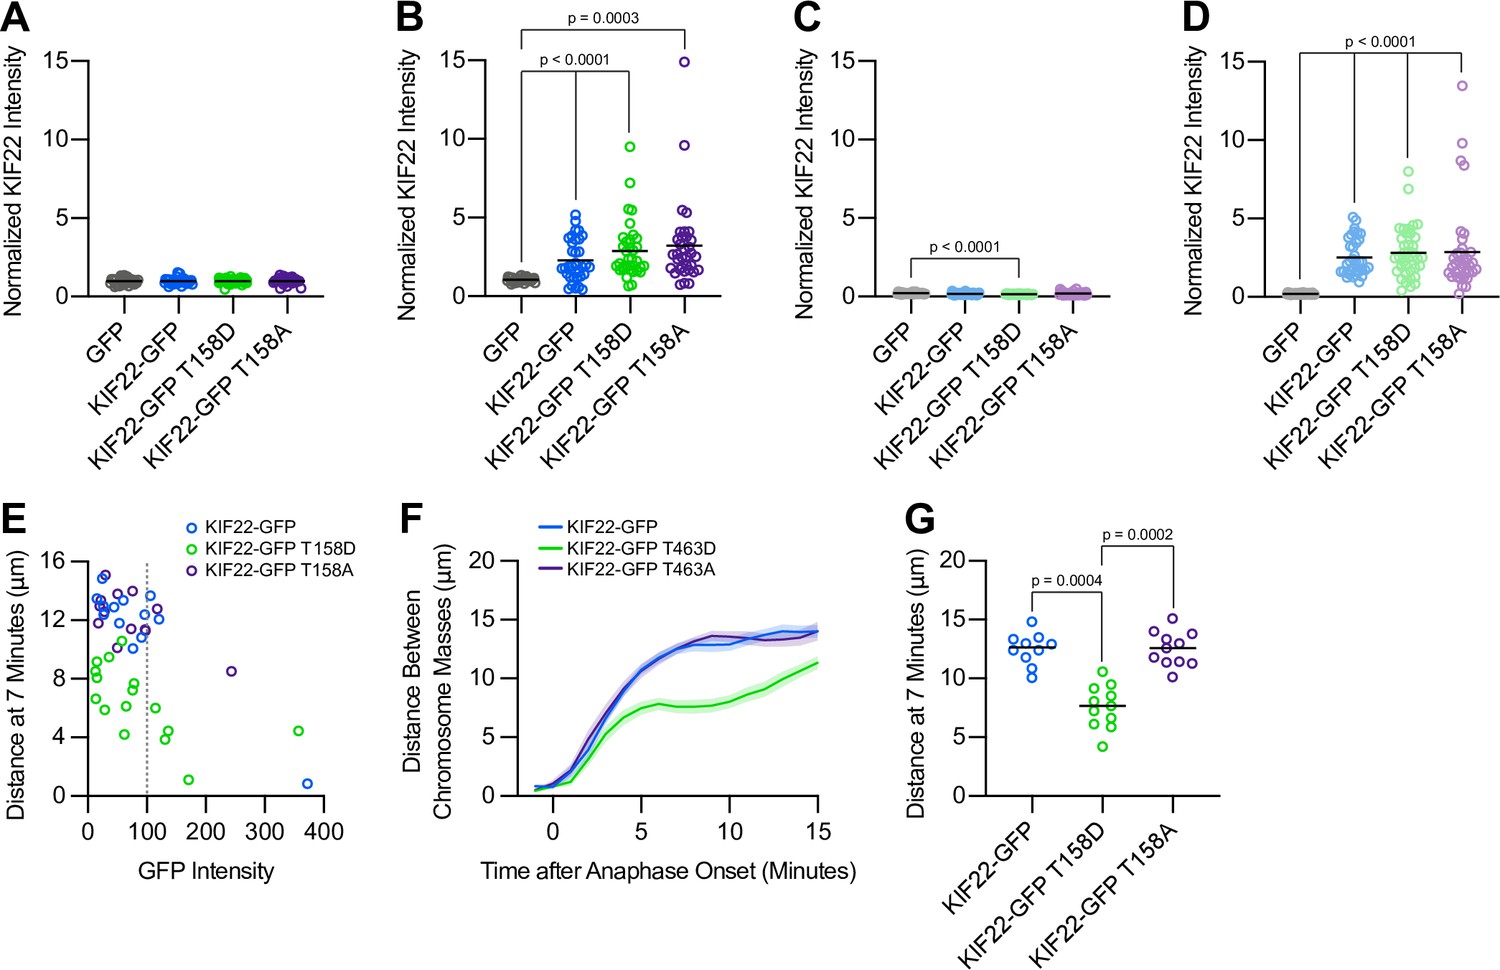
Analysis of KIF22 expression level effects on chromosome recongression in cells expressing KIF22-GFP T158D and KIF22-GFP T158A.
(A–D) Quantification of KIF22 fluorescence intensity in untreated HeLa-Kyoto cells transfected with control siRNA (A), cells treated with doxycycline to induce expression and transfected with control siRNA (B), untreated cells transfected with KIF22 siRNA (C), and cells treated with doxycycline and transfected with KIF22 siRNA (D) normalized to the mean intensity of uninduced, control knockdown cells (endogenous KIF22 expression level) for each cell line (A). Thirty-two GFP, 31 KIF22-GFP, 40 KIF22-GFP T158D, and 28 KIF22-GFP T158A untreated cells transfected with control siRNA (A), 29 GFP, 34 KIF22-GFP, 35 KIF22-GFP T158D, and 34 KIF22-GFP T158A doxycycline-treated cells transfected with control siRNA (B), 28 GFP, 36 KIF22-GFP, 35 KIF22-GFP T158D, and 30 KIF22-GFP T158A untreated cells transfected with KIF22 siRNA (C), 31 GFP, 35 KIF22-GFP, 38 KIF22-GFP T158D, and 37 KIF22-GFP T158A doxycycline-treated cells transfected with KIF22 siRNA (D), from three experiments. Bars represent means. P values from Brown-Forsythe and Welch ANOVA with Dunnett’s T3 multiple comparisons test. P values are greater than 0.05 for comparisons without a marked p value. (E) Plotting background-subtracted GFP intensity against the distance between separating chromosome masses at 7 min indicates that this distance is dependent on expression level (Spearman correlation coefficient –0.3647, one-tailed p-value=0.0088). Gray dashed line indicates mean background subtracted GFP intensity of 100. Thirteen KIF22-GFP, 16 KIF22-GFP T158D, and 13 KIF22-GFP T158A cells from five experiments. (F) Distance between separating chromosome masses of cells expressing lower levels of KIF22-GFP (mean background subtracted GFP intensity less than 100). Lines represent the mean and the shaded area denotes SEM. Ten KIF22-GFP cells from five experiments, 11 KIF22-GFP T158D cells from five experiments, and 11 KIF22-GFP T158A cells from five experiments. (G) Distance between separating chromosome masses 7 min after anaphase onset of cells expressing lower levels of KIF22-GFP (mean background subtracted GFP intensity less than 100). Bars indicate medians. P values from Kruskal-Wallis test. P values are greater than 0.05 for comparisons without a marked p value. Ten KIF22-GFP cells from five experiments, 11 KIF22-GFP T158D cells from five experiments, and 11 KIF22-GFP T158A cells from five experiments. See Figure 9—figure supplement 2—source data 1.
-
Figure 9—figure supplement 2—source data 1
T158 KIF22 expression level.
KIF22 expression levels in HeLa-Kyoto cells expressing KIF22-GFP with mutations at T158.
- https://cdn.elifesciences.org/articles/78653/elife-78653-fig9-figsupp2-data1-v2.zip
Figure 9—figure supplement 3
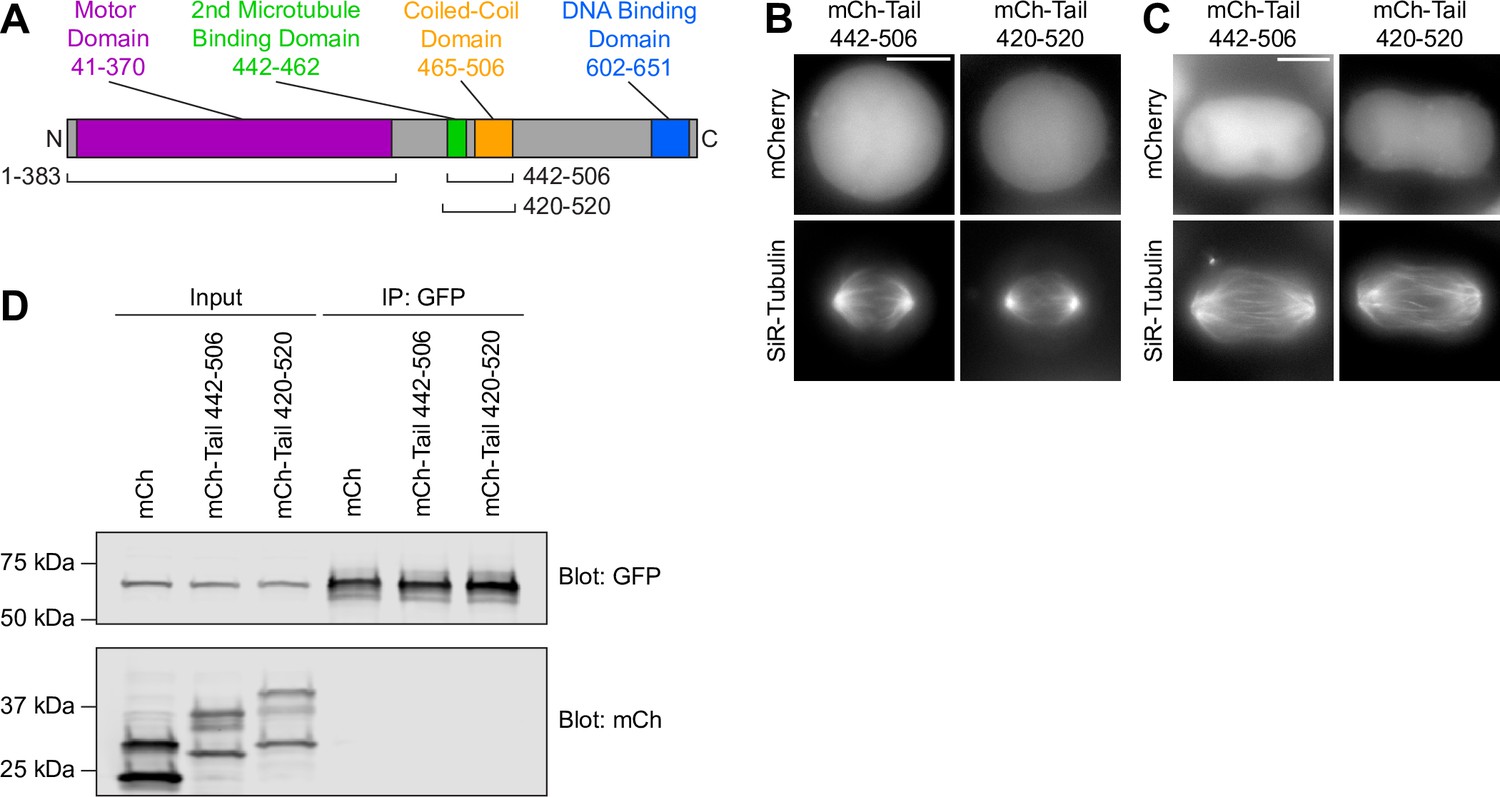
KIF22 motor domain and tail fragments do not co-immunoprecipitate.
(A) Schematic of the domains of KIF22 with the boundaries of the motor domain (1–383) and tail (442–506 or 420–520) fragments indicated. (B–C) Images of live cells in metaphase (B) or anaphase (C) expressing mCh-Tail fragments stained with SiR-Tubulin for visualization of spindle microtubules. Maximum intensity projections in z. Scale bar 10 μm. (D) Western blot of input and anti-GFP immunoprecipitation samples blotted for GFP (top) and mCherry (mCh, bottom). Molecular weights: Motor Domain-GFP 70 kDa, mCh-Tail 442–506 35 kDa, mCh-Tail 420–520 39 kDa, mCherry 28 kDa. Bands of lower molecular weight visible in the mCh blot may represent a breakdown fragment of mCh as has been previously observed in cells overexpressing mCh (Pena et al., 2020). See Figure 9—figure supplement 3—source data 1.
-
Figure 9—figure supplement 3—source data 1
Western blot.
Anti-GFP and anti-mCherry western blot from anti-GFP immunoprecipitation.
- https://cdn.elifesciences.org/articles/78653/elife-78653-fig9-figsupp3-data1-v2.zip
Figure 10

Pathogenic mutations disrupt the anaphase, but not prometaphase, function of KIF22.
(A) Wild-type KIF22 generates polar ejection forces to contribute to chromosome congression and alignment in prometaphase. In anaphase, KIF22 inactivation results in the attenuation of polar ejection forces (green arrows), allowing chromosomes to segregate toward the poles. Daughter cells form regularly shaped nuclei and continue to proliferate. (B) In cells expressing KIF22 with pathogenic (P148L, P148S, R149L, R149Q, and V475G) or phosphomimetic (T158D and T463D) mutations, prometaphase proceeds as in cells expressing wild-type motor. Mutant KIF22 is capable of polar ejection force generation. In anaphase, KIF22 fails to inactivate, resulting in continued generation of polar ejection forces, which disrupts anaphase chromosome segregation. Daughter cells exhibit nuclear morphology defects. In about 30% of cells expressing KIF22-GFP R149Q or KIF22-GFP V475G, cytokinesis fails, and proliferation rates are reduced.
Videos
Video 1
Fluorescence recovery after photobleaching (FRAP) of KIF22-GFP.
Fluorescence recovery after photobleaching in HeLa-Kyoto cells expressing KIF22-GFP (top), KIF22-GFP R149Q (middle), or KIF22-GFP V475G (bottom). Cells represent interphase (left), metaphase (middle), or anaphase (right). Bleaching occurred at time zero. Scale bar 10 μm. Cells were imaged at 5 second intervals for 25 seconds before bleaching, photobleached, and imaged at 20 second intervals for 10 minutes after bleaching. Playback at 10 frames per second.
Video 2
Anaphase in HeLa-Kyoto cells.
Anaphase chromosome segregation in HeLa-Kyoto cells expressing KIF22-GFP (left), KIF22-GFP R149Q (middle), or KIF22-GFP V475G (right). Magenta: SiR-Tubulin, green: KIF22-GFP. Times indicate minutes after anaphase onset. Scale bar 5 μm. Cells were imaged at 1 minute intervals. Playback at 10 frames per second (600 X real time).
Video 3
Anaphase in RPE-1 cells.
Anaphase chromosome segregation in RPE-1 cells expressing KIF22-GFP (left), KIF22-GFP R149Q (middle), or KIF22-GFP V475G (right). Magenta: SiR-Tubulin, green: KIF22-GFP. Times indicate minutes after anaphase onset. Scale bar 5 μm. Cells were imaged at 1 minute intervals. Playback at 10 frames per second (600 X real time).
Video 4
Cytokinesis and cytokinesis failure.
Mitosis and cytokinesis in HeLa-Kyoto cells expressing KIF22-GFP (left), KIF22-GFP R149Q (middle), or KIF22-GFP V475G (right) (all KIF22-GFP represented in green) and mCh-CAAX (magenta). Scale bar 10 μm. Cells were imaged at 3 minute intervals. Playback at 25 frames per second (4500 X real time).
Video 5
Anaphase spindle pole separation.
Anaphase in HeLa-Kyoto cells expressing pericentrin-RFP (magenta), CENPB-mCh (magenta), and KIF22-GFP (cyan). Times indicate seconds after anaphase onset. Scale bar 5 μm. Cells were imaged at 20 second intervals. Playback at 15 frames per second (300 X real time).
Tables
Table 1
Predictions of the significance of the c.1424C>G, p.(V465G) KIF22 variant.
| Algorithm | Prediction |
|---|---|
| Sorting Intolerant from Tolerant (SIFT) Vaser et al., 2016 | Deleterious: score 0.01 with scores ranging from 0 to 1 and scores below 0.05 considered deleterious |
| Polymorphism Phenotyping (PolyPhen-2) Adzhubei et al., 2010 | Benign: score 0.437 |
| MutationTaster Schwarz et al., 2010 | Deleterious |
| Combined Annotation Dependent Depletion (CADD) Rentzsch et al., 2019 | Deleterious: scaled C-score 15.3800, with a score of greater than or equal to 10 indicating a deleterious substitution |
| Deleterious Annotation of Genetic Variants Using Neural Networks (DANN) Quang et al., 2015 | Deleterious: score 0.99 with scores ranging from 0 to 1 and higher values indicating a variant is more likely to be deleterious |
| Rare Exome Variant Ensemble Learner (REVEL) Ioannidis et al., 2016 | Benign: score 0.28 with scores ranging from 0 to 1 and scores >0.803 classified as pathogenic |
Table 2
Plasmids used in this study.
| Plasmid | Description | Primers (5' to 3', Fw: Forward, Rev: Reverse) | Source |
|---|---|---|---|
| pEM784 | nlCre recombinase | NA | Khandelia 2011 PMID 21768390 |
| pEM791 | EGFP for recombination | NA | Khandelia 2011 PMID 21768390 |
| pJS2161 | GFP-KIF22 | NA | Stumpff 2012 PMID 22595673 |
| pAT4206 | KIF22-GFP | Fw: TACGTGGAATTCCACCATGGCCGCGGGCGGCTCGA Rev: GTGACTGGTACCTGGAGGCGCCACAGCGCTGGC | This study |
| pAT4226 | KIF22-GFP, siRNA resistant | Fw:pGGGCATGGACAGCTGCTCACTCGAAATCGCTAACTGGAGGAACCAC Rev:pGTGGTTCCTCCAGTTAGCGATTTCGAGTGAGCAGCTGTCCATGCCC | This study |
| pAT4250 | KIF22-GFP, siRNA resistant, for recombination | Fragment Fw: CTGGGCACCACCATGGCCGCG Fragment Rev: GCTAGCTCGATTACTTGTACAGCTCGTCCATGCC Vector Fw: GTACAAGTAATCGAGCTAGCATATGGATCCATATAACT Vector Rev: CATGGTGGTGCCCAGTGCCTCACGACC | This study |
| pAT4251 | KIF22-GFP R149Q | Fw: GGGGTGATCCCGCAGGCTCTCATGGAC Rev: GTCCATGAGAGCCTGCGGGATCACCCC | This study |
| pAT4258 | KIF22-GFP V475G | Fw: TGCTAATGAAGACAGGAGAAGAGAAGGACCT Rev: AGGTCCTTCTCTTCTCCTGTCTTCATTAGCA | This study |
| pAT4260 | KIF22-GFP T463D | Fw: CCCCTCTGTTGAGTGACCCAAAGCGAGAGC Rev: GCTCTCGCTTTGGGTCACTCAACAGAGGGG | This study |
| pAT4261 | KIF22-GFP T463A | Fw: CCTCTGTTGAGTGCCCCAAAGCGAG Rev: CTCGCTTTGGGGCACTCAACAGAGG | This study |
| pAT4264 | KIF22-GFP R149L | Fw: GGGTGATCCCGCTGGCTCTCATGGAC Rev: GTCCATGAGAGCCAGCGGGATCACCC | This study |
| pAT4269 | KIF22-GFP P148L | Fw: CCTGGGGTGATCCTGCGGGCTCTCATG Rev: CATGAGAGCCCGCAGGATCACCCCAGG | This study |
| pAT4270 | KIF22-GFP P148S | Fw: CTGGGGTGATCTCGCGGGCTCTCATG Rev: CATGAGAGCCCGCGAGATCACCCCAG | This study |
| pSS4279 | KIF22-GFP T134A | Fragment Fw: AGCTGCTCACTCGAAATCGC Fragment Rev: AGTCTTTCTCGGATTACCAGG Vector Fw: CCTGGTAATCCGAGAAGACT Vector Rev: GCGATTTCGAGTGAGCAGCT | This study |
| pSS4281 | KIF22-GFP T134D | Fw: CAGGAGCTGGGAAGGATCACACAATGCTGGGC Rev: GCCCAGCATTGTGTGATCCTTCCCAGCTCCTG | This study |
| pNA4285 | KIF22-GFP T158A | Fw: AGCTCGCAAGGGAGGAGGGTG Rev: GAGTACCTGGAGGACGTCGA | This study |
| pNA4284 | KIF22-GFP T158D | Fw: CCTCCTGCAGCTCAGGGAGGAGGGTG Rev: CACCCTCCTCCCTGAGCTGCAGGAGG | This study |
| pAT4291 | mCh-Tail 442–506 | Fragment Fw: ccggactcagatctcgaggacgcctcctcagcttggaccg Fragment Rev: ctgattatgatcagttatctgttctccttttcctcagccttctg Vector Fw: aggctgaggaaaaggagaacagataactgatcataatcagccatac Vector Rev: cggtccaagctgaggaggcgtcctcgagatctgagtccgg | This study |
| pAT4292 | mCh-Tail 420–520 | Fragment Fw: ccggactcagatctcgaggagcctctgcctcccagaaact Fragment Rev: ctgattatgatcagttatctgactgtgcgatgtgaaaggg Vector Fw: ccctttcacatcgcacagtcagataactgatcataatcagccatac Vector Rev: agtttctgggaggcagaggctcctcgagatctgagtccgg | This study |
| pAT4294 | Motor Domain-GFP 1–383 | Fw: aggtaccgcgggcccgggat Rev: ccaatgagagcctgcagcctcatgccttg | This study |
Additional files
Download links
A two-part list of links to download the article, or parts of the article, in various formats.
Downloads (link to download the article as PDF)
Open citations (links to open the citations from this article in various online reference manager services)
Cite this article (links to download the citations from this article in formats compatible with various reference manager tools)
Pathogenic mutations in the chromokinesin KIF22 disrupt anaphase chromosome segregation
eLife 11:e78653.
https://doi.org/10.7554/eLife.78653


