Recalibrating vision-for-action requires years after sight restoration from congenital cataracts
- Applied Cognitive Psychology, Faculty for Computer Science, Engineering, and Psychology, Ulm University, Germany
- Liverpool Hope University, United Kingdom
- Pediatric Ophthalmology Service, Padeh Medical Center, Israel
Figures
Figure 1 with 6 supplements
Recalibration behavior.
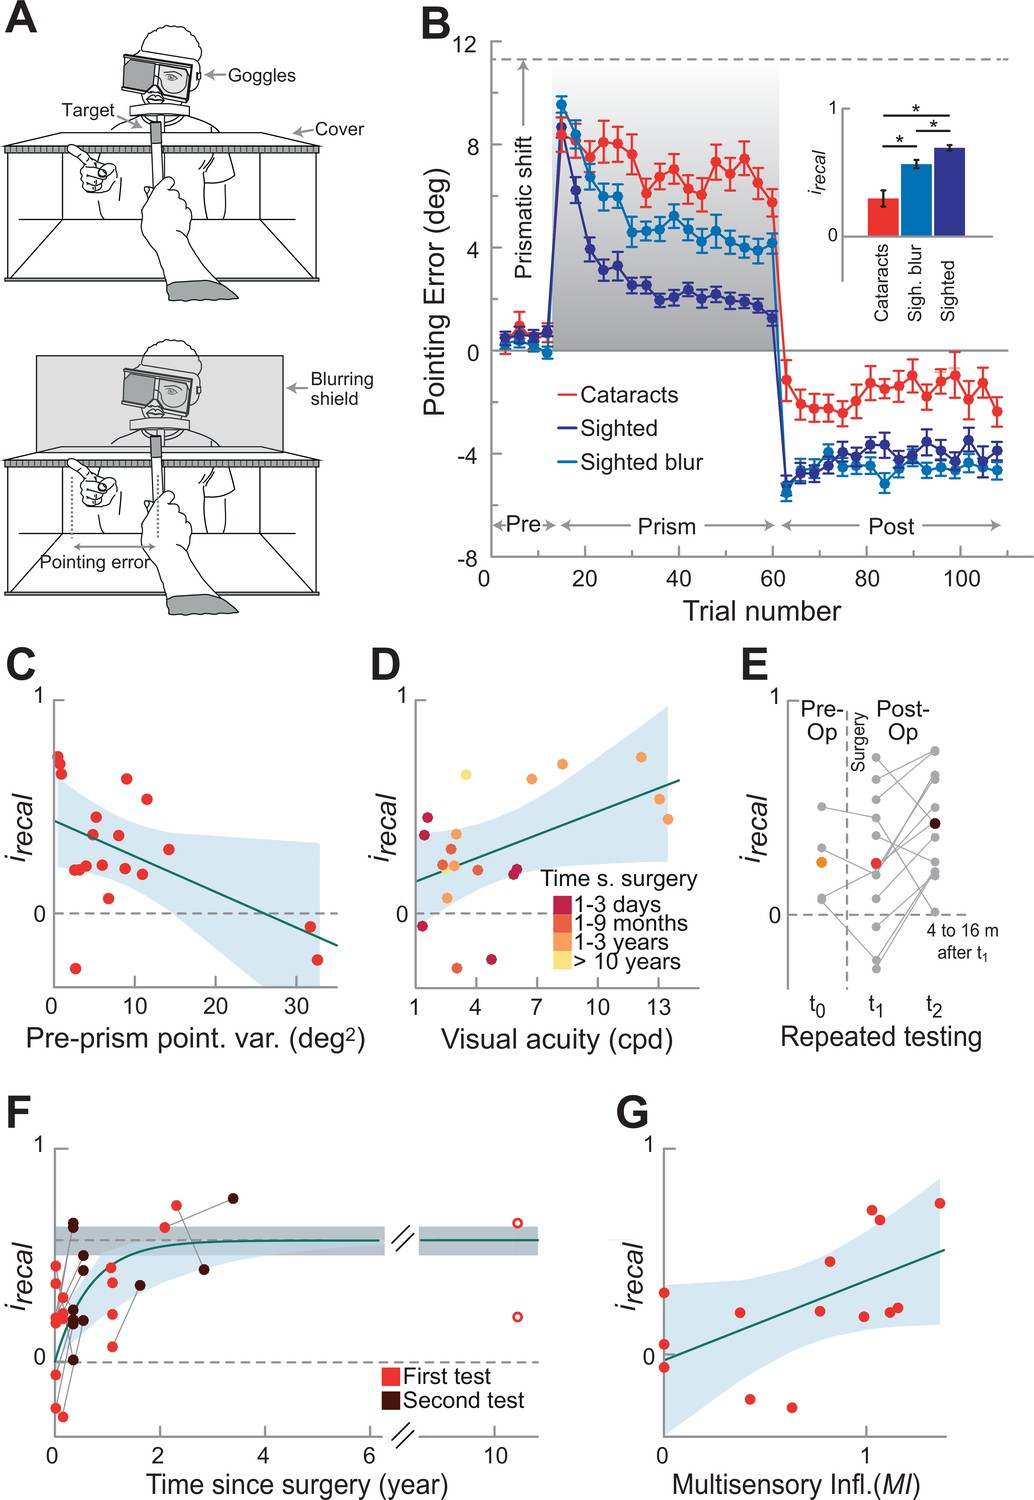
(A) Pointing setup. Upper panel without, lower panel with blurring shield. Participants wore goggles with an eye cover over the non-dominant eye. A prism could be inserted into the goggles during the prism phase inducing a rightward shift. Participants performed pointing movements toward a target. A cover was used to block vision during pointing movement. Only during the prism phase participants could see their terminal pointing error, by seeing the tip of their finger appearing from under the cover. Before (pre-prism) and after (post-prism) the prism phase, participants performed the same task without the prism and in the absence of terminal feedback. To mimic the poor visual acuity of the cataract-treated participants, we blurred vision in a group of sighted control participants by placing a blurring shield in front of the target (lower panel). (B) Recalibration Performance. Mean pointing errors across bins of three trials are calculated for each participant across the three phases of the experiment (prism phase in gray), and group averages are shown for the three groups: cataract-treated (red), and sighted controls tested with (light blue) and without (blue) visual blur (n=20 in each group). The dashed line represents the prismatic shift (11.31°). Error bars show SEM across participants. The inset shows the recalibration index irecal, which summarizes the recalibration performance in the prism phase and in the first three trials of the post-prism phases (0 no recalibration, 1 complete recalibration). The analysis on irecal showed that each group differed from the other (Bonferroni corrected Wilcoxon rank-sum, all p≤0.006, following Kruskal–Wallis test, χ2(2)=27, p<0.0001, η2=0.38). Although the cataract-treated group recalibrated less than the sighted control groups tested with and without visual blur (irecal, mean ± SEM = 0.30 ± 0.06, 0.57 ± 0.03, and 0.69 ± 0.02, respectively), their recalibration performance was significantly greater than 0 (Wilcoxon signed-rank test, z=3.25, p=0.0012). (C) Relation between recalibration performance irecal and pointing precision during pre-prism phase (baseline) in cataract-treated participants (n=19, one outlier above three SD from the mean was excluded). The variance in the pointing errors at baseline negatively correlated with irecal (Pearson’s correlation coefficient, r=−0.53, p=0.019; if we include also the outlier, r=−0.46, p=0.040), showing that participants with noisier performance at baseline recalibrate less. The light-blue shaded area indicated 95% confidence intervals of the regression line. (D) Recalibration performance irecal as a function of visual acuity in cataract-treated participants (n=20). Participants with higher visual acuity recalibrate more (higher irecal, Pearson’s correlation coefficient, r=0.5, p=0.025). The data points are coloured with brighter colors indicating longer time since surgery. This shows that individuals tested soon after surgery tended to recalibrate less (smaller irecal). Note, however, that time since surgery did not significantly correlate with visual acuity at the group level (r=−0.03, p=0.8). (E) Repeated testing in a subset of 13 participants tested over time. Four of them were tested also before surgery (since their visual acuity allowed them to see the target). Although their CSF increased due to surgery, their degree of recalibration did not in the first tests performed a few days after surgery. Instead, with more time after surgery (4–16 months) their recalibration performance significantly improved (Wilcoxon signed-rank test, z=20, p=0.04, one-tailed). Individual data are reported in gray, with connecting lines linking the same participant, while mean performance for each testing time is reported in larger filled colored circles. (F) Recalibration performance as a function of time since surgery. After surgery participants tended to exponentially improve their recalibration performance irecal (time constant, b=1.5, CI=[0.51, 2.49]), reaching the level of the CSF-matched controls (i.e. tested with visual blur) at around 2 years (however, due to the large inter-subject variability, this estimate contains substantial uncertainty). Note that the exponential fit is not driven by the two participants tested more than 10 years after surgery: when excluding them from the exponential fit, the time constant b (b=1.5, CI=[0.39, 2.67]) is comparable to the one obtained in the whole sample. The dashed line and the gray shaded area indicate the mean performance and the 95% confidence intervals of the sighted CSF-matched controls, respectively. The exponential (dark green curve, with the ligth-blue shaded area indicating its 95% confidence intervals) is fitted on all measurements obtained from the participants after surgery, with red circles indicating the first post-surgical test and brown circles indicating the second performance of the subset of 13 participants re-tested in the same task (E), with connecting lines linking the same participant. (G) Correlation between recalibration and multisensory integration. Fourteen participants took part in this and in a previous study on multisensory integration (Senna et al., 2021) at around the same time after surgery. We investigated the relationship between the performance in both tasks by correlating irecal, as a measure of recalibration performance and the Multisensory Influence (MI) as a measure of integration performance between vision and touch: r=0.58, p=0.03.
-
Figure 1—source data 1
Clinical characteristics of the cataract-treated participants.
Participant ID, sex, age at test, pre-operation visual assessment, visual acuity (measured as contrast sensitivity function (CSF) cutoff frequency in cycles per degree (cpd)) before and after surgery, and time since surgery at test (years (y), months (m), days (d)). In the pre-surgical visual assessment, LP indicates only light perception, followed by hand motion perception (HM), and the ability to count fingers up to the specified distance (FC). We report the highest measure participants could perform with both eyes, unless otherwise specified (RE: right eye, LE: left eye). We did not test the visual acuity of four participants before surgery, either because they had too poor visual acuity to be able to perform the CSF test, or because the procedure was not available at the time they were surgically treated. Before surgery, most participants were classified as suffering from legal blindness or severe low vision. Legal blindness is defined as visual acuity below 20/400 (i.e. around 1.5 cpd cutoff frequency) by the World Health Organization (WHO 2010, International Classification of Diseases, 10th revision), or below 20/200 (i.e. 3 cpd cutoff frequency) by the National Institute of Health of the United States (NIH). Importantly, most participants improved after surgery (log-transformed pre- vs. post-surgical CSF, t15=3.7, p=0.002) and transitioned out of the category of legal blindness. We assessed the post-surgical CSF cutoff frequency in the same experimental session as the experimental task. Some participants were tested in the study multiple times, before and/or after surgery. We do not have information regarding the exact date of surgery of two participants, because they were included in our project only after surgery, and not operated by our team. Both of them were surgically treated more than 2 years before taking part in the present experiment.
- https://cdn.elifesciences.org/articles/78734/elife-78734-fig1-data1-v2.docx
Figure 1—figure supplement 1
Contrast sensitivity functions in cataract-treated participants and in sighted controls tested with visual blur.
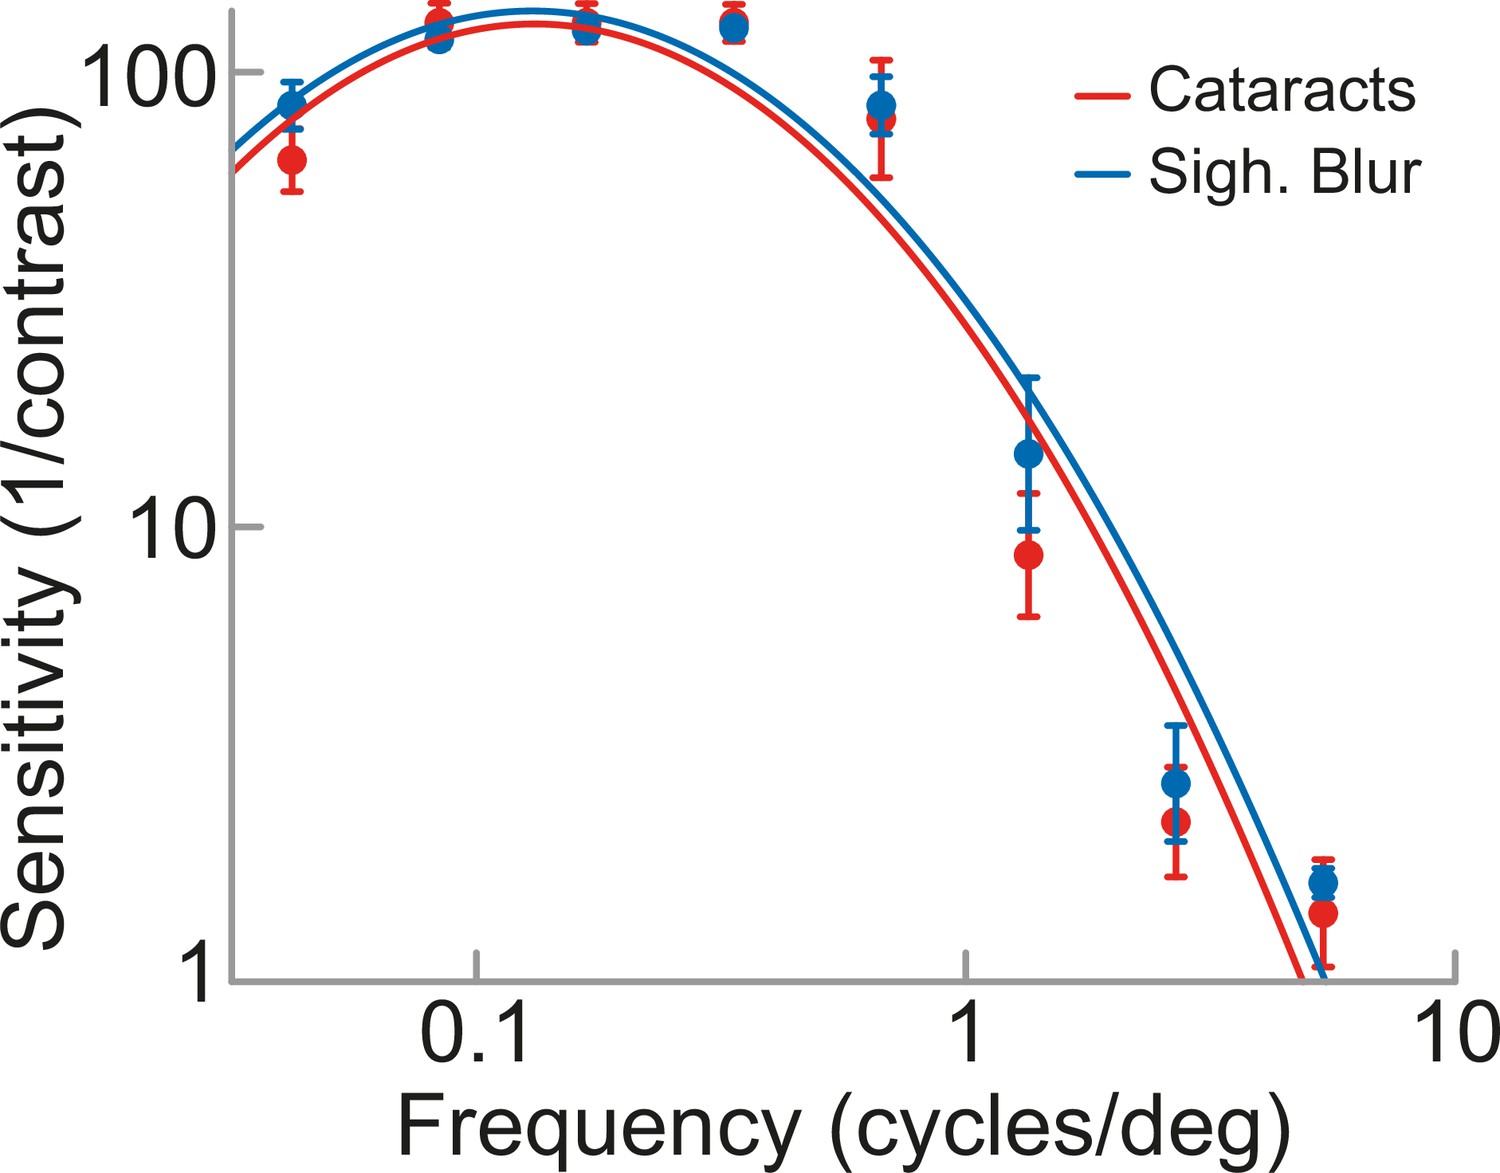
We measured the spatial visual acuity of cataract-treated participants and CSF-matched sighted controls by asking them to judge the orientation (vertical/horizontal) of sinusoidal grating patches, differing in contrast levels and spatial frequencies (McKyton et al., 2015; Senna et al., 2021). In each participant and for each frequency, we plotted the logarithm of the sensitivity (1/contrast threshold) as a function of the log-transformed spatial frequency, obtaining the contrast sensitivity function (CSF), which was fitted with an inverse parabola to get the CSF cutoff frequency (McKyton et al., 2018; Senna et al., 2021; Watson and Ahumada, 2005). We blurred vision in sighted controls by placing a blurring filter between the participant and the visual target, so that each sighted control was matched to one cataract-treated participant for visual acuity. We included in the study only sighted controls whose CSF matched the desired one (i.e. that of an age-matched cataract-treated participant) in terms of both cutoff frequency and shape. The figure shows mean performance sensitivity as a function of the spatial frequency of the grating in the group of cataract-treated participants (red) and in that of the sighted controls tested with visual blur (light blue). Error bars represent SEM.
Figure 1—figure supplement 2
Accuracy and precision in the pre-prism phase.
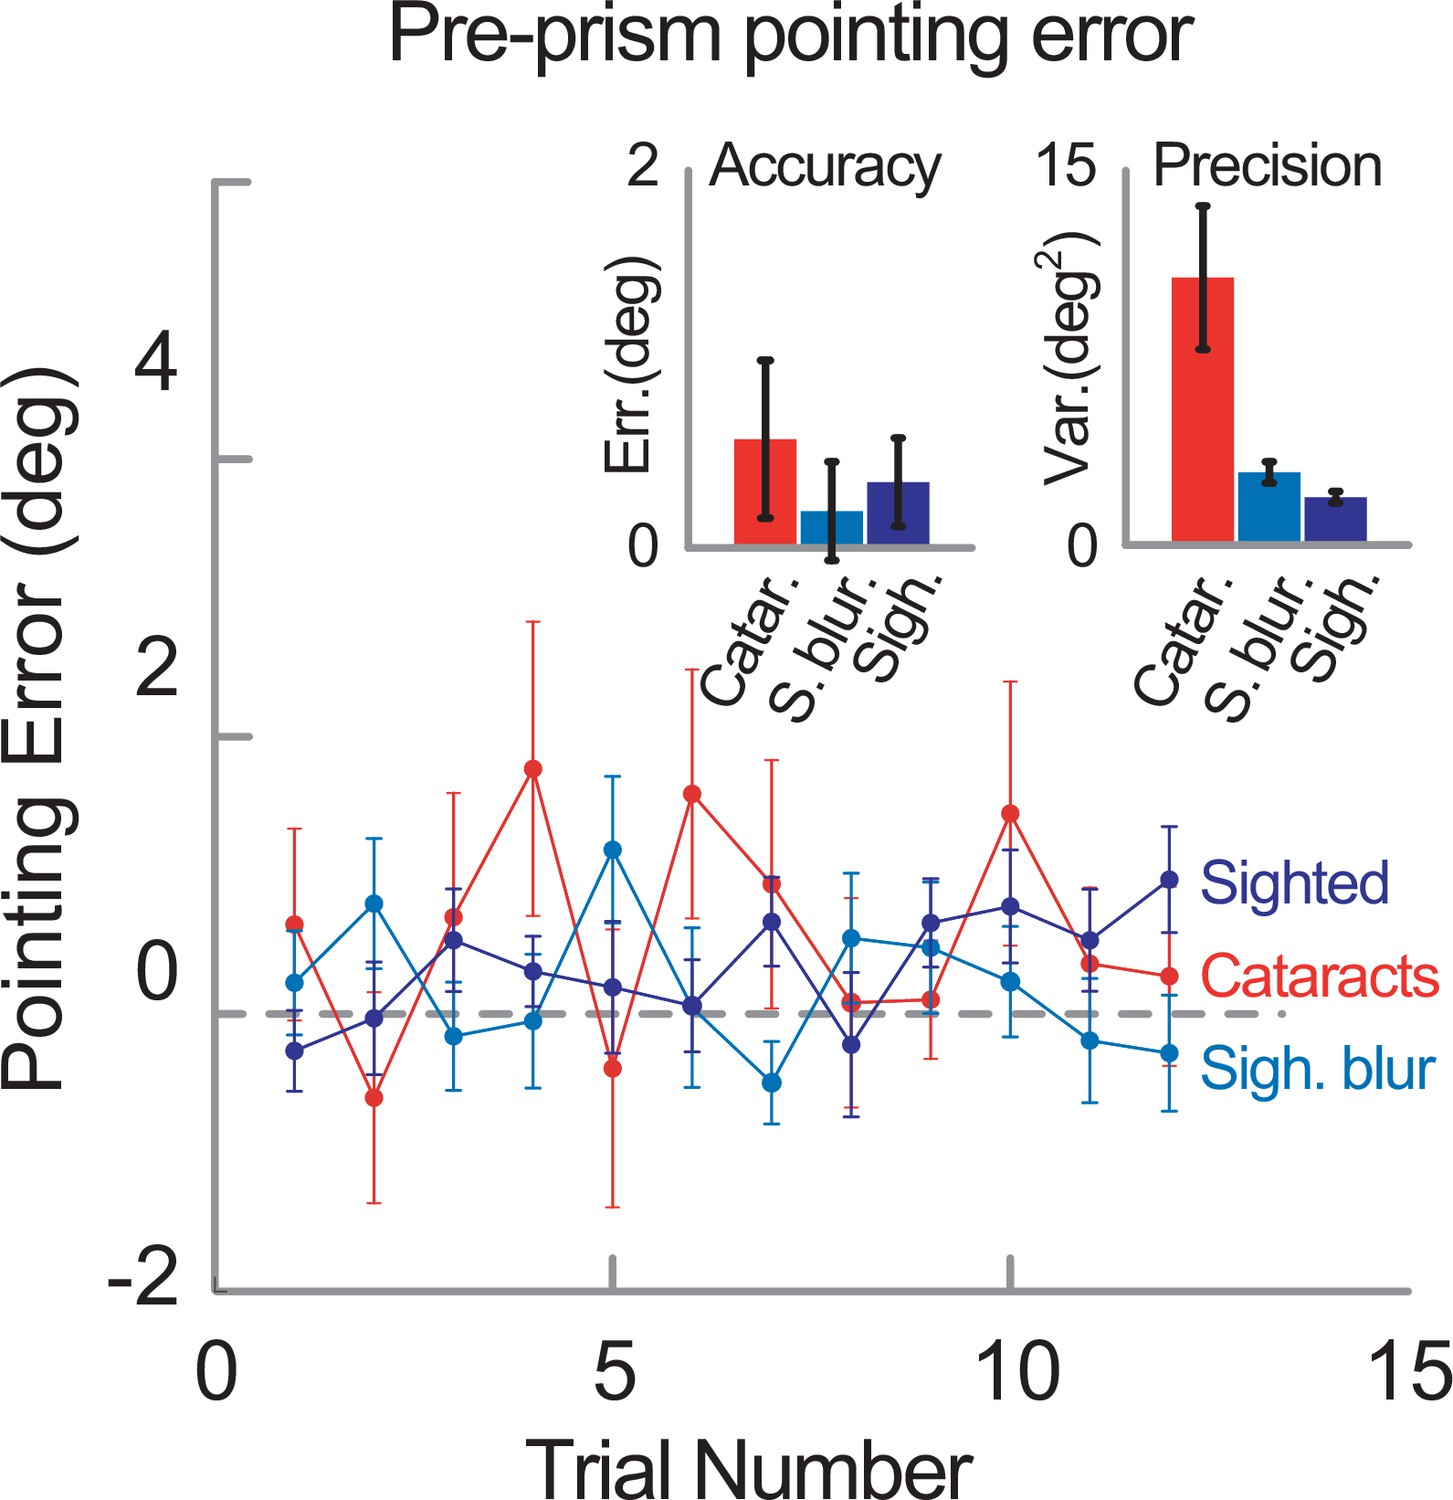
Pointing error in the three groups during the pre-prism phase (i.e. before introducing the prism lens; red: cataract-treated individuals, light-blue: sighted controls tested with visual blur, blue: sighted controls tested without visual blur, n=20 in each group). The inset shows accuracy (left) and precision (right) in the three groups. The mean pointing error shown by cataract-treated participants in the pre-prism phase (mean ± SEM, 0.58 ± 0.42) did not significantly differ from that of the two controls groups (sighted controls: 0.35 ± 0.23; sighted controls tested with visual blur: 0.19 ± 0.26, Kruskal–Wallis test, χ2(2)=1, p=0.61, η2=0.017). The precision of participants’ pointing during the baseline was calculated as the variance of the pointing errors. Bonferroni-corrected pairwise two-sample F-tests on the variance of the pointing errors showed that cataract-treated participants were overall less precise (i.e. their errors presented a higher variance: 10.71 ± 2.87 deg2) than controls tested in normal vision conditions (1.98 ± 0.18 deg2; F(19,19)=95.98, p<0.0001) or with visual blur (3.01 ± 0.43 deg2; F(19,19)=45.00, p<0.0001). Although controls with visual blur were significantly more precise than cataract-treated participants, they showed higher variance than the controls tested without blur (F(19,19)=5.38, p=0.002). Thus, cataract-treated participants were able to perform the pointing task before wearing the prismatic goggles, but they were overall less precise than both control groups.
Figure 1—figure supplement 3

Pointing responses as a function of target location in the cataract-treated participants.
To assess whether cataract-treated participants were able to correctly perform the pointing task during the pre-prism phase for all target locations, for each participant we plotted each response against each target location (–25°, 0°, 25°) and we fitted a linear regression to the data. The overall linear regression was (where the parameters are the mean slope and mean intercept in the group of cataract-treated participants). The fact that the mean regression slope was 1 (range 0.92–1.30) indicates that cataract-treated individuals could correctly perform the task for the different target positions. Red dots indicate the locations of all pointing responses as a function of targets’ locations, which have been slightly jittered for graphical clarity. The thick black line and the light-gray shaded area represent the linear regression and its associated 95% confidence intervals, respectively.
Figure 1—figure supplement 4
Development of the aftereffect throughout the post-prism phase.
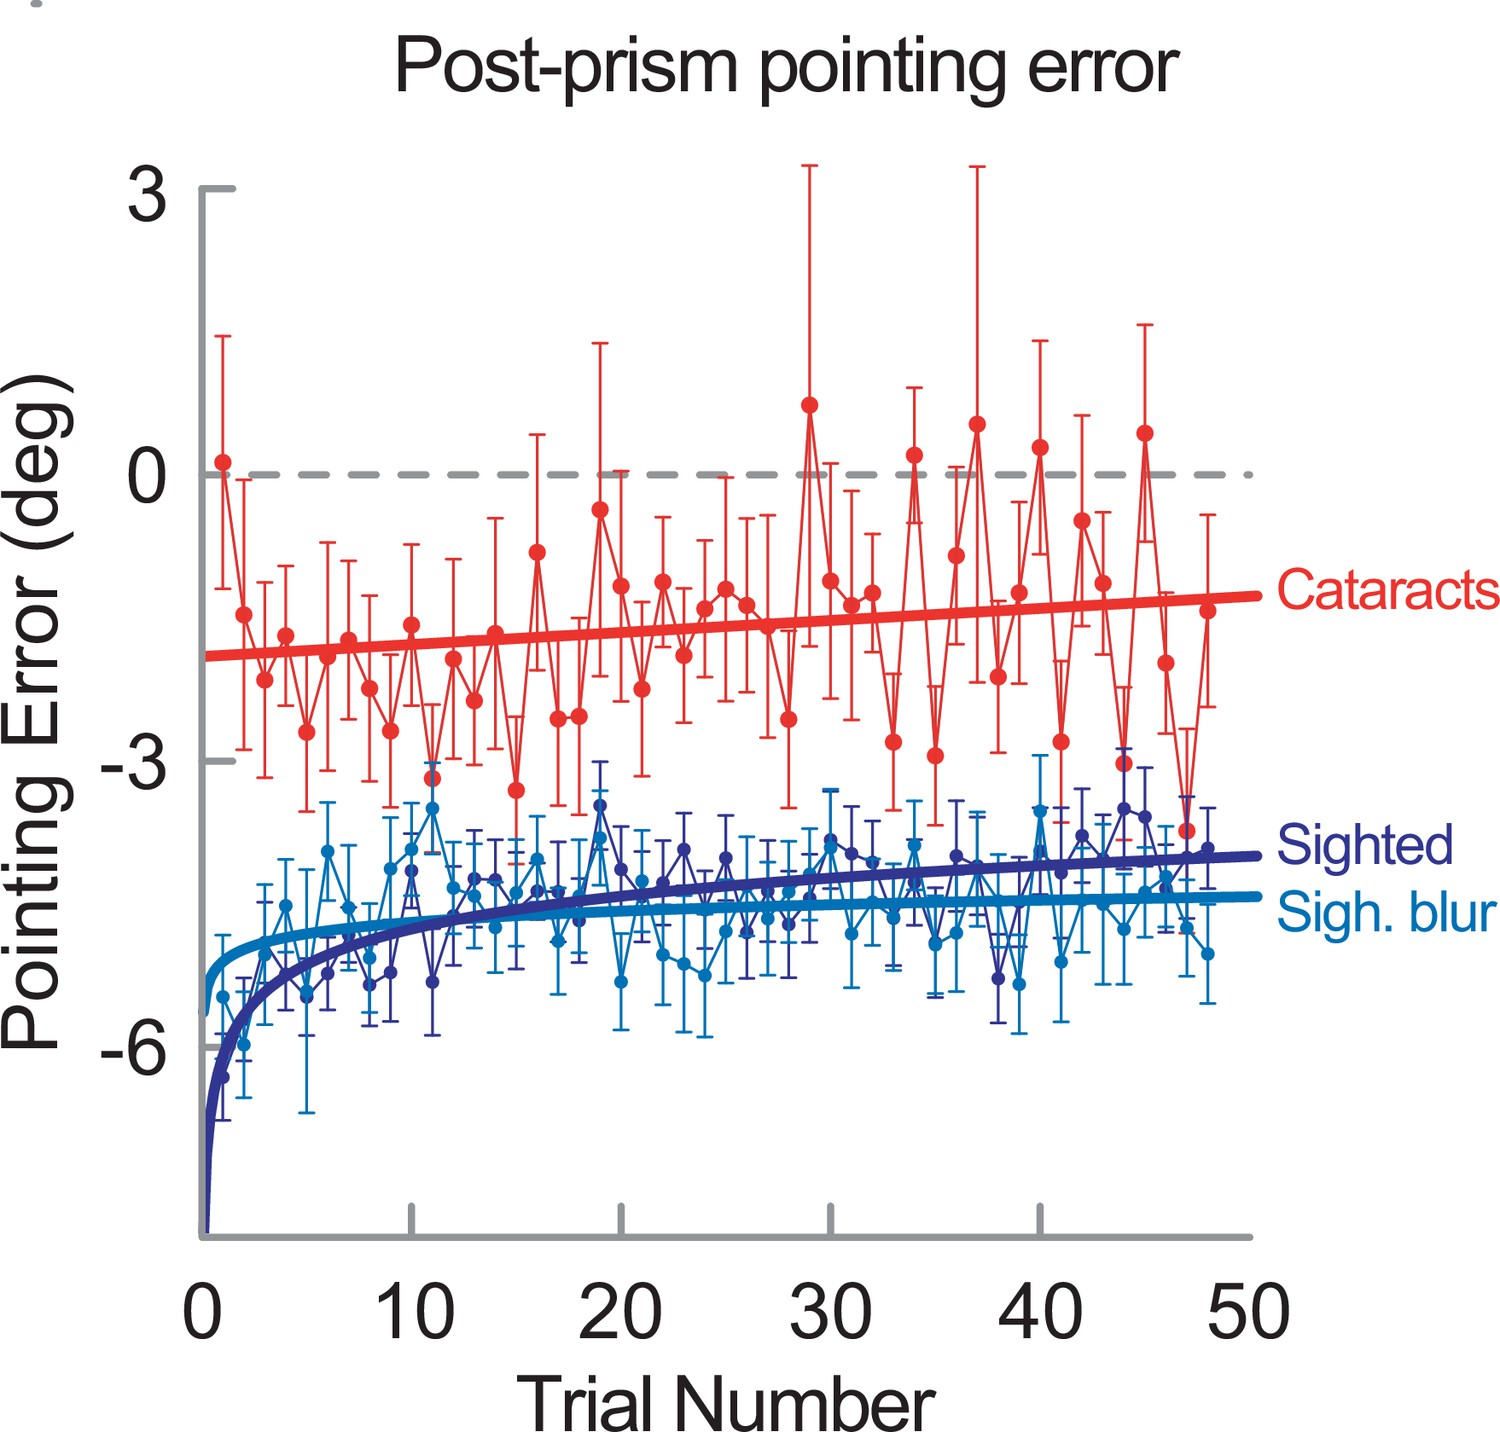
In each group (n=20 per group), we fitted the mean error profile of the group across all trials of the post-prism phase with both a power function () and a linear fit (). Power functions provided a better fit for both control groups. Sighted participants tested either in normal visual conditions or with visual blur reduced their aftereffect during the post-prism phase (recalibration rate b=−0.11, CI=[-0.13,–0.08] and b=−0.04, CI=[–.07, –.001], respectively). Instead, the error profile of the cataract-treated group, which was noisier, was more robustly captured by a linear fit, which showed that the pointing error was constant during the post-prism phase (i.e. cataract-treated participants did not significantly reduce their aftereffect, as shown by the fact that the CI=[–0.01, 0.04] for b=0.013 included 0). Individual dots and thick lines represent group mean pointing errors and curve fits, respectively, for each group: cataract-treated (red), sighted tested with (light blue) and without (blue) visual blur. The decay of the aftereffect observed in typically sighted participants is in line with previous evidence showing that the aftereffect tends to decline even in the absence of visual feedback and motor activity (Hamilton and Bossom, 1964). Sighted controls tend to spontaneously return to the normal sensorimotor mapping after prism recalibration has taken place. Cataract-treated participants do not show the same tendency to quickly reinstate the original mapping. Instead, they show a behavior that in the sighted population is typical of much younger children than them. Indeed, the extinction rate of the aftereffect increases with age in the typically developing population, with older children showing faster decay (Gómez-Moya et al., 2016). The youngest sighted control participants we tested (11 6–7 year-old, see Figure 1—figure supplement 6 for demographics and supplemental analyses) already reduced their aftereffect during the post-prism phase (power function fit: recalibration rate b=–.1, CI=[–0.17,–0.03]), unlike the cataract-treated participants. Thus, our cataract-treated group shows a behavior which seems to be less mature than the one of their age-matched sighted peers. Error bars represent SEM.
Figure 1—figure supplement 5

Correlational analyses, separated for adaptation and aftereffect, in the cataract-treated group.
While in the main text we explored the possible correlation between several factors and the recalibration index irecal, which combines both Adaptation and the Initial Aftereffect (i.e. the amount of the systematic error in the first three trials of the post-prism phase), we report here the same correlational analyses separately for Adaptation and Aftereffect. We report here separate analyses for adaptation and aftereffect, because, although they are correlated (r=0.47, p=0.037), they are potentially separate phenomena that rely on different neural networks (e.g. Redding et al., 2005). In each participant (n=20), Adaptation was calculated as the error reduction in the prism phase (induced prism distortion, 11.31°, minus the average of the last three pointing errors of the prism phase, Fortis et al., 2010, as in the main text). The Aftereffect was calculated as the (negative) mean pointing error across all trials of the post-prism phase (instead of being calculated only across the first three trials, as the Initial Aftereffect, main text). Both Adaptation and Aftereffect were normalized on the prism distortion (i.e. Adaptation/11.31°, Aftereffect/11.31°). (A) Correlation of the variance of the pointing error at baseline (i.e. in the pre-prism phase, before introducing the shift) with Adaptation (left) and with Aftereffect (right). The (log-transformed) variance of the error at baseline negatively correlated with both Adaptation (Pearson r=−0.47, p=0.035) and Aftereffect (r=−0.54, p=0.014), meaning that participants with a noisier performance in the pre-prism phase recalibrated less in the following phases. (B) Correlation of the visual acuity with Adaptation (left) and with Aftereffect (right). The CSF cut off frequency correlated with Adaptation (r=0.54, p=0.014) and tended to correlate with Aftereffect (r=0.4, p=0.06), meaning that those with better visual acuity recalibrated more. (C) Correlation of the time since surgery with Adaptation (left) and with Aftereffect (right). Time since surgery correlated with both Adaptation (r=0.55, p=0.02) and Aftereffect (r=0.60, p=0.013), showing that participants who were operated from a longer time showed overall better recalibration performance. Note that we excluded the two participants tested more than 10 years after surgery from this analysis as they would drive the correlation.
Figure 1—figure supplement 6
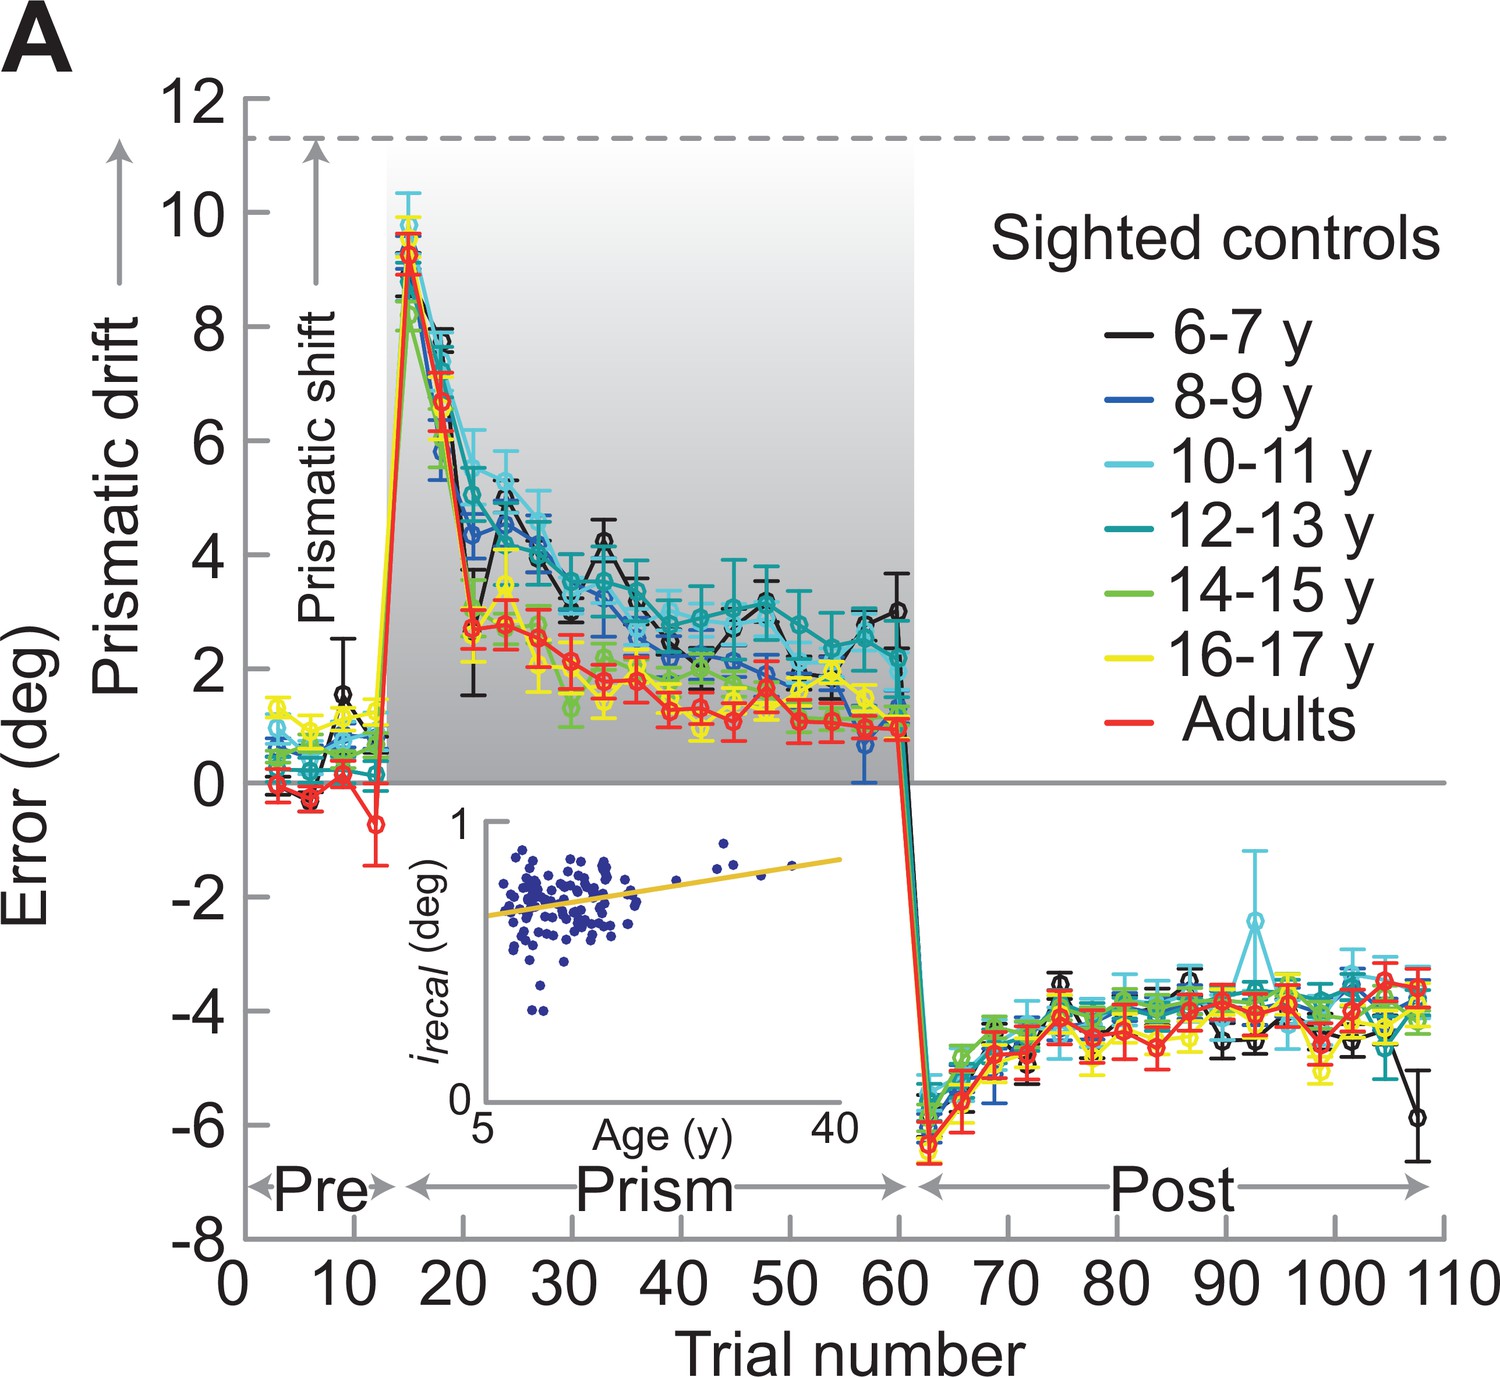
Developmental path of recalibration in typically sighted individuals.
Mean pointing errors across the three phases in different age groups. We explored how the ability to recalibrate visual distortions develops with age in the typically sighted population by testing 124 German sighted individuals (mean age: 13 years and 4 months, range: 6–35 years, 115 right-handed) in the same pointing task described in the main text (Figure 1B). Participants were tested in normal visual conditions (i.e. without visual blur). For graphical reasons, results are binned into 2 years age groups. The inset shows individual irecal values (a measure of recalibration in both the prism and post-prism phases, see main text). Age positively correlated with irecal (Pearson’s correlation coefficient,r=0.30, p=0.0007): the older the participant, the more efficient the recalibration (i.e. faster adaptation rate in the prism phase, and greater aftereffect in the post-prism phase).
Additional files
Download links
A two-part list of links to download the article, or parts of the article, in various formats.
Downloads (link to download the article as PDF)
Open citations (links to open the citations from this article in various online reference manager services)
Cite this article (links to download the citations from this article in formats compatible with various reference manager tools)
Recalibrating vision-for-action requires years after sight restoration from congenital cataracts
eLife 11:e78734.
https://doi.org/10.7554/eLife.78734


