High-throughput imaging and quantitative analysis uncovers the nature of plasmid positioning by ParABS
- Max Planck Institute for Terrestrial Microbiology and LOEWE Centre for Synthetic Microbiology (SYNMIKRO), Germany
Figures
Figure 1 with 2 supplements

F plasmid exhibits true regularly positioning along the long axis of the cell.
(A) Timelapse of a single mother machine growth channel (E. coli strain DLT3125, phase contrast overlayed with ParB-mVenus fluorescence signal). Segmentation and tracking is indicated by coloured outlines. ParB-mVenus foci are highlighted by red dots. Time interval is 1 min. (B) Four example trajectories of tracked ParB-mVenus foci from different cells. Dashed lines indicate cell boundaries. (C) Distribution of foci positions as a function of cell length in cells containing one ParB-mVenus focus. Data from 879 cell cycles. (D) As in (C) but for cells containing two ParB-mVenus foci. Data from 5044 cell cycles. Red lines indicate the position of each peak as obtained by fitting to the sum of two Gaussian functions. (E) Top: Mean velocity of plasmids as a function of position relative to the trajectory mean in cells containing one plasmid. The velocity is measured over two consecutive frames, taken 1 min apart. Light and dark shading indicate standard deviation and standard error respectively. The red line indicates a linear fit. Note that the standard deviation of the velocity does not depend on position. Bottom: Probability density of plasmid position relative to mean of trajectory. Standard deviation 0.182 μm. Dashed lines indicate the region used for fitting which includes at least 68.27% of all data points. (F) As in (E) but for cells containing two ParB-mVenus foci and the position is relative to the indicated lines in (D). Standard deviations are 0.175 μm (old pole proximal) and 0.181 μm (new pole proximal). In (B–F), positions and velocities are measured along the long cell axis. Position values are negative towards the old pole. See also Figure 1—figure supplement 1 and Figure 1—figure supplement 2.
Figure 1—figure supplement 1
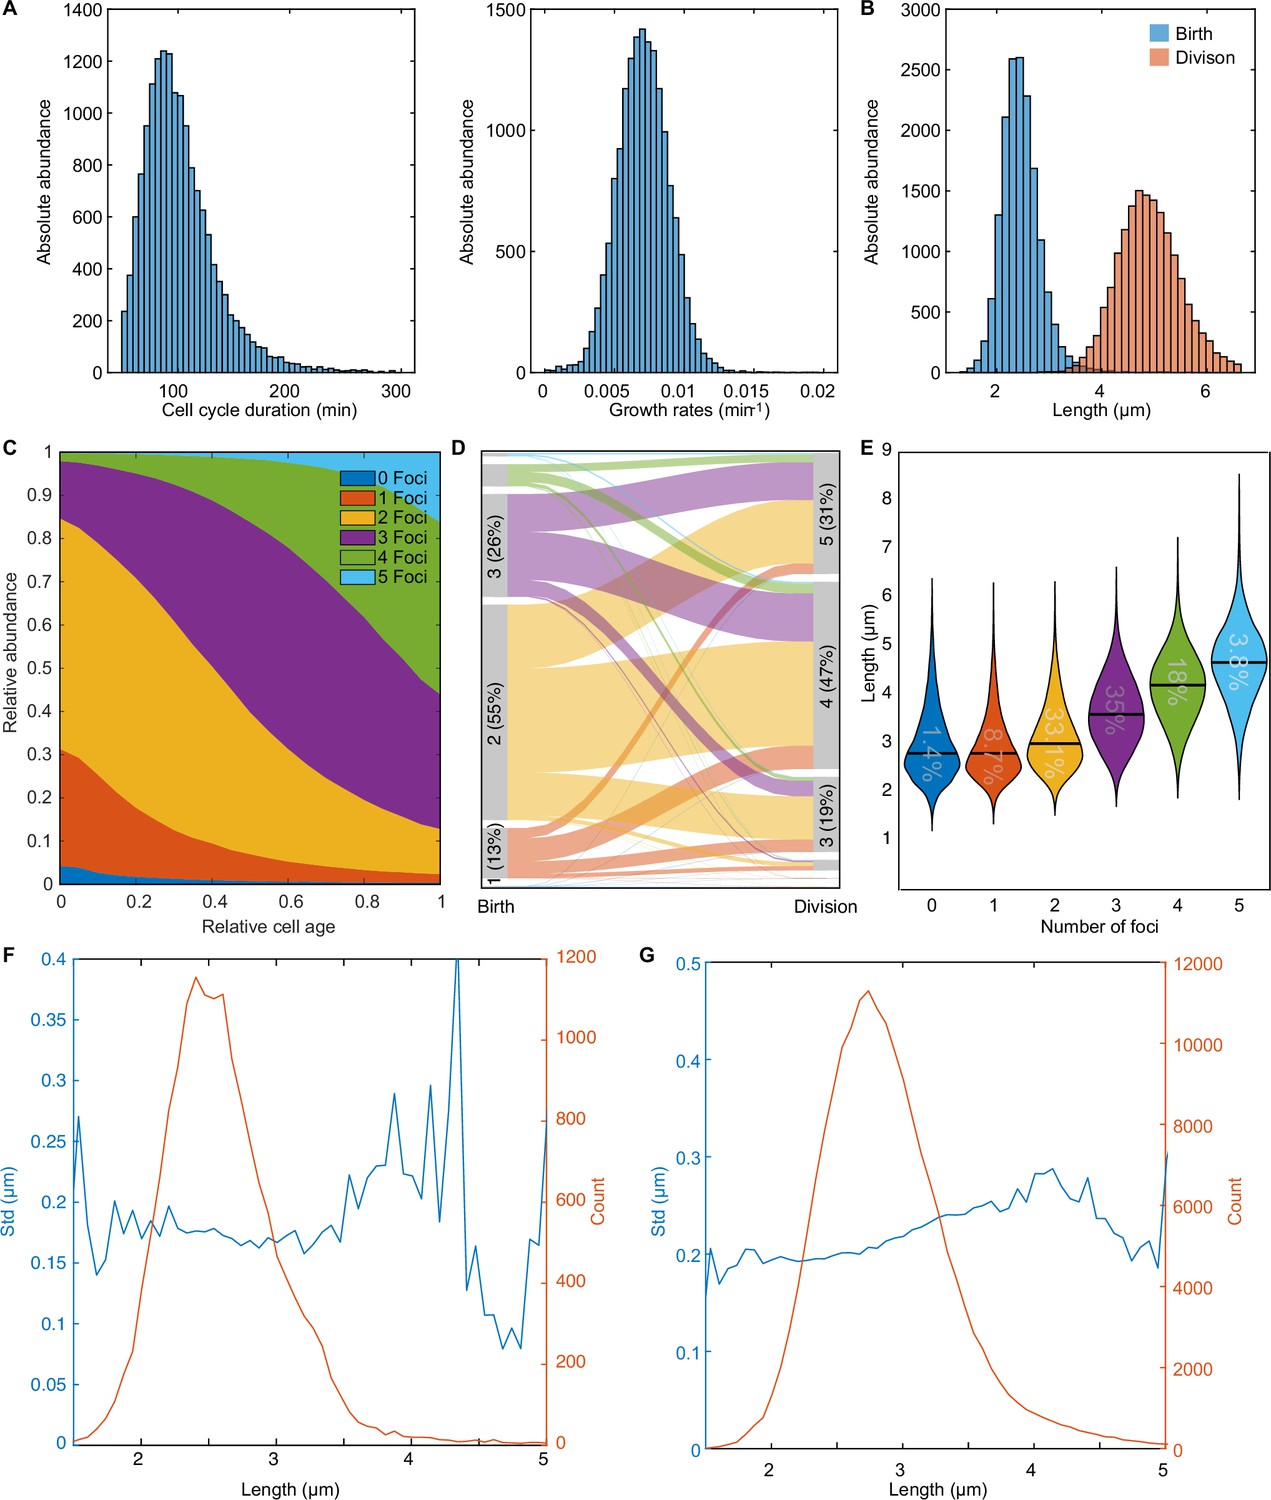
An overview of the F-plasmid.
(A) Distribution of cell cycle duration and growth rate. The mean cell cycle duration is 101.17±34.55 min (mean ± s.d.). (B) Distribution of cell length at birth and at division. The mean length is 2.46±0.38 μm (mean ± s.d.) and 4.92±0.63 μm (mean ± s.d.) respectively. (C) Distribution of ParB-mVenus foci number as a function of relative cell age. Cells have 1.9±0.78 ParB foci (mean ± s.d.) at birth and 3.58±0.96 ParB foci (mean ± s.d.) at division. (D) Alluvial plot showing how the number of foci changes from birth to division. The maximum number of plasmids of the first and last 5 frames were used to determine the number of plasmids at birth and division respectively. (E) Violin plot depicting the middle 99.9 percentile of the cell length distribution for cells with different numbers of plasmids. The number inside the violin plot indicates the relative abundance of each population. The black bar indicates the mean. (F) Standard deviation of position (blue) and plasmid count (orange) plotted against cell length for cells containing 1 foci (data from 879 cell cycles). Plasmid position was centred around the mean of trajectory similar to Figure 1E. (G) Standard deviation of position (blue) and plasmid count (orange) plotted against cell length for cells containing 2 foci (data from 5044 cell cycles). Data in (A-E) is from the entire data set of 16346 cell cycles.
Figure 1—figure supplement 2
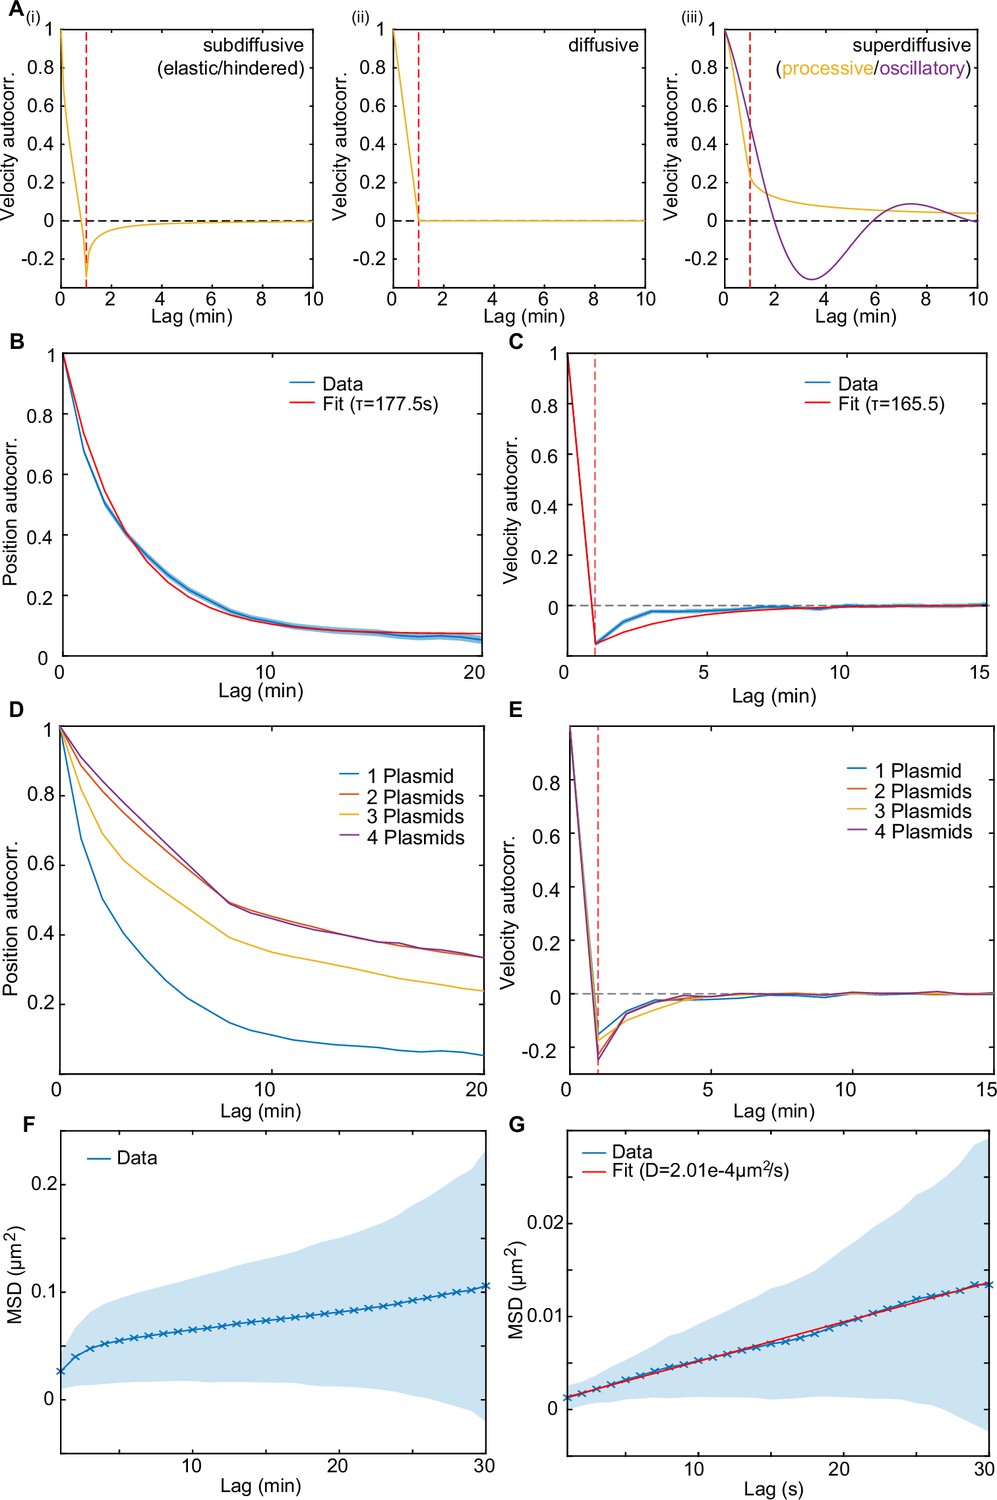
Dynamics of the F-plasmids are indicative of elastic/hindered diffusion.
(A) The shape of the velocity autocorrelation (VAC) functions for (i) subdiffusive/elastic/hindered, (ii) diffusive and (iii) superdiffusive/processive dynamics. Red line indicates a lag equal to the sampling time (the time over which the velocity was measured). In subdiffusive/hindered processes, movement is biased towards the direction the particle came from; in a diffusive process there is no directional bias, while in superdiffusive processes (e.g. directed movement), the particle is biased to keep moving in the same direction. This results in the VAC between frames (i.e. at a lag equal to the sampling time) being negative, zero and positive, respectively (indicated by the red line). The orange curves are generated using the normalised velocity autocorrelation /2 for any process with and taking (i) , (ii) and (iii) . The purple line in (iii) is a sketch of what the VAC might look like for oscillatory dynamics. (B–C) Mean position autocorrelation (PAC) and VAC of trajectories from cells with one plasmid (n=897). Shaded area indicates standard deviation. The autocorrelation time-scale , in B and C, was obtained by fitting the PAC to and the VAC to (red lines), where is the time over which the velocity is calculated (1 frame = 60 s) and c is a constant accounting for any old-pole/new-pole bias. These functions arise from a model of over-damped spring-like motion. See the methods for further details. (D) Mean PAC of trajectories from different populations with 1,2,3, or 4 plasmids (n=879, 5044, 3129, 961). (E) As in (D) but for the VAC. (F) MSD measured every 60 s (n=2558). (G) MSD measured every 1 s (n=75). The diffusion constant D=2.01 ± 0.14e–4 μm2/s (mean ± 95% CI) was obtained by fitting to the MSD-curve (red line).
Figure 2
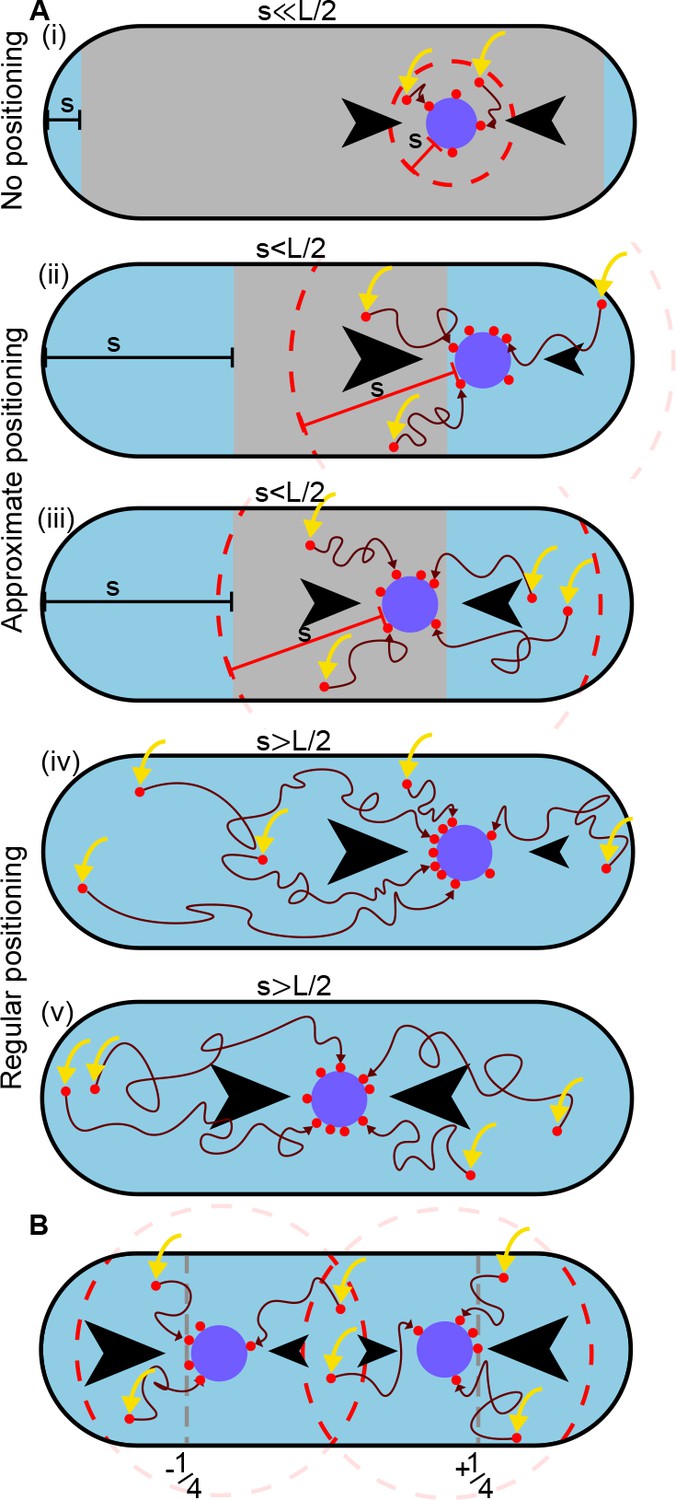
A difference in ParA-ATP flux can provide positional information if the diffusive length-scale is sufficiently long.
The plasmid is biased away from locations at which there is a disparity in the incoming flux of ParA-ATP from either side (black arrows). However, the diffusion of ParA-ATP dimers on the nucleoid introduces a length-scale , defined as the average distance dimers diffuse between association (yellow arrow) and dissociation due to hydrolysis. As a result the plasmid receives only ParA-ATP dimers that associate at most a distance from it (red dashed line). (A) When (i), where is the nucleoid length, a disparity in the fluxes into the plasmid only exists when the plasmid is very close to the poles (blue region). In the interior region (grey), the fluxes balance and the plasmid obtains no positional information. As increases (ii-iii), the region in which the plasmid receives no positional information shrinks leading to approximate mid-nucleoid positioning. When (iv-v), ParA-ATP dimers can explore the entire nucleoid before reaching the plasmid. Hence the fluxes of ParA-ATP into the plasmid are balanced only at the mid-position. True regular positioning is achievable. (B) A similar argument applies to a cell with multiple plasmids but with threshold , where n is the number of plasmids. Here, sensing between plasmids occurs through competition for the same ParA-ATP dimers (the overlap between the two dashed circles). Quarter-positions are highlighted by grey dashed lines.
Figure 3 with 5 supplements
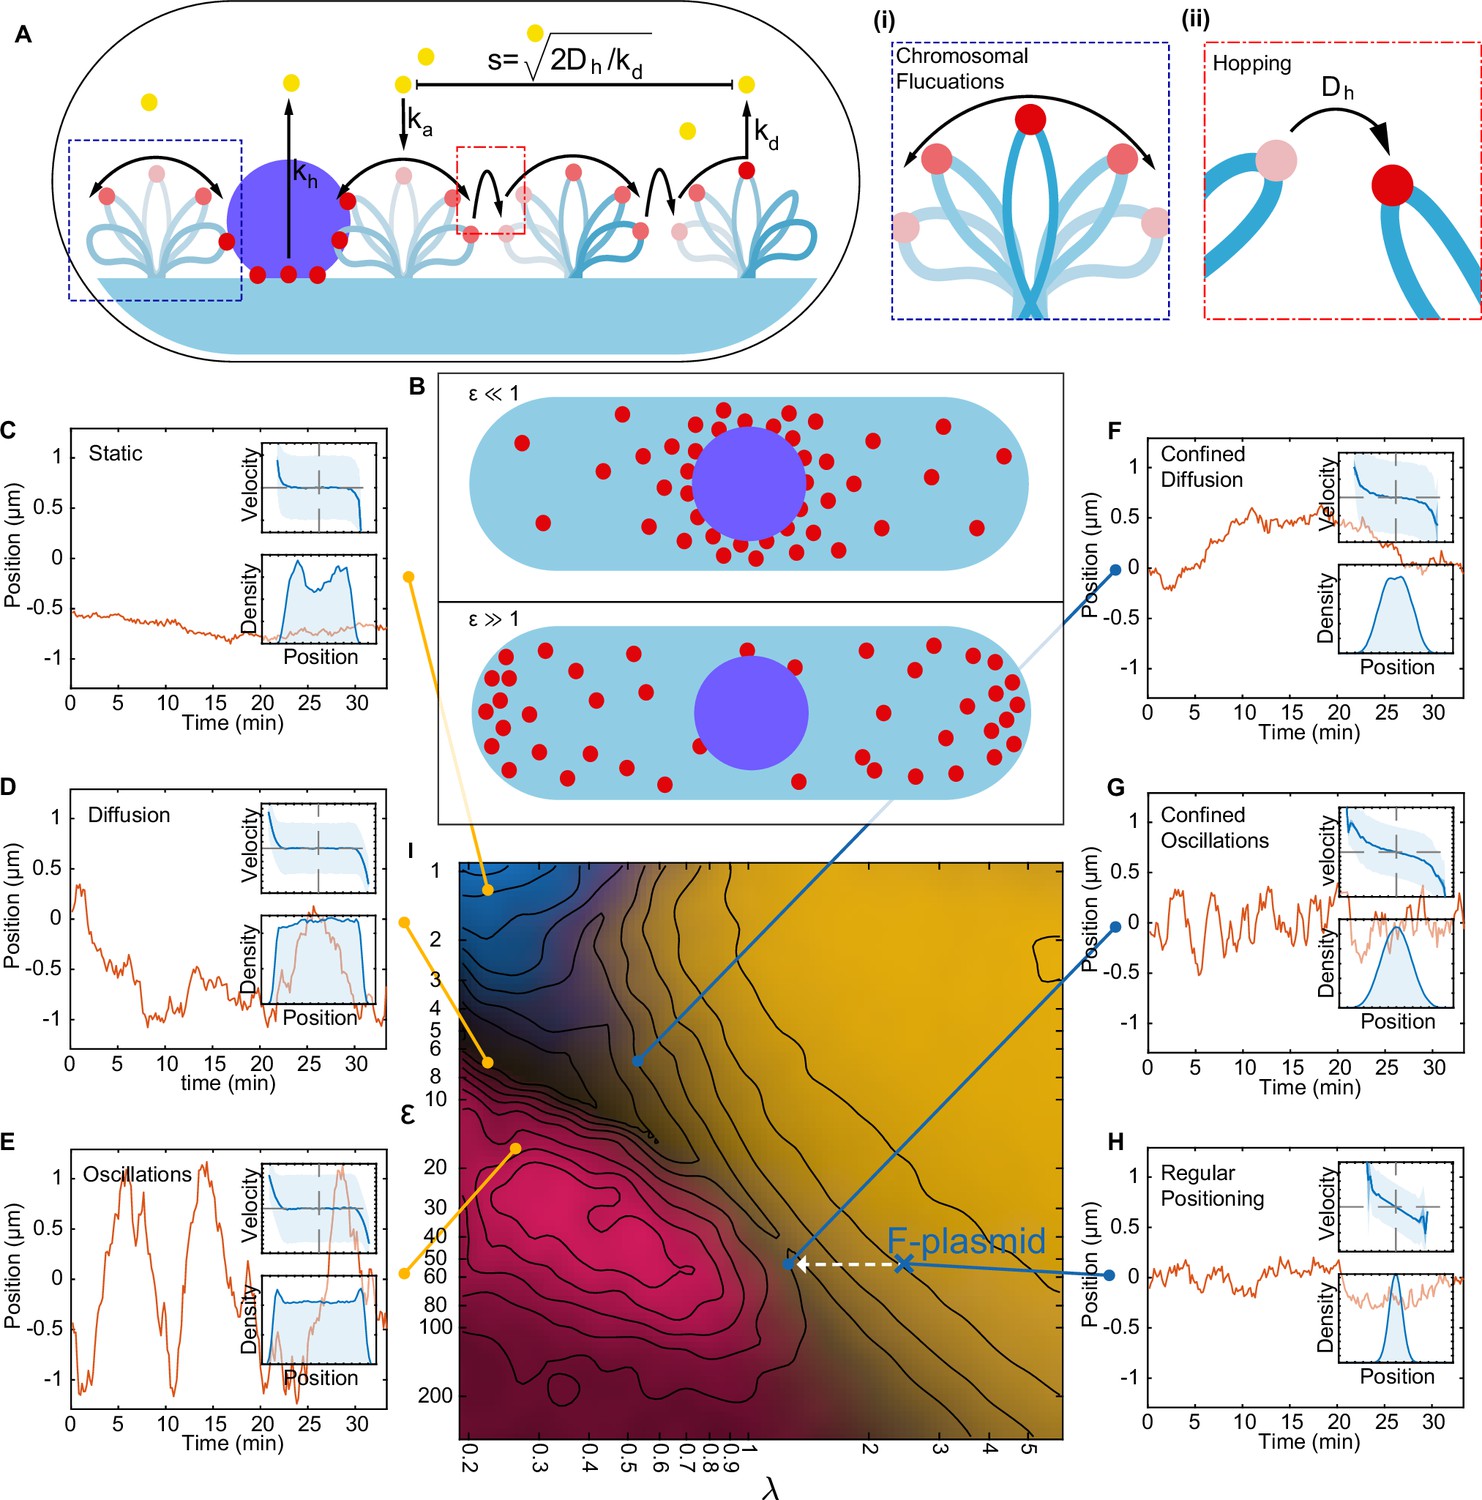
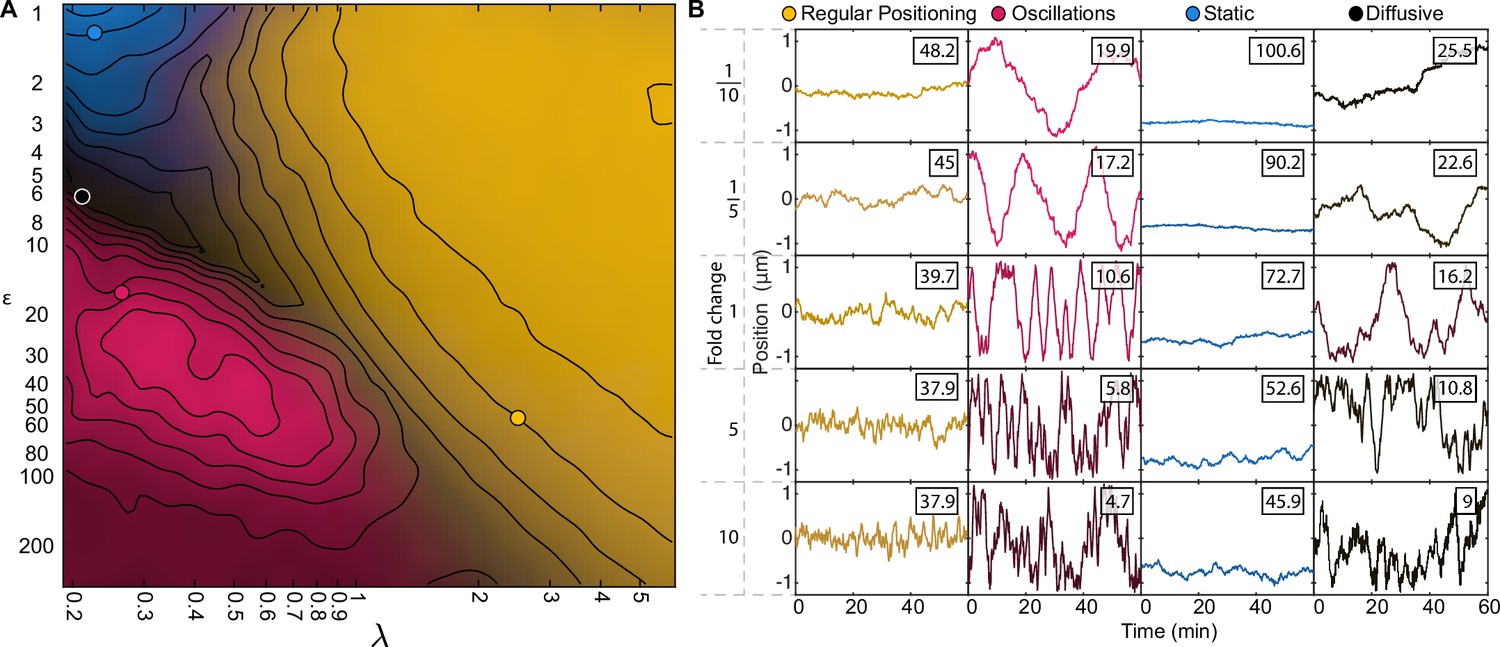
A minimal model of the ParABS system.
(A) Schematic of the model. Light blue shading: nucleoid; light blue stroke: DNA-strand; red: nucleoid bound ParA; yellow: cytosolic ParA; purple: plasmid; arrows indicate binding and dynamics of the system; ka: nucleoid binding rate of ParA; kd: basal hydrolysis rate of ParA; koff: hydrolysis rate of plasmid bound ParA. Insets: (i) elastic fluctuations of the chromosome, (ii) hopping or transfer of DNA-bound ParA-ATP dimers leads to an effective diffusion coefficient Dh. (B) A cartoon depicting low (<10) and high (>10) epsilon conditions. Low leads to a sink of ParA at the plasmid, high leads to a peak of ParA at the plasmid. (C) - (H) Example trajectories from different regimes form the phase diagram. Insets: top, velocity profile; bottom, position histogram; data from 1000 simulations. (I) Phase diagram obtained by varying Dh and koff. Shown in terms of the dimensionless parameters and . The colour is based on an analysis of simulated trajectories as follows. Light brown: Regular positioning (confined and average position at mid-cell); blue: Static (confined and average position not at mid-cell); pink: Oscillations (highest peak in the position autocorrelation at non-zero lag); black: Diffusion (none of the previous). See Materials and methods for details. Location of the F-plasmid is marked by a cross (Figure 3—figure supplement 1). Number of ParA-ParB tethers and plasmid mobility can be found in (Figure 3—figure supplement 2).
Figure 3—figure supplement 1
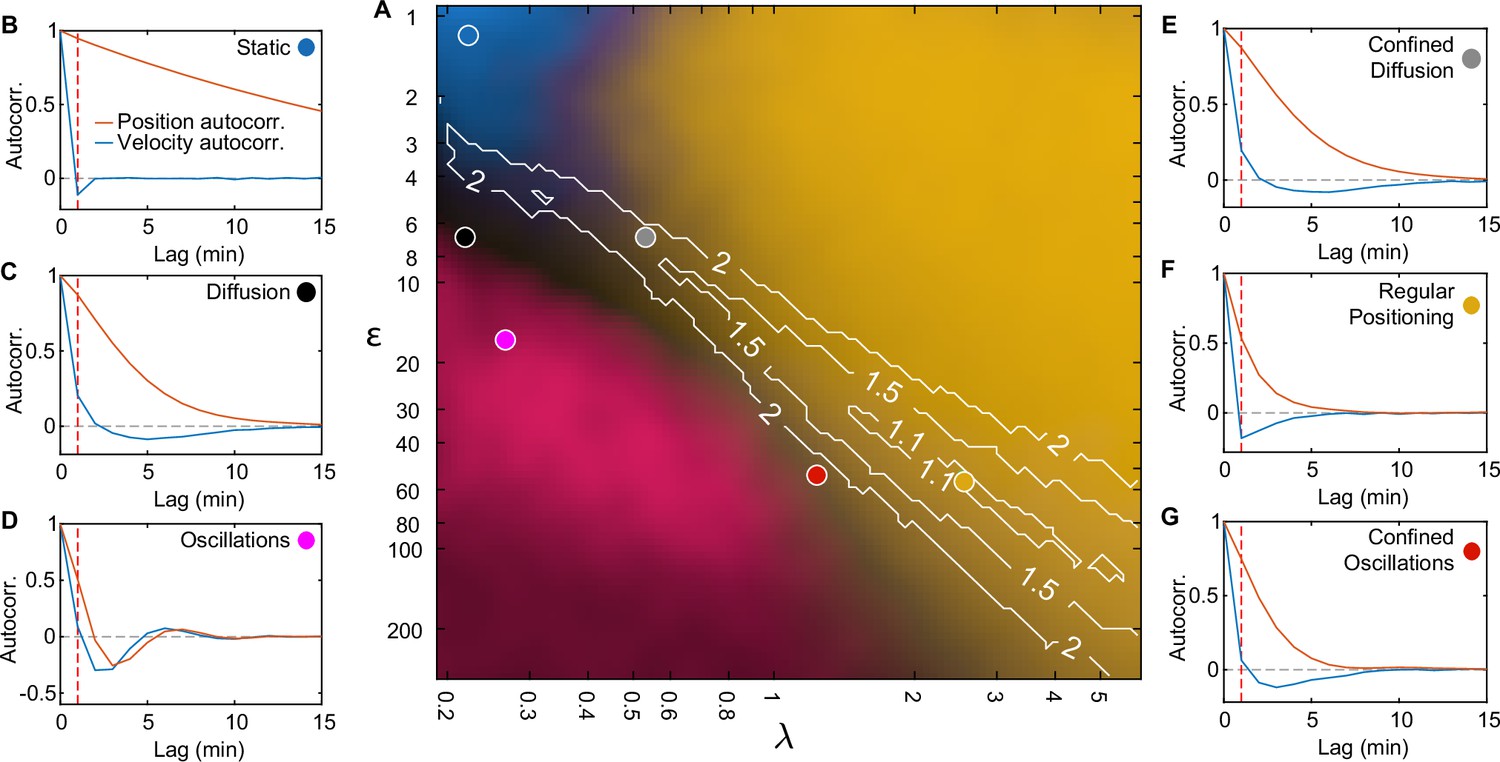
Fitting standard deviation of position and velocity place the F-plasmid inside the regular positioning regime.
(A) Phase diagram of simulations with one plasmid (same as Figure 3I). Contours mark regions where the standard deviation of both position and velocity matches the experimental data, only by varying less than the fold change indicated by the number on the contour. (B–G) position (orange) and velocity (blue) autocorrelation at the indicated positions on the phase diagram (same locations as in Figure 3I). Dara from 1000 simulations. Dashed red line indicates a lag of 1 min. Only the autocorrelations of the regular positioning regime match the experimental curves (Figure 1—figure supplement 2B, C).
Figure 3—figure supplement 2
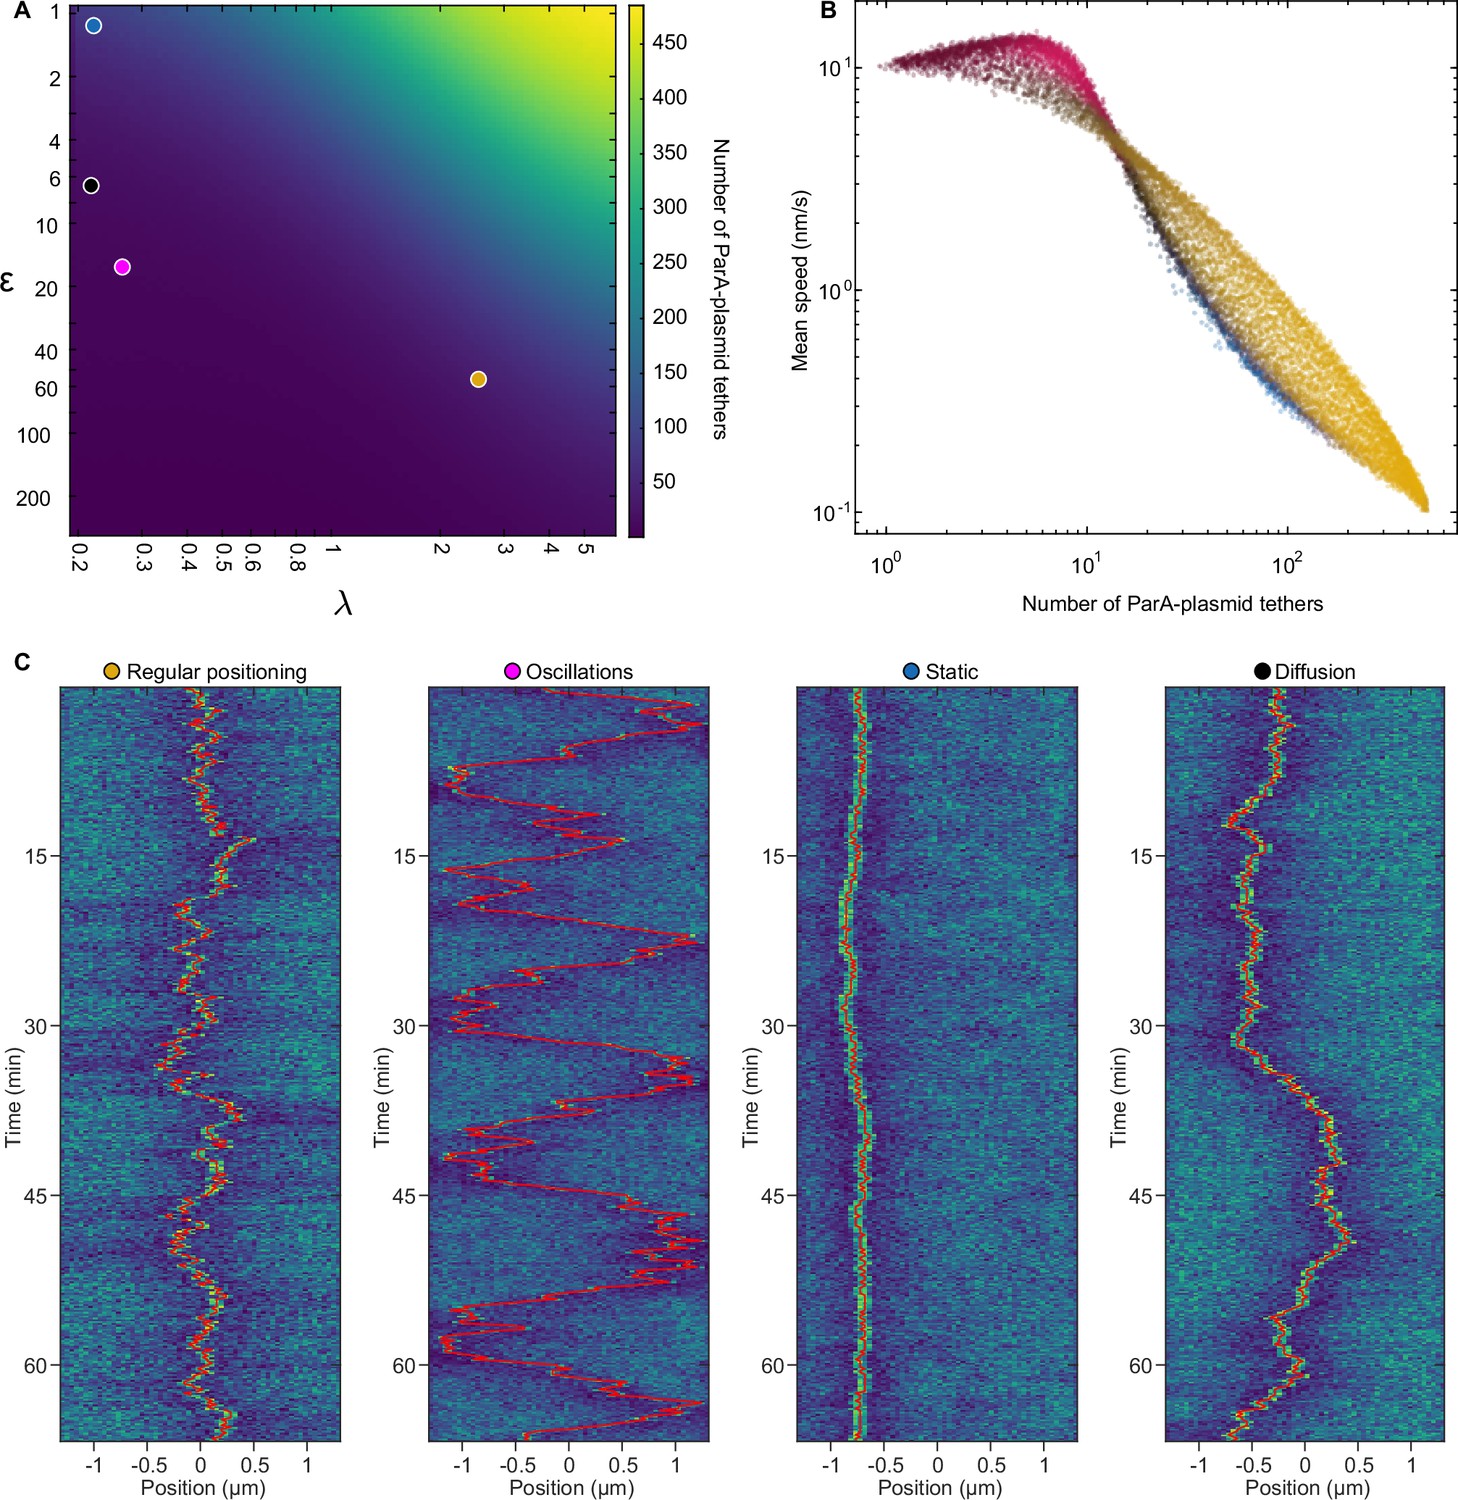
Number of ParA-plasmid tethers and their relation to plasmid mobility.
(A) Heatmap depicting the number of ParA-plasmid tethers across the phase space for cells with on plasmid. (B) Data from Figure 3I re-plotted against the number of ParA-plasmid tethers and plasmid speed (measured over 1-min intervals) instead of . The colour of the data points is the same as in Figure 3I. (C) Kymographs of the ParA distribution of the marked points in (A), as also used in Figure 3. The position of the plasmid is indicated by the red line.
Figure 3—figure supplement 3
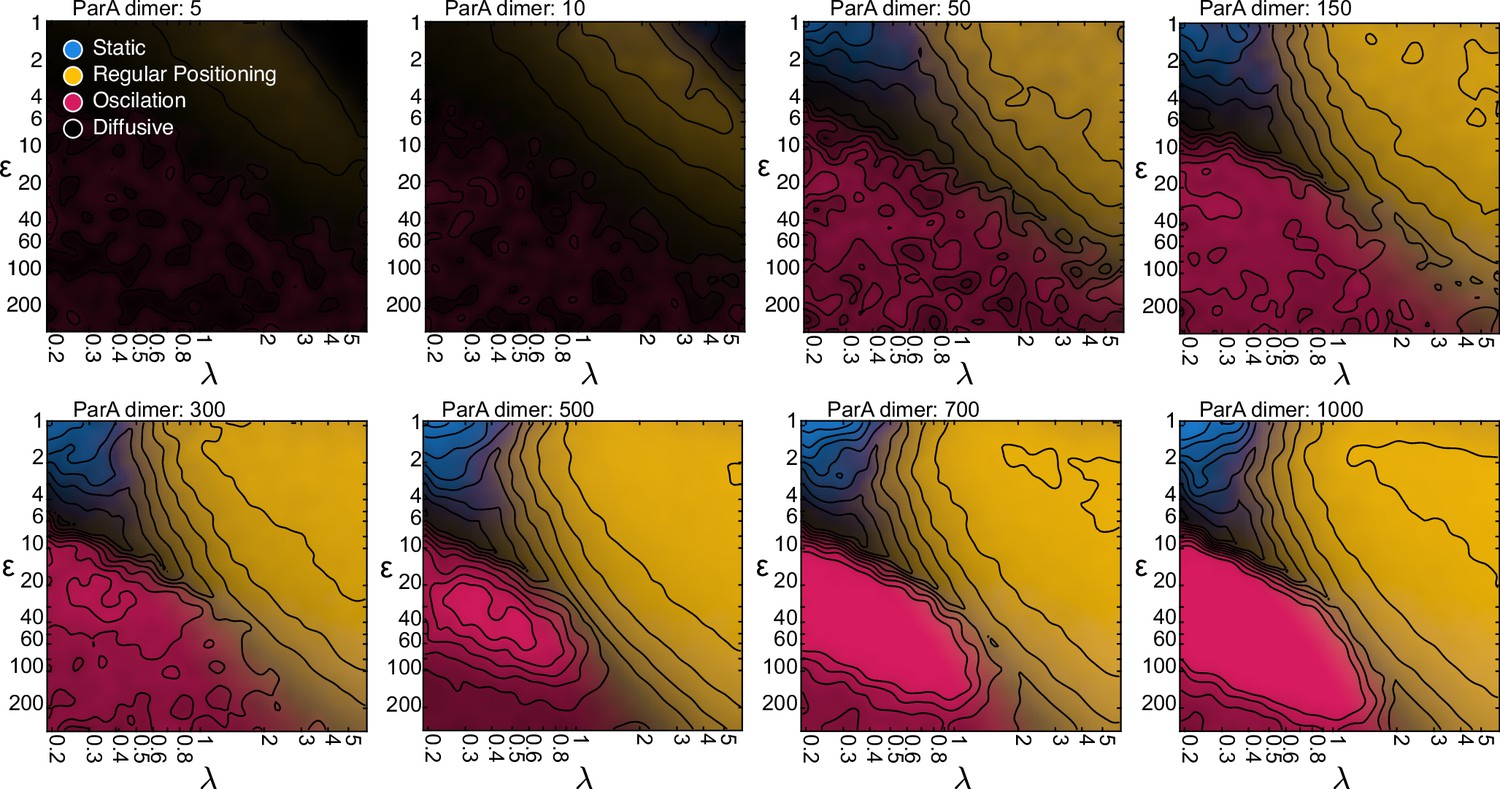
The system is robust against varying the total number of ParA dimers.
Same as in Figure 3I, but with varying numbers of ParA dimers. Unsurprisingly, diffusive dynamics dominate at low numbers. However, the regular positioning regime begins to appear from as little as 10 ParA dimers and all four regimes are detectable from 50 ParA dimers. As the number increases from 50 to 300, the borders between the regimes slightly shift. However, this saturates at around 300 ParA dimers, beyond which the number of ParA has little influence on the dynamical nature of the system.
Figure 3—figure supplement 4
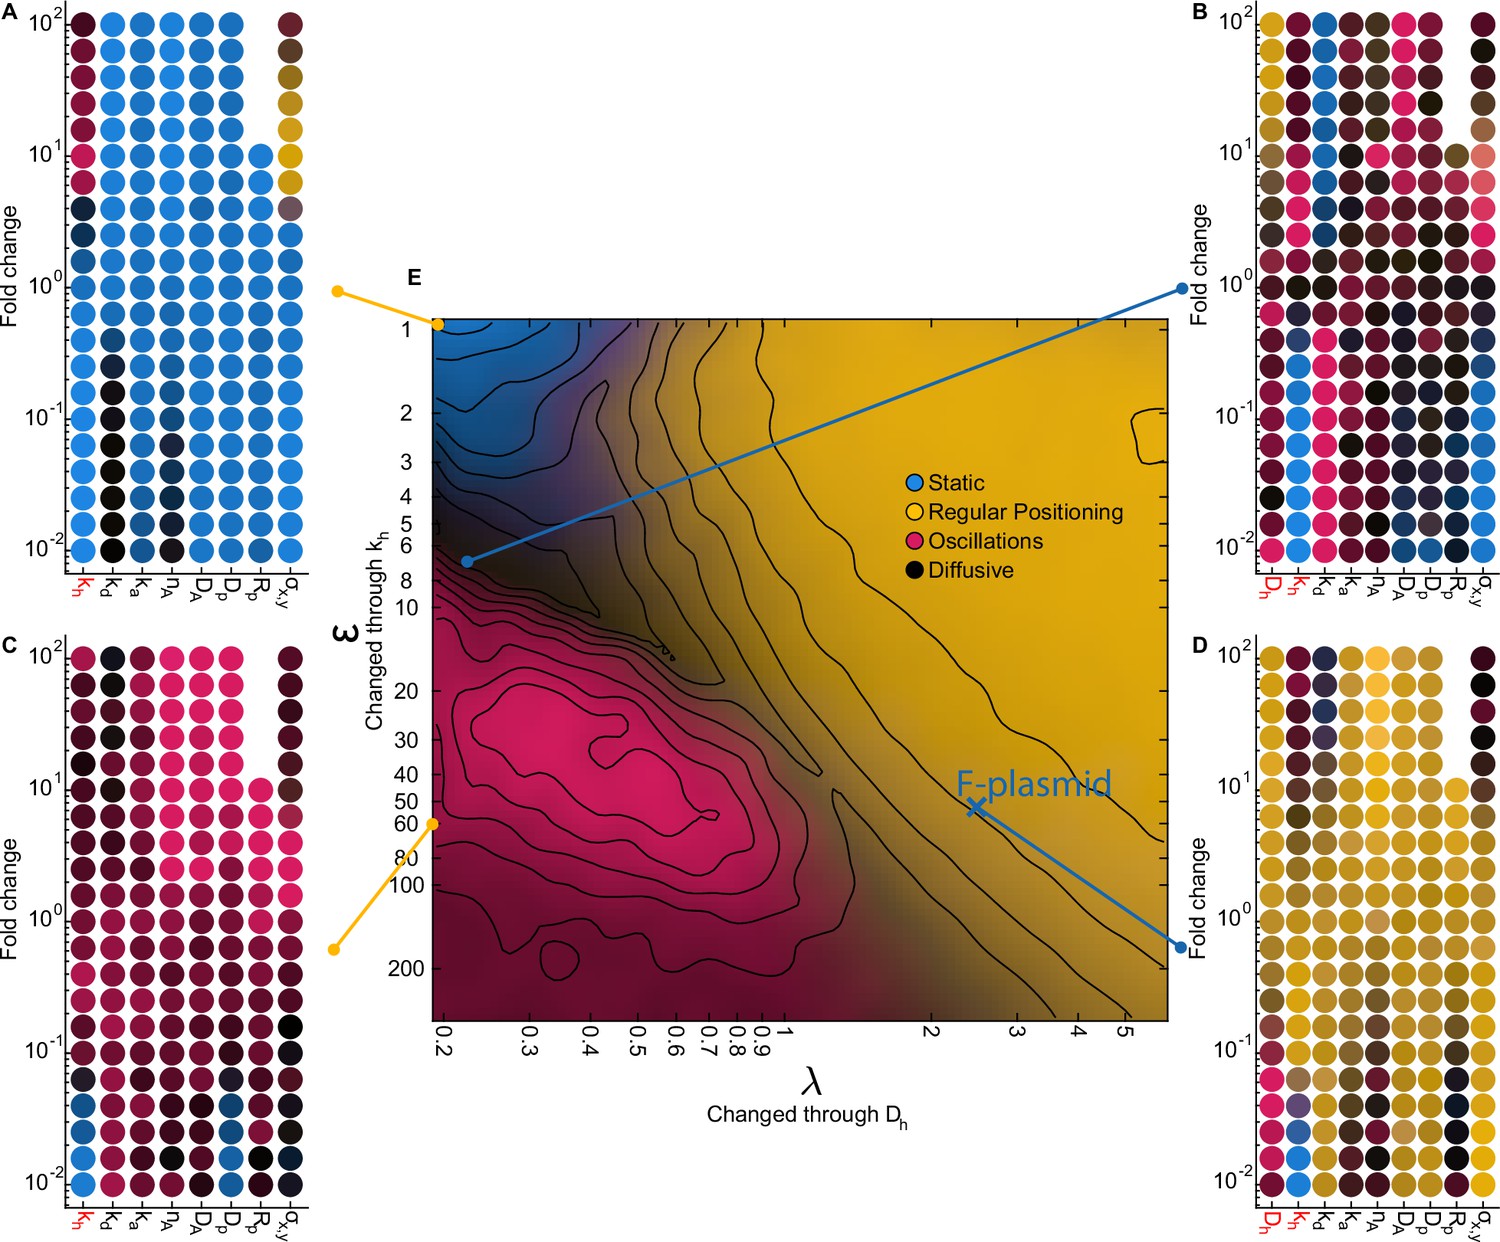
The effect of varying system parameters at characteristic locations in our phase diagram.
(A–D) Each scatter plot contains multiple 1D sweeps centred at the corresponding location in our phase diagram. Each 1D sweep (at its extreme) increases or decreases one parameter by a factor of 100 (fold change 10–2 - 102). At a fold change of 100 the parameters are the same as at the indicated location. Labels in red indicate parameters which were used to change and in our phase diagram (10 simulations per point). The locations for (A) and (C) were chosen such that (no diffusion on the nucleoid). (D) is located at our predicted parameters for F plasmid. The radius of the plasmid () could not be increased more than 10-fold since above that threshold the diameter of the plasmid was greater than the width of the cell. The colours in the scatter plot indicate the behaviour of the system as in Figure 3I. (E) Same as Figure 3I. Notable transitions. (1) Decreasing the tether hydrolysis rate results in longer lived tethers and hence slower plasmid movement. Beyond a point, the plasmid appears static on the timescale of the simulation. However, we have confirmed by performing longer simulations that it is not static but diffusive for and regularly positioned for (as explained in the text, the blue region in the top left of the phase diagram is technically diffusive) as predicted by flux balance. As is increased in the regime, an oscillatory transition occurs when the plasmid begins to move faster than hydrolyzed ParA dimers can be replaced resulting in a depletion zone behind the plasmid and directed movement. (2) Decreasing decreases the diffusive length-scale , moving the system out of the regular positioning regime and towards either oscillatory or diffusive dynamics. It also decreases the total flux of ParA into the plasmid leading to fewer tethers but this is not responsible for the nature of the dynamics as increasing , the total amount of ParA, does not affect the nature of the dynamics (see also Figure 3—figure supplement 3). (3) Increasing decreases both and (as well as the fraction of nucleoid-bound ParA dimers ) and so moves the system approximately diagonally in the phase diagram. (4) The plasmid diffusion coefficient is most relevant in the oscillatory regime, in which there are the fewest tethers. Oscillations rely on the plasmid moving faster than hydrolyzed ParA tethers can be replaced. Thus increasing plasmid mobility through results in stronger directed movement and hence oscillations, while decreasing it moves the system towards more diffusive behaviour (C). (5) An additional requirement for non-diffusive dynamics is that the tether lifetime is longer that the timescale of the tether-induced ‘pulling’ ( for a single tether). This effect explains the darkening in the phase diagram at the bottom of the oscillatory regime. The same transition to diffusive dynamics occurs at high values of the spring constant . Note however that for the longest tether lifetime and high , regular positioned was observed at (; no diffusion on the nucleoid) i.e. outside of our claimed regular positioning regime (A). This occurs because at this unphysical value, is comparable to the size of the cell and therefore DNA-bound ParA dimers can interact with the plasmid from every location within the cell. The plasmid is therefore positioned at mid-cell because this is where the net force from all tethered dimers balances. In other words geometry sensing occurs, not through the local detection of a disparity in incoming fluxes but through the global detection of all ParA dimers.
Figure 3—figure supplement 5
1D sweeps orthogonal to the phase diagram support the role of and in defining the dynamics.
(A) Same as Figure 3I with four marked positions. (B) Example simulated trajectories at the marked positions. The parameters , , and were changed simultaneously by the indicated factor. This causes a change in the turnover rate of ParA-plasmid tethers while keeping the dimensionless quantities , and unchanged. The colour of each trajectory shows the classification of the dynamics at that fold change according to the colour scheme introduced in Figure 3I based on multiple long trajectories. Note the change in the frequency of fluctuations in plasmid position, consistent with changes in tether lifetime. The average number of tethers (indicated in each panel) does not remain constant because with increasing each bound ParA dimer has less time between hopping events to explore its local neighbourhood through elastic fluctuations of the underlying DNA (controlled by the parameters and ), leading to a lower rate of tether formation. In the oscillatory regime, the increase in the plasmid speed results in a shortening of the period of the oscillations. However, at the shortest tether lifetimes, noise begins to dominate as the tether lifetime approaches the timescale of tether-induced pulling.
Figure 4

Fitted position of the F-Plasmid.
Simulated data (blue) from Figure 3H at compared to the experimental data (red) from Figure 1E. Top: Mean velocity of plasmids as a function of position relative to the trajectory mean. Light and dark shading indicate standard deviation and standard error respectively. Bottom: Probability density of plasmid position relative to mean of trajectory.
Figure 5 with 1 supplement
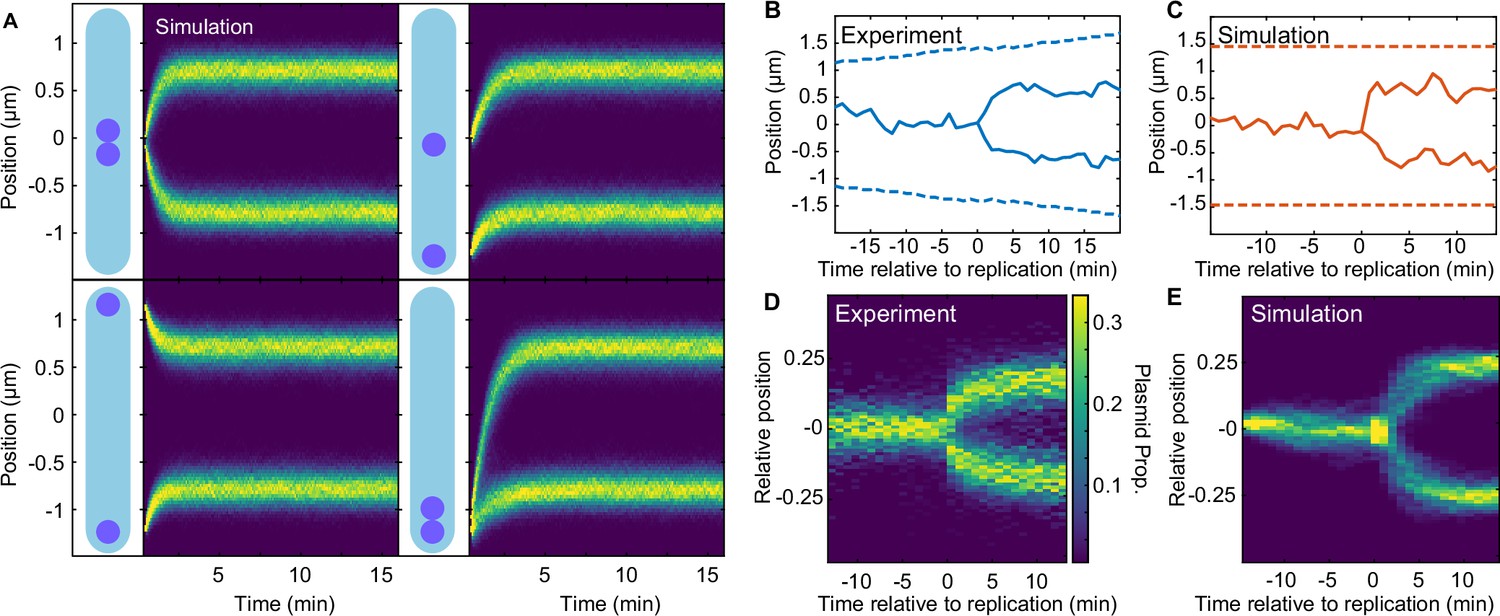
Regular positioning of two simulated plasmids.
(A) Kymographs showing the distribution of plasmid positions starting from different initial positions along the long axis. Data is from 1000 simulations each. Nucleoid length is chosen to match our experimental data (see Table 2). (B) Example of F plasmid replication (splitting ParB-mVenus focus) event. (C) Example simulated replication event. (D) Kymograph of F plasmid splitting events as in (B). Data from 500 cell cycles were combined according to the time of focus splitting. (E) Kymograph of simulated plasmid replication. Upon replication, both plasmids occupy the same position but only one inherits the ParA-ParB tethers. This does not affect the result as the number of tethers equilibrates rapidly. Data from 1000 simulations. Note that in (D) position is relative to cell length, rather than nucleoid length as in the simulations (D). See also Figure 5—figure supplement 1A.
Figure 5—figure supplement 1
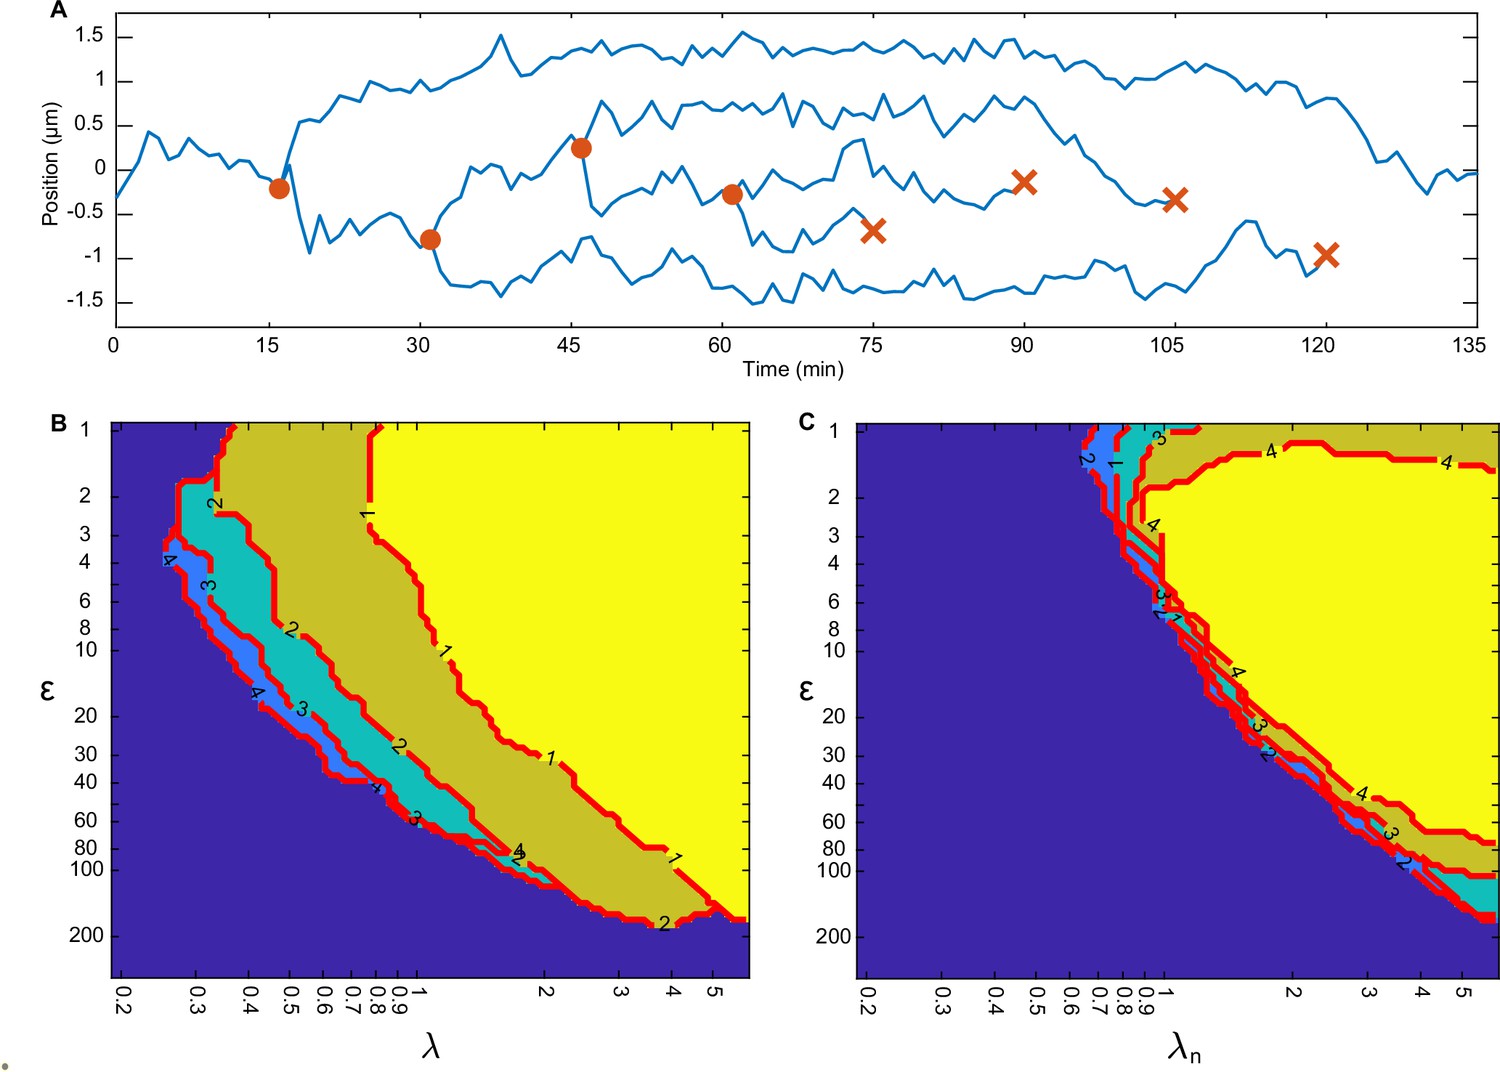
Regular positioning with multiple plasmids.
(A) Example trajectory showing positioning relative to mid-nucleoid during plasmid replication/deletion. One plasmid is replicated every 15 min (orange circles) for 60 min. Afterwards, one plasmid is deleted every 15 min (orange cross). (B) Boundary of the regular positioning regime for 1–4 plasmids, determined by (see Materials and methods). Number on the contour indicates the number of plasmids, . The colours are arbitrary and for visual clarity (region on top is the brightest). (C) Same as in (B) but with a normalised to take account of the number of plasmids: . This way all regimes collapse into one location.
Figure 6 with 3 supplements
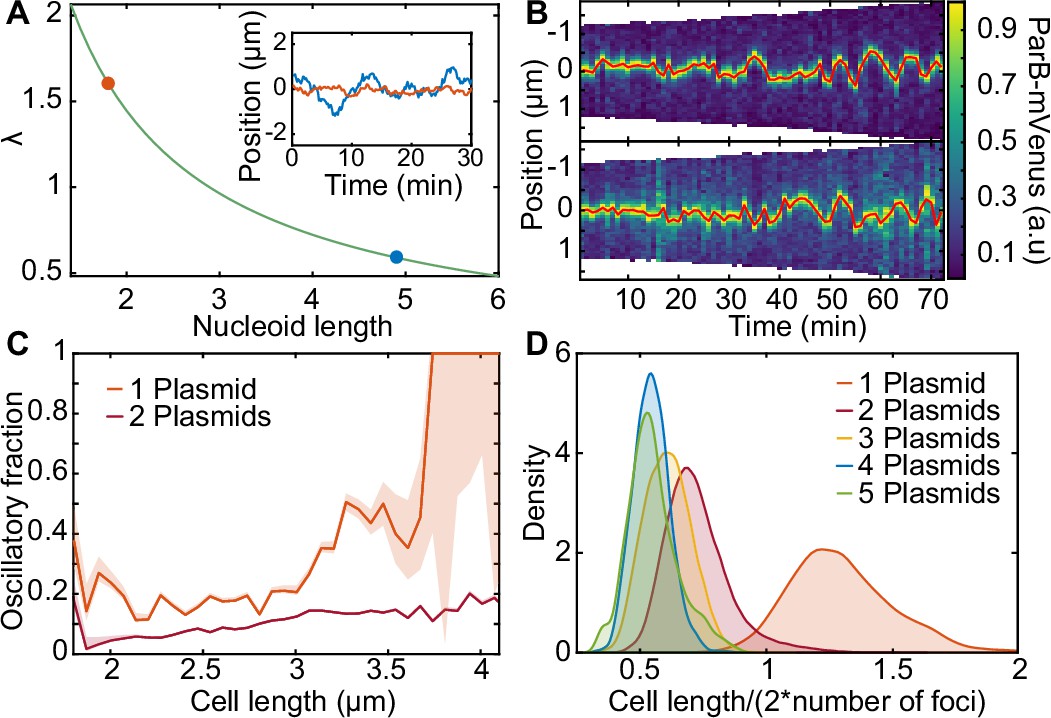
Length-dependent effect on the transition from regular positioning to oscillations.
(A) inverse dependence of on nucleoid length. inset: simulated trajectories at the highlighted lengths/ values. (B) kymographs of parb-mvenus signal along the long axis of two cells depicting the transition from regular position to low-amplitude oscillations. the plasmid trajectory is highlighted in red. (C) the fraction of the oscillating population plotted against cell length for cells with one (879 cell cycles) or two plasmids (5044 cell cycles) (see figure 6—figure supplement 1). (D) the distribution of threshold length-scale (l/2n) for cells containing different numbers of plasmids. data from 16,346 cell cycles.
Figure 6—figure supplement 1
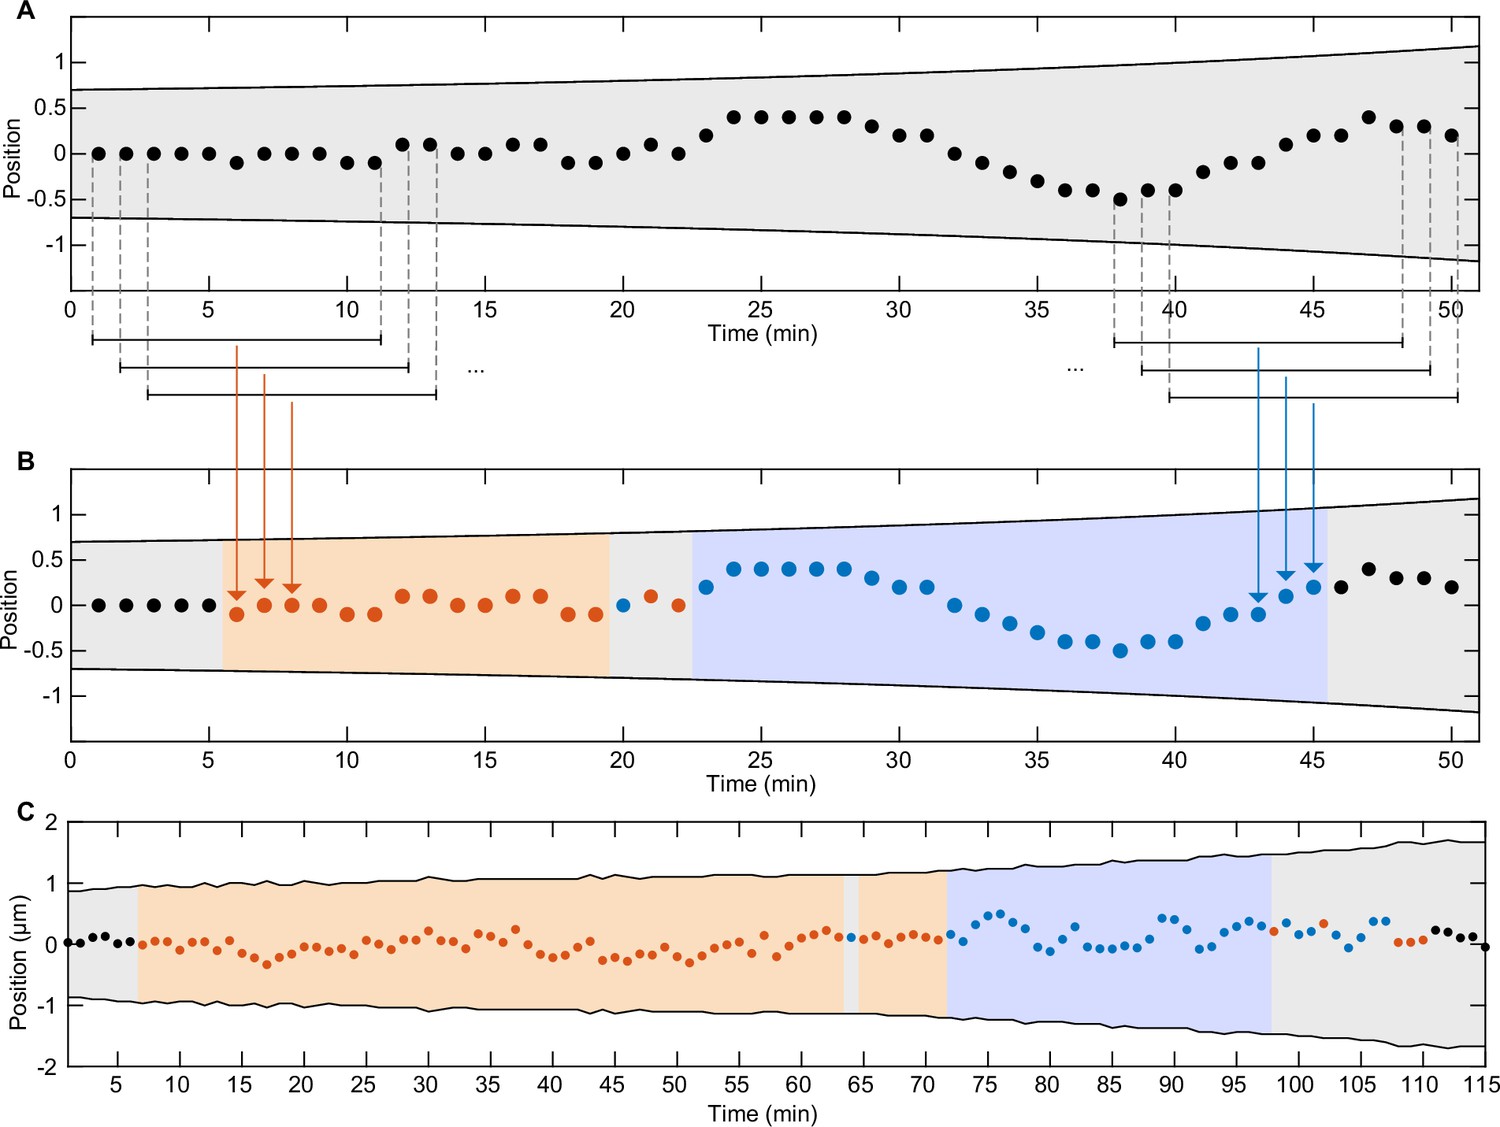
Classification of segments of trajectories.
(A) Example trajectory (made up) of a cell containing one foci. Shaded areas indicate cell boundaries. Black bars represent a sliding window moving along the trajectory. Points which are captured by the sliding window are marked by dashed lines. (B) Same trajectory as in (A) but each point in the middle of a sliding window was colour-coded based on the sign of the velocity autocorrelation at a lag of 1 min (i.e. between consecutive frames) inside the sliding window. Orange indicates negative correlation/regular positioning and blue positive correlation/oscillations. Segments are classified (indicated by coloured shading) only if they consist of more than 6 points with the same annotation. These were used for subsequent analysis. (C) Example of an annotated/classified trajectory from experimental data.
Figure 6—figure supplement 2

Oscillatory behaviour decreases upon plasmid replication.
(A) A violin plot of the velocity autocorrelation at lag 1 min in the 12 frames before and after plasmid replication (one fluorescent focus becoming two). The black bar indicates the mean. Post-replication trajectories are separated according to the sign of the value before replication. Trajectories with persistent dynamics (positive velocity autocorrelation) do not have an increased bias to remain persistent after replication (n=186). (B) An example cell cycle in which oscillatory dynamics are detectable before plasmid replication but not afterwards.
Figure 6—figure supplement 3
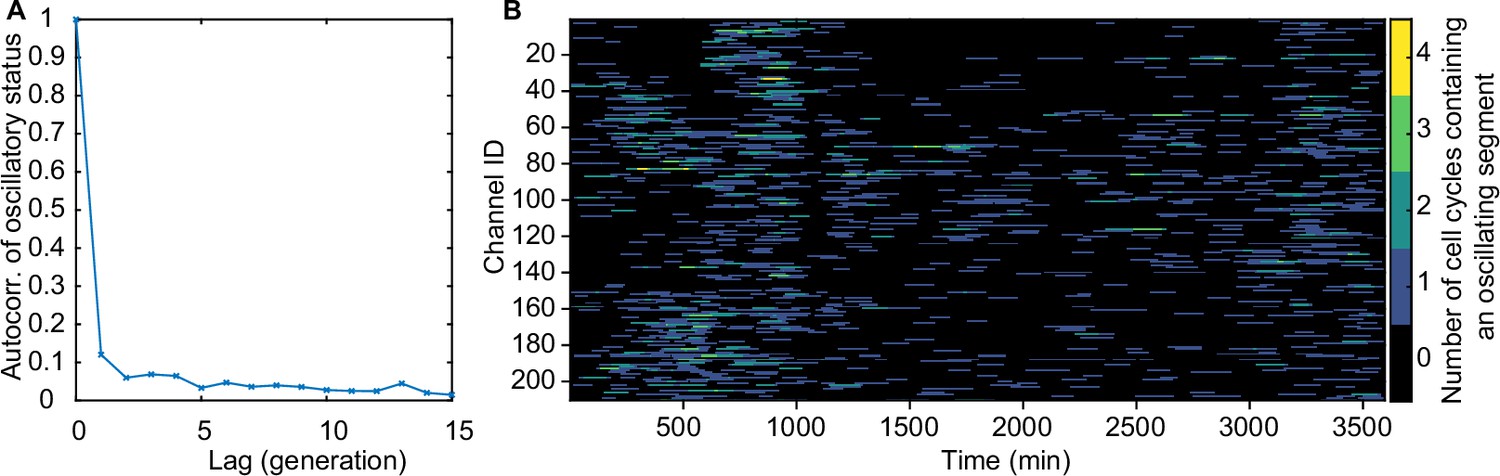
There is no significant inheritance of oscillatory behaviour.
(A) 210 lineages of mother cells were followed over many generations to calculate the autocorrelation of oscillatory status (1 if the cycle contains an oscillatory segment, 0 otherwise) (B) The number of analysed cell cycles from each channel of the mother machine that contain an oscillatory segment.
Figure 7 with 3 supplements
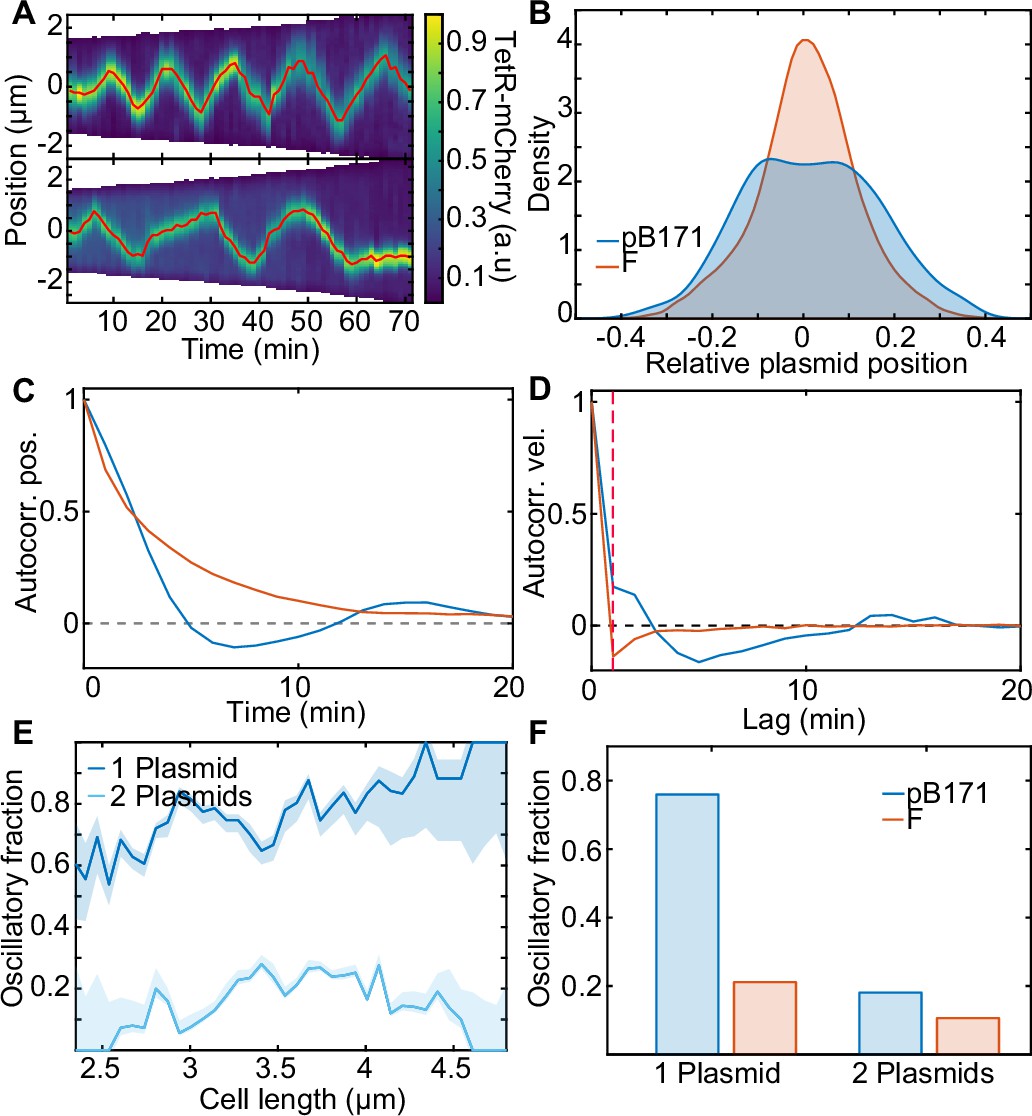
pB171 and its differences to F.
(A) Two kymographs (pB171) of TetR-mCherry signal along the long axis of two cells with one plasmid. Red line indicates the trajectory of the plasmid (more examples of trajectories can be found in Figure 7—figure supplement 2). (B) Relative position position distribution for pB171 (blue, 68 cell cycles) and F-Plasmid (red, 879 cell cycles) for cells with one plasmid. (C,D) Position and velocity autocorrelation for pB171 (blue) and F plasmid (red). Positive velocity autocorrelation at 1 min (dashed red line) indicates processive dynamics (see Figure 1—figure supplement 2). (E) The proportion of trajectory time points classified as oscillatory from pB171 plotted against cell length for cells containing one or two plasmids. Data from 68 and 117 cell cycles, respectively. (F) Comparison between oscillating population of pB171 and F-Plasmid with one and two plasmids on whole population level.
Figure 7—figure supplement 1
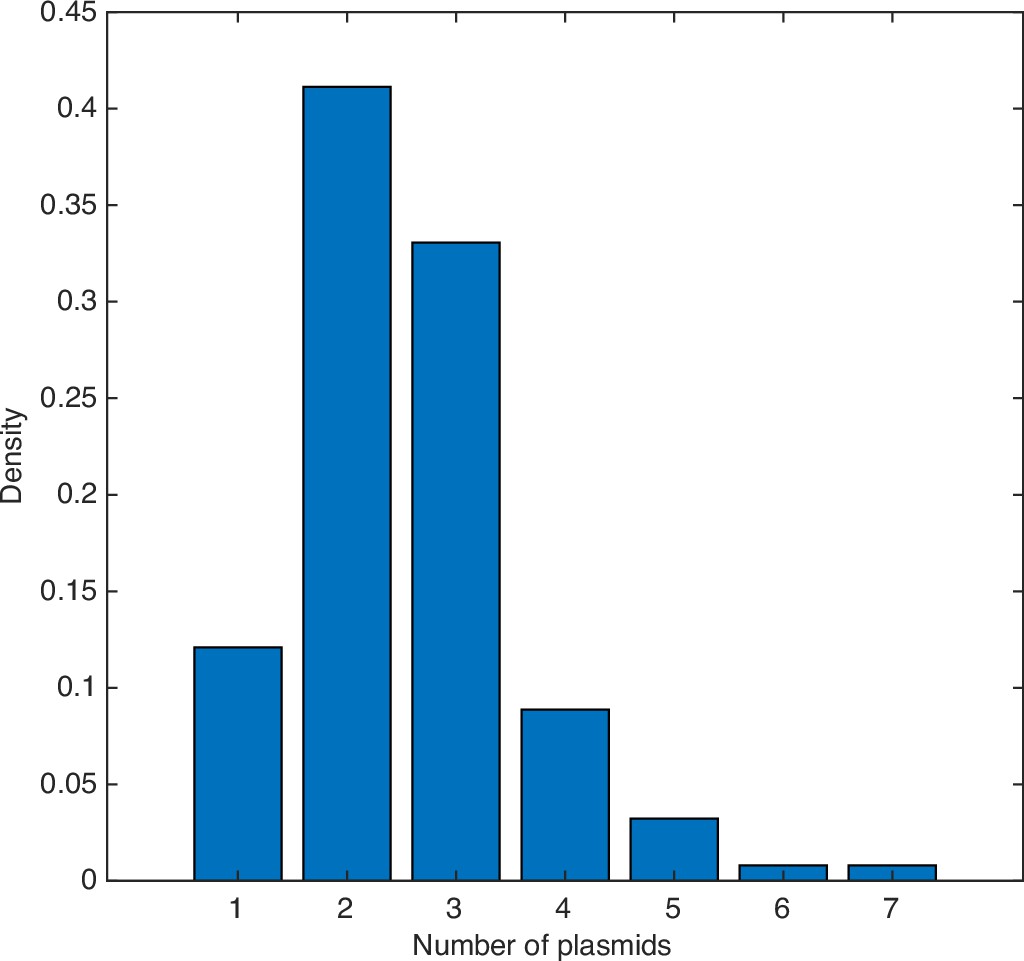
Distribution of copy number of pB171 as measured by the number of fluorescent foci within cells.
Data from 124 cells. The mean is 2.56 plasmids per cell.
Figure 7—figure supplement 2
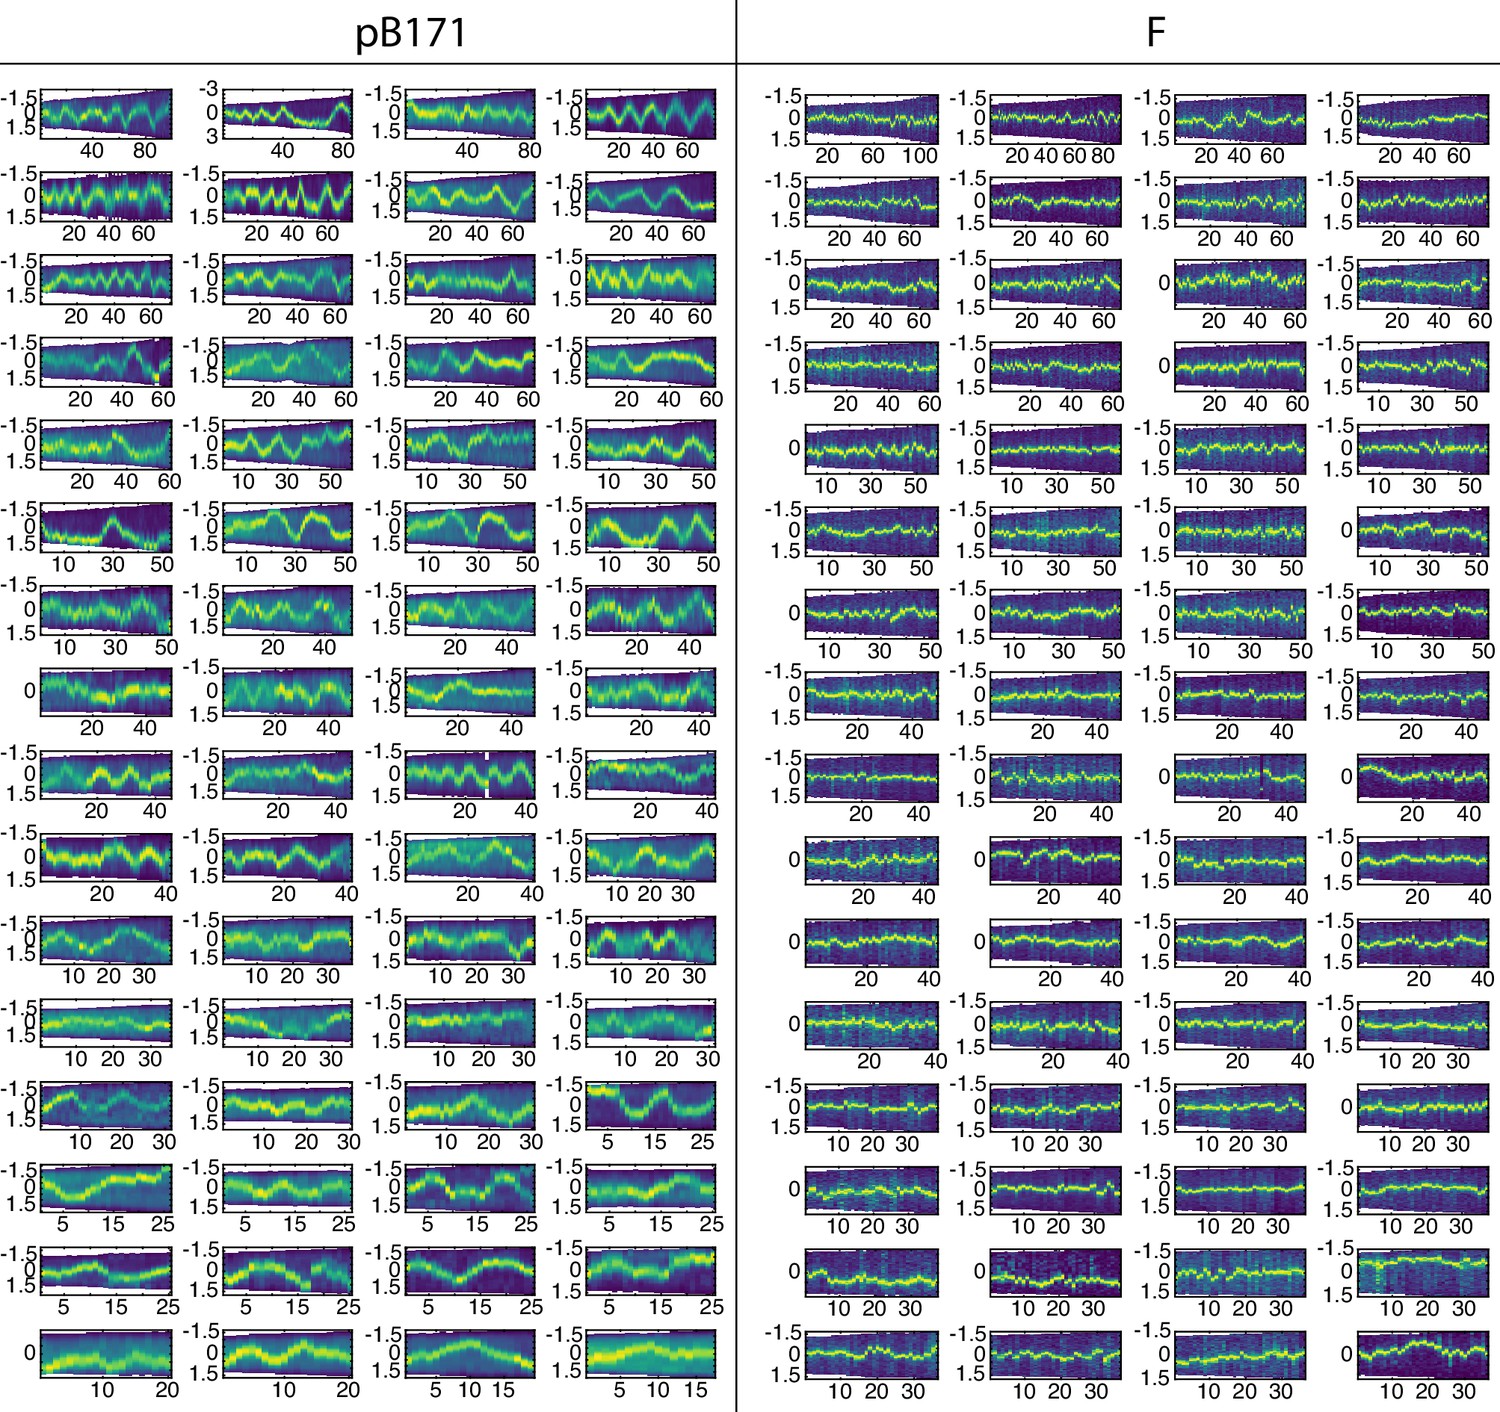
Comparison of pB171 and F-plasmid.
Example kymographs of cells with one plasmid. Time is in minutes on the x-axis and position along the long axis in μm is on the y-axis. The intensity corresponds to TetR-mCherry (pB171) or ParB-mVenus (F).
Figure 7—figure supplement 3
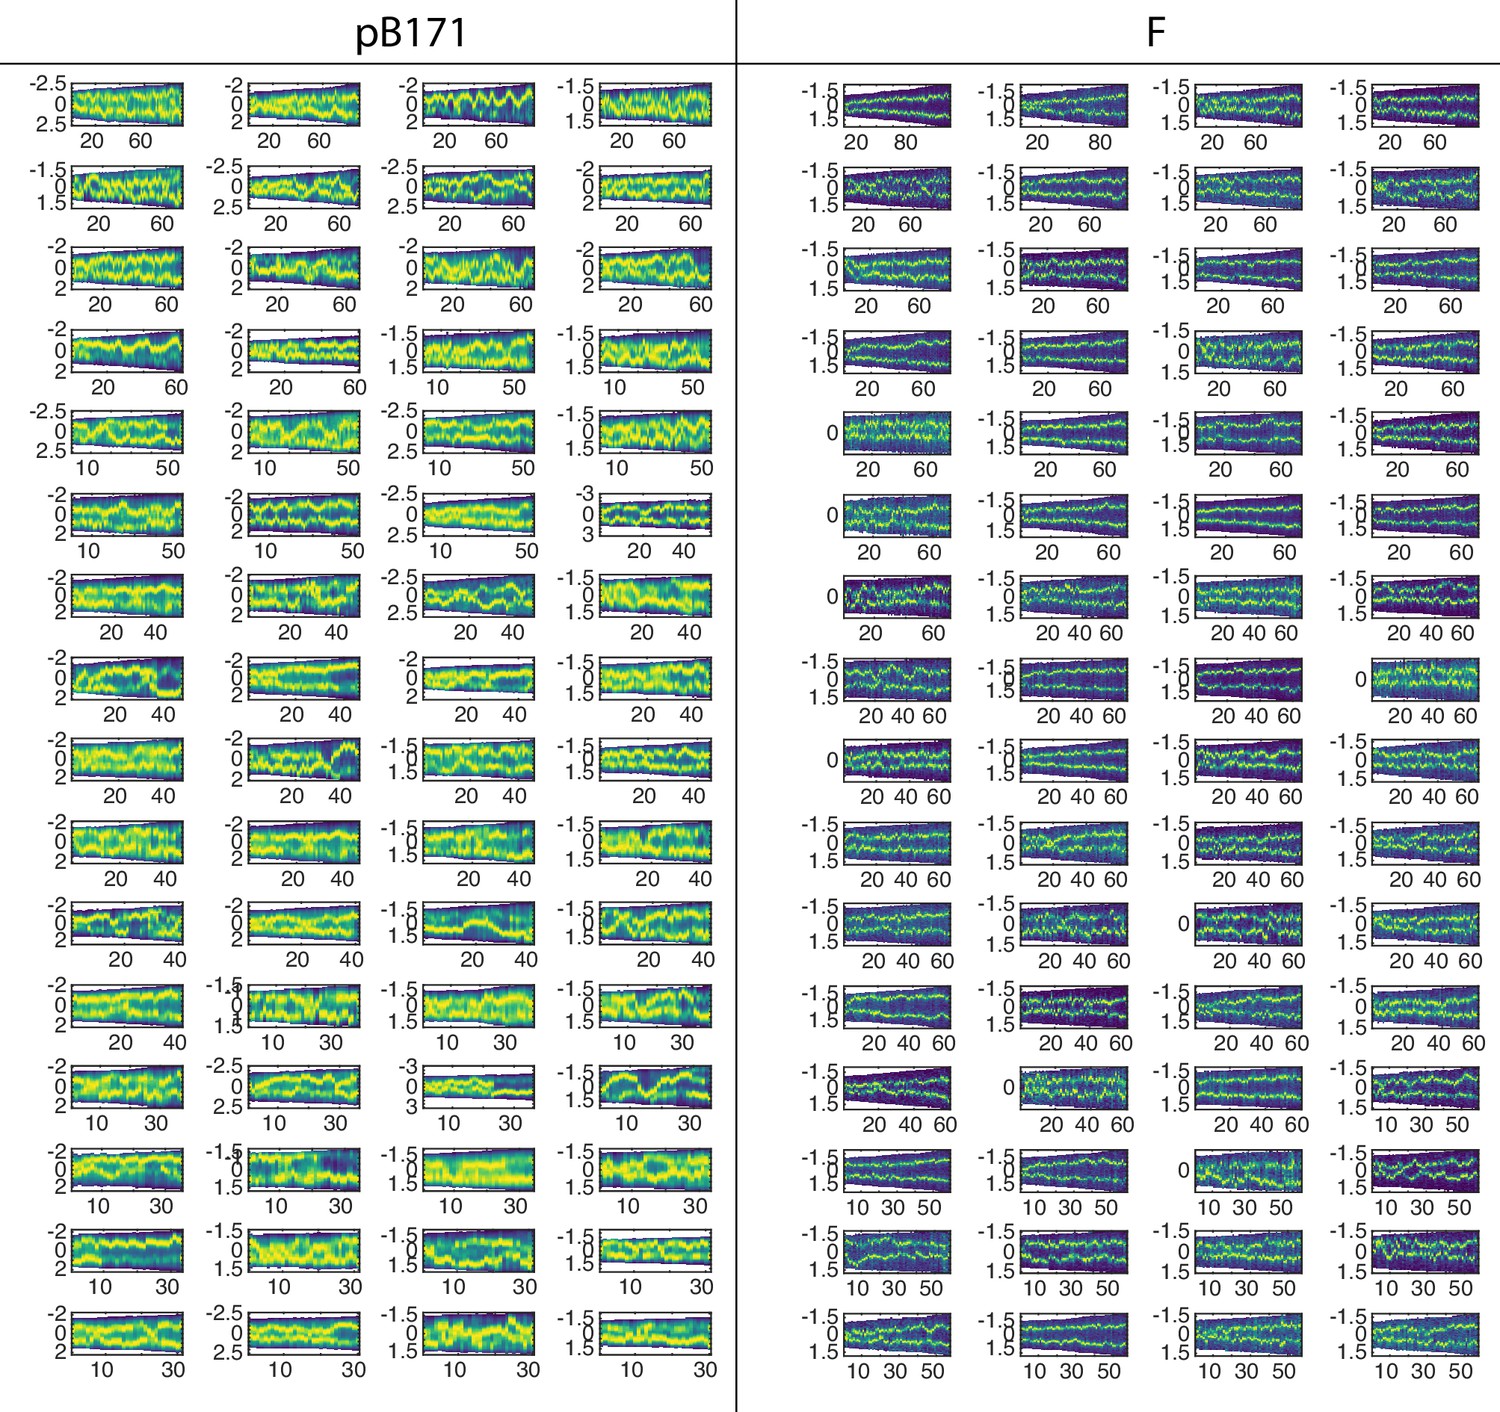
Comparison of pB171 and F-plasmid in cells containing two plasmids.
As in Figure 7—figure supplement 2 but trajectories are from cells containing two plasmids. See Figure 7F for quantification.
Figure 8
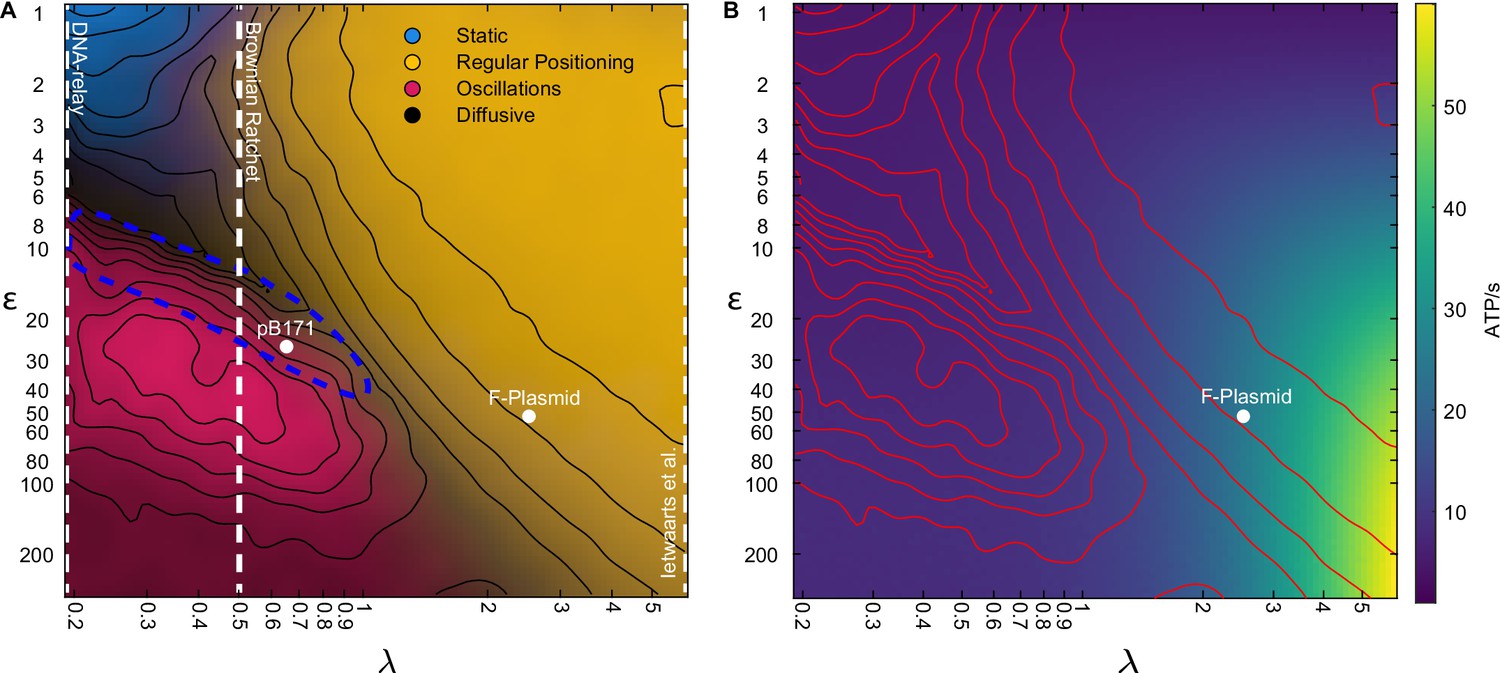
The model encompases existing stochastic models as limiting cases.
(A) The phase diagram for a single plasmid from Figure 3I with the conceptual location of existing stochastic models indicated. In the DNA relay model, bound ParA-ATP dimers do not diffuse on the nucleoid and so . The model cannot produce regular positioning. In the model of Ietswaart et al., ParA dimers diffuse on nucleoid but only dissociate by interacting with the plasmid, therefore and the model lies entirely in the regular positioning regime. For both models, the y-axis represents the hydrolysis rate at the plasmid. The Brownian Ratchet lies between these two extremes. The length scale associated to ParA diffusion is finite but its value was fixed at μm (given for a 2 μm nucleoid), so that the regular positioning regime is not explored. The locations of the ParABS systems of F plasmid and pB171 in cells containing a single plasmid are shown. The location of pB171 is an estimate based on a qualitative comparison of its dynamics. The blue dashed line marks the region in which the period of the oscillations resembles the experimental observations. (B) ATP consumption rate. Red lines are the contours from (A).
Tables
Table 1
Model Parameters.
| Parameter | Brief description | Value | Source |
|---|---|---|---|
| Association rate to the nucleoid of cytosolic ParA | 0.19 s–1 | As Surovtsev et al., 2016a. Based on in vitro measurement from Vecchiarelli et al., 2010. Results in 95% ParA nucleoid association in the absence of a plasmid. | |
| Dissociation due to basal hydrolysis rate of ParA | 0.01 s–1 | Based on in vitro measurement from Hwang et al., 2013; Vecchiarelli et al., 2013. | |
| Tether dissociation due to plasmid stimulated hydrolysis of ParA | 0.01–3 s–1 | Sweeped over in this study. | |
| Diffusion coefficient of the plasmid | 3x10⁻³ μm2s–1 | As Surovtsev et al., 2016a. Based on MSD of a Δpar plasmid. | |
| Diffusion coefficient of ParA home position on the nucleoid | 3.22x10⁻⁴ to 0.29 μm2s–1 | Sweeped over in this study. | |
| Diffusion coefficient of DNA-bound ParA due to chromosomal fluctuations | 0.01 μm2s–1 | As Surovtsev et al., 2016a; Based on Javer et al., 2014 and Weber et al., 2010. | |
| Width of the cell | 0.95 μm | This study | |
| Length of the cell | 2.5–4.34 μm | This study | |
| Simulation time step | 0.001 s | This study | |
| Radius Plasmid | 0.05 μm | As Surovtsev et al., 2016a. Estimate from Sanchez et al., 2015. | |
| Radius ParA | 0.002 μm | As Surovtsev et al., 2016a. Based on ParA crystal structure from Leonard et al., 2005. | |
| Width of elastic fluctuations of the chromosome along long cell axis | 0.1 μm | As Surovtsev et al., 2016a. | |
| Width of elastic fluctuations of the chromosome along short cell axis | 0.05 μm | As Surovtsev et al., 2016a. | |
| Number of ParA dimers | 500 | Midrange estimate from Adachi et al., 2006; Bouet et al., 2005; Lim et al., 2014. | |
| Number of Plasmids | 1–5 | This study |
Table 2
Simulation parameters used in figures.
-
*
nA was changed in the range of 5 to 1000.
-
†
kd was changed to 0.001.
Table 3
Model comparison.
| Hopping and relay(This study) | DNA-Relay (Surovtsev et al., 2016a) | Brownian-Ratchet (Hu et al., 2017) | Model of Ietswaart et al., 2014 | Model of Schumacher et al., 2017† | |
|---|---|---|---|---|---|
| Elastic fluctuations | ✓ | ✓ | ✓ | X | ✓ |
| Basal-hydrolysis | ✓ | X | ✓ | X | X |
| ParA diffusion on nucleoid | ✓ | X | ✓ | ✓ | ✓ |
| Length-scale of ParA diffusion on the nucleoid | finite | 0 | finite | infinite | infinite |
| ParA diffusion on partition complex | X | X | X | X | ✓ |
| Hydrolyzed nucleoid bound ParA state | X | X | ✓ | X | X |
| Limited binding of ParA to partition complex | X | X | ✓ | ✓ | X |
| Limit on tether length | X | X | ✓ | X | X |
| Cytosolic ParA pool | Well mixed | Well mixed | Unlimited pool, well mixed | Well mixed | Well mixed |
| Observed behaviour | Diffusion, regular positioning, static, oscillations | Oscillations | Diffusion, local excursion*, static, oscillations | Regular positioning ‡ | Regular positioning |
-
*
The Brownian ratchet model has all the necessary components/mechanisms to produce regular positioning. However, the parameters used in the study were such that the length-scale was not sufficiently high for regular positioning and therefore only ‘local excursion’ (approximate positioning in our terminology) instead of regular positioning was observed in cells with one plasmid.
-
†
In this model of the PomXYZ of Myxococcus xanthus, PomZ is the analog to ParA and the PomXY cluster is the analog of the partition complex.
-
‡
There are two stochastic models (with and without ParA filaments) presented in Ietswaart et al., 2014. The model including filaments is an extension of the other. Both models are capable of producing regular positioning.
Additional files
Download links
A two-part list of links to download the article, or parts of the article, in various formats.
Downloads (link to download the article as PDF)
Open citations (links to open the citations from this article in various online reference manager services)
Cite this article (links to download the citations from this article in formats compatible with various reference manager tools)
High-throughput imaging and quantitative analysis uncovers the nature of plasmid positioning by ParABS
eLife 11:e78743.
https://doi.org/10.7554/eLife.78743


