Protein evidence of unannotated ORFs in Drosophila reveals diversity in the evolution and properties of young proteins
- Laboratory of Evolutionary Genetics and Genomics, The Rockefeller University, United States
Figures
Figure 1
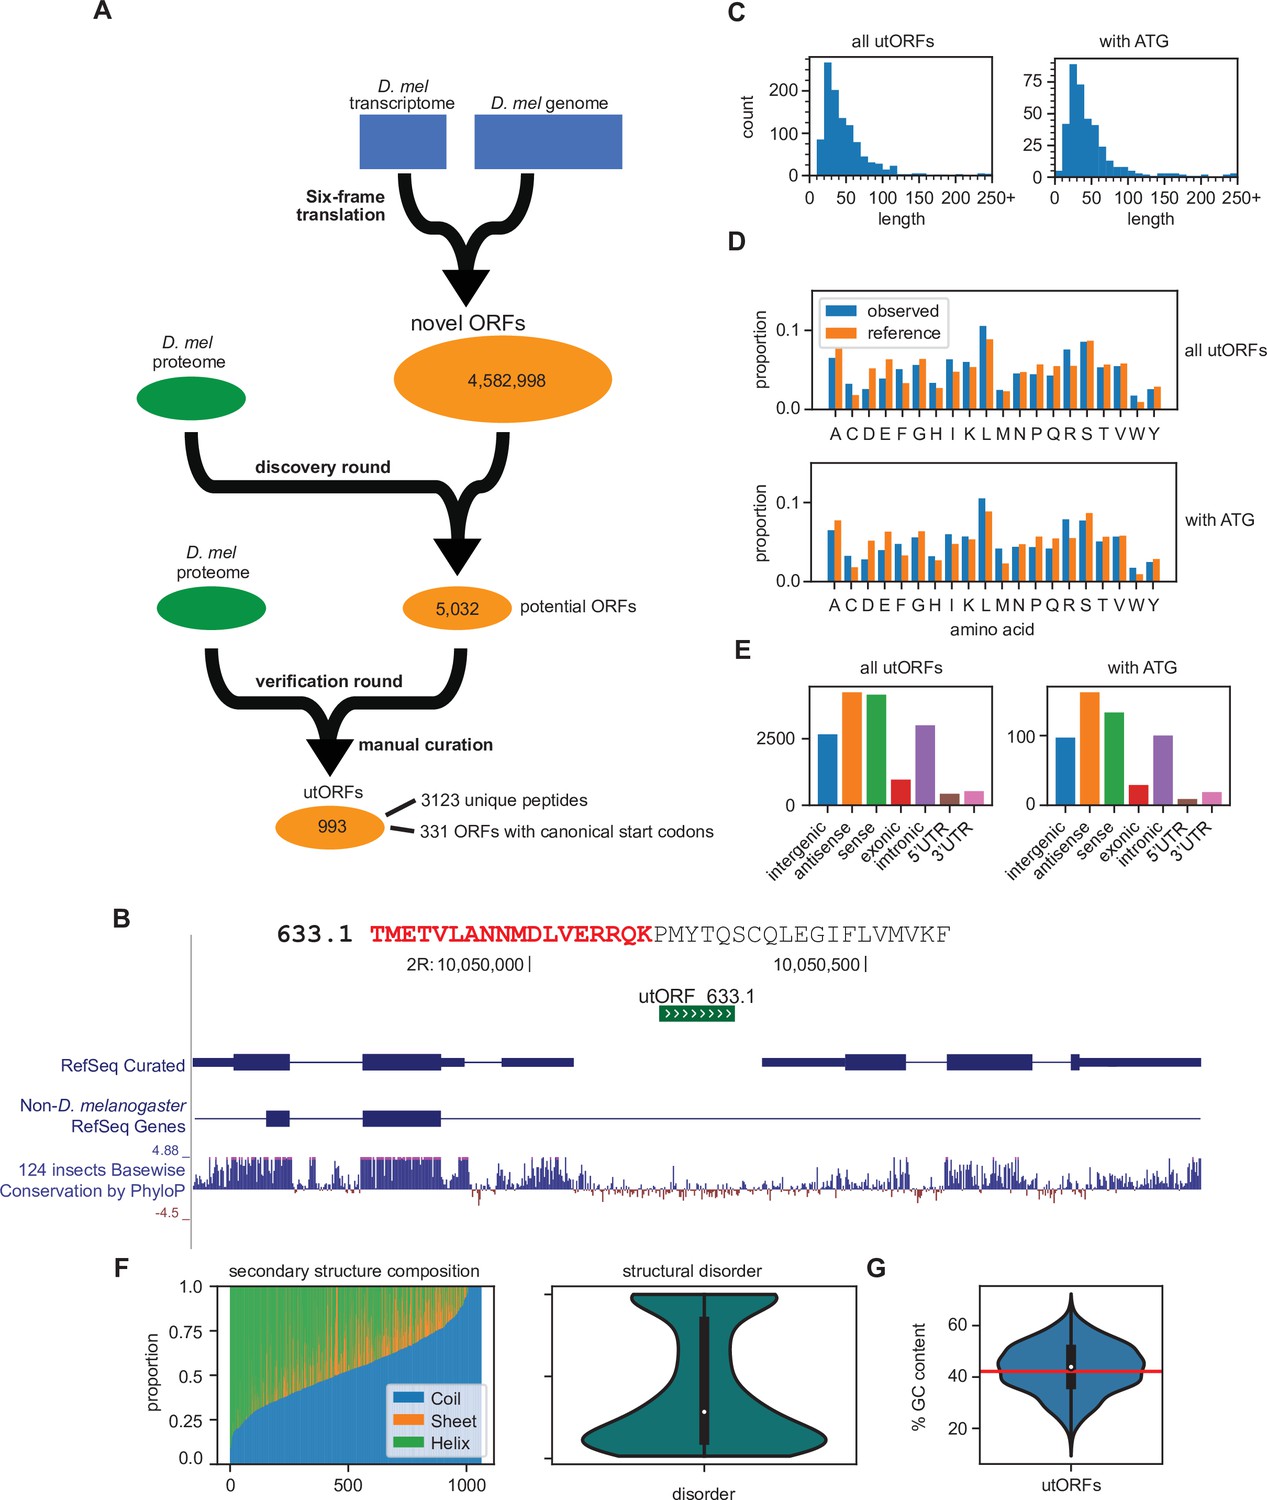
Identification of unannotated translated open reading frames (utORFs) and their properties.
(A) We detected utORFs by searching via a two-round approach through a comprehensive database of potential open reading frames (ORFs) that was generated from a six-frame translation of the transcriptome and genome (see Methods). (B) An example utORF. The full sequence of utORF 633.1 is shown. The peptide supporting the inference of this utORF is bolded and colored red. (C) Distribution of lengths of utORFs. (D) Distribution of amino acids in utORFs (blue) and in the reference D. melanogaster proteome (orange). Standard single-letter abbreviations for amino acids are used. (E) Genomic locations of utORFs. Since a utORF can overlap multiple items, e.g., an ORF that overlaps with an annotated intron, exon, and another gene antisense to the first, categories are not exclusive. (F) Left: secondary structure composition of utORFs. Approximately half of utORFs have a coiled-coil secondary structure, with the remainder a mixture of beta sheets and alpha helices. Right: predicted structural disorder of utORFs. (G) Percent GC content of utORFs and GC content of the X and autosomes of the D. melanogaster genome (red line).
-
Figure 1—source data 1
All unannotated translated open reading frames (utORFs) sequences.
- https://cdn.elifesciences.org/articles/78772/elife-78772-fig1-data1-v2.csv
-
Figure 1—source data 2
Unannotated translated open reading frame (utORF) supporting peptides.
- https://cdn.elifesciences.org/articles/78772/elife-78772-fig1-data2-v2.csv
-
Figure 1—source data 3
Unannotated translated open reading frame (utORF) locations.
- https://cdn.elifesciences.org/articles/78772/elife-78772-fig1-data3-v2.txt
Figure 2
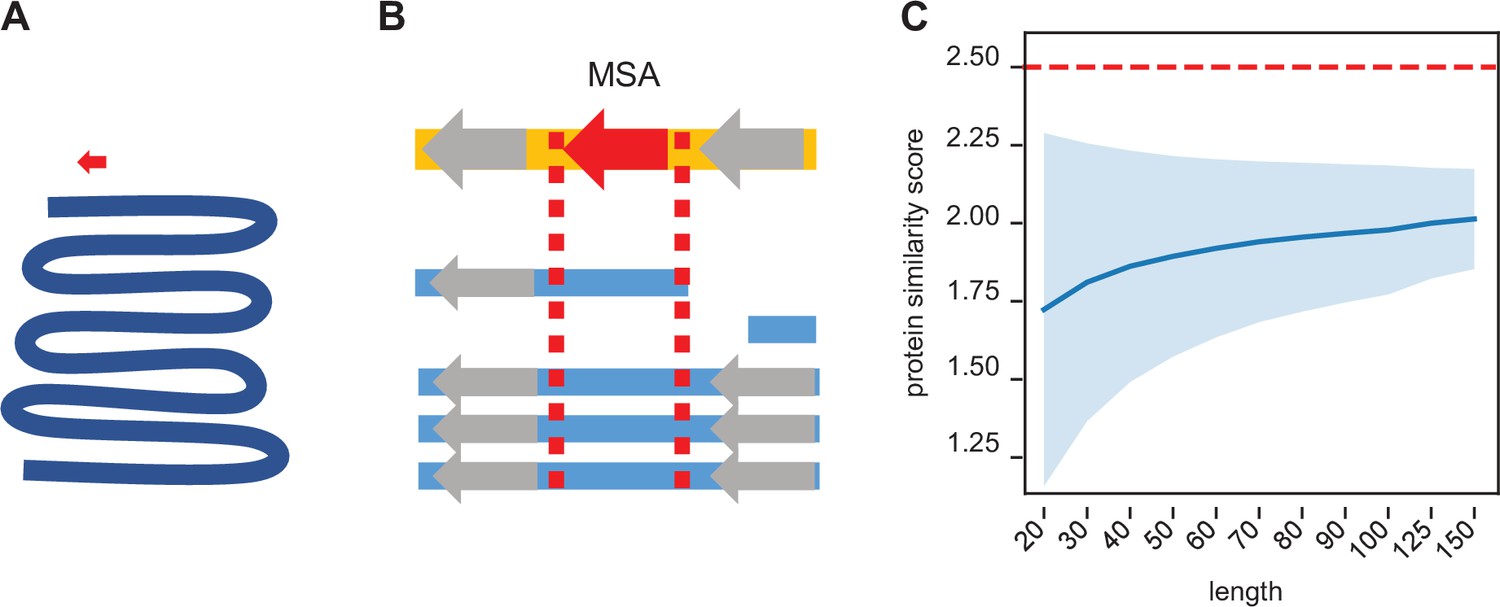
Synteny-based orthology detection and protein sequence similarity quantification.
(A) When performing a simple homology search for a locus of interest (red arrow) across a given genome (blue line), the search space is orders of magnitude larger, requiring heuristic shortcuts to reduce the computational complexity. (B) Using a multiple sequence alignment, we can simply find the block that contains the locus of interest and use that to evaluate potential orthologs in other genomes. The search space is approximately a similar size as that of the original locus, so an optimal search is computationally feasible. Syntenic information (i.e. flanking genes, gray arrows) is encoded within the multiple sequence alignment. (C) We calculated the pairwise protein similarity score (see Methods) across 10,000 pairs of randomly generated sequences of lengths 20–150 with amino acid frequencies matching that of the annotated D. melanogaster proteome. The mean score (blue line) and two SDs (shading) are shown. Our significance threshold of 2.5 lies beyond two SDs from expectation.
Figure 3 with 1 supplement
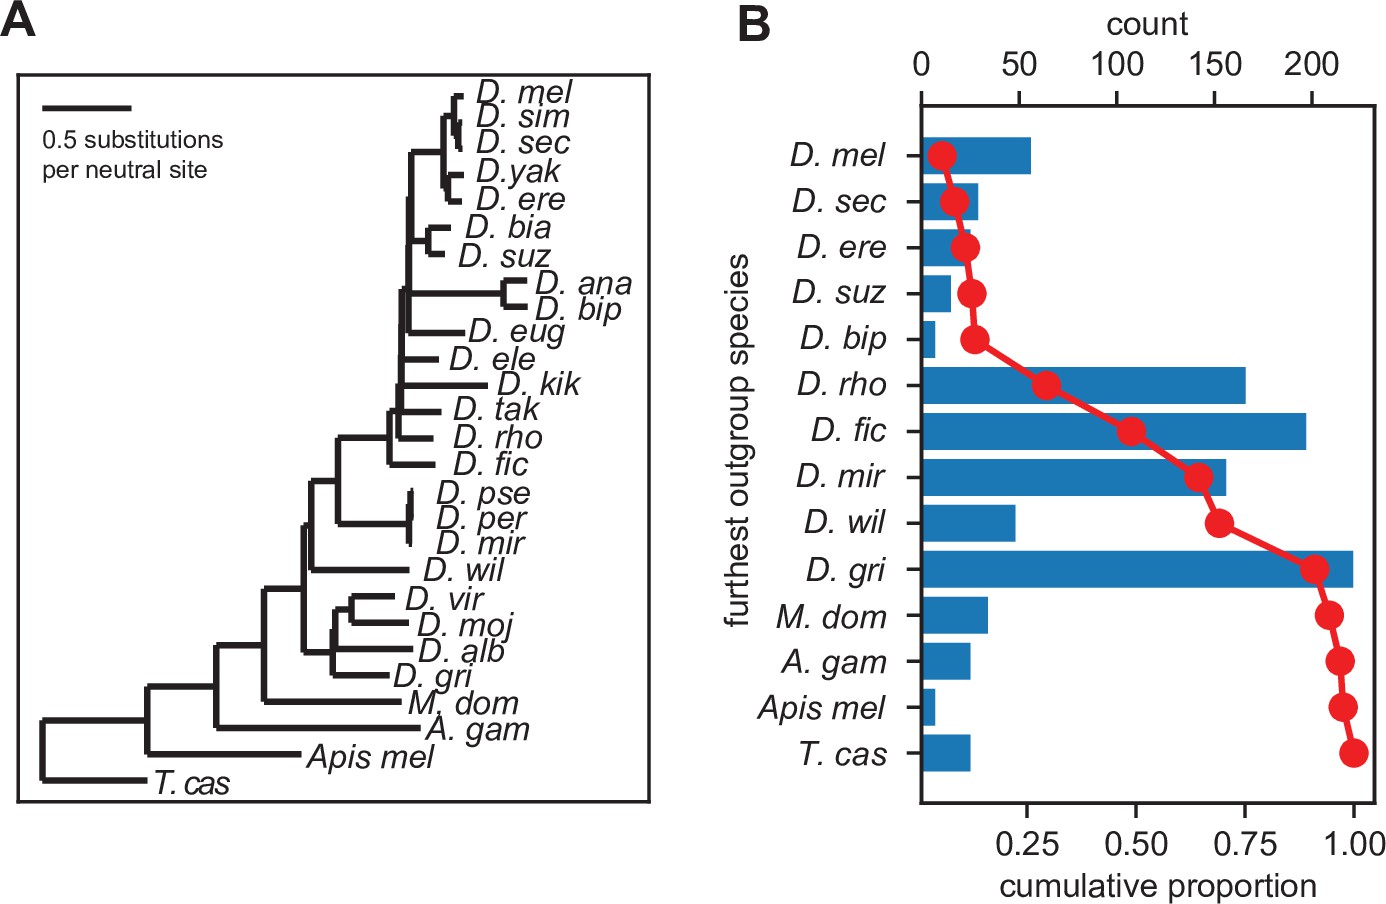
Inferred gene ages of the unannotated translated open reading frames (utORFs).
(A) The reference phylogenetic tree used for these analyses (UCSC 27-way insect alignment). Abbreviations are as follows: D. mel: Drosophila melanogaster, D. sim: D. simulans, D. sec: D. sechellia, D. yak: D. yakuba, D. ere: D. erecta, D. bia: D. biarmipes, D. suz: D. suzukii, D. ana: D. ananassae, D. bip: D. bipectinata, D. eug: D. eugracilis, D. ele: D. elegans, D. kik: D. kikkawai, D. tak: D. takahashii, D. rho: D. rhopaloa, D. fic: D. ficusphila, D. pse: D. pseudoobscura, D. per: D. persimilis, D. mir: D. miranda, D. wil: D. willistoni, D. vir: D. virilis, D. moj: D. mojavensis, D. alb: D. albomicans, D. gri: D. grimshawi, M. dom: Musca domestica, A. gam: Anopheles gambiae, Apis mel: Apis mellifera, and T. cas: Tribolium castaneum. (B) The most distantly related species in which a significant ortholog of a utORF exists varies. The red line illustrates the cumulative distribution of loci. For convenience, sister species are grouped together under one species (e.g. D. virilis with D. grimshawi; D. eugracilis, D. elegans, D. kikkawai, and D. takahashii with D. rhopaloa; etc.). Abbreviations as in A.
Figure 3—figure supplement 1
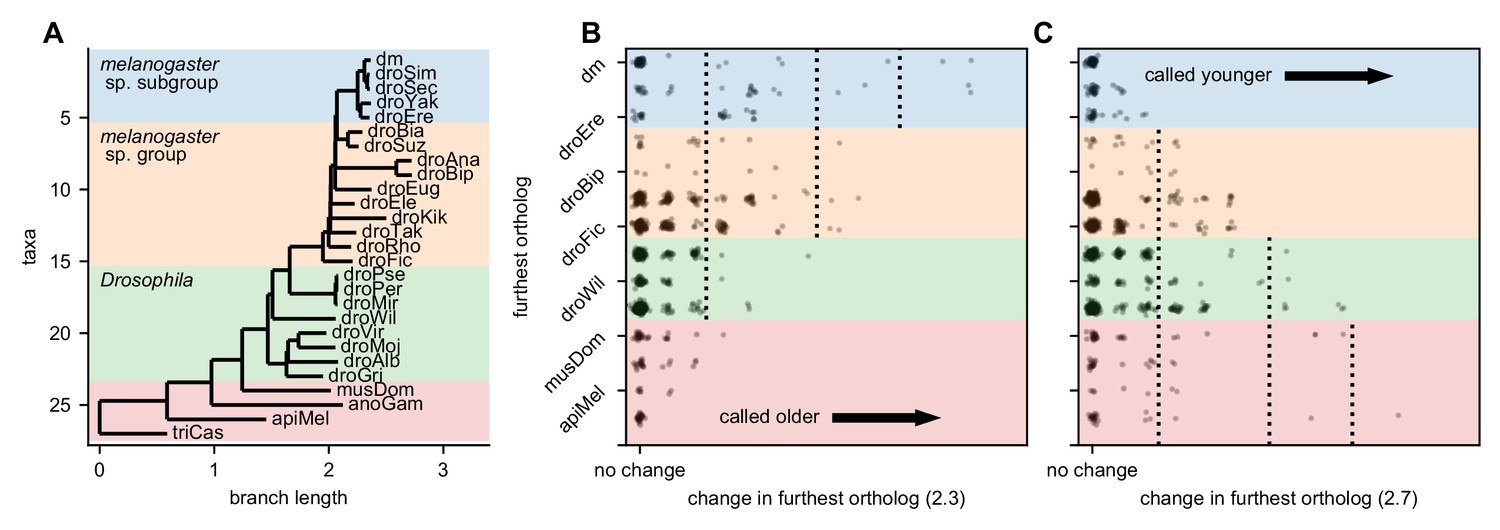
Robustness of gene age inferences with respect to significance threshold.
(A) Figure 3A, but also showing the melanogaster species subgroup, species group, and Drosophila taxa. (B) Change in furthest significant ortholog (using a significance threshold of 2.3 instead of 2.5). Coloring corresponds to panel A. Lowering the threshold causes more orthologs of unannotated translated open reading frames (utORFs) to be called as significant, increasing the inferred gene age. (C) As in panel B, but with a significance threshold of 2.7 instead of 2.5. Increasing the threshold causes fewer orthologs of utORFs to be called as significant, reducing the inferred gene age.
Figure 4 with 3 supplements
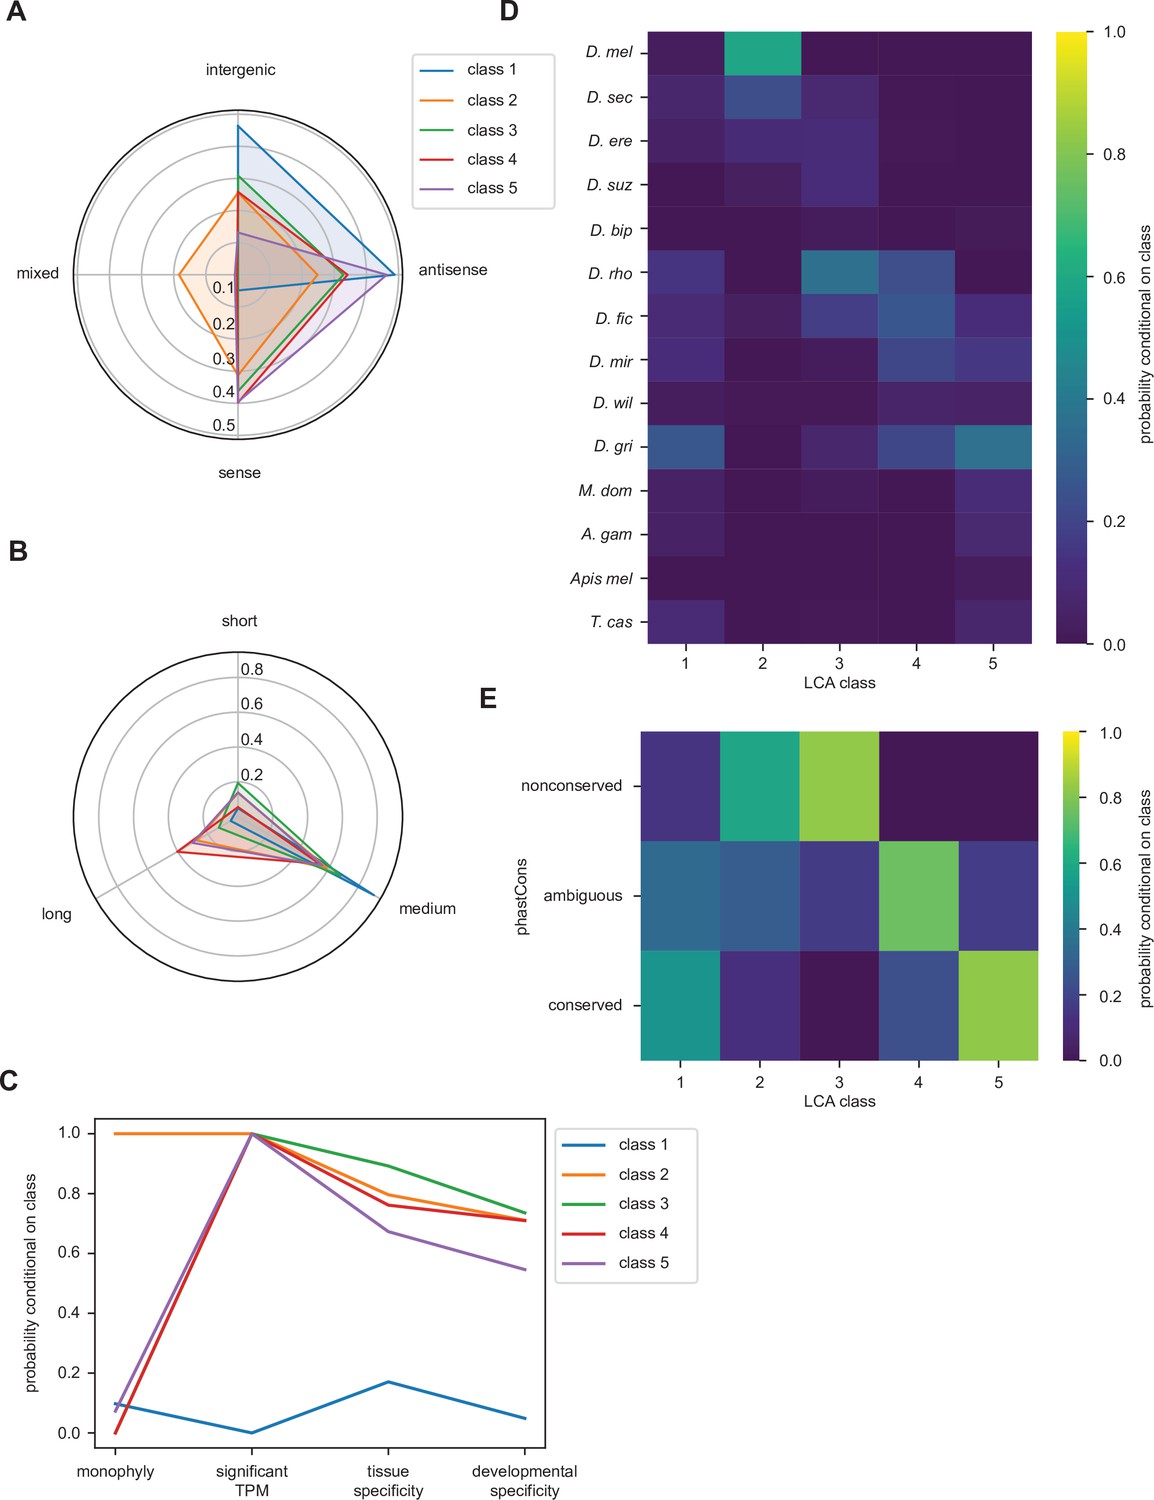
Latent class analysis of the unannotated translated open reading frames (utORFs) reveals differences between classes.
(A) Class 1 is notably distinct for strong bias toward intergenic and antisense locations at the expense of sense locations. Class 2 is notable for being relatively unbiased and for being the only class with appreciable members in a combination of locations. Class 5 is strongly skewed toward antisense and sense locations. (B) Class 1 is almost exclusively of intermediate length. Class 4 has the greatest length bias, followed by class 2. Short: fewer than 20 residues; medium: from 20 to 49 residues; long: 50 or more residues. (C) Class 1 is notably distinct from the others for minimal transcription. Low tissue and developmental specificity may be an effect of minimal transcription. Class 2 is remarkable for being entirely monophyletic. Class 5 has slightly lower tissue and developmental specificities than classes 2–4. significant TPM: maximum per-sample transcripts per million (TPM) > 0.1; tissue specificity: tissue specificity > 0.8; developmental specificity: developmental specificity > 0.8. (D) Class 2 is by far the youngest. Class 3 tends to be of an intermediate age, with inferred emergence at around the latent class analysis (LCA) of the melanogaster subgroup (D. rho). In contrast, class 4 emergence is distributed throughout the LCA of the melanogaster subgroup and the Drosophila genus. (E) Class 2 is notable for overall low conservation. Class 3 is remarkably even less conserved. Classes 4 and 5 are distinguished through differences in intermediate vs. significant conservation. nonconserved: phastCons score < 0.2; ambiguous: phastCons score ≥ 0.2 and < 0.8; conserved: phastCons score ≥ 0.8.
-
Figure 4—source data 1
Unannotated translated open reading frame (utORF) inferred latent class analysis (LCA) classes.
- https://cdn.elifesciences.org/articles/78772/elife-78772-fig4-data1-v2.csv
Figure 4—figure supplement 1

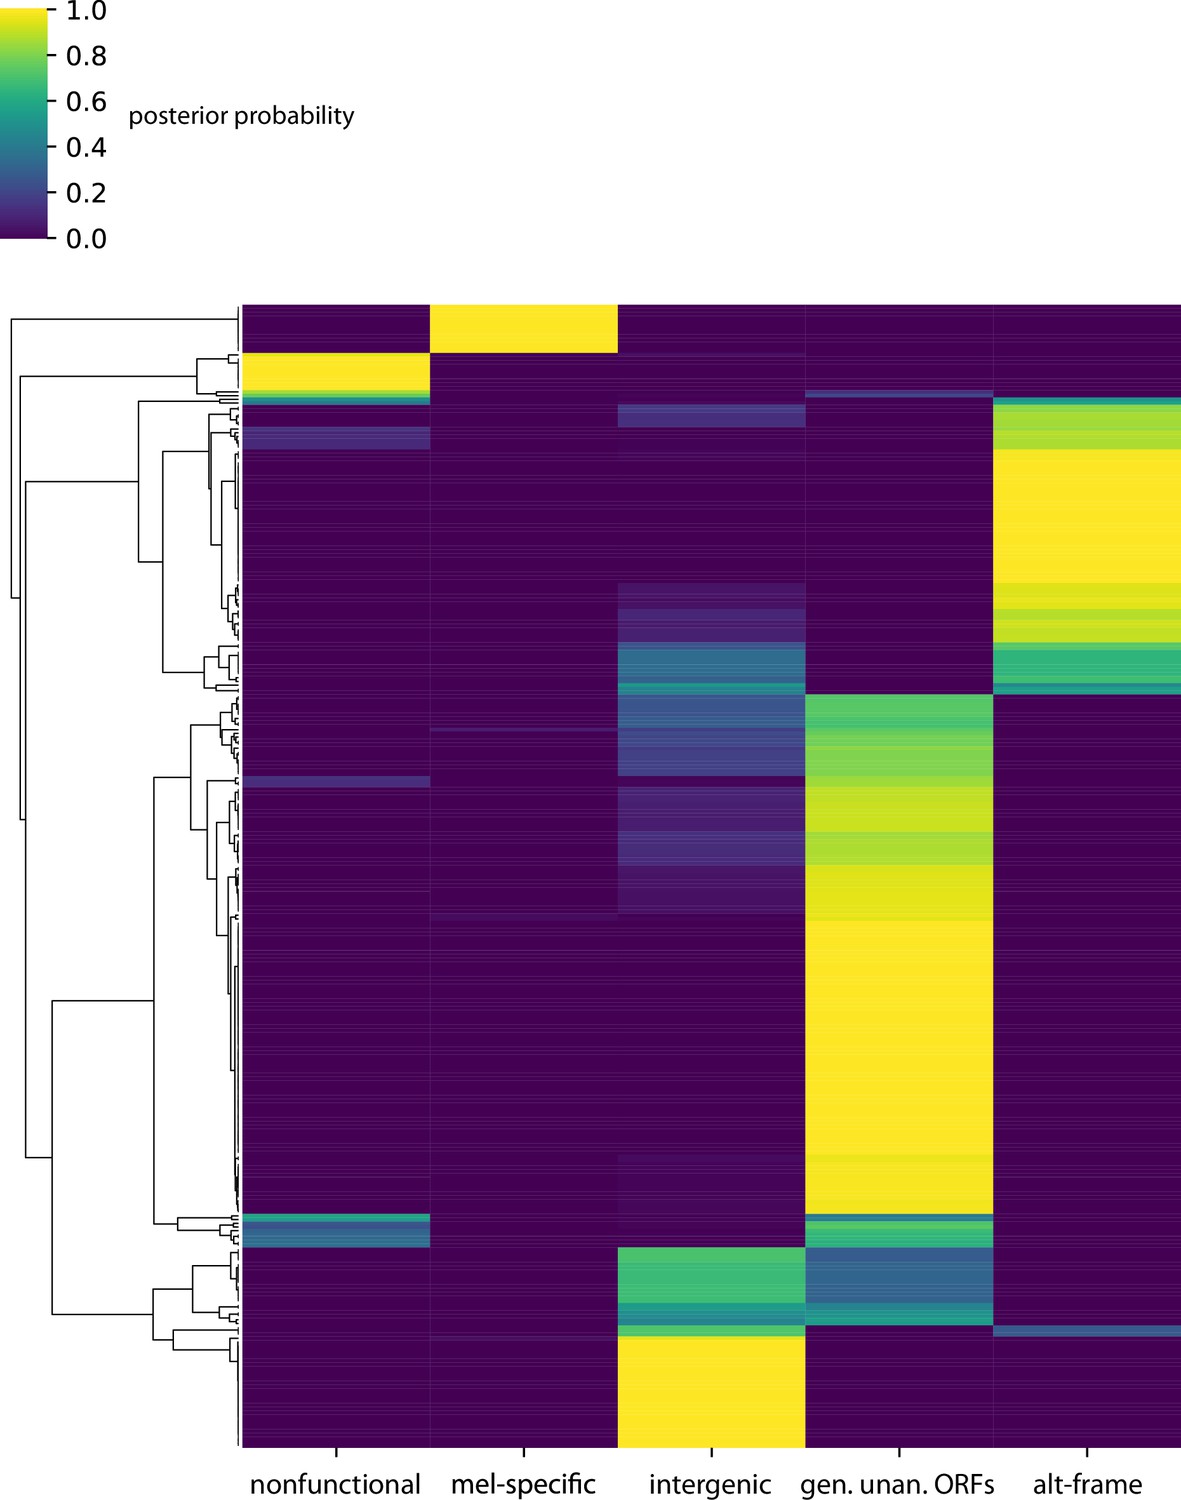
Posterior probabilities per unannotated translated open reading frame (utORF) of class membership inferred from latent class analysis for all utORFs.
Figure 4—figure supplement 2
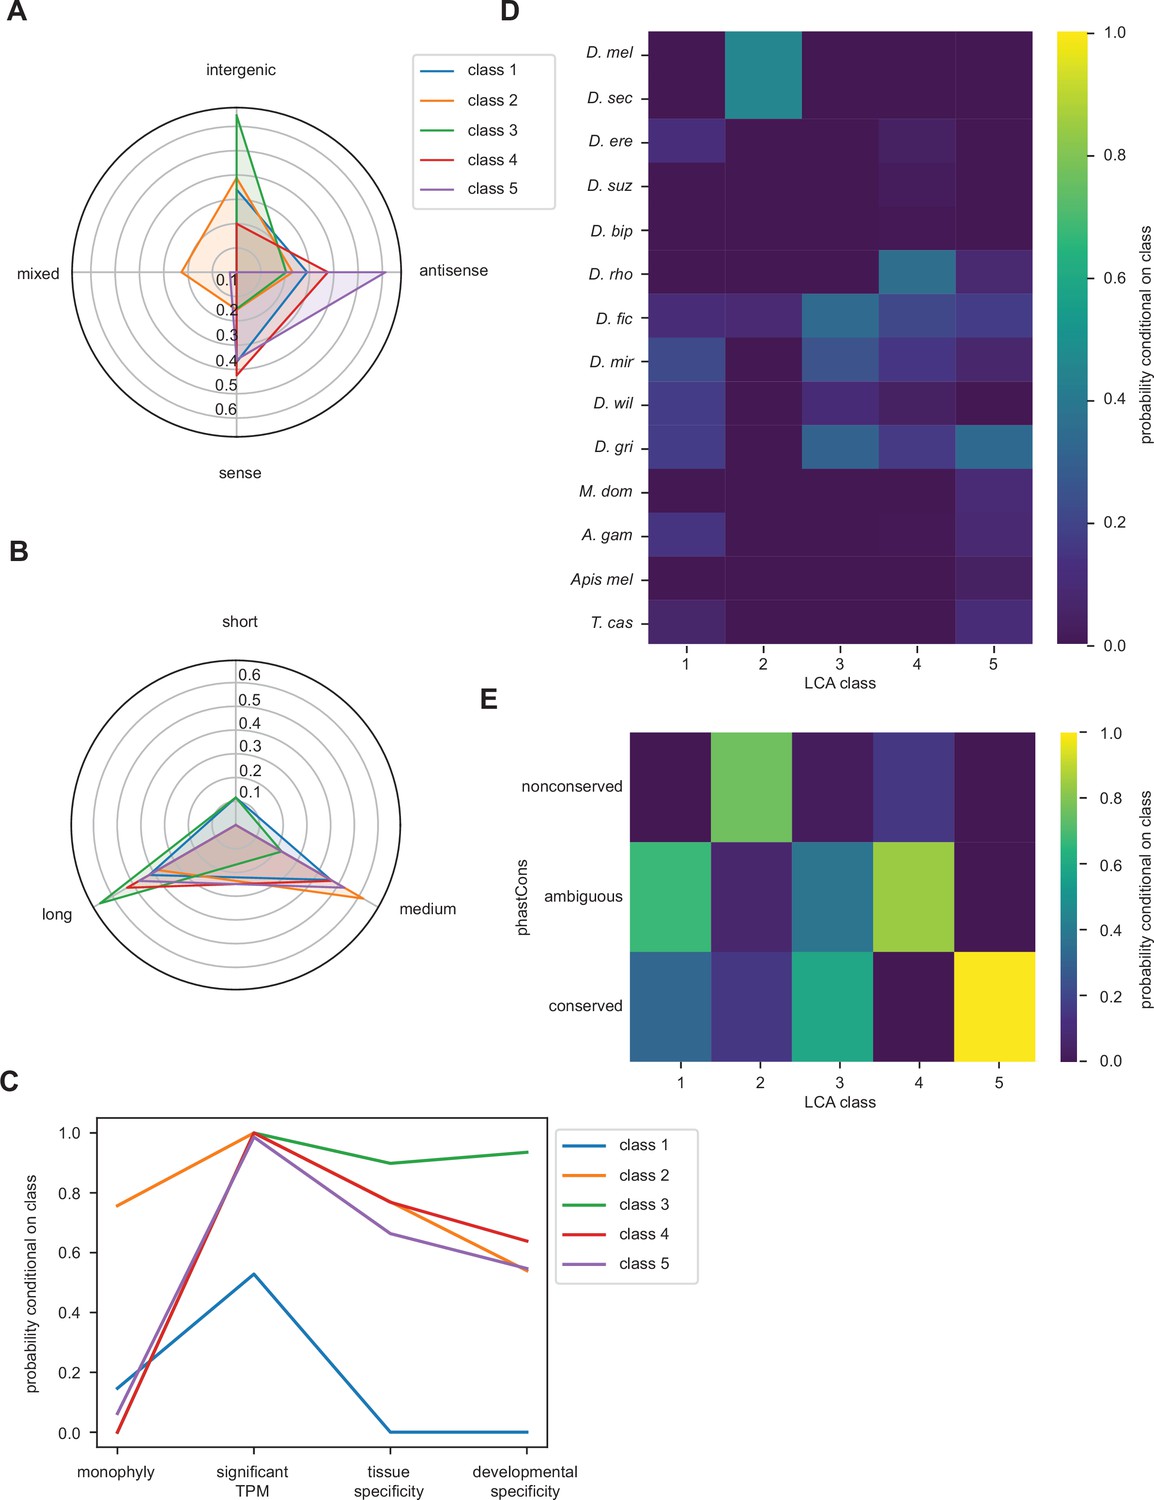
Latent class analysis of unannotated translated open reading frames (utORFs) with canonical start sites reveals differences between classes.
(A–E) Same as Figure 4 but examining utORFs with canonical start sites.
Figure 4—figure supplement 3
Posterior probabilities per unannotated translated open reading frame (utORF) of class membership inferred from latent class analysis for utORFs with canonical start sites.
Figure 5 with 2 supplements
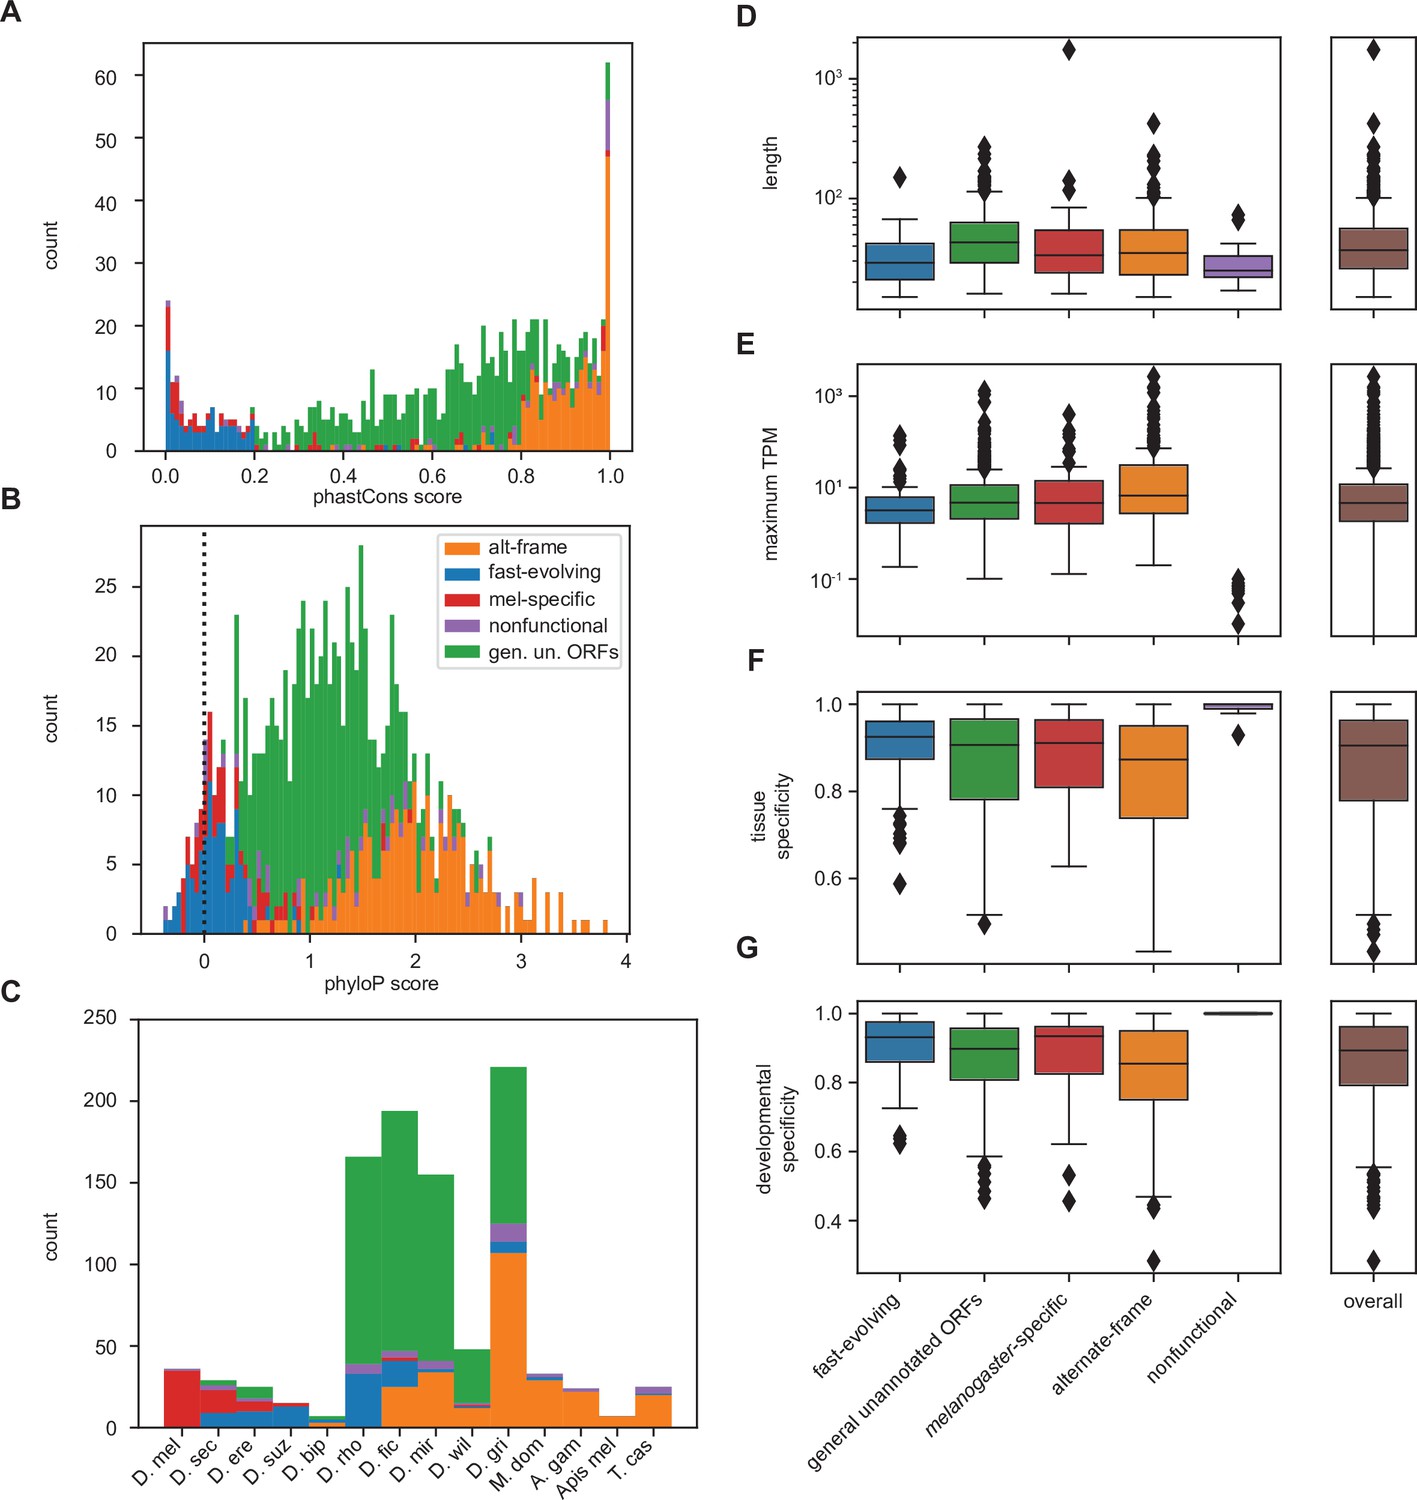
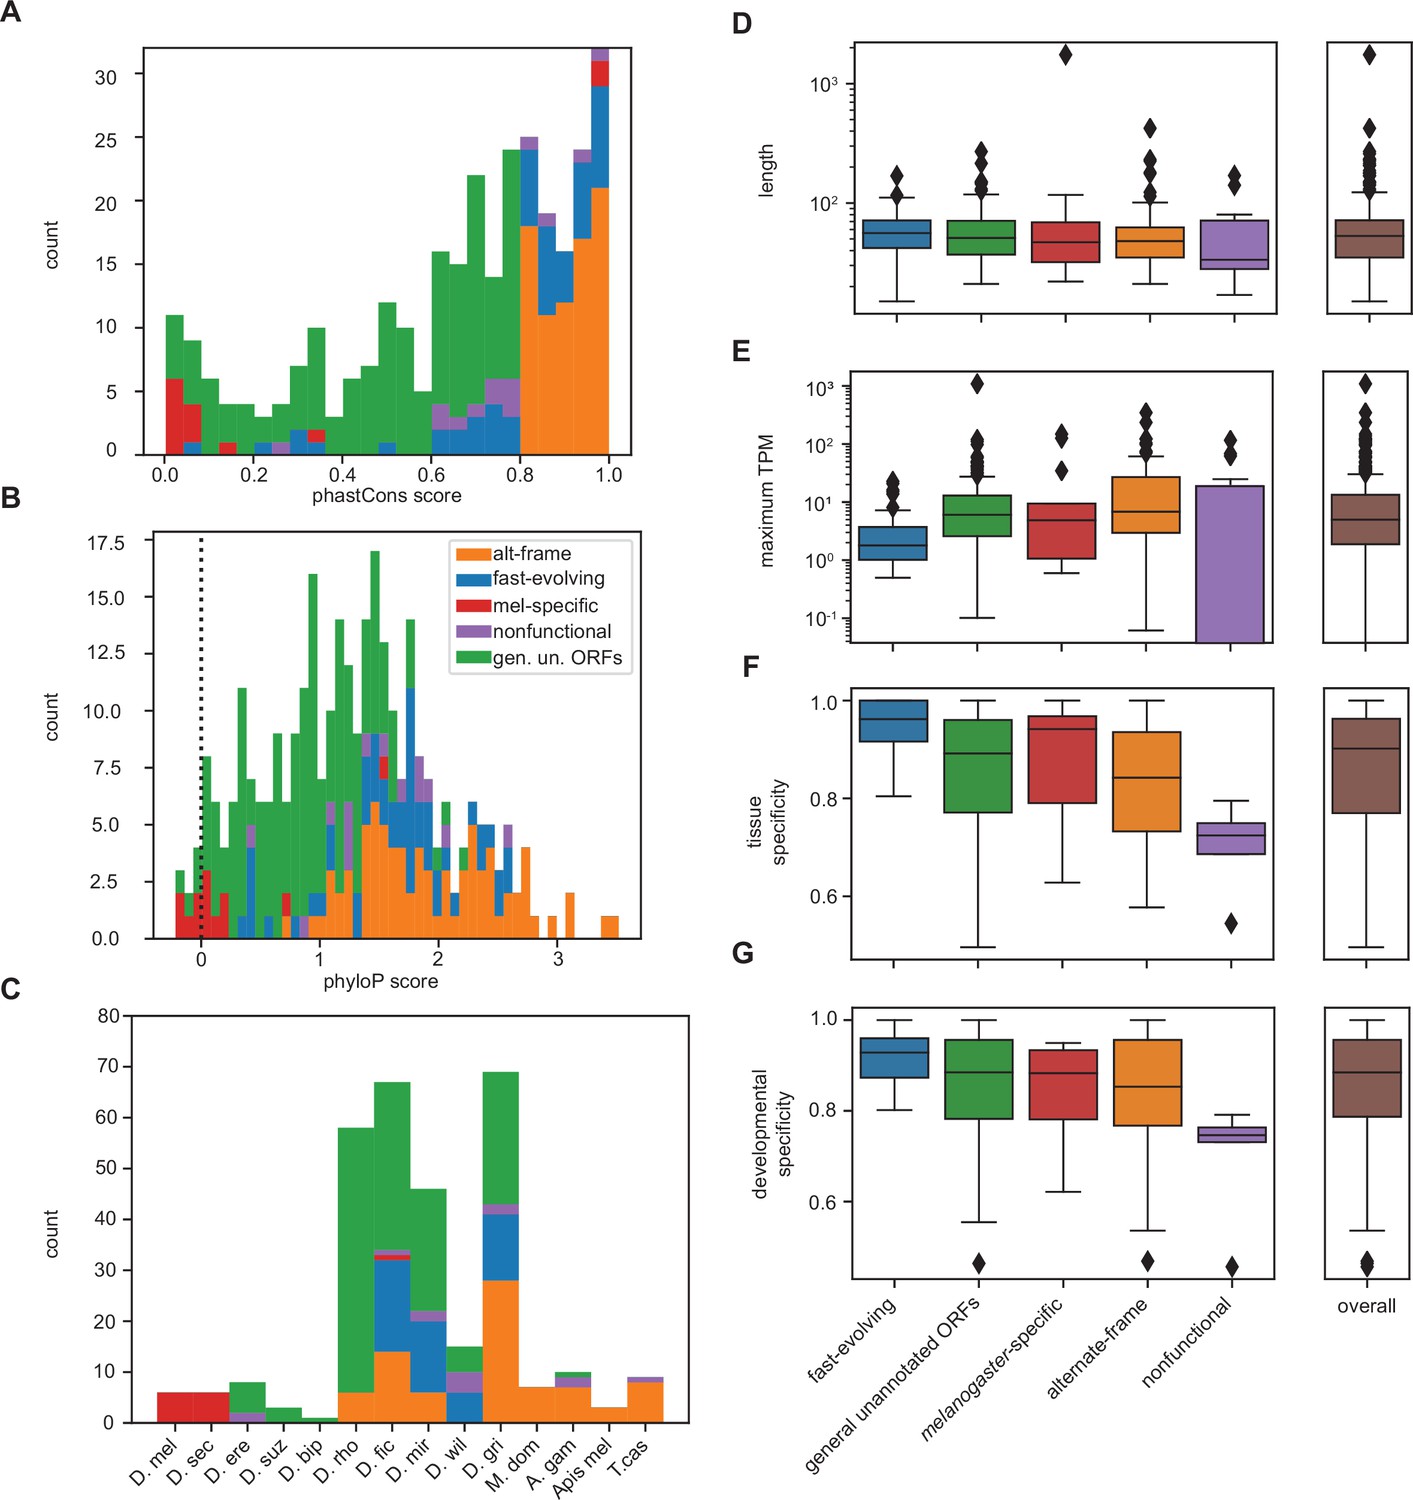
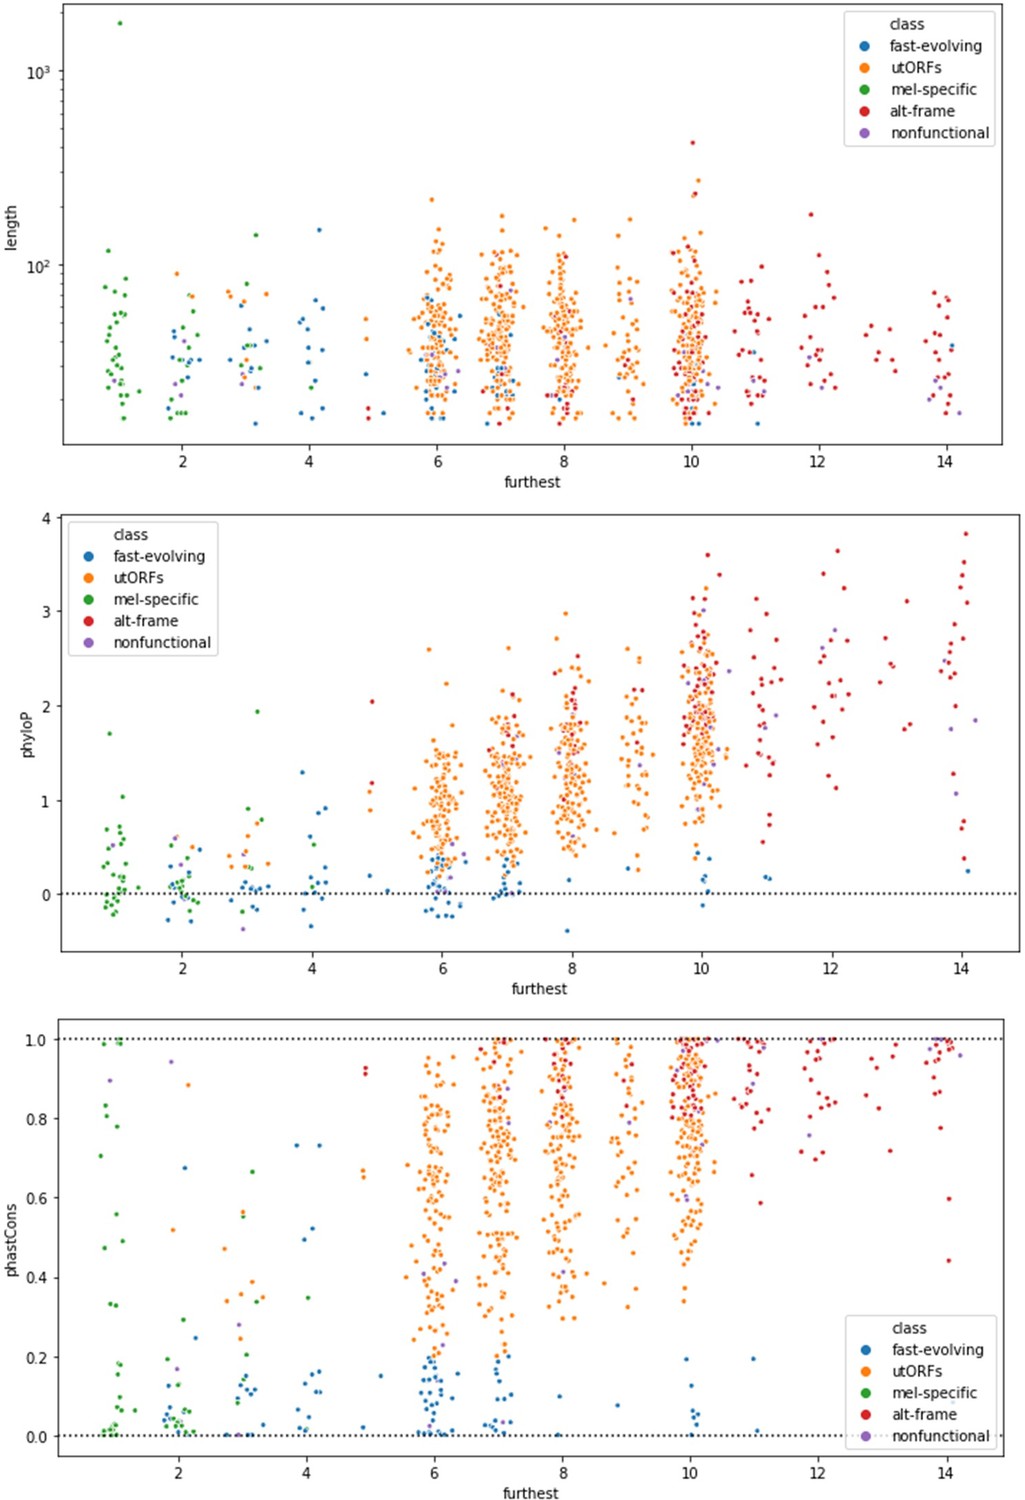
Differences between inferred classes recapitulate expected trends in age and conservation and reveal surprising trends in lengths and expression.
(A) As expected, phastCons conservation scores vary by class. Scores near 0 indicate low conservation, while scores near 1 indicate high conservation. Note that fast-evolving and melanogaster-specific loci have dramatically lower conservation, whereas alternate-frame loci are very well conserved. (B) Despite not being included as a variable in latent class analysis (LCA), phyloP conservation scores also vary by class. Scores below 0 indicate potential fast evolution (acceleration), while scores above 0 indicate conservation. Note that the lowest scores predominantly occur in fast-evolving and melanogaster-specific loci and that alternate-frame loci remain the best conserved. (C) Distribution of phylostratigraphically inferred gene ages by inferred latent class. (D) Class variations in length are generally minimal, with the exception of general unannotated open reading frames (ORFs) being slightly longer than average, and fast-evolving and nonfunctional loci being shorter than average. (E) Maximum observed transcription across all FlyAtlas2 and modENCODE samples varies by class. (F) Tissue specificity (tau) calculated from FlyAtlas2 data shows that nonfunctional and fast-evolving loci are the most specific, with alternate-frame loci the least. (G) Developmental specificity (tau) calculated from modENCODE data similarly shows that nonfunctional and fast-evolving loci are the most specific, with alternate-frame loci the least.
Figure 5—figure supplement 1
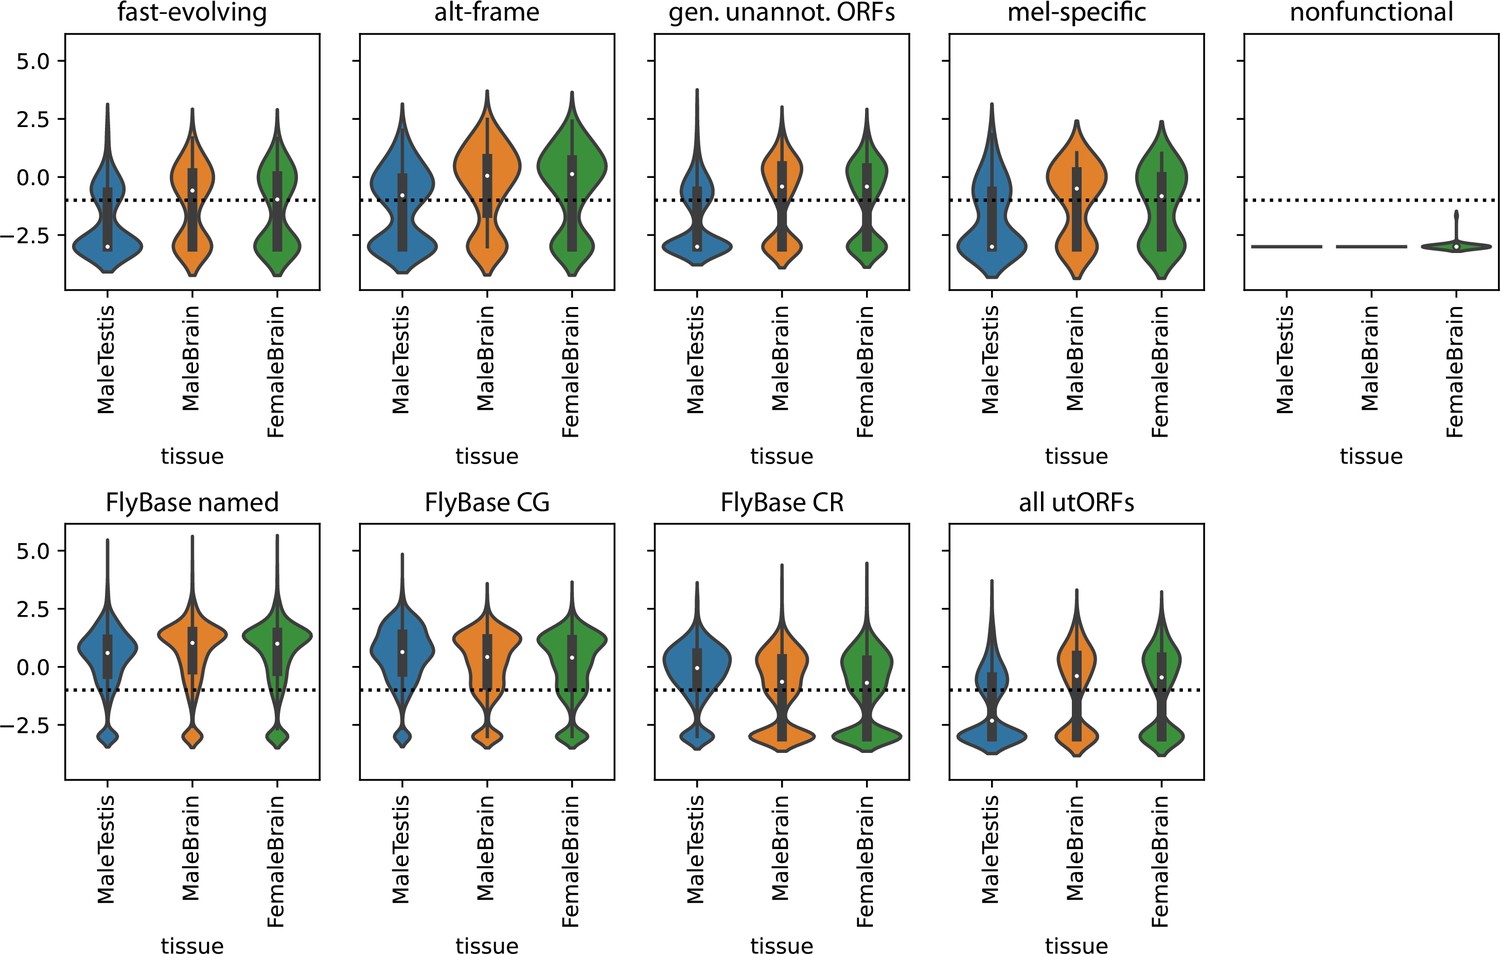
Transcription of unannotated translated open reading frames (utORFs) in selected tissues.
Top panel: utORFs, separated by inferred latent class analysis (LCA) class. Mean TPMs across the given tissue in FlyAtlas2 are log10-transformed with a pseudocount of 1E-3. Horizontal line marks an expression threshold of TPM 0.1. Bottom panel: as top, but for, in order, annotated FlyBase genes, separated between those with names, those with ‘CG’ identifiers, and those with ‘CR’ identifiers, and all utORFs.
Figure 5—figure supplement 2
Differences between inferred classes for unannotated translated open reading frames (utORFs) with canonical start sites recapitulate expected trends.
(A–G) Same as Figure 5 but examining utORFs with canonical start sites.
Figure 6
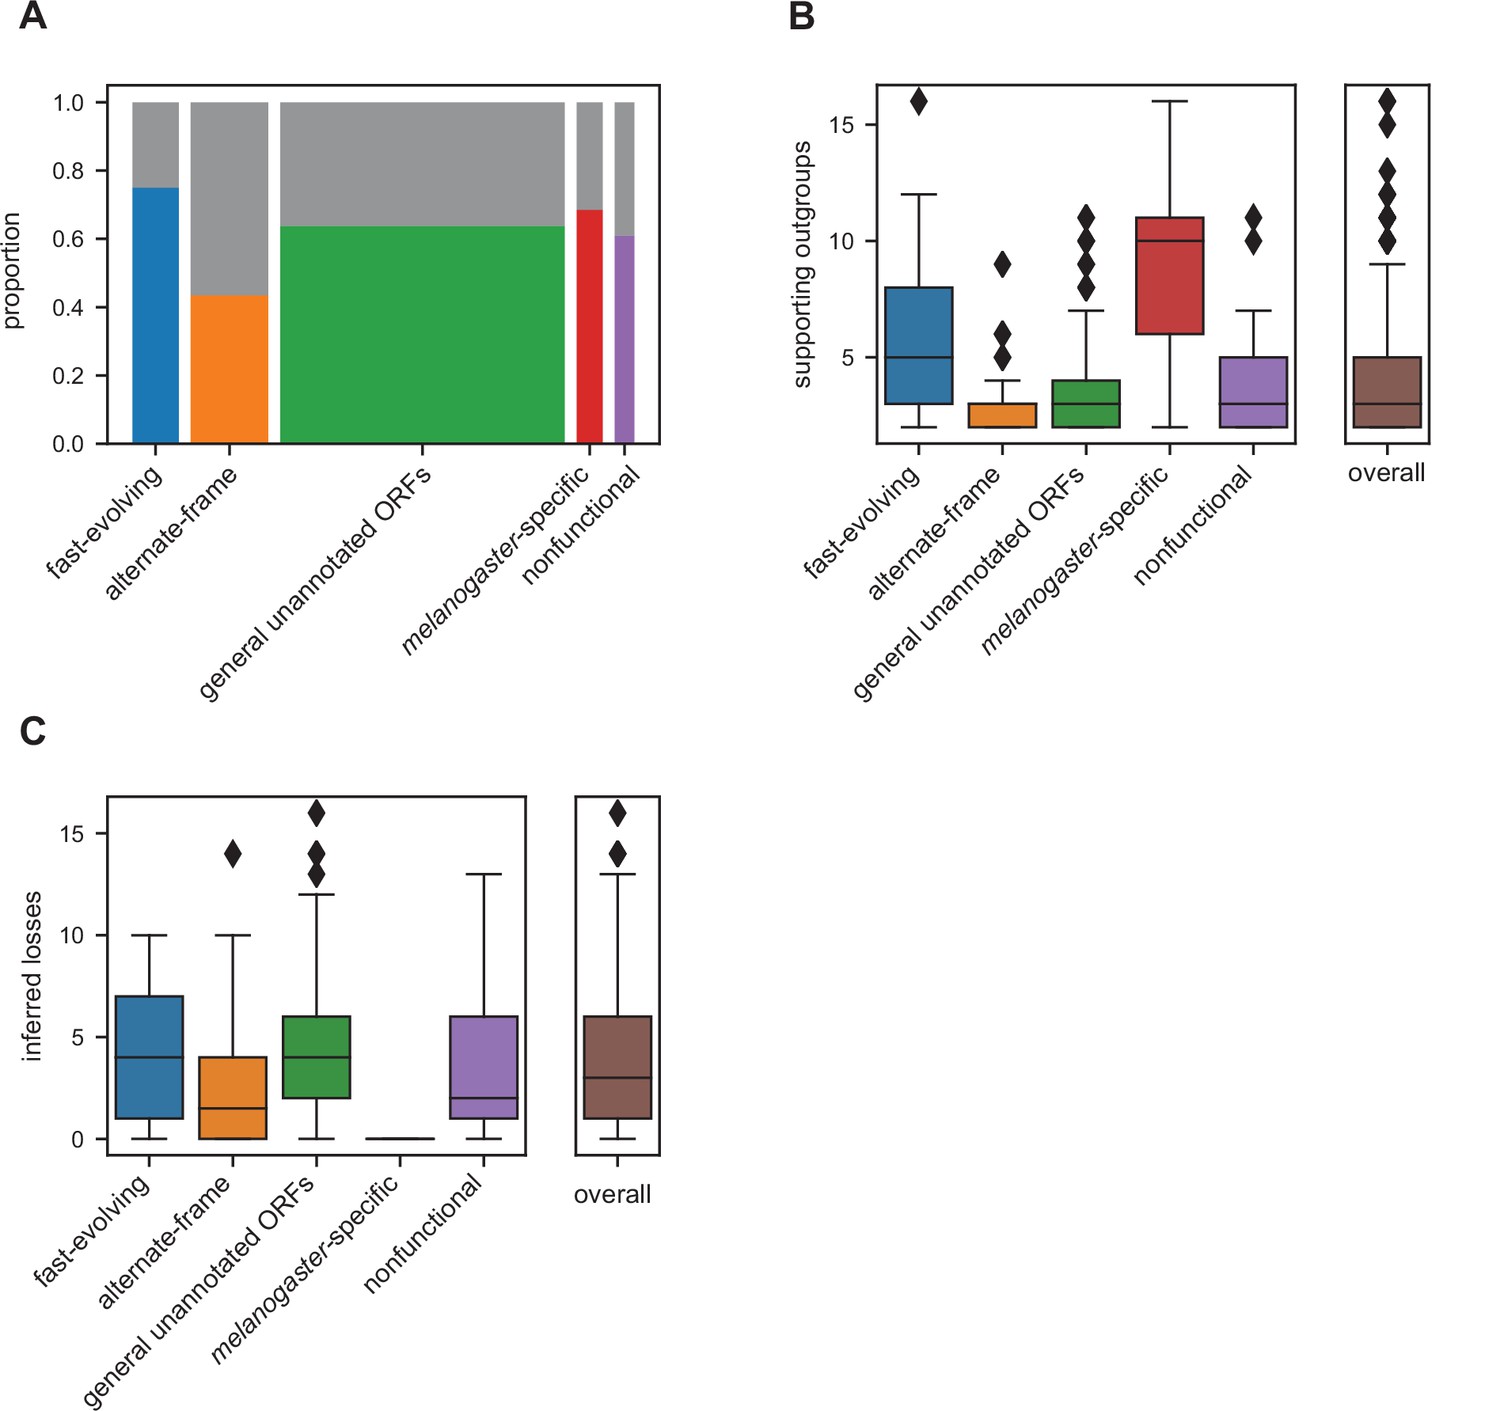
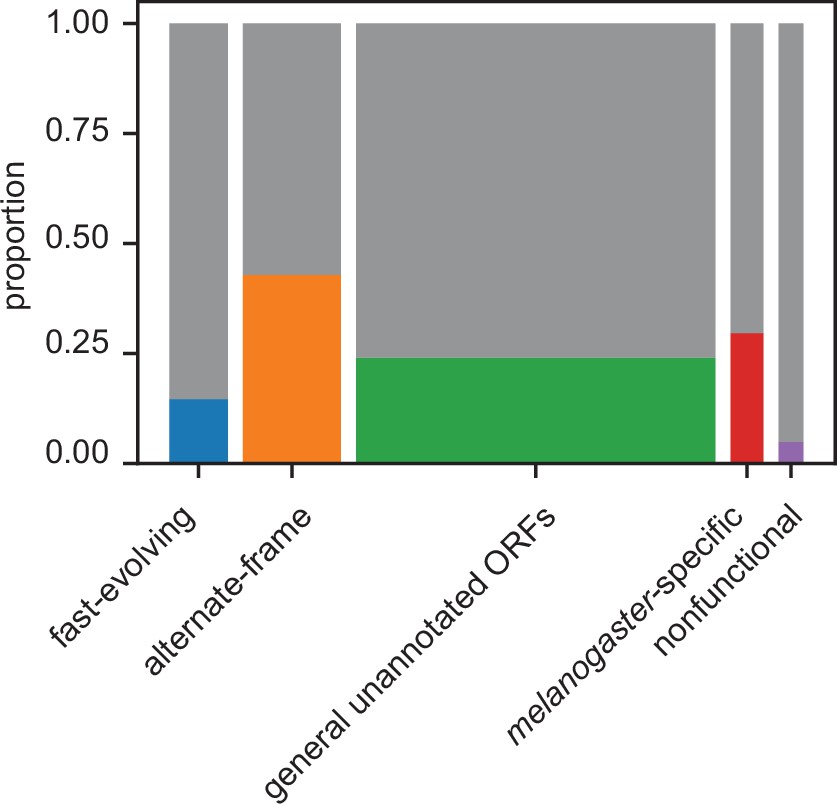
Many unannotated translated open reading frames (utORFs) have evidence consistent with a de novo origin.
(A) Proportion of utORFs by inferred class with genomic conservation consistent with de novo origin. Box widths correlate with size of class (Table 1). (B) Number of supporting outgroups by inferred class for loci with potential de novo origin. (C) Number of losses inferred after potential de novo origin.
Figure 7 with 2 supplements
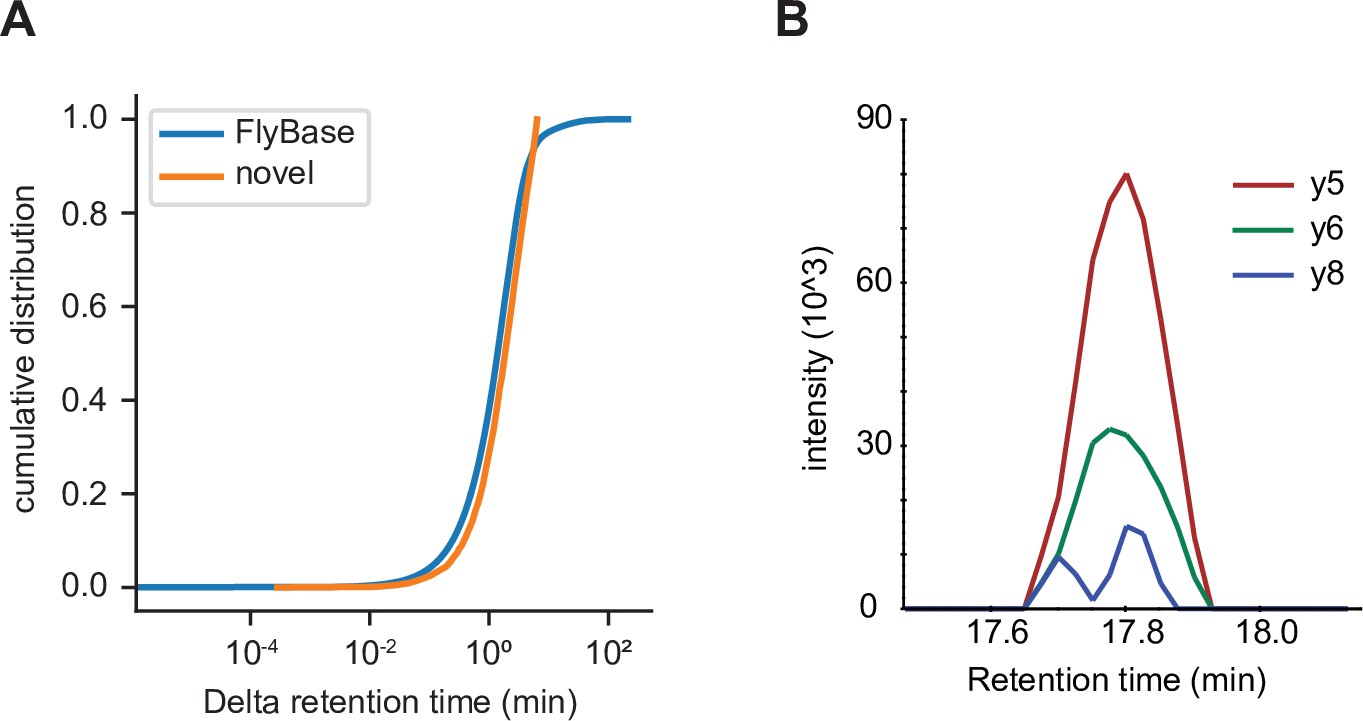
Independent validation of unannotated translated open reading frame (utORF) identification.
(A) Cumulative distribution of differences between observed and predicted retention times for peptide-spectrum matches (PSMs) of peptides supporting annotated FlyBase proteins (orange) and PSMs of peptides supporting utORFs that are no worse than the 95th percentile of annotated FlyBase PSMs (blue). (B) Transitions detected via parallel reaction monitoring (PRM) of the peptide GPGAAISQR from protein extracts of D. melanogaster embryos.
-
Figure 7—source data 1
Mascot search results from embryo mass spectrometry (MS) data.
- https://cdn.elifesciences.org/articles/78772/elife-78772-fig7-data1-v2.xlsx
-
Figure 7—source data 2
Rank of potentially biologically significant targets.
- https://cdn.elifesciences.org/articles/78772/elife-78772-fig7-data2-v2.csv
-
Figure 7—source data 3
Dataset subset mappings.
- https://cdn.elifesciences.org/articles/78772/elife-78772-fig7-data3-v2.xlsx
Figure 7—figure supplement 1

Cumulative distribution of differences between observed and predicted retention times for every peptide-spectrum match of peptides supporting all annotated FlyBase proteins (blue) and all unannotated translated open reading frames (utORFs) (orange).
Figure 7—figure supplement 2
Proportion of unannotated translated open reading frames (utORFs) by inferred class with supporting evidence from ribosome profiling.
Box widths correlate with size of class (Table 1).
Author response image 1
Tables
Table 1
Latent class analysis of all unannotated translated open reading frames (ORFs).
| Class | Interpretation | Estimated percent | Number |
|---|---|---|---|
| 1 | Putatively nonfunctional loci | 4.35% | 41 |
| 2 | melanogaster-specific ORFs | 5.71% | 54 |
| 3 | Fast-evolving ORFs | 12.03% | 96 |
| 4 | General unannotated ORFs | 57.61% | 591 |
| 5 | Alternative-frame ORFs | 20.30% | 161 |
Additional files
-
MDAR checklist
- https://cdn.elifesciences.org/articles/78772/elife-78772-mdarchecklist1-v2.docx
-
Supplementary file 1
Supplementary tables 1A–1E.
- https://cdn.elifesciences.org/articles/78772/elife-78772-supp1-v2.docx
Download links
A two-part list of links to download the article, or parts of the article, in various formats.
Downloads (link to download the article as PDF)
Open citations (links to open the citations from this article in various online reference manager services)
Cite this article (links to download the citations from this article in formats compatible with various reference manager tools)
Protein evidence of unannotated ORFs in Drosophila reveals diversity in the evolution and properties of young proteins
eLife 11:e78772.
https://doi.org/10.7554/eLife.78772


