Visualizing synaptic dopamine efflux with a 2D composite nanofilm
- Janelia Research Campus, Howard Hughes Medical Institute, United States
- Center for Advanced Imaging, The University of Queensland, Australia
Figures
Figure 1 with 3 supplements
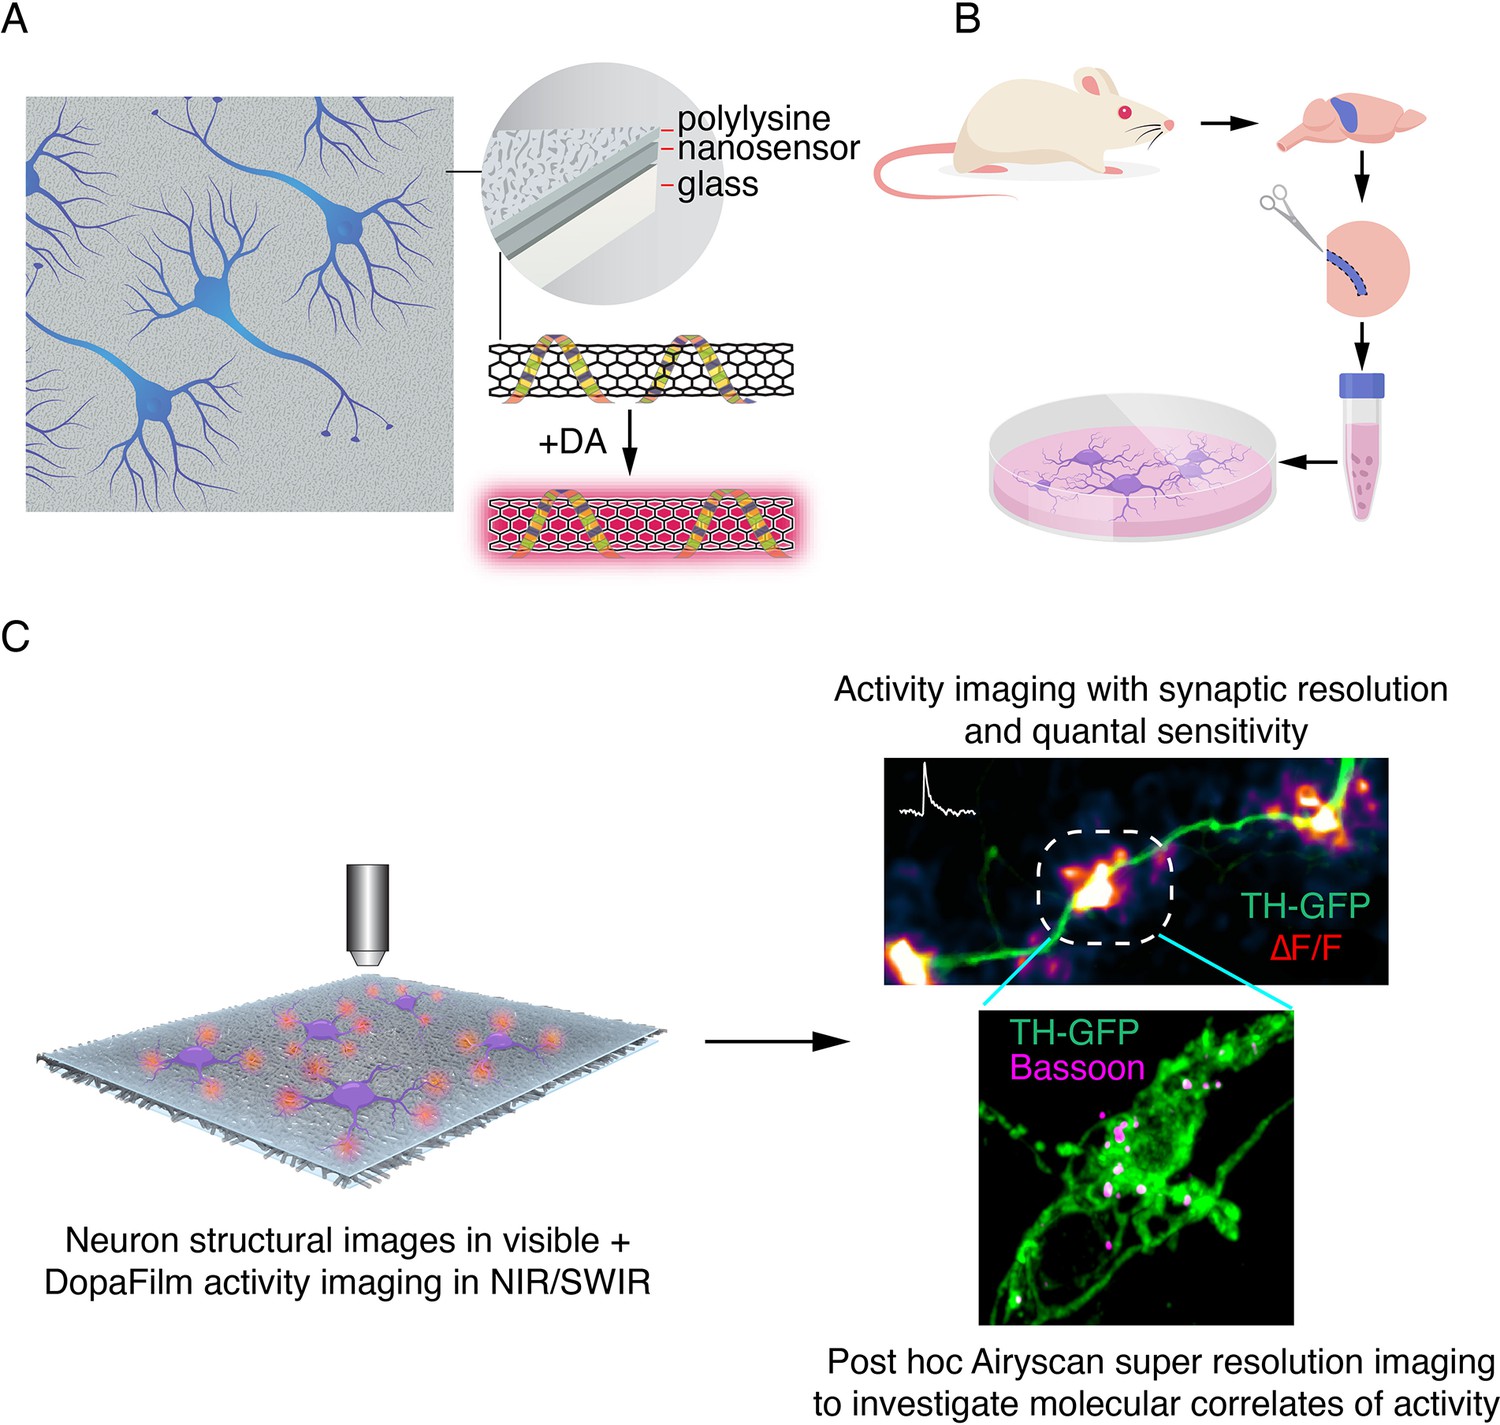
Schematic of DopaFilm imaging protocol.
(A) Schematic of DopaFilm. (B) Workflow for preparing dopamine neuron primary cultures from the rat midbrain regions highlighted in blue. Neurons are grown on dishes with an engineered, chemi-sensitive, and fluorescent surface (DopaFilm) between polylysine and glass surfaces. (C) Imaging DopaFilm fluorescence activity in cultured dopamine neurons. Immunocytochemistry and Airyscan super-resolution imaging are carried out following DopaFilm activity imaging.
Figure 1—figure supplement 1
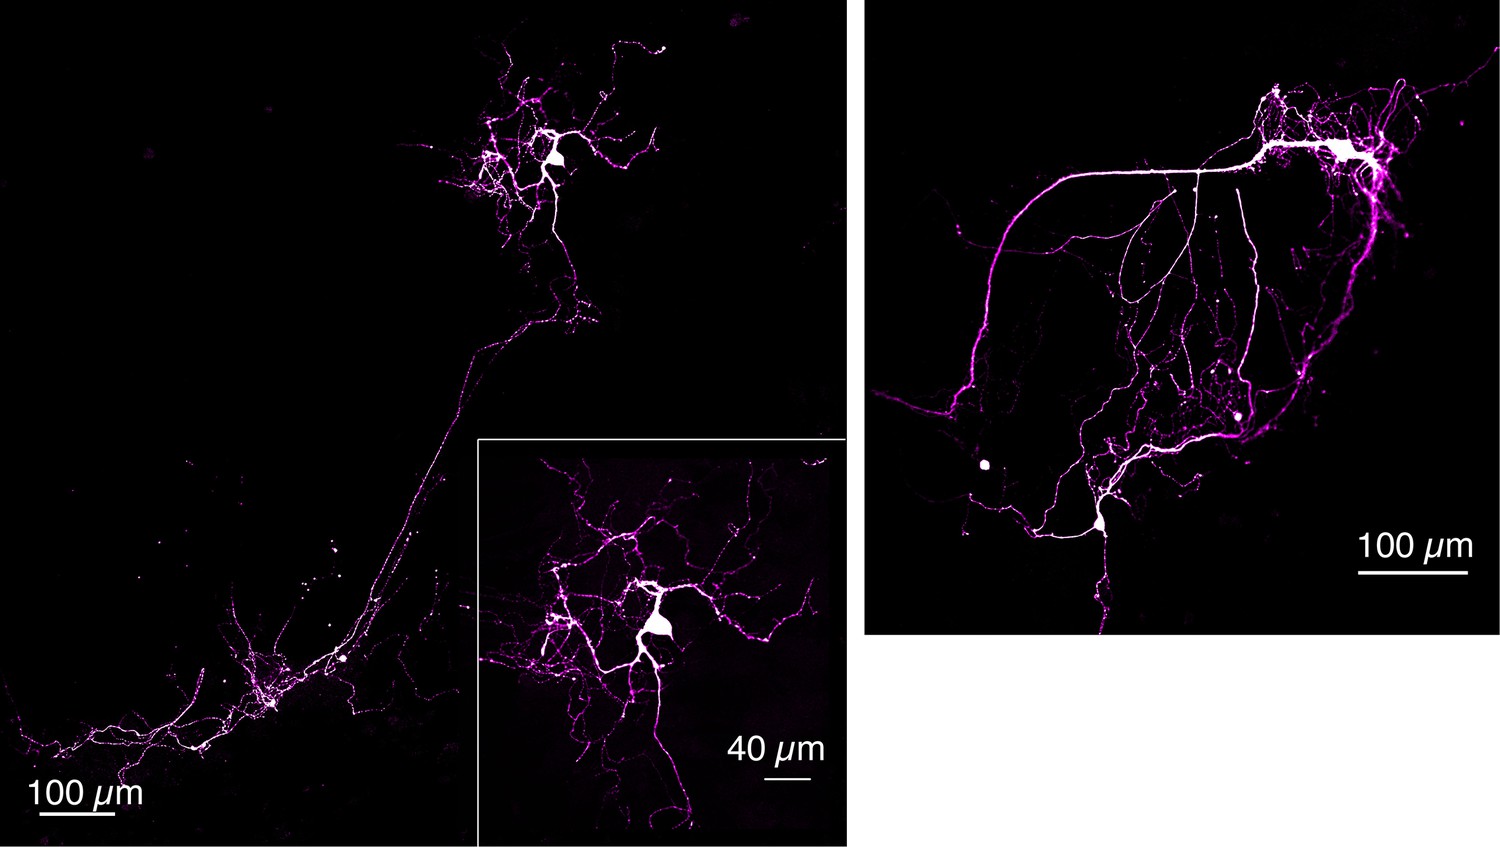
Tyrosine hydroxylase (TH) immunofluorescence of dopamine neurons grown on DopaFilm.
Examples of TH+ dopamine neurons grown in co-culture with cortical neurons.
Figure 1—figure supplement 2

Electrophysiology of hippocampal neurons cultured on a poly-D-lysine-only substrate (PDL) and DopaFilm.
(A) Example recordings of action potentials to determine rheobase from a 49 pF neuron on PDL and 66 pF neuron on DopaFilm. (B) Repetitive action potential firing from a 1 s, 200 pA current injection. Scatter plots of (C) resting membrane potential (p=0.89), (D) input resistance (p=0.35), (E) capacitance (p=0.19), (F) rheobase (p=0.78), (G) normalized rheobase (p=0.65), (H) voltage threshold (p=0.12), (I) firing rate (p=0.48), (J) action potential amplitude (p=0.12), (K) action potential half width (p=0.09), and (L) action potential half amplitude (p=0.07) from hippocampal neurons on PDL (n=17) and DopaFilm (n=14). Data are presented as mean ± SD. Statistical comparisons are via unpaired Mann-Whitney U test with the corresponding p-values noted on each plot. n.s. = not significant.
Figure 1—figure supplement 3
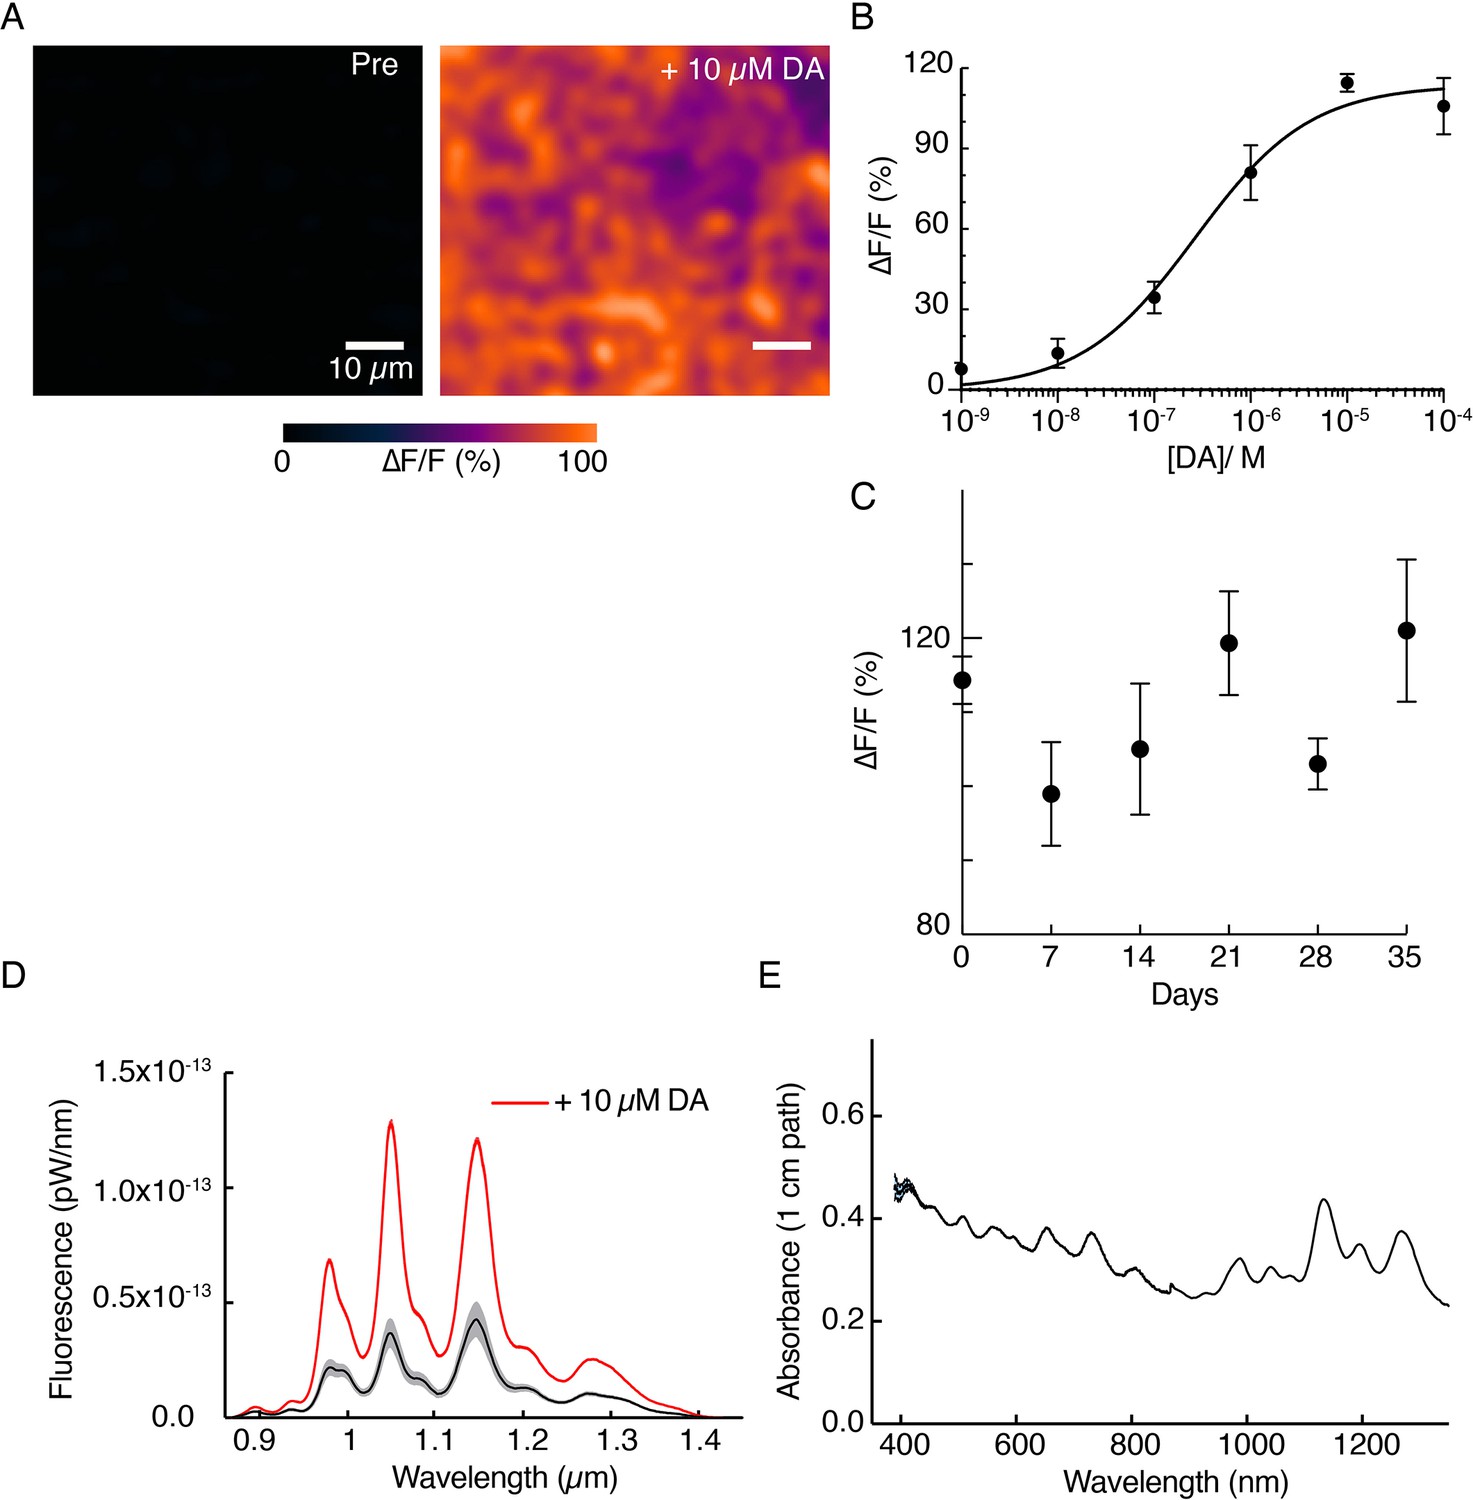
DopaFilm and solution-phase nanosensor characterization.
(A) A 10 µM of exogenous dopamine (DA) wash on DopaFilm shows diffuse ∆F/F response from DopaFilm substrate. (B) Dose-response curve of DopaFilm. Each experimental data point has an error bar depicting SD from different DopaFilm preparations (n=3). Experimental data points were fit to the Hill equation (least-squares regression, solid black trace) to estimate an apparent dissociation constant (Kd = 268 nM) and Hill coefficient (n=0.73). (C) DopaFilm response to 10 µM DA remains stable over 35 days. Each experimental data point has an error bar depicting SD from different DopaFilm preparations (n=3). X-axis: days postinitial preparation. (D) Solution-phase fluorescence emission spectra of dopamine nanosensors, prepared from a conjugation of multichiral single-wall carbon nanotubes functionalized with (GT)6 single-strand oligonucleotides, before (black trace) and after (red trace) application of 10 µM DA. Bands indicate SD from n=3 measurements. (E) Solution-phase absorption spectrum of nanosensors.
Figure 2 with 4 supplements
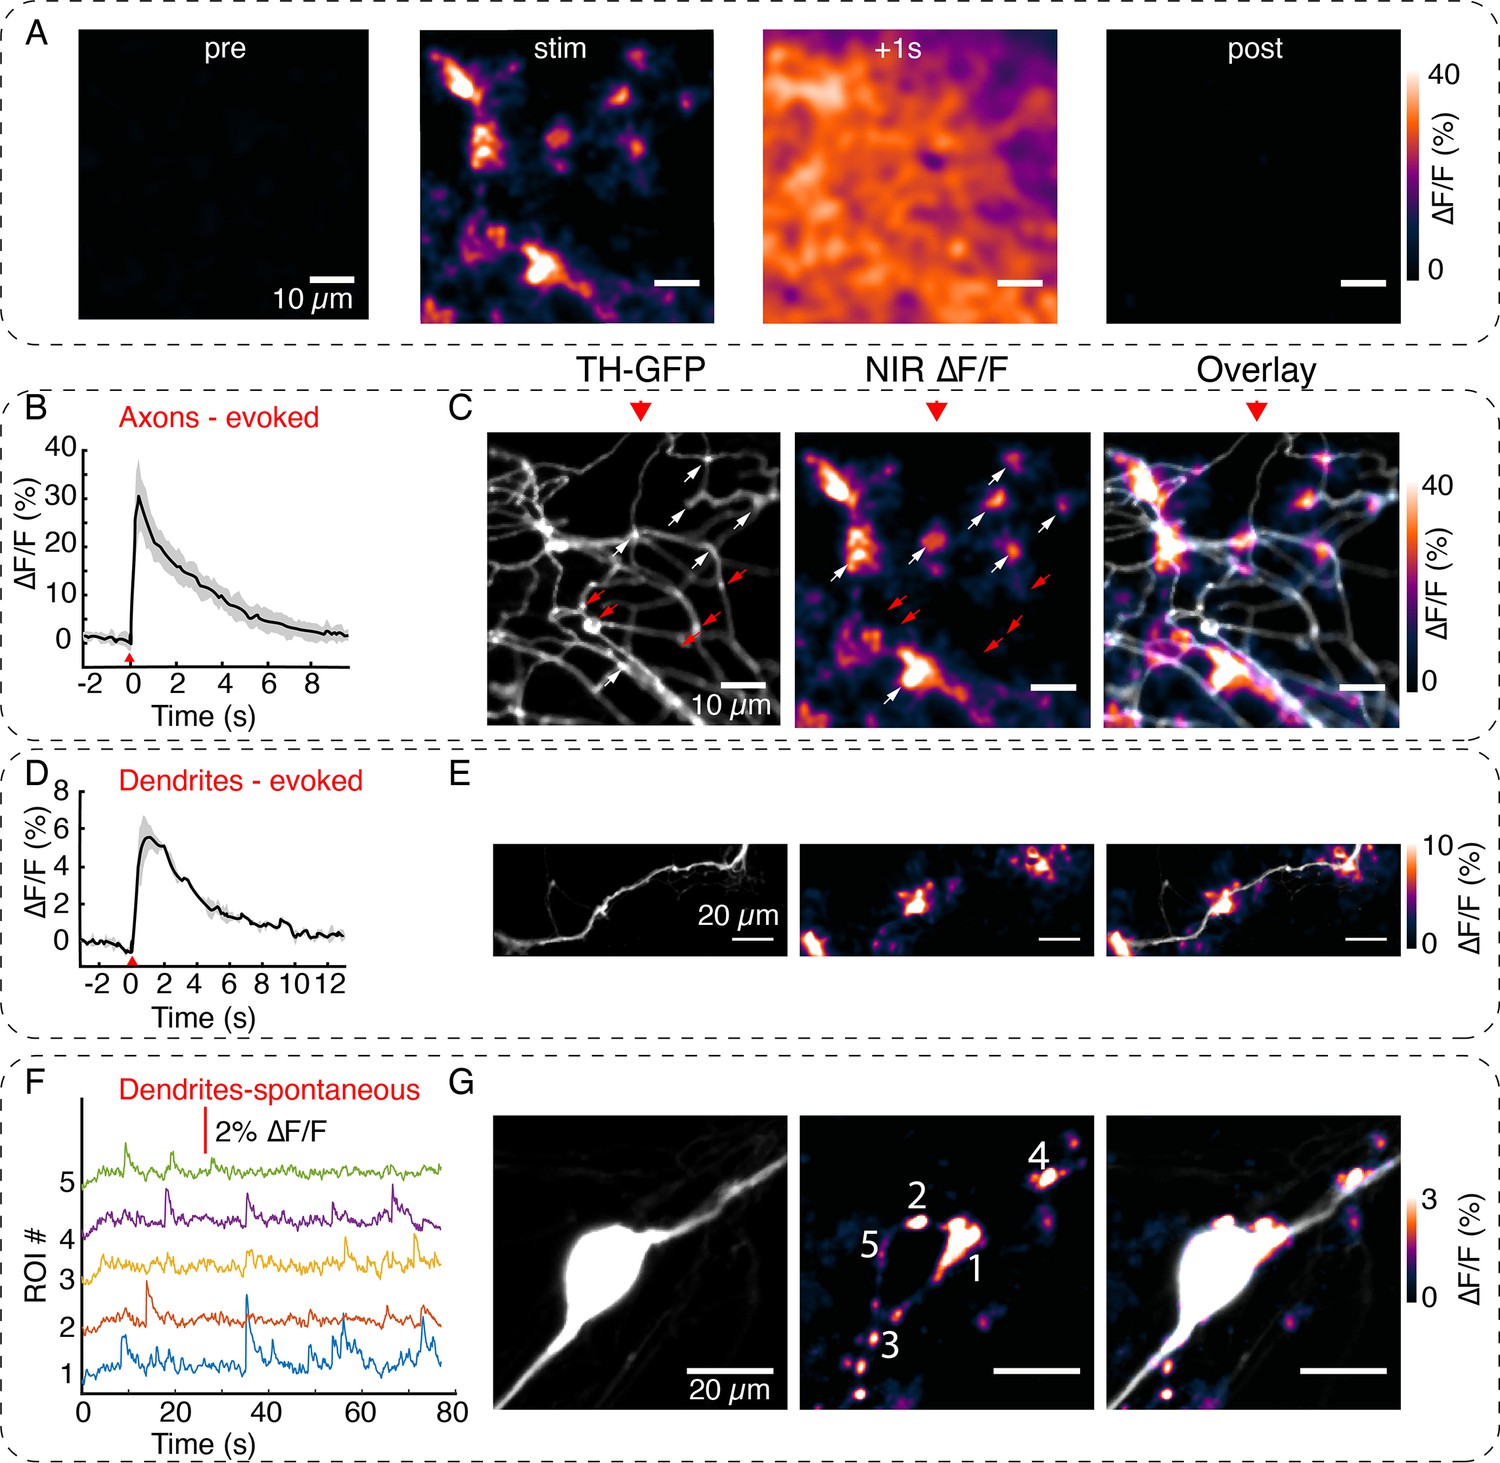
Visualizing active zone dopamine efflux from axons and dendrites.
(A) ∆F/F images before stimulation (pre), at the time of stimulation (stim), 1 s after stimulation (+1 s) and after return to baseline (post). (B) Mean ± SD of ∆F/F traces from the imaging field of view in (A) averaged over n=5 repeat stimulation runs. (C) Tyrosine hydroxylase-GFP (TH-GFP) image of axonal arbor and near-infrared (NIR) ∆F/F image shown in (A) and overlay. The NIR ∆F/F frame corresponds to ‘stim’ and before diffusive broadening of the hotspots. (D, E) TH-GFP and ∆F/F activity from a dendrite of a dopamine neuron and overlay. Cell body not shown. Activity traces from dendrite are averaged over n=3 stimulations. (F, G) Spontaneous activity from dendrites around cell body of a dopamine neuron and maximum intensity projection of the ∆F/F stack and overlay. (F) Shows ∆F/F activity traces from regions of interest (ROI) numbered in (G). Red wedges in (B) and (D) = time of optical stimuli.
Figure 2—figure supplement 1
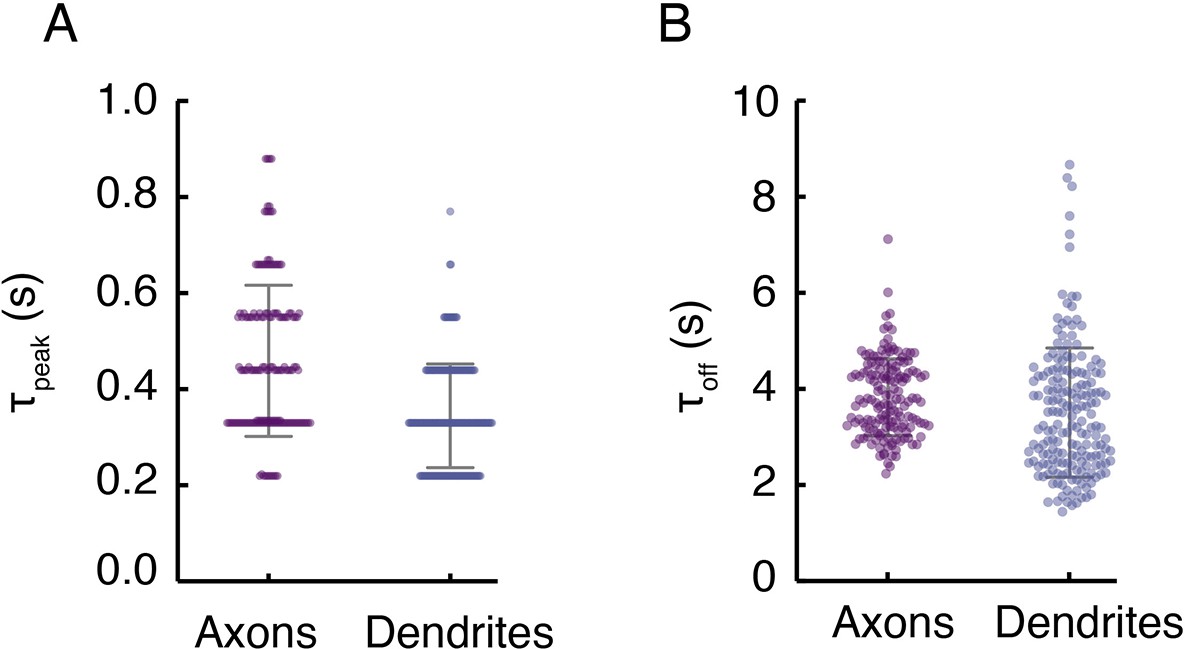
Turn-on and clearance kinetics of DopaFilm in axonal and dendritic processes.
(A) Time to peak (τpeak) of ∆F/F traces in axons and dendrites, defined as the time it takes to reach peak ∆F/F in the epoch immediately following stimulation. Notice the discrete nature of the data, reflecting the video frame rate of imaging (nominally 10 frames/s). The τpeak mean ± SD in axons (s): 0.46 ± 0.16 and in dendrites (s): 0.34 ± 0.11. Bars indicate mean ± SD. (B) Decay time constant (τoff) extracted from fitting a first-order decay process to representative traces in axons and dendrites. The τoff mean ± SD in axons (s): 3.83 ± 0.8 and in dendrites (s): 3.51 ± 1.34. Error bars indicate mean ± SD.
Figure 2—figure supplement 2

Tyrosine hydroxylase (TH) immunofluorescence is used to verify identity of putative dopamine neurons.
(A, B) Optical stimulation of ChrimsonR+ and TH-GFP- axonal arbor elicits no evoked activity (n=25 cells). Immunofluorescence (TH-GFP-IF) indicated no dopaminergic processes in the field of view (FOV). (C, D) Optical stimulation of ChrimsonR+ and TH-GFP+ soma and dendritic arbor elicits no evoked activity (n=10 cells). Retrospective immunofluorescence (TH-GFP-IF) indicates that there are no dopaminergic processes in the FOV. Red wedge: time of application of optical stimulation. Data in (B) and (D) are averaged from triplicate stimulations for FOVs shown in (A) and (C), respectively and are not averages from the entire dataset.
Figure 2—figure supplement 3

DopaFilm activity imaging in normal imaging buffer (artificial cerebrospinal fluid [ACSF] with 2 mM Ca2+) and buffer with no extracellular Ca2+ (Ca2+-free ACSF).
(A) Tyrosine hydroxylase-GFP (TH-GFP) image of a dopamine neuron. (B) Maximum intensity projection from a 1000-frame ∆F/F movie of evoked and spontaneous activity imaging of neuron shown in (A), in normal ACSF. (C) Non-negative matrix factorization (NNMF) decomposition applied to the ∆F/F movie in normal ACSF shows local clusters of pixels with highly correlated activity, color coded for better visualization. Similar colors in a local cluster of pixels correspond to correlated activity. (D) NNMF decomposition of movie stack of imaging in Ca2+-free ACSF. (E, F) ∆F/F time traces for a subset of the NNMF clusters (i.e. decomposed elements) from (C) and (D), respectively, offset in y-axis for better visualization. (G, H) Heat-maps of activity for all the NNMF components in (C) and (D), respectively. Red wedge in (E–H) = time of optical stimulus application.
Figure 2—animation 1
Imaging in axons.
Figure 3 with 2 supplements
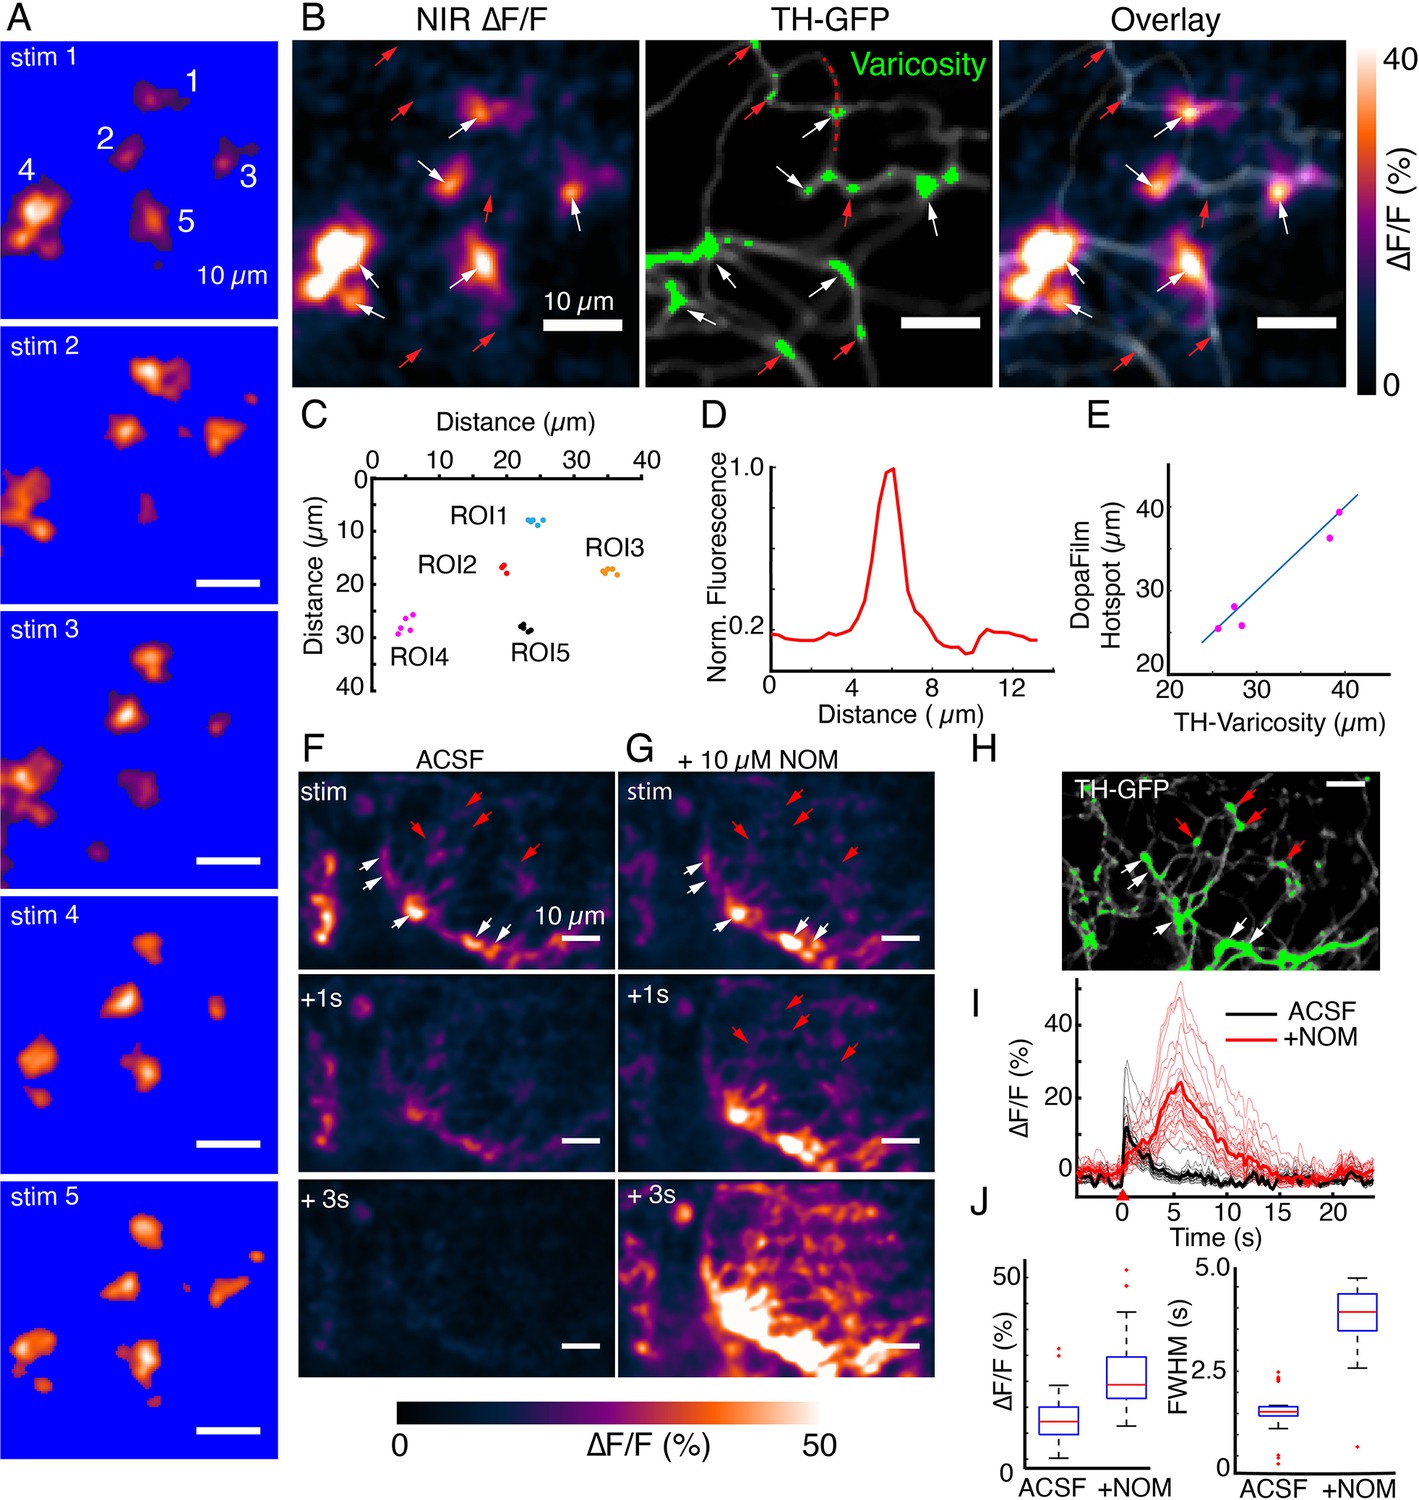
DopaFilm hotspots localize to defined varicosities.
(A) Repeat optical stimulation produced a consistent set of DopaFilm hotspots (n=5 of n=10 stimulations shown), thresholded for better visualization. (B) Hotspot colocalization with tyrosine hydroxylase-GFP (TH-GFP) varicosities (green) for stim #1. Green colors indicate GFP mean intensity >3 × the mean intensity along the process. (C) Centroid of hotpots (regions of interest [ROIs] 1–5). Each data point of an ROI corresponds to one evoked imaging run and there are five total per ROI. (D) Line profile for one of the varicosities is shown in (B). Line profile is calculated along the red curve shown in (B). (E) Parity plot for TH and DopaFilm hotspot centroids. Centroid of TH varicosities and averaged centroid of DopaFilm hotspots are plotted. Distance is calculated from the top left corner (=origin) of near-infrared (NIR) ∆F/F image shown in (B). (F, G) Spatiotemporal dynamics of imaging in artificial cerebrospinal fluid (ACSF) and ACSF + nomifensine (+10 µM NOM), respectively. (H) TH-GFP image of field of view in (F, G). Red arrows = no release. Scale bar = 10 µm. (I) ∆F/F traces of hotspots in ACSF (black) and ACSF + 10 µM NOM (red) and their mean traces in bold. (J) Box plots comparing the effect of NOM on peak ∆F/F (left) and full width at half maximum (FWHM; right) of traces shown in (I). Unpaired t-test, p<10–4 for both ∆F/F and FWHM data. See Methods for box plot definitions.
Figure 3—figure supplement 1
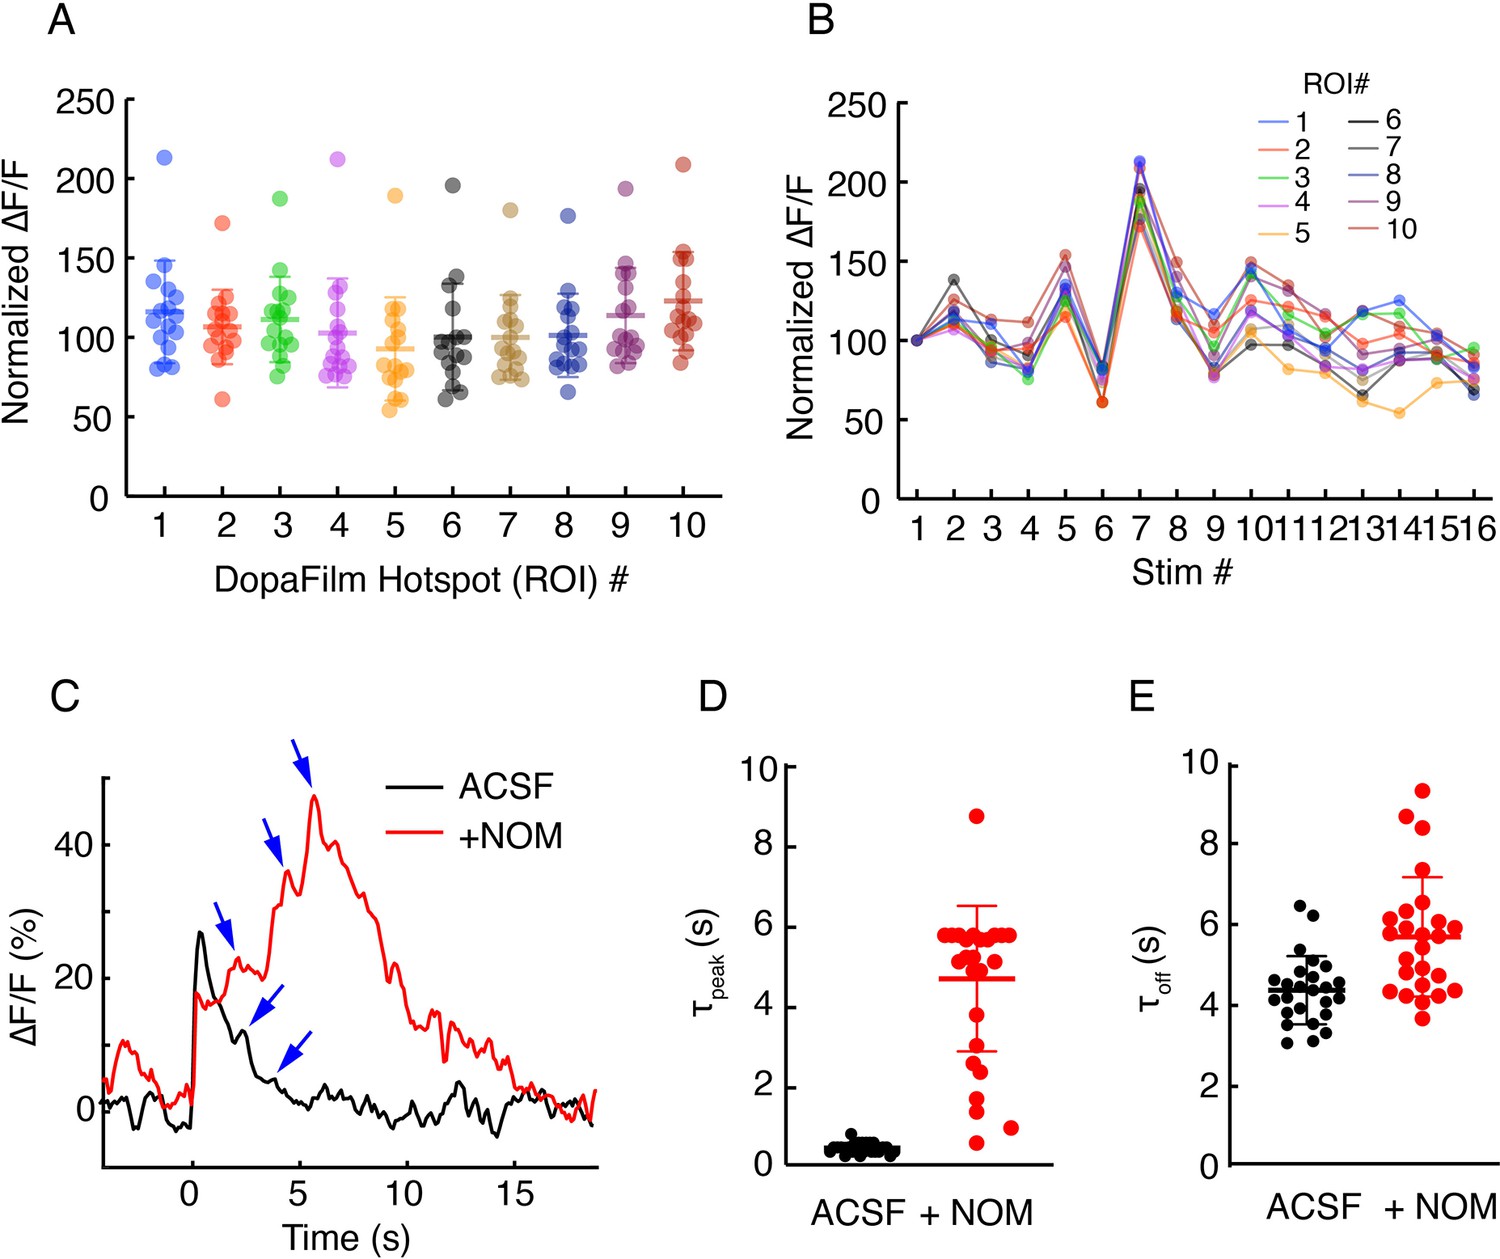
(A-B) Robustness of hotspot activity during repeat stimulation in axons and (C–E): effect of nomifensine (NOM) on turn-on and clearance kinetics.
(A) Peak ∆F/F values at 10 regions of interest (ROIs) in an axonal field of view, normalized to the peak ∆F/F from the first stimulation at each ROI. Optical stimulation protocol per imaging session: 5 pulses, 25 Hz, and 5 ms pulse width. Imaging sessions are spaced ~ 2 min apart, which gives interstimulus interval of ~ 2–3 min. Bars represent mean ± SD. (B) Time course of normalized ∆F/F for each ROI presented in (A) shows stability of response across time. (C) Example traces from single hotspots of DopaFilm before (artificial cerebrospinal fluid [ACSF]) and after application of +NOM. Blue arrows indicate putative dopamine release events in the poststimulation epoch. (D) and (E) time to peak (τpeak) and decay time constant (τoff) of individual traces before (ACSF) and after application of +NOM. Mean ± SD of τpeak for ACSF (s): 0.42 ± 0.13 and for +NOM (s): 4.63 ± 1.81 (p-value<10–4, unpaired t-test). Mean ± SD of τoff for ACSF (s): 4.38 ± 0.84 and for +NOM (s): 5.70 ± 1.47 (p-value=3×10⁻⁴, unpaired t-test).
Figure 3—figure supplement 2
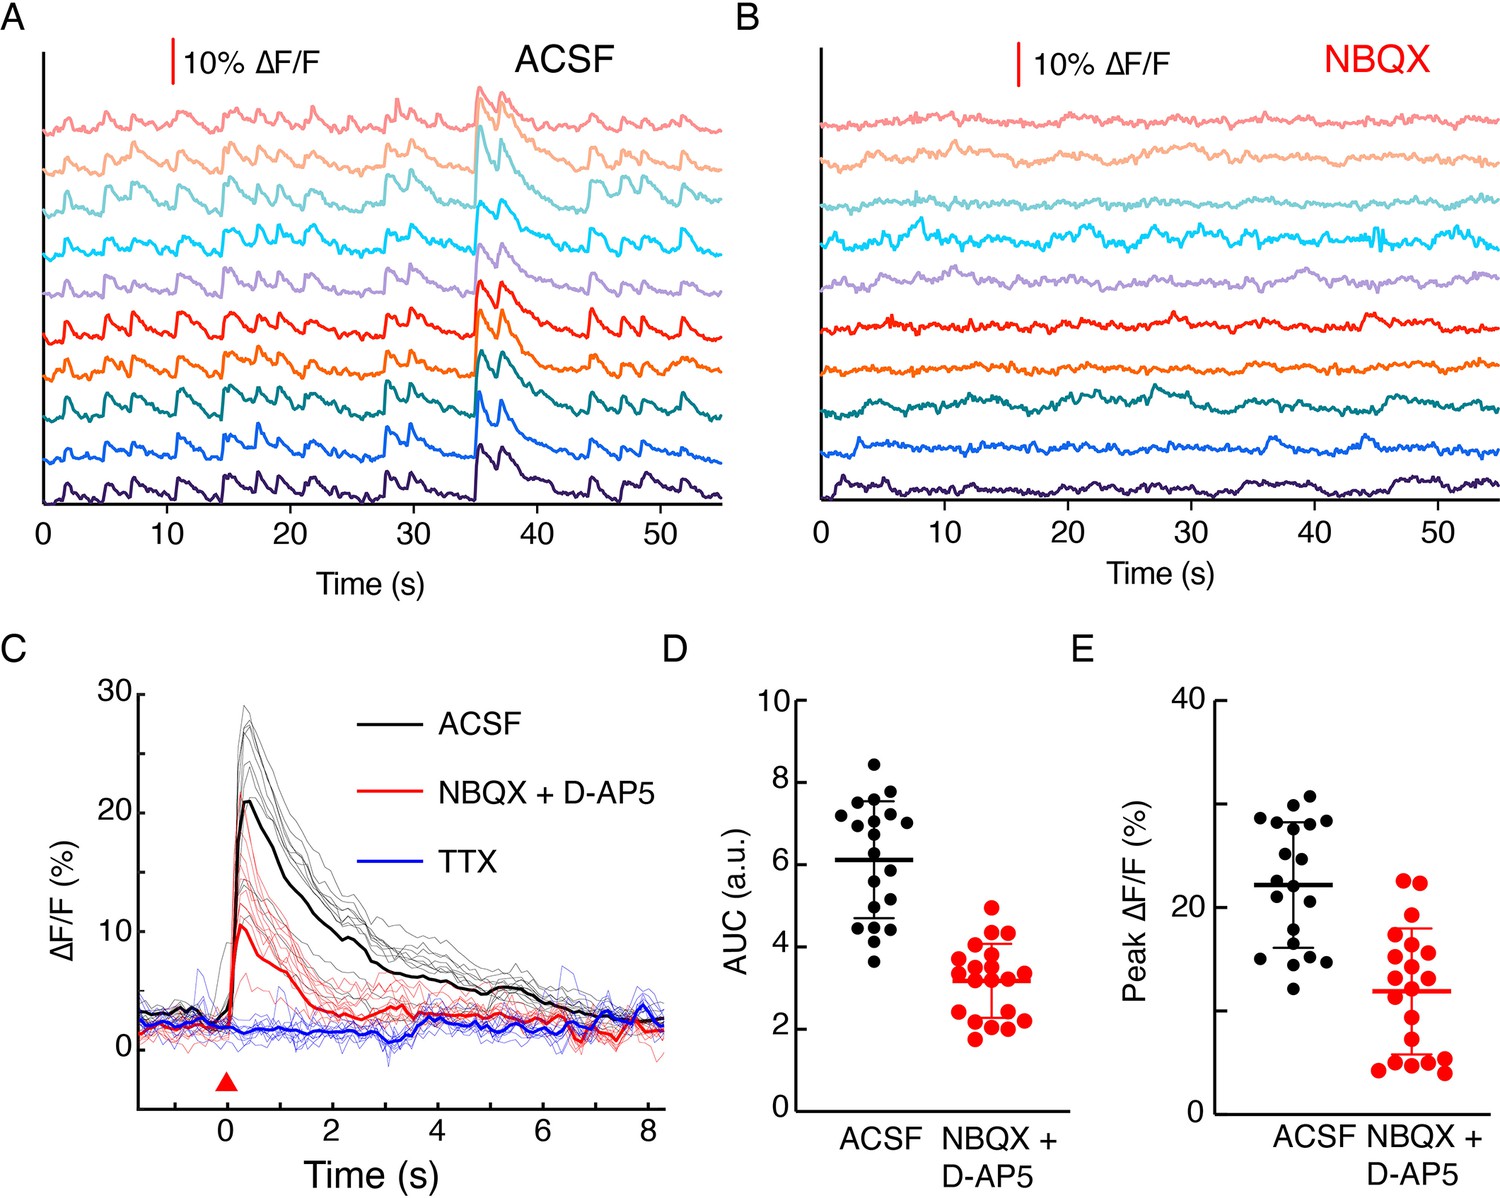
Effect of glutamate transmission on dopamine release in dopaminergic and glutamatergic neuron co-culture system.
(A) DopaFilm activity detected without application of external stimulus when imaging in normal imaging buffer (artificial cerebrospinal fluid [ACSF]). Exemplary traces from an axonal field of view are shown. (B) Imaging in the same field of view after application of AMPAR-antagonist NBQX. (C) Evoked activity imaging in ACSF (black traces) and sequential application of NBQX and D-AP5 (red traces). Application of tetrodotoxin (TTX) (blue traces) abolished activity. The 10 exemplary traces are shown with a mean trace indicated in bold. (D) and (E) Area under the curve and peak ∆F/F of activities before and after drug application from 20 regions of interest (p<10–4 for both (D) and (E), unpaired t-test).
Figure 4 with 5 supplements
DopaFilm detects quantal release of dopamine.
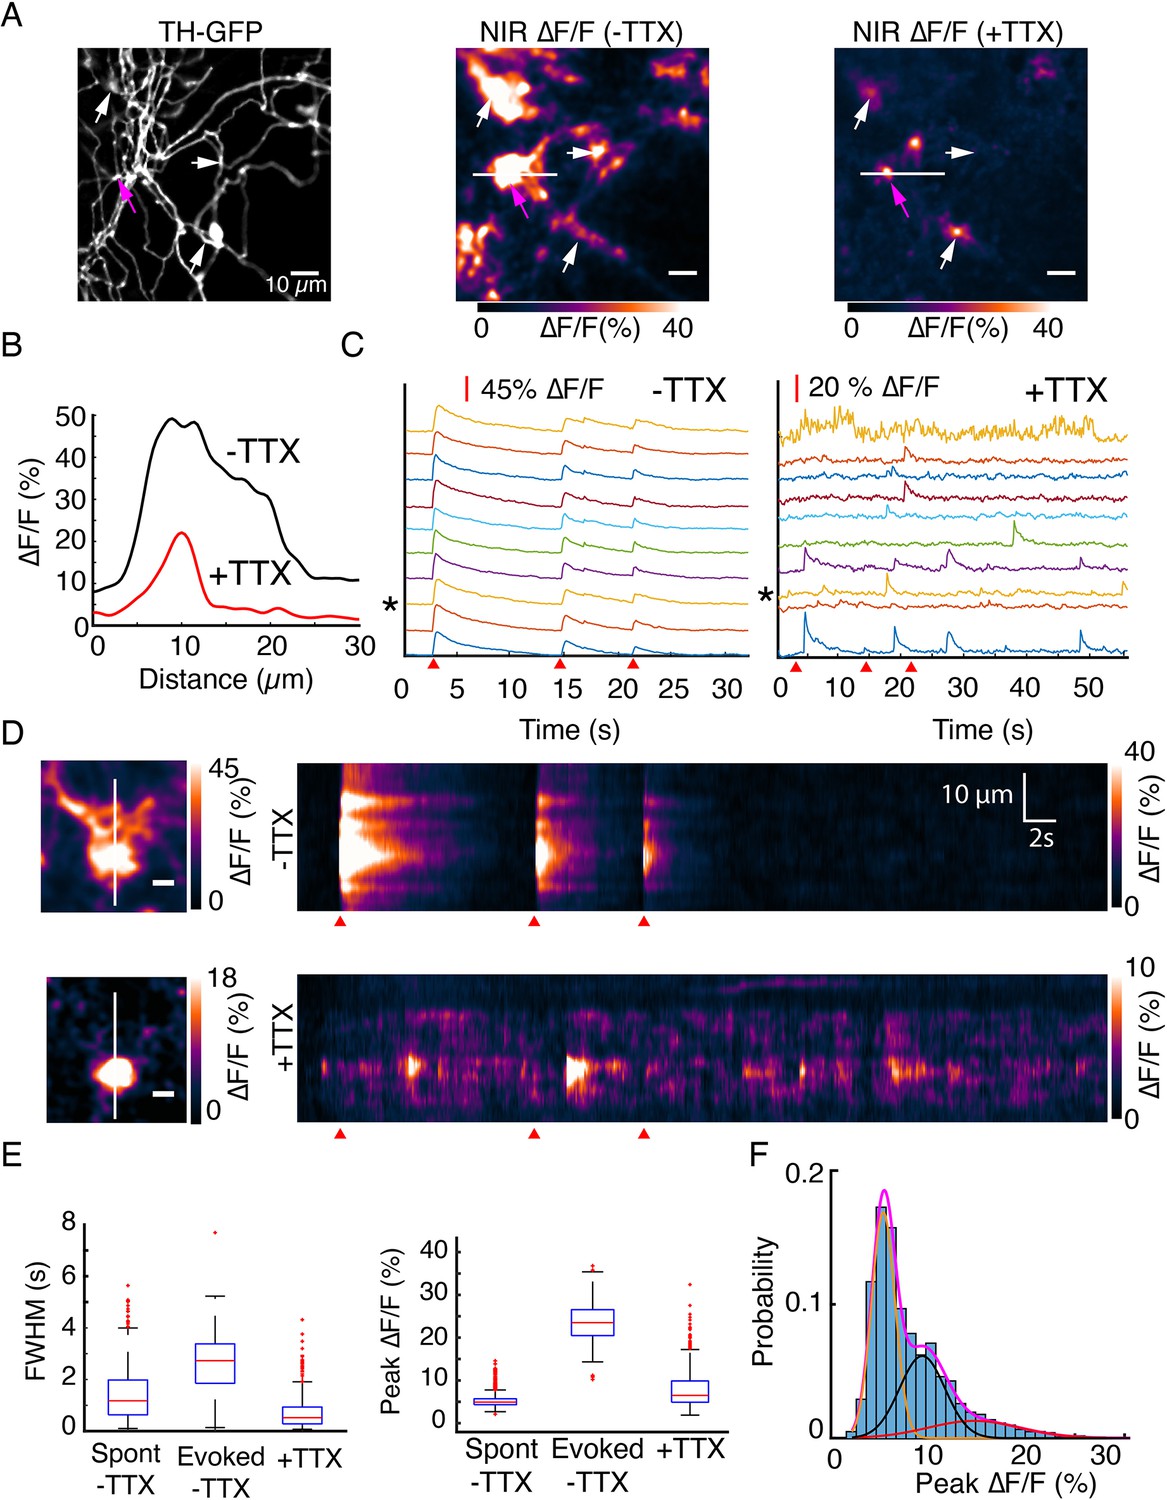
(A) Tyrosine hydroxylase-GFP (TH-GFP) image from an axonal arbor of a dopamine neuron (soma not shown). Peak ∆F/F of DopaFilm fluorescence transients with no tetrodotoxin (TTX) in imaging media (–TTX) and max ∆F/F projection of stack with 10 µM TTX in media (+TTX). Arrows provided to aid comparison across field of views. (B) ∆F/F profiles across the white lines depicted in (A). Line profiles correspond to the peak ∆F/F frames and are not averaged across stimuli. (C) Fluorescence transient traces for hotspots with (–TTX) and (+TTX), respectively. * indicates trace corresponding to magenta arrow in (A). Red wedges in (C) and (D) indicate times of optical stimuli. (D) Kymographs along the white lines shown in (A). Scale bar = 5 µm. (E) Box plots of full width at half maximum (FWHM) (s) and ∆F/F amplitude (%) for (–TTX, spontaneous and evoked) and (+TTX) cases. The term ‘spont’ refers to spontaneous activity before TTX addition, and ‘evoked’ refers to action potential driven synchronous release before TTX addition. FWHM (s) (mean ± SD): 1.5 ± 1.0 for ‘spont –TTX’, 2.6 ± 1.2 for ‘evoked –TTX’, and 0.74 ± 0.70 for ‘+TTX’. Peak ∆F/F (%) (mean ± SD): 5.3 ± 1.6 for ‘spont –TTX’, 23.7 ± 4.6 for ‘evoked –TTX’, and 7.9 ± 4.6 for ‘+TTX’. p<10–4 in unpaired t-test of the ‘evoked –TTX’ against non-evoked (‘spon –TTX’ and ‘+TTX’) datasets. See Methods for box plot definitions. (F) Frequency histogram of ∆F/F amplitudes for TTX data shown in (C) and Gaussian fits to the experimental data. Magenta = sum of three Gaussian components shown in orange, black, and red. Means: µ1=5.7%, µ2=9.6%, and µ3=15.1%.
Figure 4—figure supplement 1
Application of tetrodotoxin (TTX) abolishes evoked release but spares spontaneous activities.
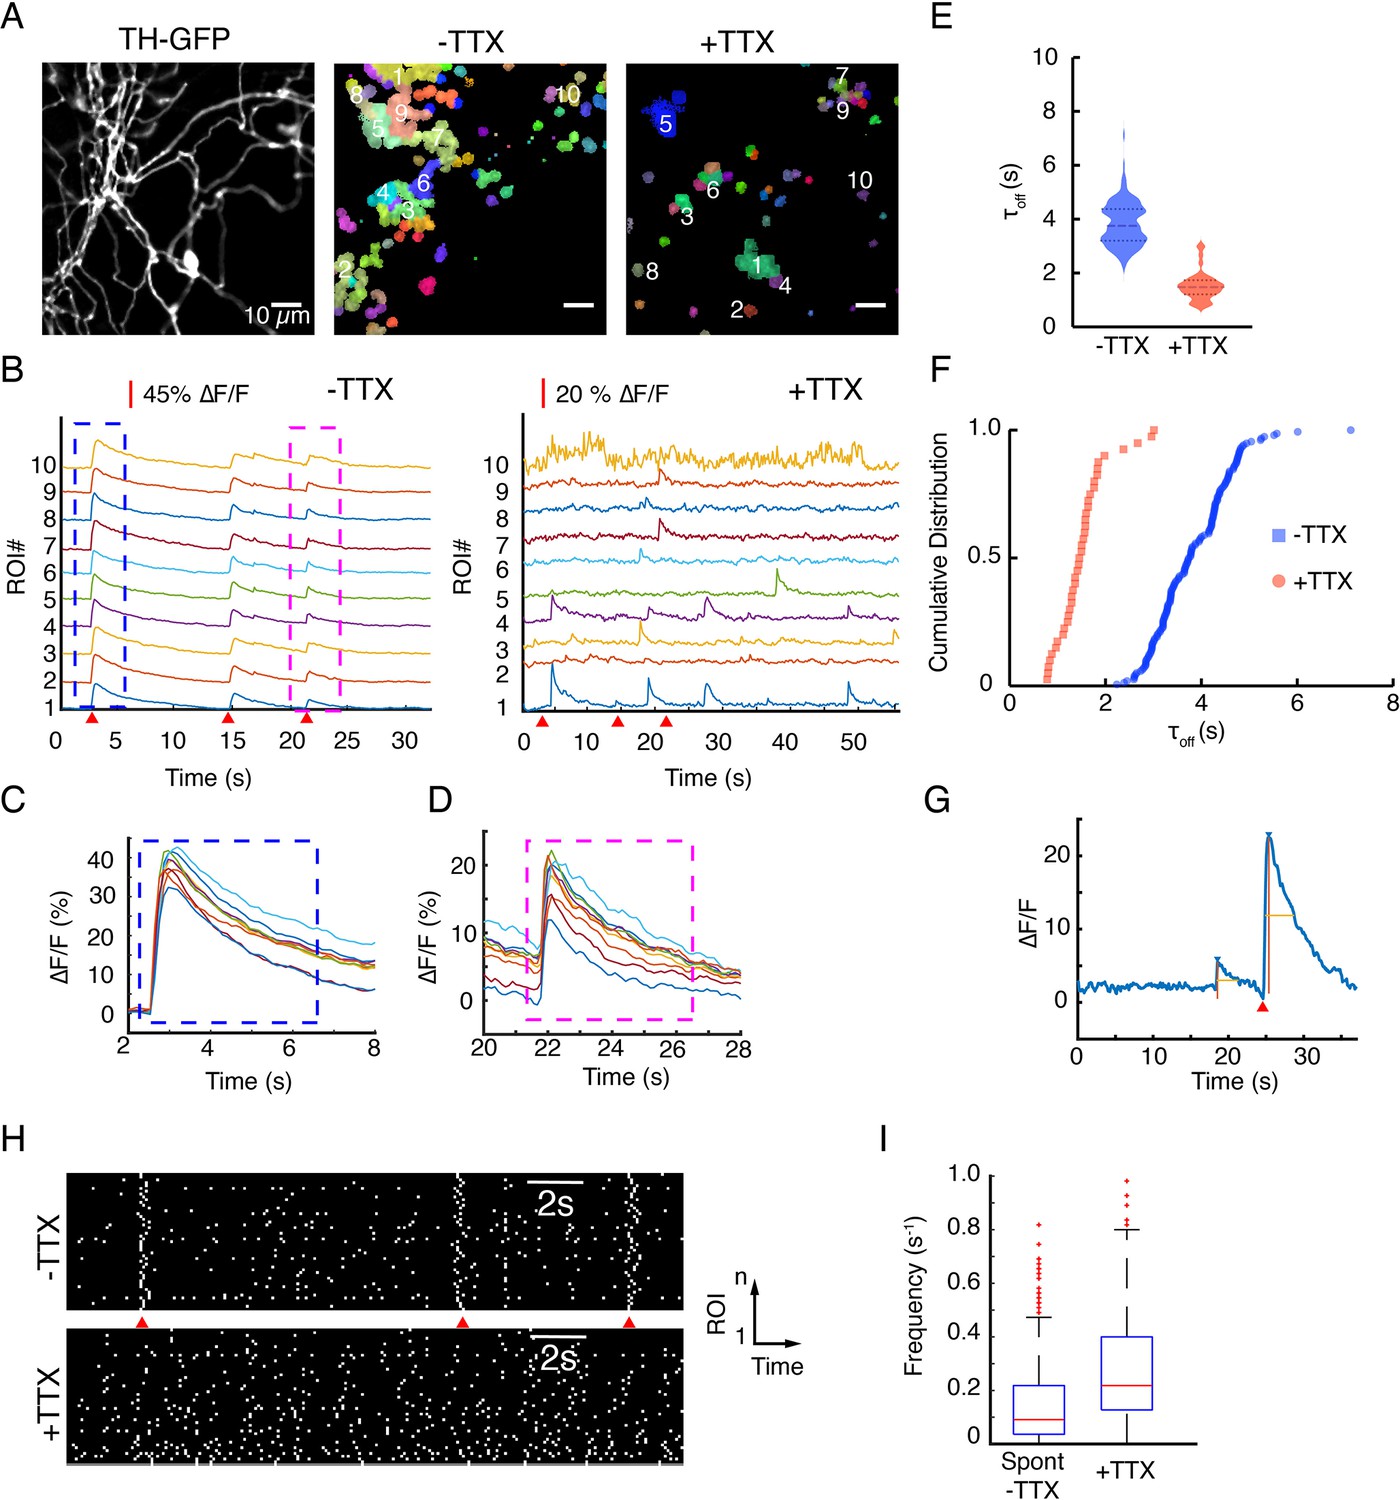
(A) Tyrosine hydroxylase-GFP (TH-GFP) field of view from Figure 4A and hotspots of activity identified by non-negative matrix factorization decomposition of the near-infrared ∆F/F stacks. Color-coded pixels grouped into a cluster exhibit correlated temporal behavior and are defined as a region of interest (ROI). See data analysis for details. (B) ∆F/F activity of hotspots for ROIs numbered in (A). (C) and (D) A closer view of the blue and magenta windows depicted in (B) shows peak ∆F/F variability across release sites. (E) Violin plots of τoff values before and after application of TTX (mean ± SD (s)) for: 3.83 ± 0.8 vs 1.52 ± 0.53, p<10–4 in unpaired t-test. (F) Distribution of τoff values in hotspots before and after application of TTX. (G) An example trace showing a spontaneous activity event next to an evoked activity event in TTX-free (artificial cerebrospinal fluid [ACSF]) imaging (red wedge = time of optical stimulus application). (H) Raster plots of activity provide a visual representation of the frequency of spontaneous activities before and after application of TTX. Notice the action potential driven synchronous activities in –TTX case. (I) Per release site frequency distributions of spontaneous release events before (–TTX) and after (+TTX) application of TTX.
Figure 4—figure supplement 2

DopaFilm activity imaging in an axonal arbor in: (A) normal artificial cerebrospinal fluid (ACSF) (B) ACSF with 10 µM of tetrodotoxin (TTX).
(C) DopaFilm activity is driven by four putative release sites when imaging in ACSF, but activity is only seen in region of interest (ROI) 1 when TTX is applied. (D) Centroid of hotspots in ACSF and ACSF +TTX. For ROI 1, centroids nearly overlap. For ROIs 2, 3, and 4, TTX centroids are missing. (E, F) ∆F/F activity traces for ROIs 1–4 in ACSF (E) and ACSF +TTX (F).
Figure 4—figure supplement 3
Statistical model fits for tetrodotoxin (TTX) data.
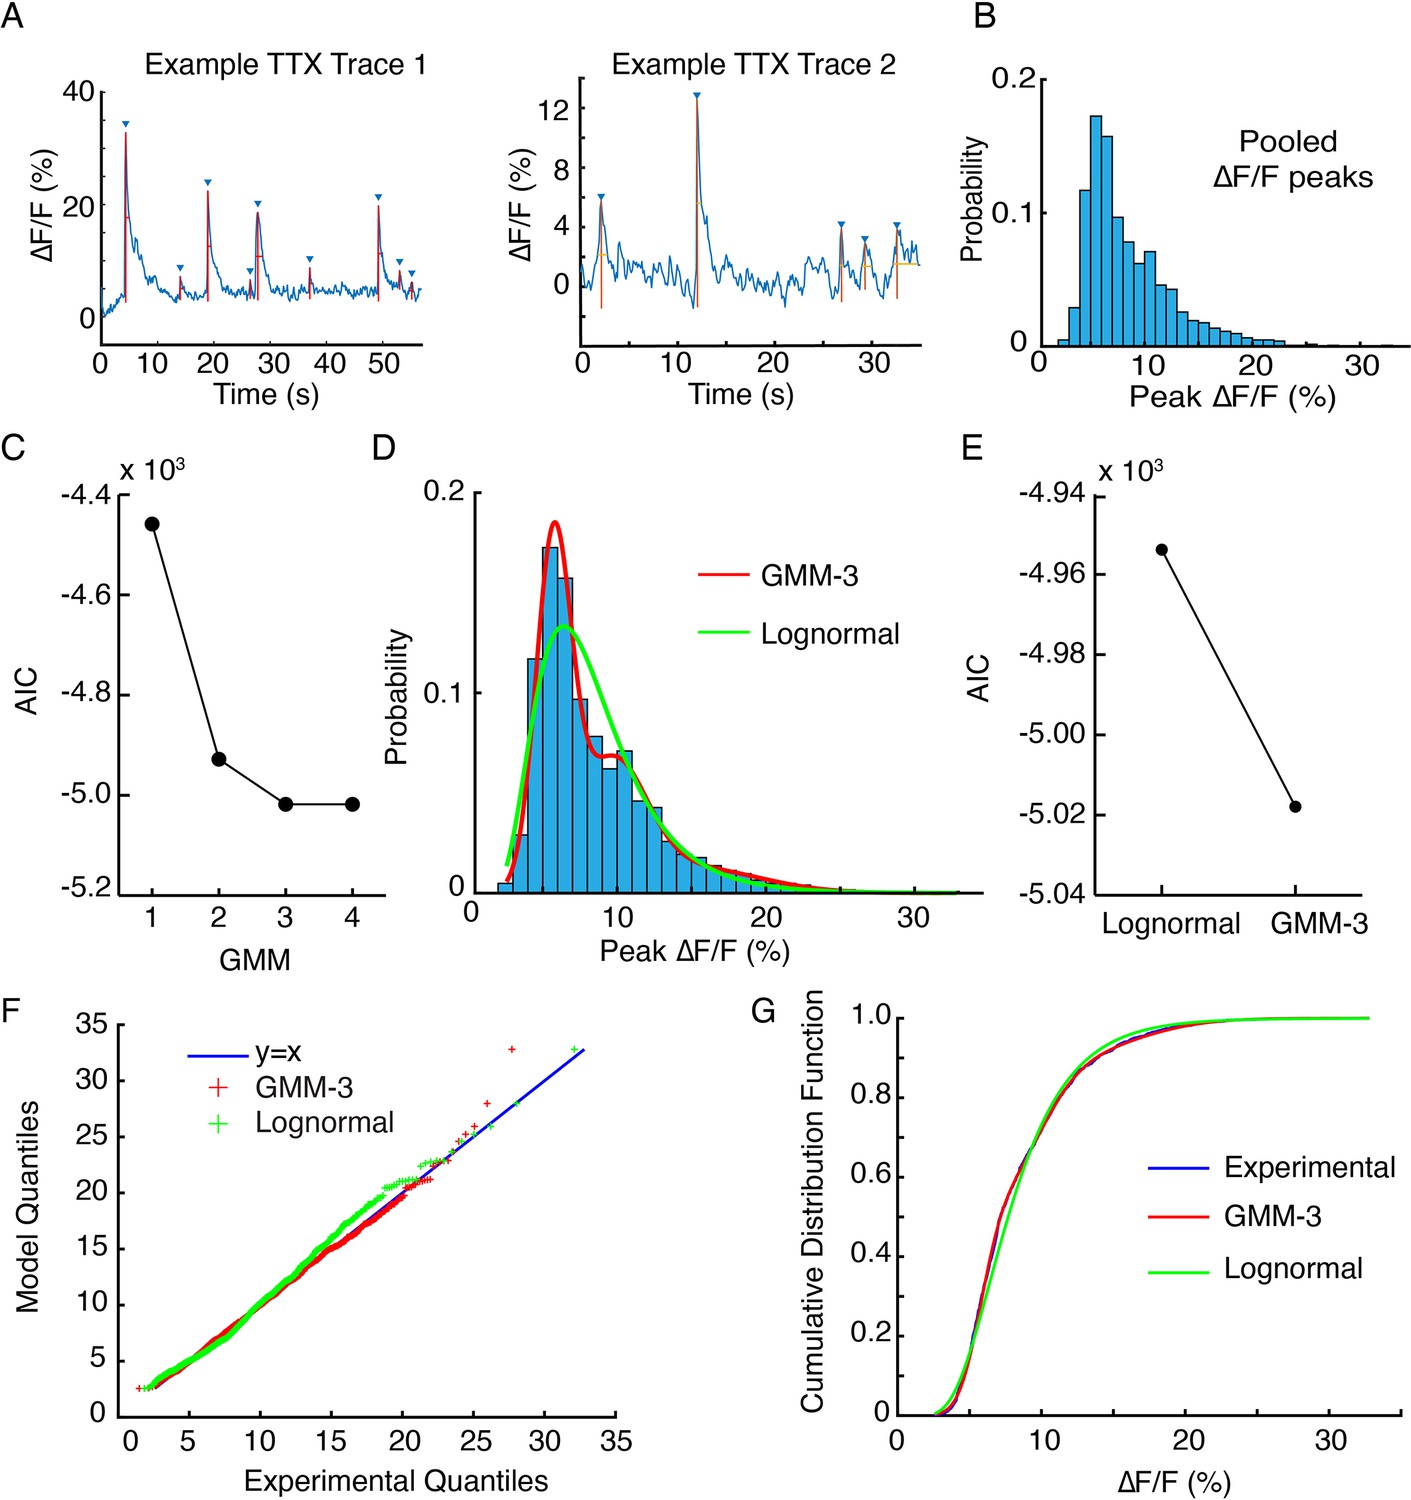
(A) Examples traces of ∆F/F from two hotspots in the same field of view. Upward deflections are automatically identified and annotated, and peak ∆F/F values extracted. (B) Pooled peak ∆/F data from TTX traces across the field of view of imaging in one axonal arbor. (C) Akaike information criteria (AIC) scores for Gaussian mixture models (GMM) with one to four Gaussian components. A one-component model is a single Gaussian fit. The GMM-3 AIC score is a local minimum, indicating that it explains experimental variance the best with the least number of model parameters. (D) Model fits of a GMM-3 identified in (C) and a lognormal (Lognormal) model. (E) The AIC scores for the two models shown in (D). (F) Q-Q (quantile-quantile) plots for the two models shown in (D) show GMM-3 deviations from the y = x line are smaller (root mean square [RMS] GMM = 3.6E-6 vs RMS Lognormal = 1.88E-5). (G) Cumulative distribution functions (CDF) for experimental data, compared to the GMM-3 and Lognormal models show that GMM and experimental CDF are in better agreement than Lognormal and experimental CDF.
Figure 4—animation 1
Imaging in axons before application of tetrodotoxin.
Figure 4—animation 2
Imaging in axons after application of tetrodotoxin.
Figure 5 with 10 supplements
DopaFilm detects dopamine release activity from dendritic processes.
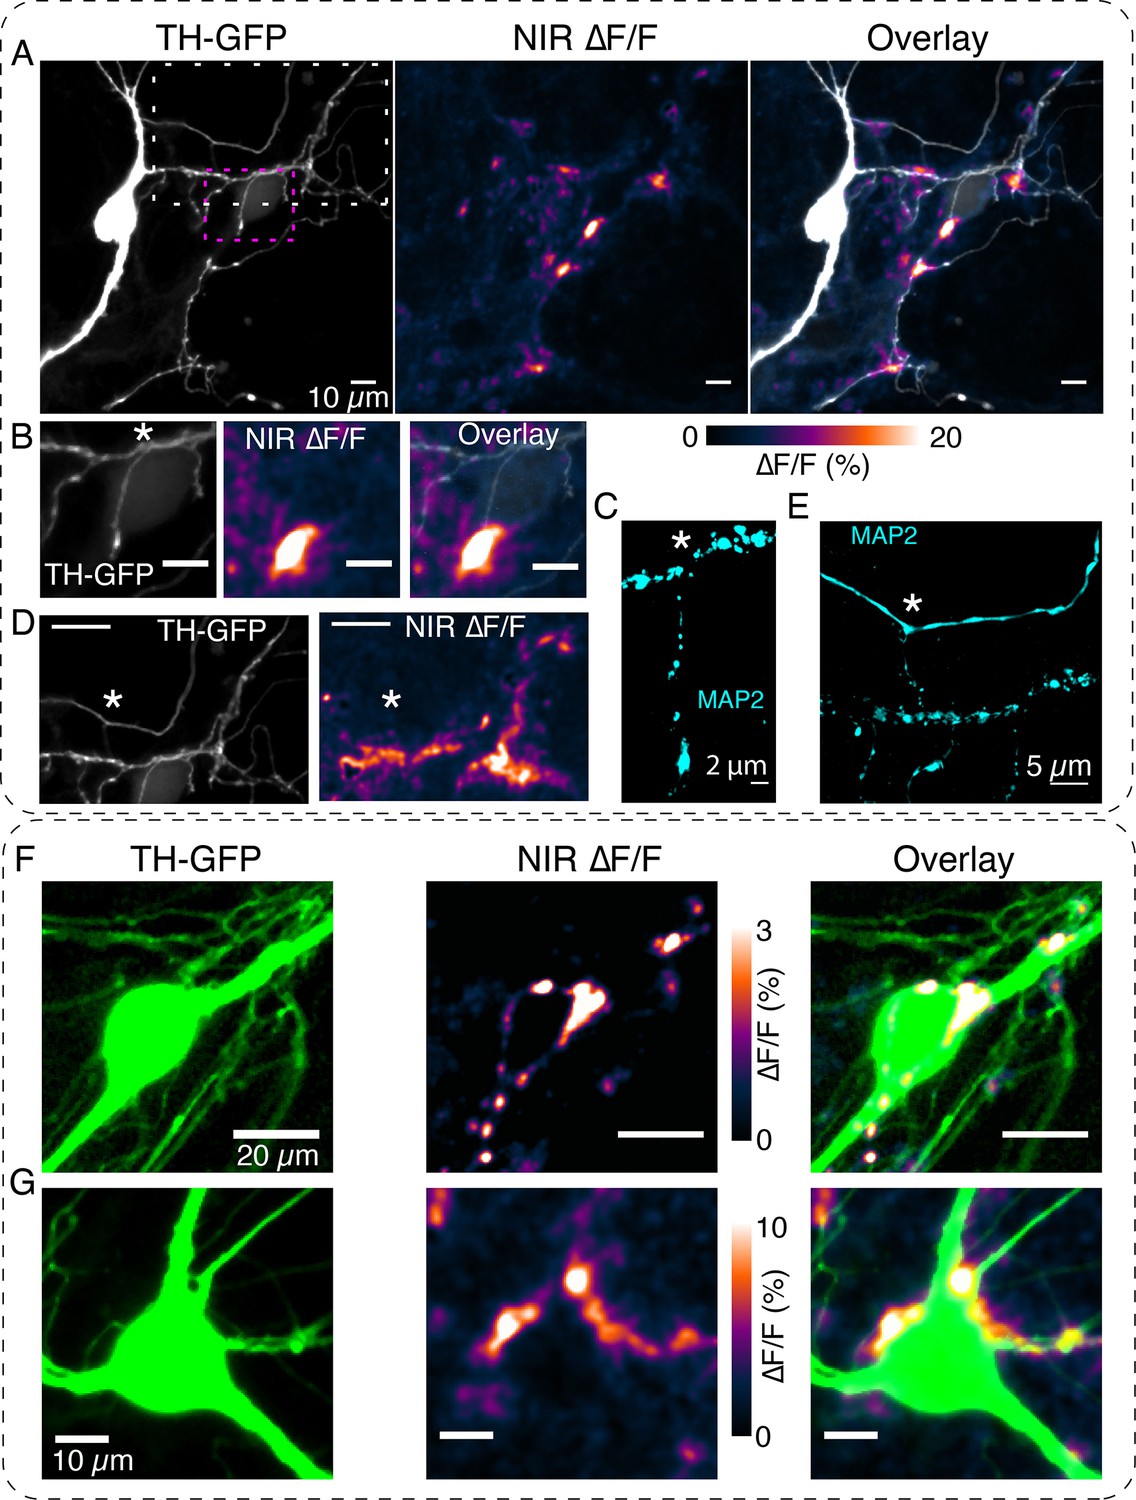
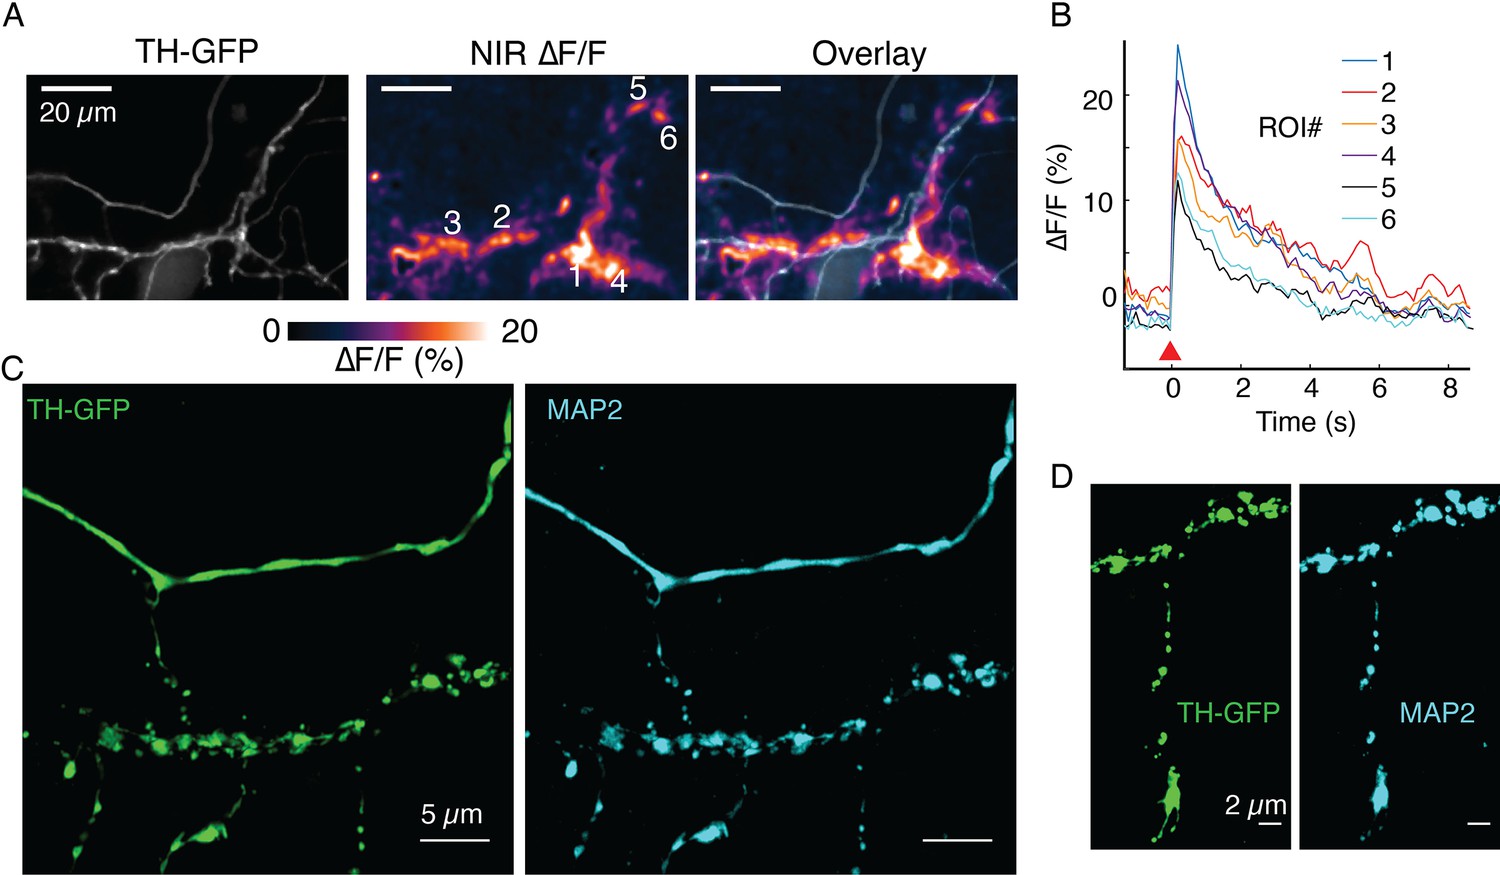
(A) Tyrosine hydroxylase-GFP (TH-GFP) image of a dopamine neuron and its spontaneous DopaFilm activity. Maximum intensity projection from a ∆F/F stack is shown, overlayed with TH-GFP. (B) Area bounded by magenta box in (A) and close-up of its spontaneous DopaFilm activity and overlay. Scale bar = 10 µm. (C) MAP2 signal corresponding to (B). Use * to compare field of views (FOVs) in (B) and (C). (D) Area bounded by white box in (A) and close-up of its spontaneous DopaFilm activity. Scale bar = 20 µm. See TH-GFP and near-infrared (NIR) ∆F/F overlay image in Figure 5—figure supplement 1. (E) MAP2 signal corresponding to (D). Use * to compare FOVs in (D) and (E). (F, G) DopaFilm activity arising from dendrites that commingle with the soma of dopamine neurons. Notice activity from fine dendritic processes that appear in proximity to the soma. Transient traces for activity in (F) are shown in Figure 2F.
Figure 5—figure supplement 1
MAP2+ immunofluorescence demonstrates dendritic nature of processes.
(A) Tyrosine hydroxylase-GFP (TH-GFP), near-infrared (NIR) ∆F/F and overlay image corresponding to data in Figure 5D. (B) Activity traces corresponding to regions of interest (ROIs) 1–6 noted in (A). (C) TH-GFP and MAP2 double-immunofluorescence and Airyscan images of field of view (FOV) in (A). (D) TH-GFP and MAP2 double stain of FOV in Figure 5B.
Figure 5—figure supplement 2
Spontaneous DopaFilm activity imaging at a dendrite of a dopamine neuron.
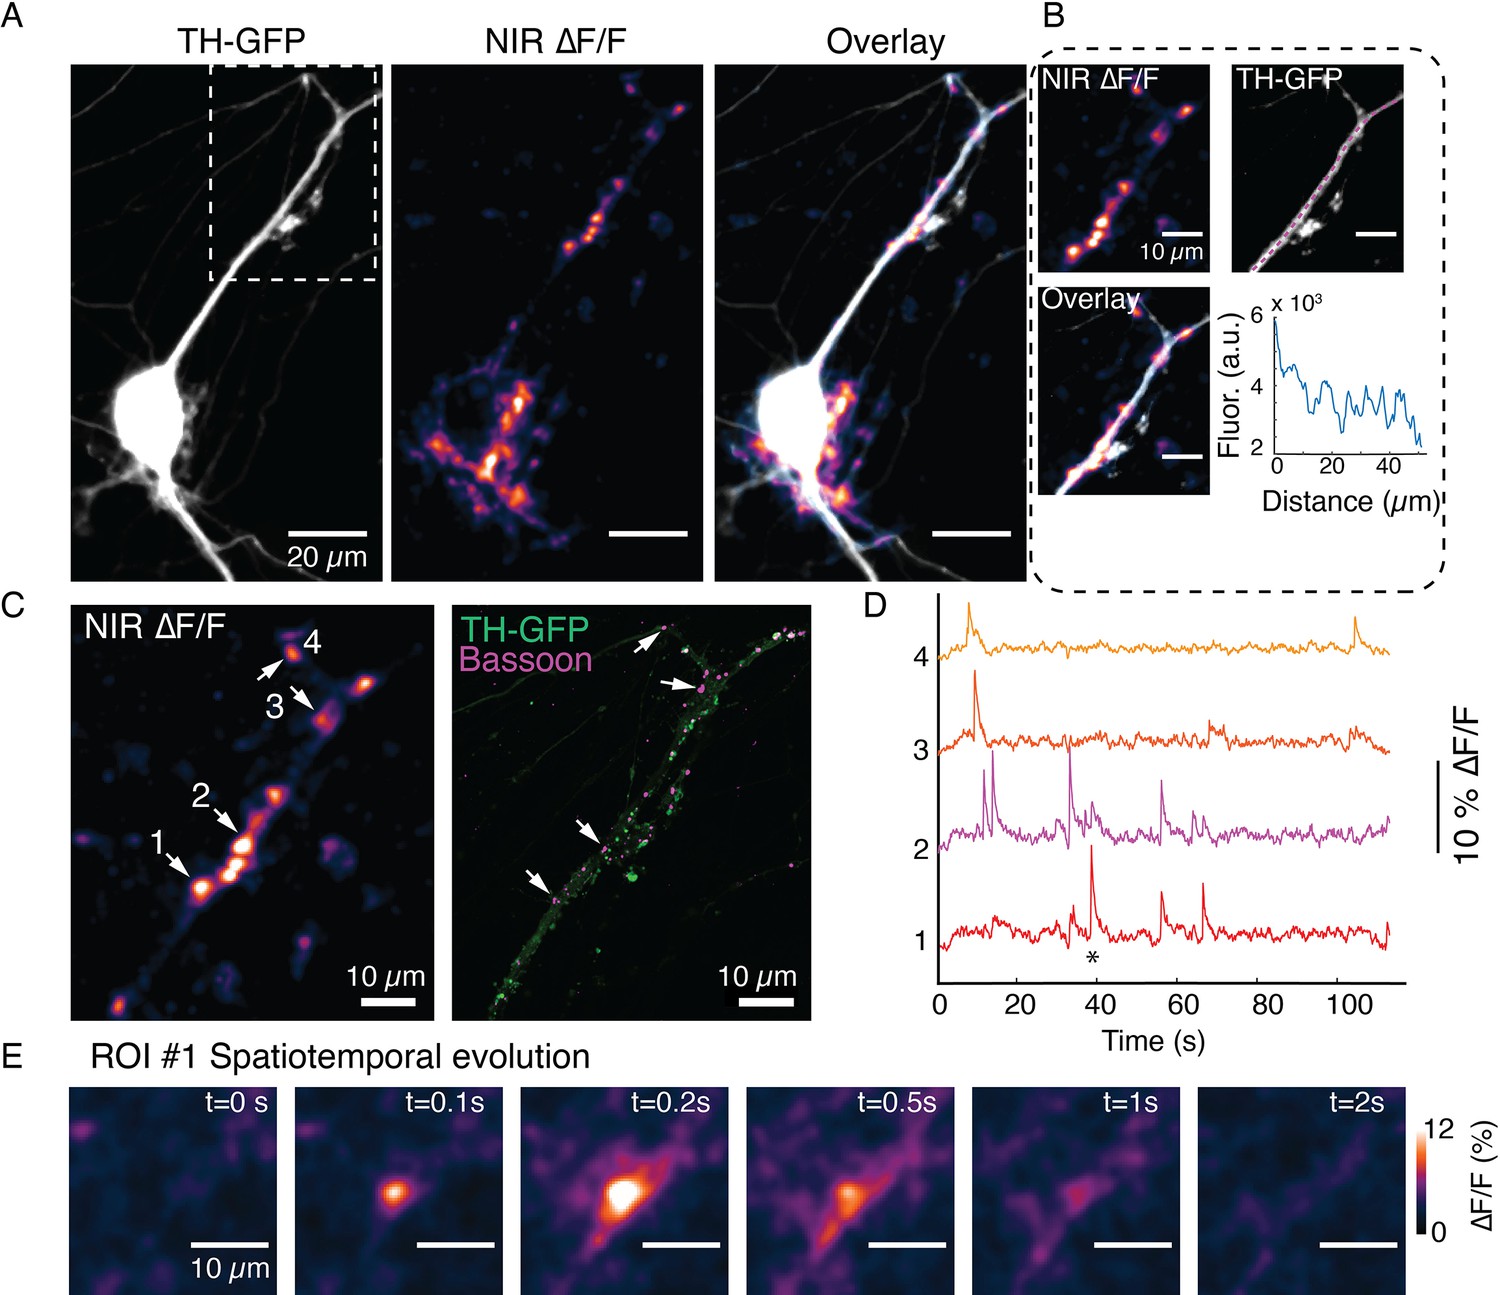
(A) Tyrosine hydroxylase-GFP (TH-GFP) image of a dopamine neuron, and maximum intensity projection from ∆F/F stack and overlay. (B) Segment of activity in (A), (white box) and its TH-GFP intensity profile along the dendritic process (along magenta line), show no putative boutons. (C) DopaFilm hotspot activity for a portion of the field of view in (A) and corresponding TH-GFP and Bassoon Airyscan images. Bassoon puncta can be assigned to DopaFilm hotspot activity. (D) ∆F/F traces for regions of interest (ROIs) 1–4 shown in (C). (E) Spatial dynamics of ROI #1 at the time depicted with * in the ROI 1 trace shown (D).
Figure 5—figure supplement 3
DopaFilm activity imaging of a dopamine neuron.
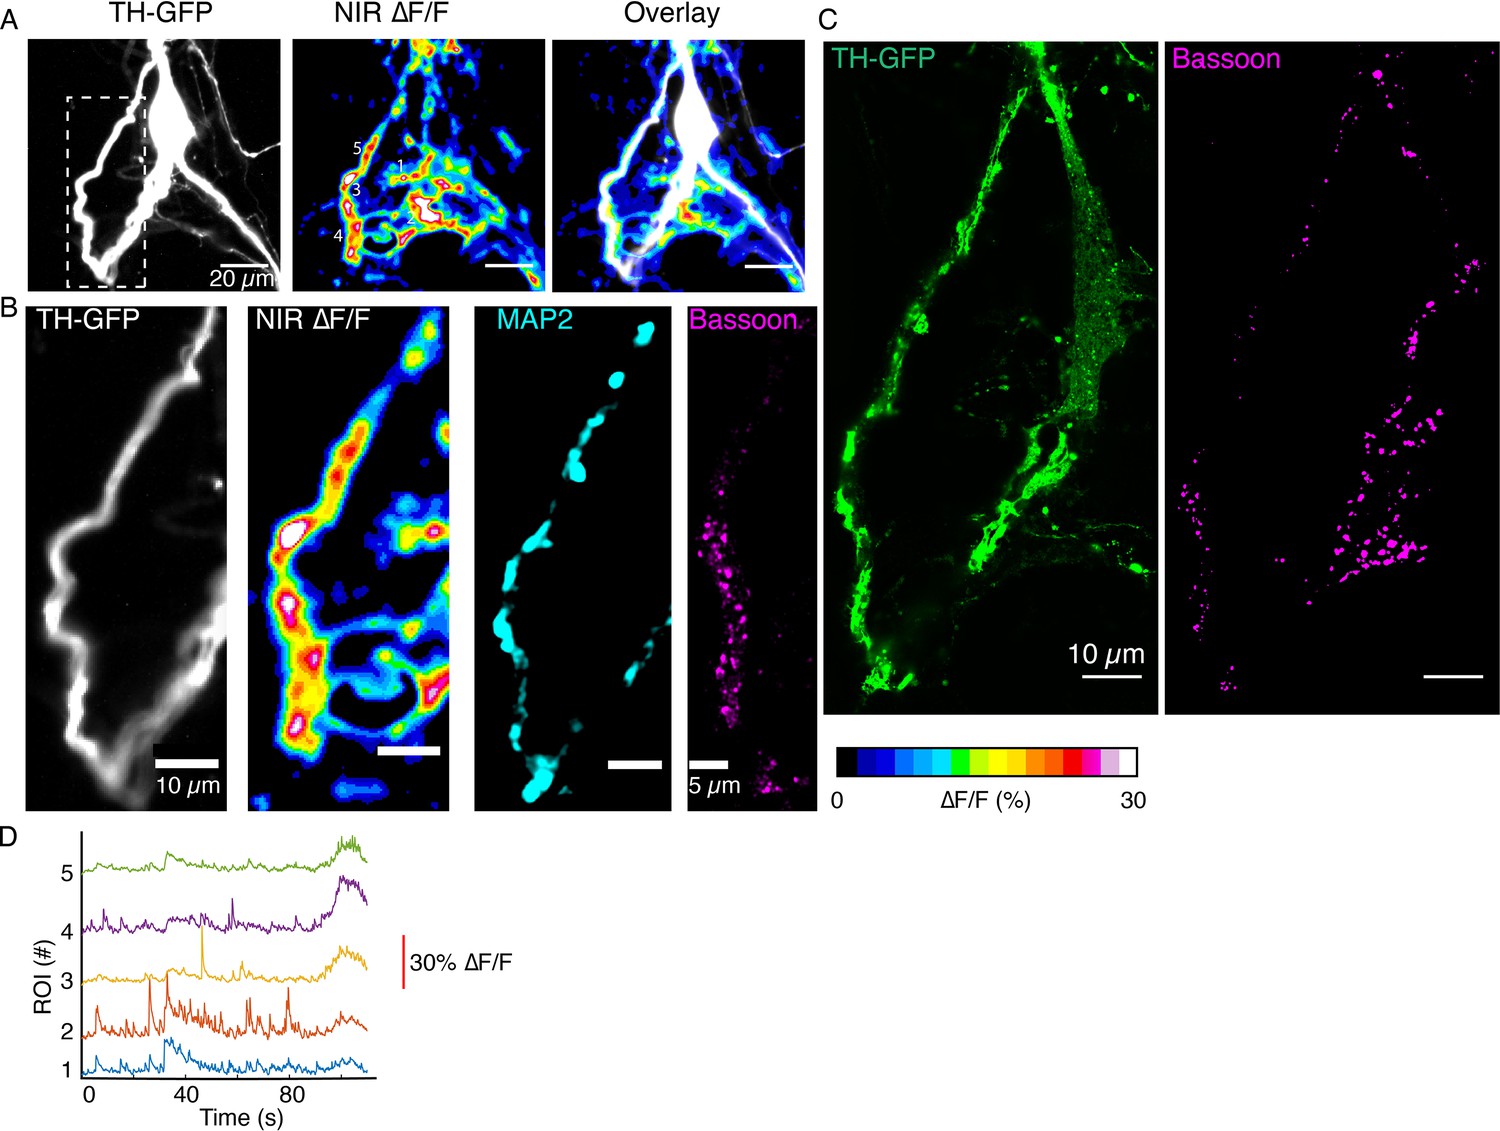
(A) Tyrosine hydroxylase-GFP (TH-GFP) image of a dopamine neuron, and maximum intensity projection from ∆F/F stack and overlay (B) TH-GFP for the white box depicted in (A) and its DopaFilm activity along the dendritic process, as well as MAP2 and Bassoon Airyscan images. (C) TH-GFP and Bassoon Airyscan images for the bigger field of view in (A). (D) ∆F/F time traces for regions of interest (ROIs) 1–5 depicted in near-infrared (NIR) ∆F/F panel in (A).
Figure 5—figure supplement 4
(A-B) Robustness of hotspot activity during repeat stimulation in dendrites and (C-E) Comparison of spatiotemporal dynamics in axons and dendrites.
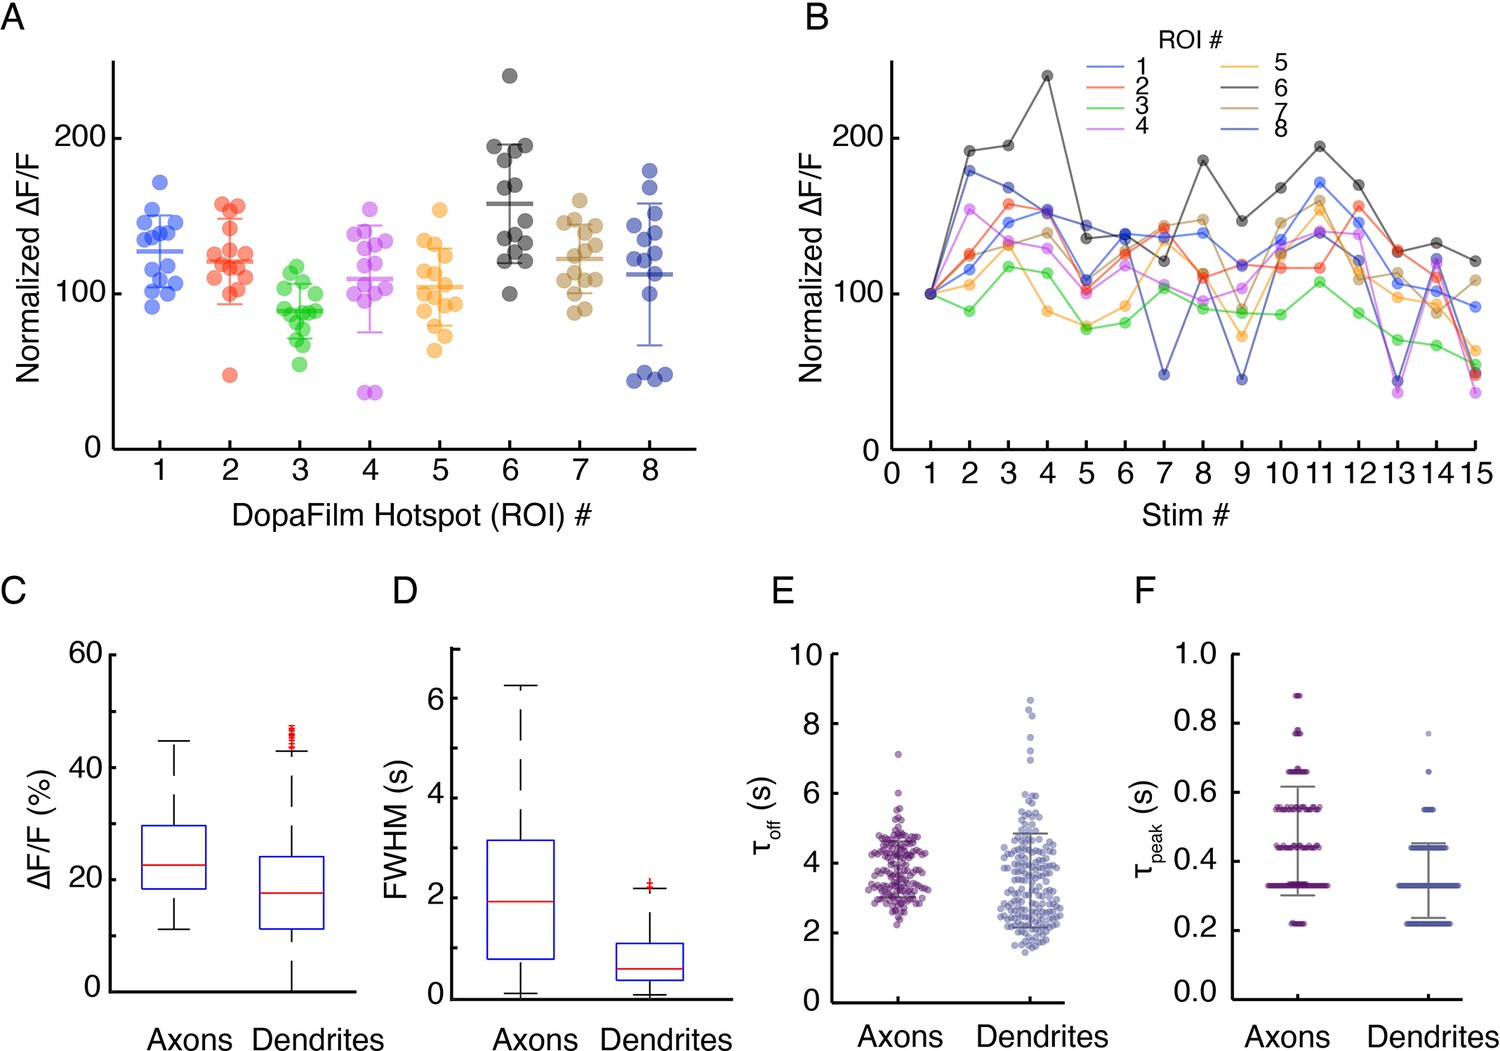
(A-B) Robustness of hotspot activity during repeat stimulation in dendrites and (C–F) comparison of the kinetic properties of axonal and dendritic activities. (A) Peak ∆F/F values at eight regions of interest (ROIs) in a dendritic field of view, normalized to the peak ∆F/F from the first stimulation at each ROI. Optical stimulation protocol per imaging session: 5 pulses, 25 Hz, and 5 ms pulse width. Imaging sessions are spaced ~ 2 min apart, which gives interstimulus interval of ~ 2–3 min. Bars represent mean ± SD. (B) Time course of normalized ∆F/F for each ROI presented in (A) shows stability of response across time. (C, D) Box plots comparing pooled data of peak ∆F/F and temporal full width at half maximum (FWHM) (s) of transient traces in axons and dendrites. Here, FWHM is defined in the time domain as a measure of how long (in seconds) the transients persist before diffusive and dopamine transporter-mediated clearance. Mean ± SD: peak ∆F/F (%) in axons: 25.0 ± 8.3. In dendrites: 18.0 ± 9.3. Unpaired t-test: p<10–4. Temporal FWHM (s) in axons: 1.75 ± 1.20, in dendrites: 0.9 ± 0.7. Unpaired t-test: p<10–4. (E, F) Comparison of kinetics of transients in dendrites and axons shows dendritic activities have similar turn-on and clearance kinetics (τoff mean ± SD (s): 3.83 ± 0.8 for axons vs 3.51 ± 1.34 for dendrites, τpeak mean ± SD (s): 0.46 ± 0.16 vs 0.34 ± 0.11). Unpaired t-test: n.s.
Figure 5—figure supplement 5
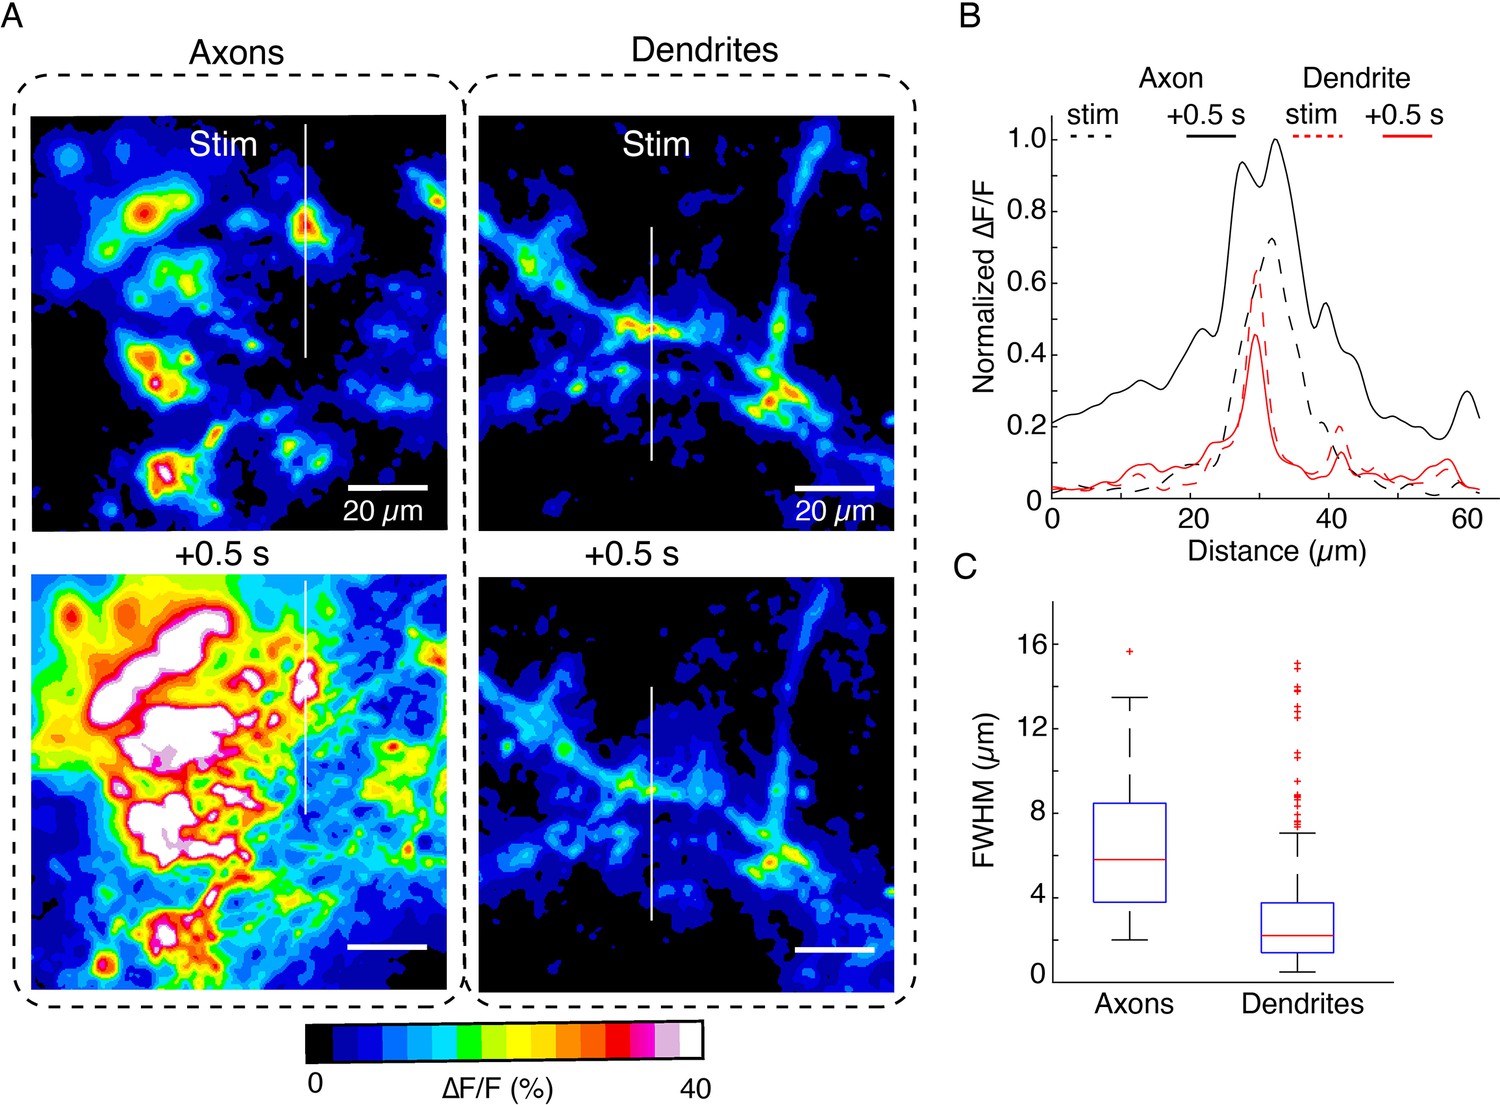
Comparison of spatiotemporal dynamics of DopaFilm hotspots in axonal arbors and dendritic processes after optical stimulation (evoked).
(A) Spatial spread of DopaFilm activity in an axonal arbor (left column) and dendritic arbor (right column). ∆F/F images are shown immediately following stimulation (stim, top row) and 0.5 s after stimulation (+ 0.5 s, bottom row). Notice the diffusive broadening of the signal in the axons, which occurs only to a limited extent in dendrites. (B) Line profiles along the white lines depicted on the images in (C). Dash lines represent profile immediately following stimulation (stim), and solid lines represent line profiles after 0.5 s has elapsed. ∆F/F is normalized to the peak ∆F/F observed in the axonal arbor. Notice the larger spatial extent of axonal release propagation over dendritic release. (C) Spatial full width at half maximum (FWHM) (µm) in axons vs dendrites. Mean ± SD; axons: 6.6 µm ± 3.6 µm; dendrites: 3.2 µm ± 3 µm. Unpaired t-test: p<10–4. Data is from n=32 dendritic processes pooled from n=12 dopamine neurons. For axons, we pooled data from n=6 axonal arbors. Boxplot definitions: red line = median, edges of box: 25th and 75th percentile, top and bottom hash lines: minimum and maximum values of non-outlier data, red points: outlier data.
Figure 5—figure supplement 6
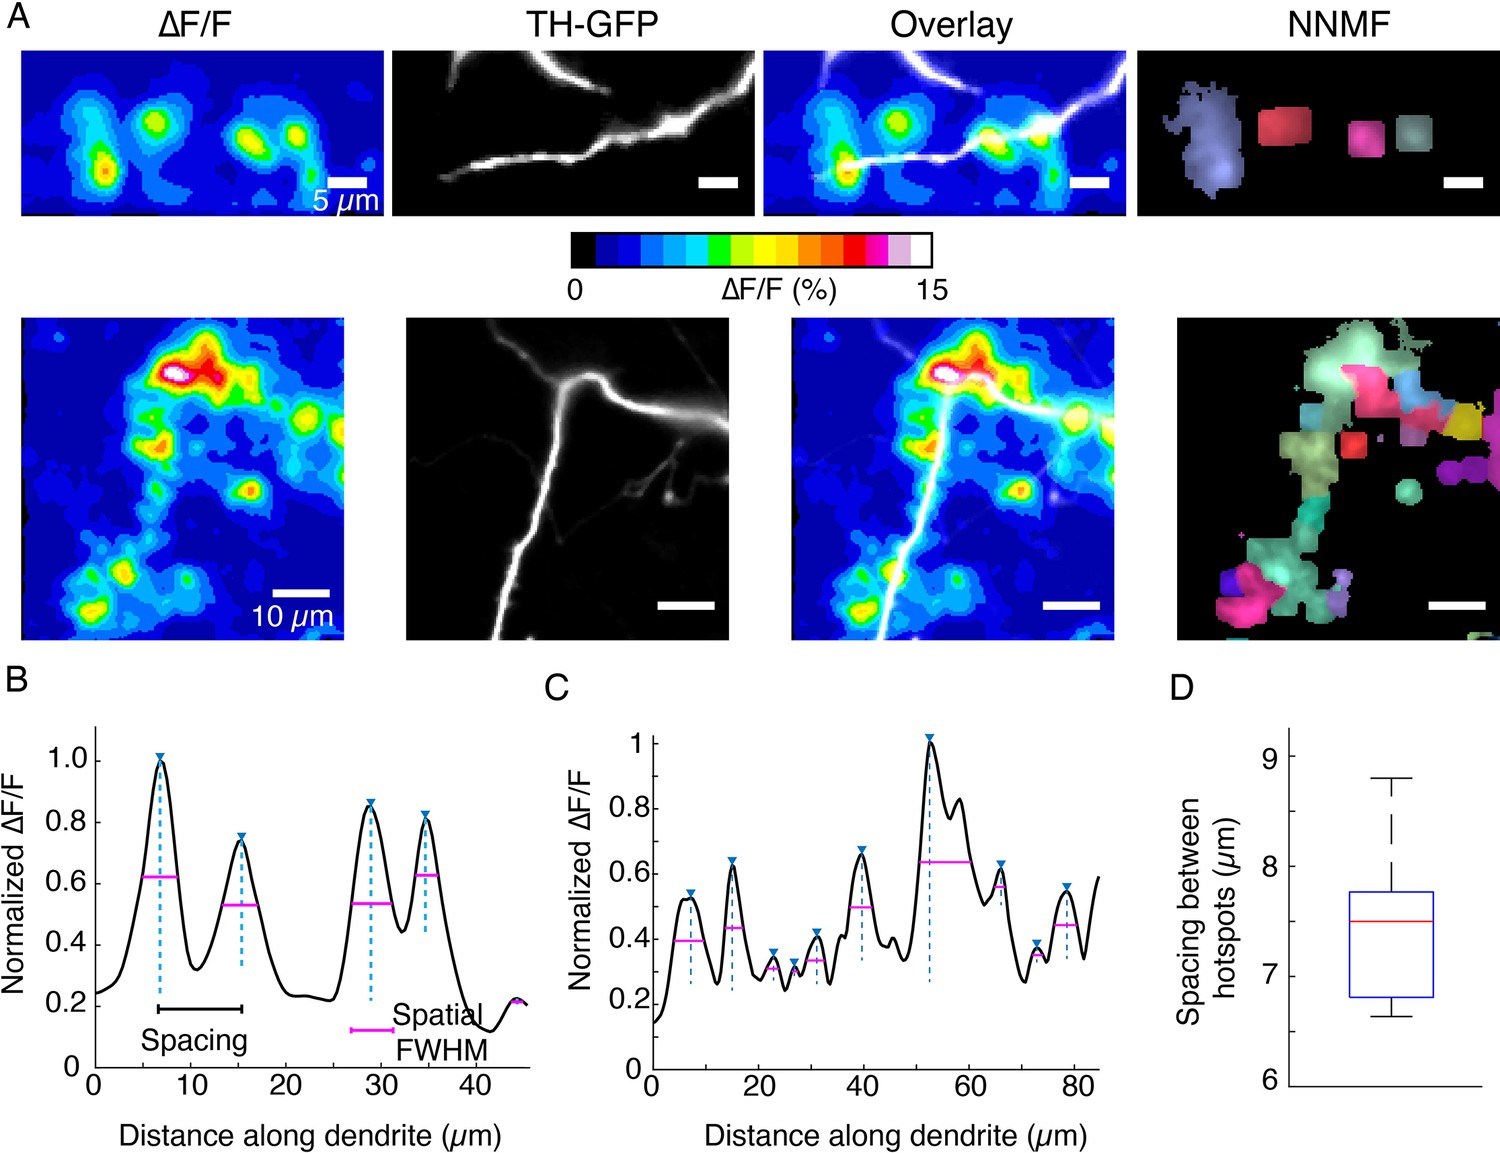
DopaFilm hotspot activity along dendritic processes.
(A) Top and bottom rows: ∆F/F, tyrosine hydroxylase-GFP (TH-GFP), and overlay. Right-most panels: non-negative matrix factorization (NNMF) decomposition of ∆F/F stack identifies clusters of pixels with highly correlated activity, consistent with the ∆F/F hotspots. (B, C) Line profiles of ∆F/F computed along the profile of the dendrites corresponding to the top and bottom rows in (A), respectively. Custom code identifies peaks, distance between peaks (spacing, black line segment), and the spatial extent of each signal, approximated by the full width at half maximum (FWHM; magenta line segment). (D) Box plot of spacing between hotspots observed on dendritic process. Box plot distribution for FWHM (µm) is shown in Figure 5—figure supplement 5C. Data is pooled from n=32 dendritic processes pooled from n=12 dopamine neurons. Boxplot definitions: red line = median, edges of box: 25th and 75th percentile, top and bottom hash lines: minimum and maximum values of non-outlier data.
Figure 5—figure supplement 7
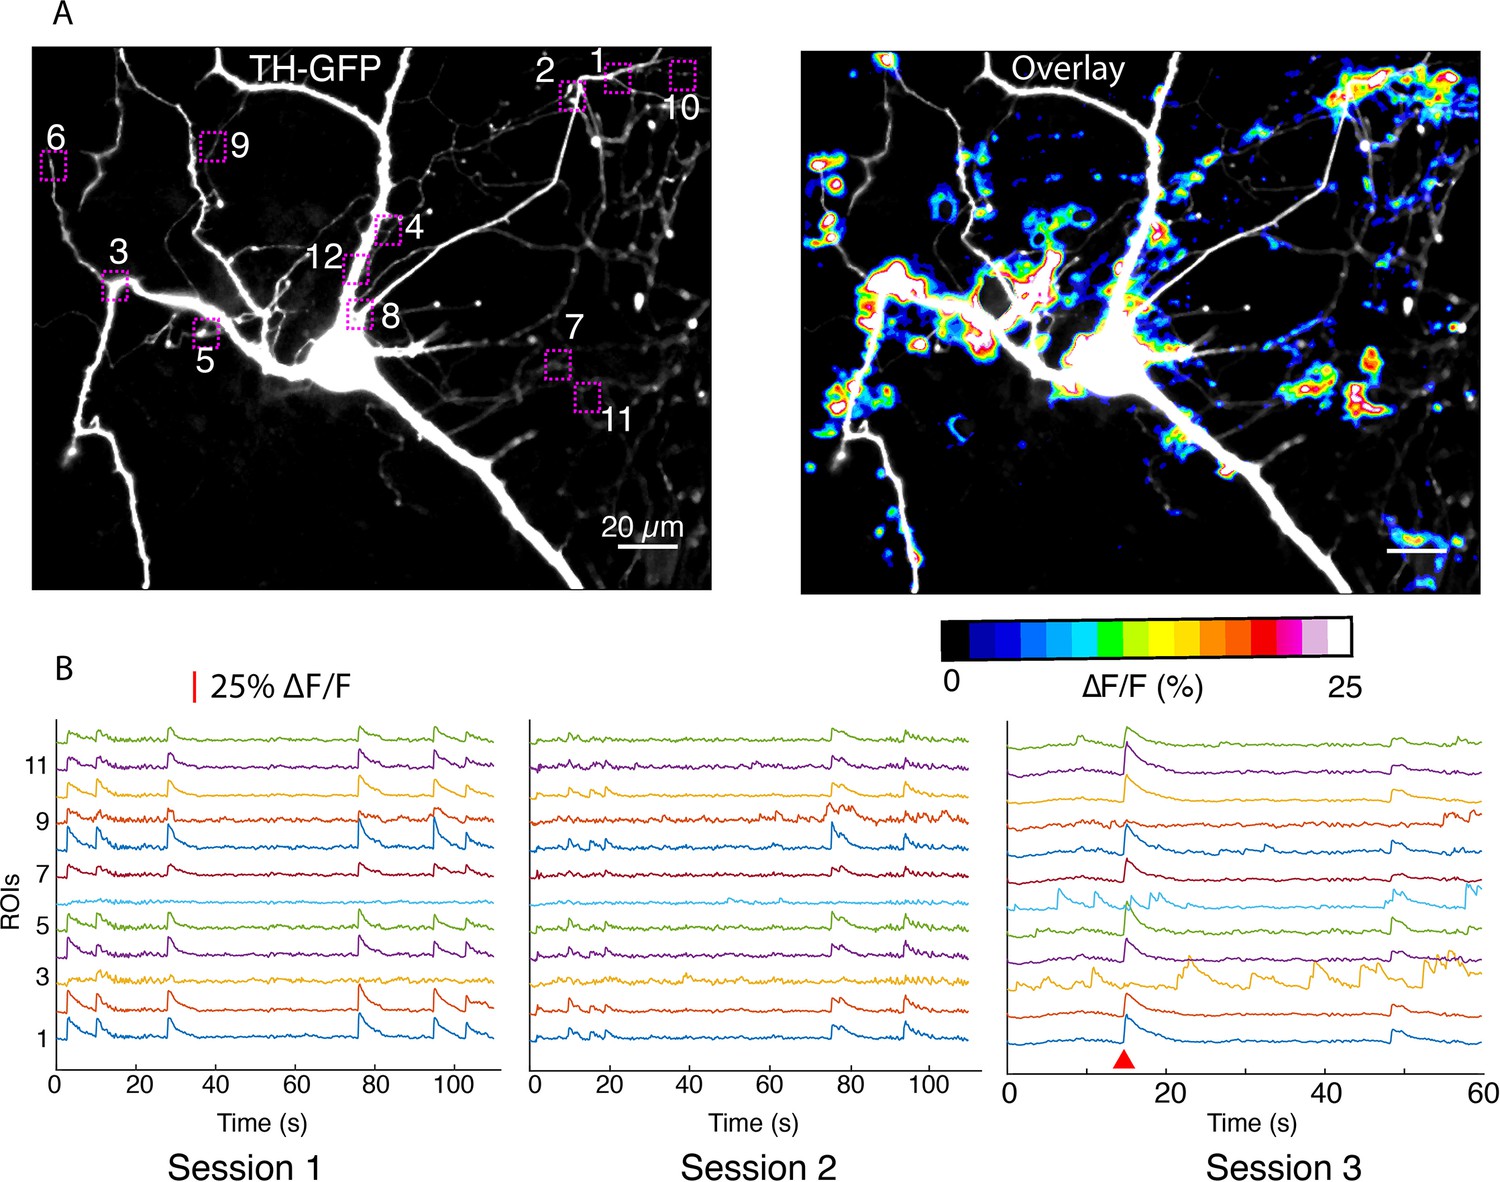
Imaging in dendritic processes of a dopamine neuron.
(A) Tyrosine hydroxylase-GFP (TH-GFP) image and its overlay with evoked ∆F/F DopaFilm activity image. (B) ∆F/F traces for the region of interest boxes numbered in (A) from n=5 imaging session (n=3 sessions shown here). Note that most activity is driven by autonomous spiking except where the red wedge indicates optical stimulus driven activity (in session #3).
Figure 5—animation 1
Evoked release from a dendritic process.
Figure 5—animation 2
Spontaneous activity from a dendritic process.
Figure 5—animation 3
Dendritic activity around soma of dopamine neuron.
Figure 6 with 2 supplements
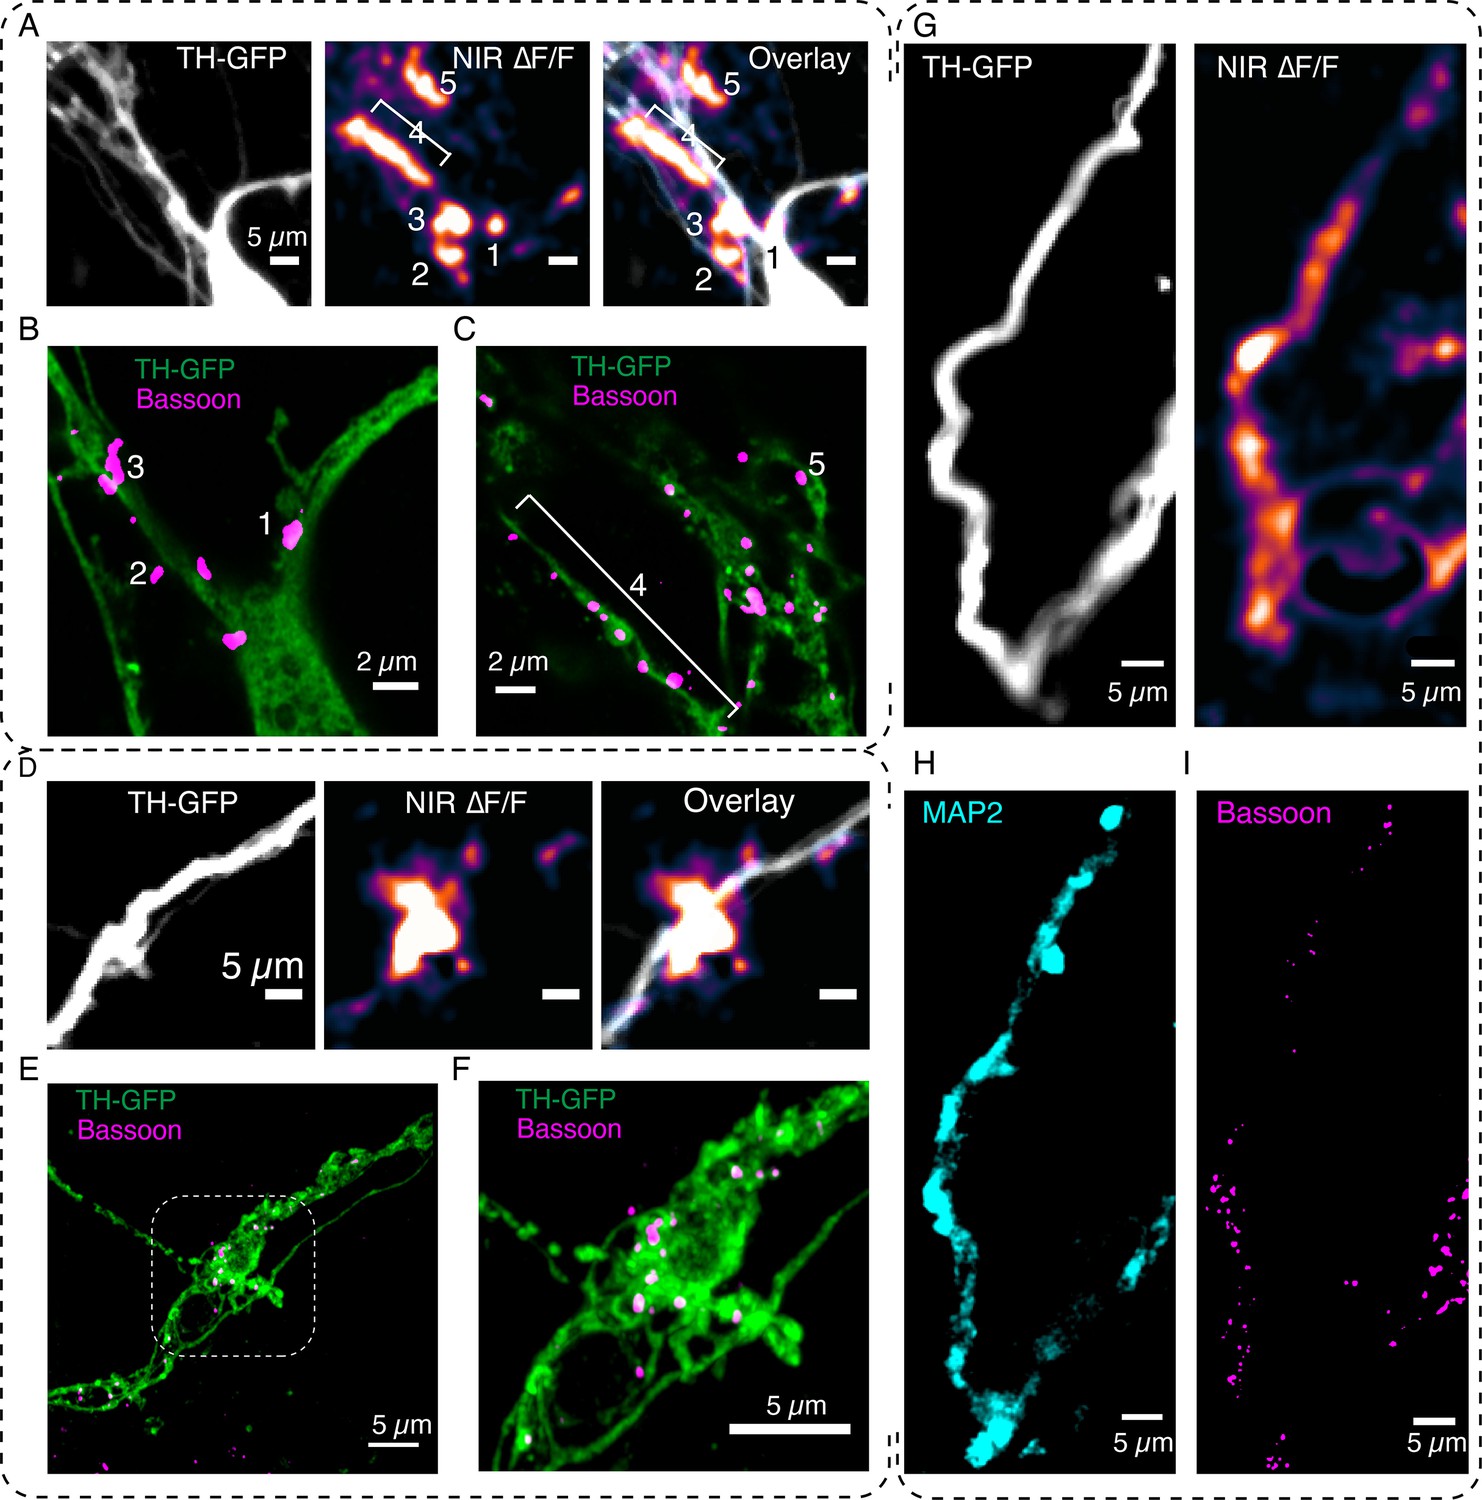
DopaFilm enables interrogation of the molecular correlates of dendritic release.
(A) DopaFilm peak ∆F/F activity overlayed with tyrosine hydroxylase-GFP (TH-GFP) image around soma of dopamine neuron. Near-infrared (NIR) ∆F/F image contrast set at 0–10% ∆F/F. (B, C) Airyscan super-resolution images corresponding to field of view (FOV) in (A). (D) Dendrite of dopamine neuron and its ∆F/F activity. NIR ∆F/F image contrast set at 0–10% ∆F/F. (E) Airyscan super-resolution images corresponding to FOV in (D). (F) Close-up of boxed region depicted in (E). (G–I) Activity from a dendritic process and its corresponding TH-GFP, MAP2, and Bassoon images. The NIR ∆F/F image contrast was set at 0–30% ∆F/F.
Figure 6—figure supplement 1
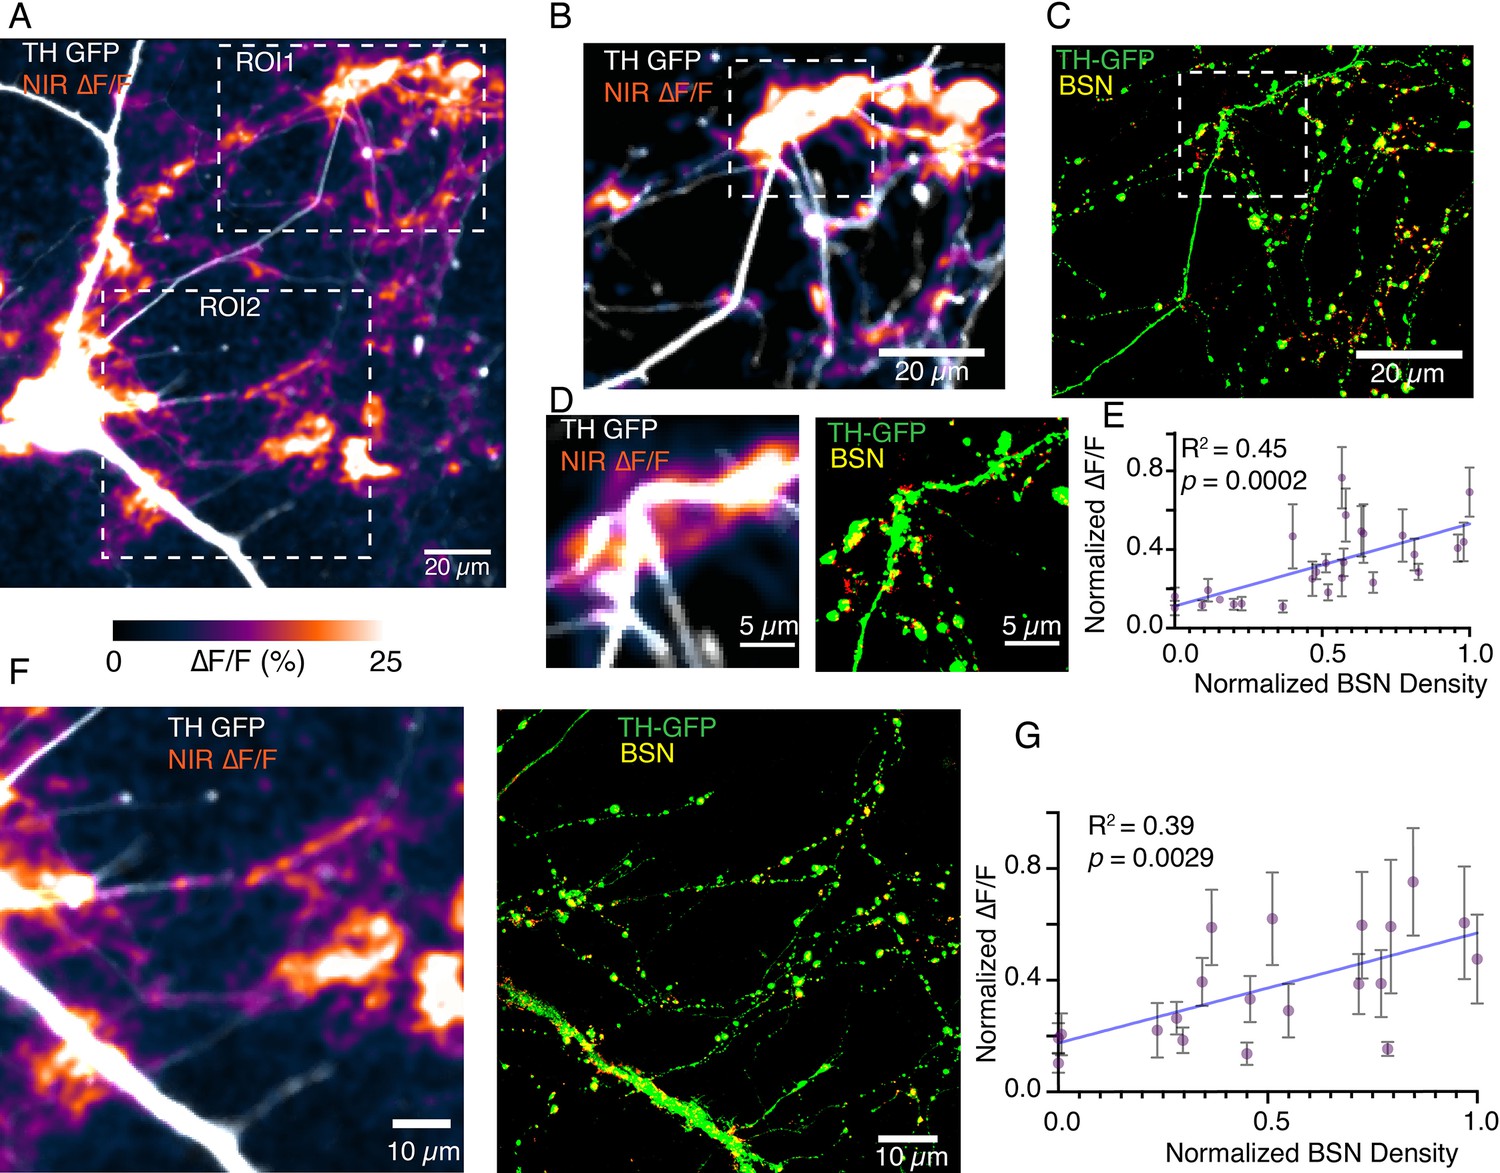
Bassoon puncta density correlates positively with DopaFilm ∆F/F activity.
(A) Tyrosine hydroxylase-GFP (TH-GFP) image and its overlay with evoked ∆F/F DopaFilm activity image. (B) and (C) Close-up of the region of interest 1 (ROI1) window depicted in (A). (C) Shows Airyscan image showing TH in green (TH-GFP) and Bassoon density in yellow (BSN). Red puncta indicate non-overlapping BSN densities from non-dopaminergic neurons in culture.(D) Close-up of the window depicted in (B) and (C) offers better visualization of overlap between BSN density and near-infrared (NIR) ∆F/F activity.(E) Plot of normalized ∆F/F activities recoded by DopaFilm vs normalized BSN densities for the field of view (FOV) shown in (B) and (C) (i.e. ROI1 in (A)). Each data point represents mean hotspot activity, and error bar represents SD from N=5 action potential driven release events. DopaFilm activities are normalized against the highest ∆F/F response and BSN densities are normalized against highest BSN density as measured by mean fluorescence units. Blue line represents fit from a simple linear regression against the mean values, with R2 and p-values of the fit indicated on chart. (F) and (G) Similar analysis applied to the ROI2 FOV depicted in (A).
Figure 6—figure supplement 2
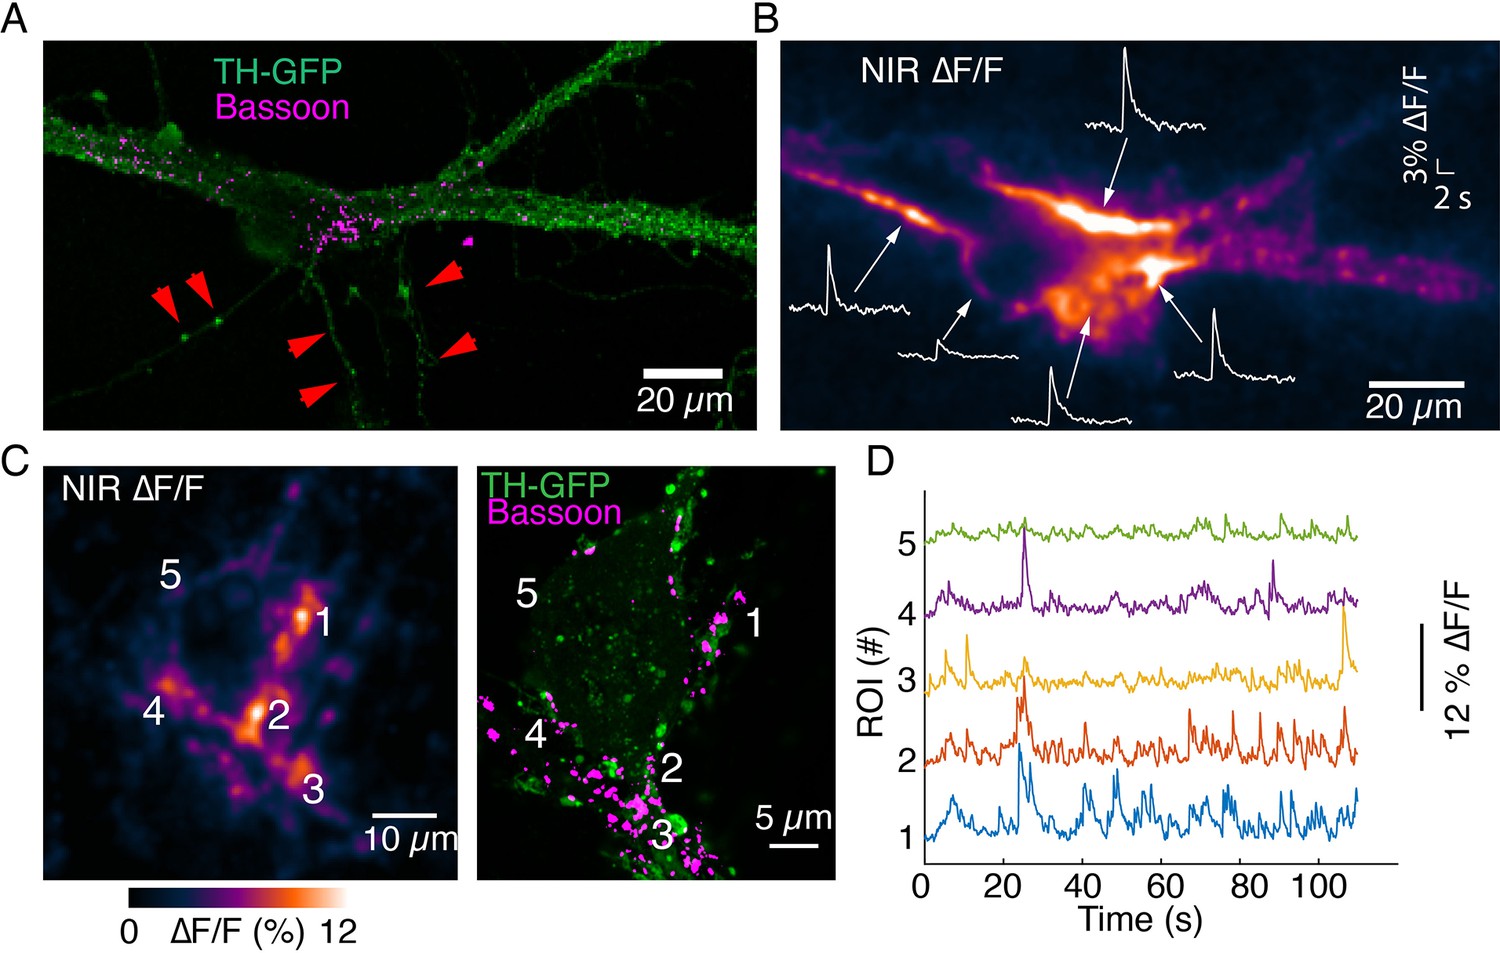
Imaging activity from proximal dendrites associated with the soma of dopamine neurons.
(A) Tyrosine hydroxylase-GFP (TH-GFP) image and Bassoon puncta on the major dendrites of a dopamine neuron. (B) ∆F/F activity evoked by optical stimulation. Notice activity arising from major dendritic trunks and at the junction of soma and major dendrites. Also notice lack of activity in processes that lack Bassoon puncta (depicted by red arrows in A). (C) Autonomous spiking activity around the soma of a dopamine neuron. Max ∆F/F projection is shown on left. Notice activity at the major dendrite leaving the cell body (around area depicted as region of interest [ROI] 3) and commingling dendrites (around area depicted as ROIs 1 and 4), both enriched in Bassoon puncta. ROI 5 exhibits reduced activity relative to ROIs 1–4 and has lower levels of Bassoon expression. (D) Activity traces corresponding to ROIs depicted in (C).
Figure 7
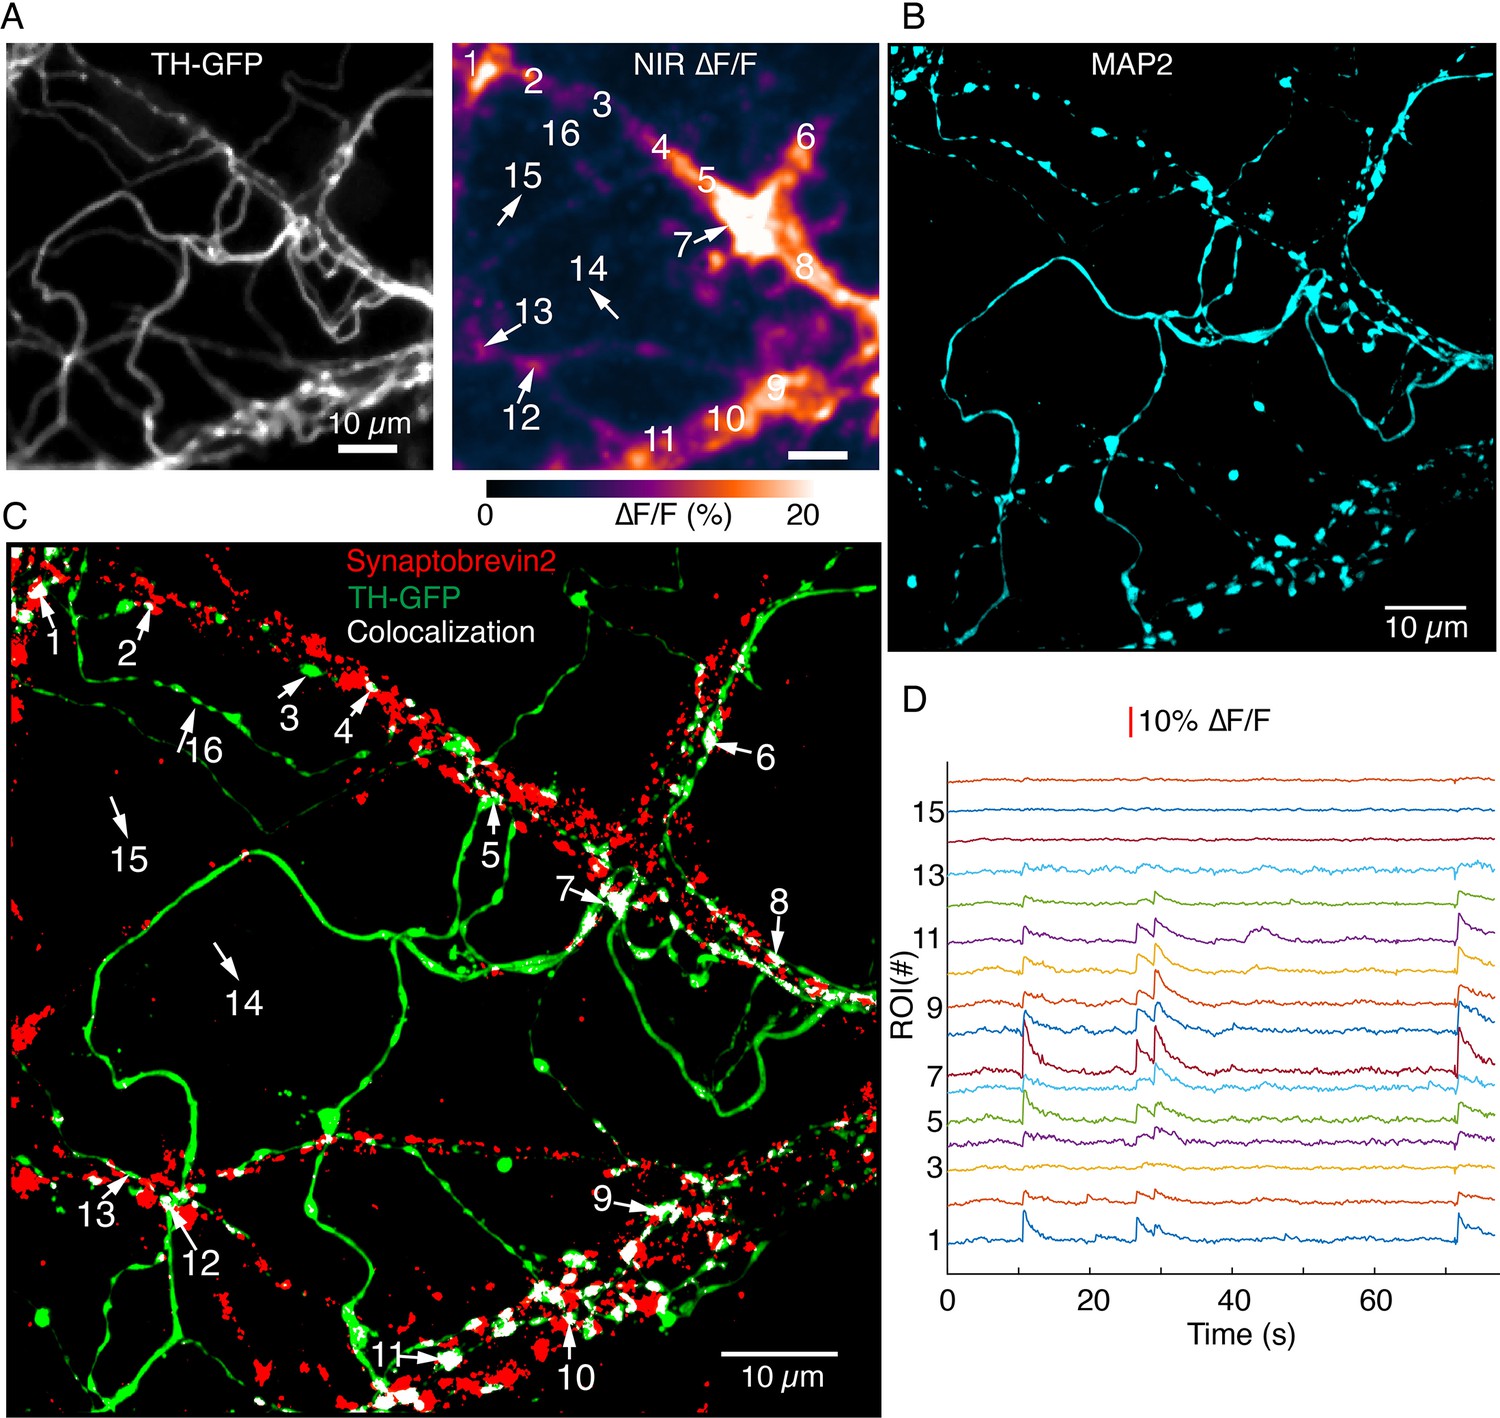
Synaptobrevin-2 is enriched at dendritic locations with high DopaFilm activity.
(A) DopaFilm activity image in a dendritic arbor of autonomously spiking dopamine neuron (i.e. no external stimuli applied). Soma not shown. (B) MAP2 Airyscan image of tyrosine hydroxylase-GFP (TH-GFP) field of view in (A) shows the dendritic nature of processes in (A). (C) Airyscan image of TH-GFP image in (A) showing double-staining for TH-GFP (green) and synaptobrevin-2 (red). Co-localized green and red puncta are color thresholded to display white. Red puncta that do not co-localize with TH-GFP are from non-dopaminergic neurons in the co-culture system. (D) ∆F/F traces of regions of interest (ROIs) 1–15 depicted in (A) and (C). Notice that segments that have no synaptorevin-2 signal exhibit no DopaFilm activity (examples: ROIs 3, 14, 15, and 16).
Tables
Key resources table
| Reagent type (species) or resource | Designation | Source or reference | Identifiers | Additional information |
|---|---|---|---|---|
| Strain, strain background (Rattus norvegicus) | Sprague Dawley | Charles River | Strain code: 001 | |
| Antibody | Anti-tyrosine hydroxylase (chicken polyclonal) | Aves Labs | TYH 6767979 | Dilution factor (1:1000) |
| Antibody | Anti-tyrosine hydroxylase (rabbit polyclonal) | Abcam | ab112 | Dilution factor (1:2000) |
| Antibody | Anti-tyrosine hydroxylase (mouse monoclonal) | Sigma-Aldrich | T2928 | Dilution factor (1:2000) |
| Antibody | Anti-Bassoon (mouse monoclonal) | Abcam | ab82958 | Dilution factor (1:2000) |
| Antibody | Anti-MAP2 (chicken polyclonal) | Novus Biologicals | NB300-213 | Dilution factor (1:1000) |
| Antibody | Anti-GFP (rabbit polyclonal) | Chromtek | PABG1 | Dilution factor (1:2000) |
| Antibody | Anti-synaptobrevin 2 (guinea pig monoclonal) | Synaptic Systems | SySy 104 318 | Dilution factor (1:1000) |
| Antibody | Brilliant Violet 421 AffiniPure (donkey anti-chicken polyclonal) | Jackson Immunoreseach Labs | 703-675-155 | Dilution factor (1:1000) |
| Antibody | Highly cross-adsorbed secondary antibody, Alexa Fluor 488 (goat anti-rabbit polyclonal) | Invitrogen | A11034 | Dilution factor (1:2000) |
| Antibody | Highly cross-adsorbed secondary antibody, Alexa Fluor 647 (goat anti-mouse polyclonal) | Invitrogen | A21236 | Dilution factor (1:2000) |
| Antibody | Highly cross-adsorbed secondary antibody, Alexa Fluor 647 (goat anti-guinea pig polyclonal) | Invitrogen | A21450 | Dilution factor (1:2000) |
| Antibody | Recombinant secondary antibody, Alexa Fluor Plus 647 (goat anti-rabbit polyclonal) | Invitrogen | A55055 | Dilution factor (1:2000) |
| Other | pAAV2.5-TH-GFP | Addgene | #80,336 | Adeno-associated virus (AAV) |
| Other | pAAV-Syn-ChrimsonR-tdT | Addgene | #59,171 | Adeno-associated virus (AAV) |
| Chemical compound, drug | APTES | Sigma-Aldrich | 440,140 | CAS: 919-30-2 |
| Chemical compound, drug | HiPco RAW single walled carbon nanotubes | Nanointegris | Batch #HR34-103 | |
| Sequence-based reagent | 5'-GTG TGT GTG TGT-3' oligonucleotide | Integrated DNA technologies | Standard Desalted | |
| Chemical compound, drug | Poly(D-lysine) | Sigma-Aldrich | P6407 | |
| Chemical compound, drug | NBQX disodium salt | Tocris | 1044 | CAS:479347-86-9 |
| Chemical compound, drug | Dopamine hydrochloride | Sigma-Aldrich | H8502 | CAS:62-31-7 |
| Chemical compound, drug | D-AP5 | Tocris | 0106 | CAS: 79055-68-8 |
| Chemical compound, drug | TTX | Tocris | 1078 | CAS: 4368-28-9 |
| Chemical compound, drug | Nomifensine maleate salt | Sigma-Aldrich | N1530 | CAS: 32795-47-4 |
| Chemical compound, drug | Triton X-100 | Millipore Sigma | T8787 | |
| Software, algorithm | MATLAB | R2020b | ||
| Software, algorithm | Fiji | 2.0.0-rc-59/1.51 k | See Ref 74 | |
| Software, algorithm | µManager | Version 1.4 | See Ref 73 |
Additional files
Download links
A two-part list of links to download the article, or parts of the article, in various formats.
Downloads (link to download the article as PDF)
Open citations (links to open the citations from this article in various online reference manager services)
Cite this article (links to download the citations from this article in formats compatible with various reference manager tools)
Visualizing synaptic dopamine efflux with a 2D composite nanofilm
eLife 11:e78773.
https://doi.org/10.7554/eLife.78773


