High-resolution species assignment of Anopheles mosquitoes using k-mer distances on targeted sequences
- Department of Genetics, University of Cambridge, United Kingdom
- Wellcome Sanger Institute, United Kingdom
- Institut de Recherche pour le Développement, MIVEGEC, Univ. Montpellier, CNRS, IRD, France
- Institut de Recherche en Sciences de la Santé, Direction Régionale de l'Ouest, Burkina Faso
- Federal University of Agriculture Abeokuta, Nigeria
- Institut de Recherche en Ecologie Tropicale, Gabon
- Centre International de Recherches Medicales de Franceville, Gabon
- Centre for Applied Entomology and Parasitology, Keele University, United Kingdom
Figures
Figure 1 with 1 supplement

Lower triangle: heatmap of 8-mer distances between pairs of samples in the reference database.
Samples are on the x- and y-axis, roughly ordered by phylogeny and labelled with their consensus species label. Dark colours correspond to small 8-mer distances and light colours to larger 8-mer distances. Upper triangle: species-groups at fine, intermediate and coarse levels (see main text for definitions of these).
Figure 1—figure supplement 1

Thresholds used to define species-groups.
From top to bottom, the thresholds are 0.1, 0.3, and 0.51 and they are used to define the fine, intermediate, and coarse level species groups, respectively. The samples from the reference database are along the x- and y-axis in the same order as in Figure 1. The entries in the heatmap are coloured peach if the 8-mer distance between the corresponding samples is less than the threshold and black if it is greater or equal the threshold. The orange squares in all three panels correspond to fine level species-groups, the yellow squares in the middle and lower panel to intermediate level species-groups and the olive squares in the lower panel to coarse level species-groups.
Figure 2
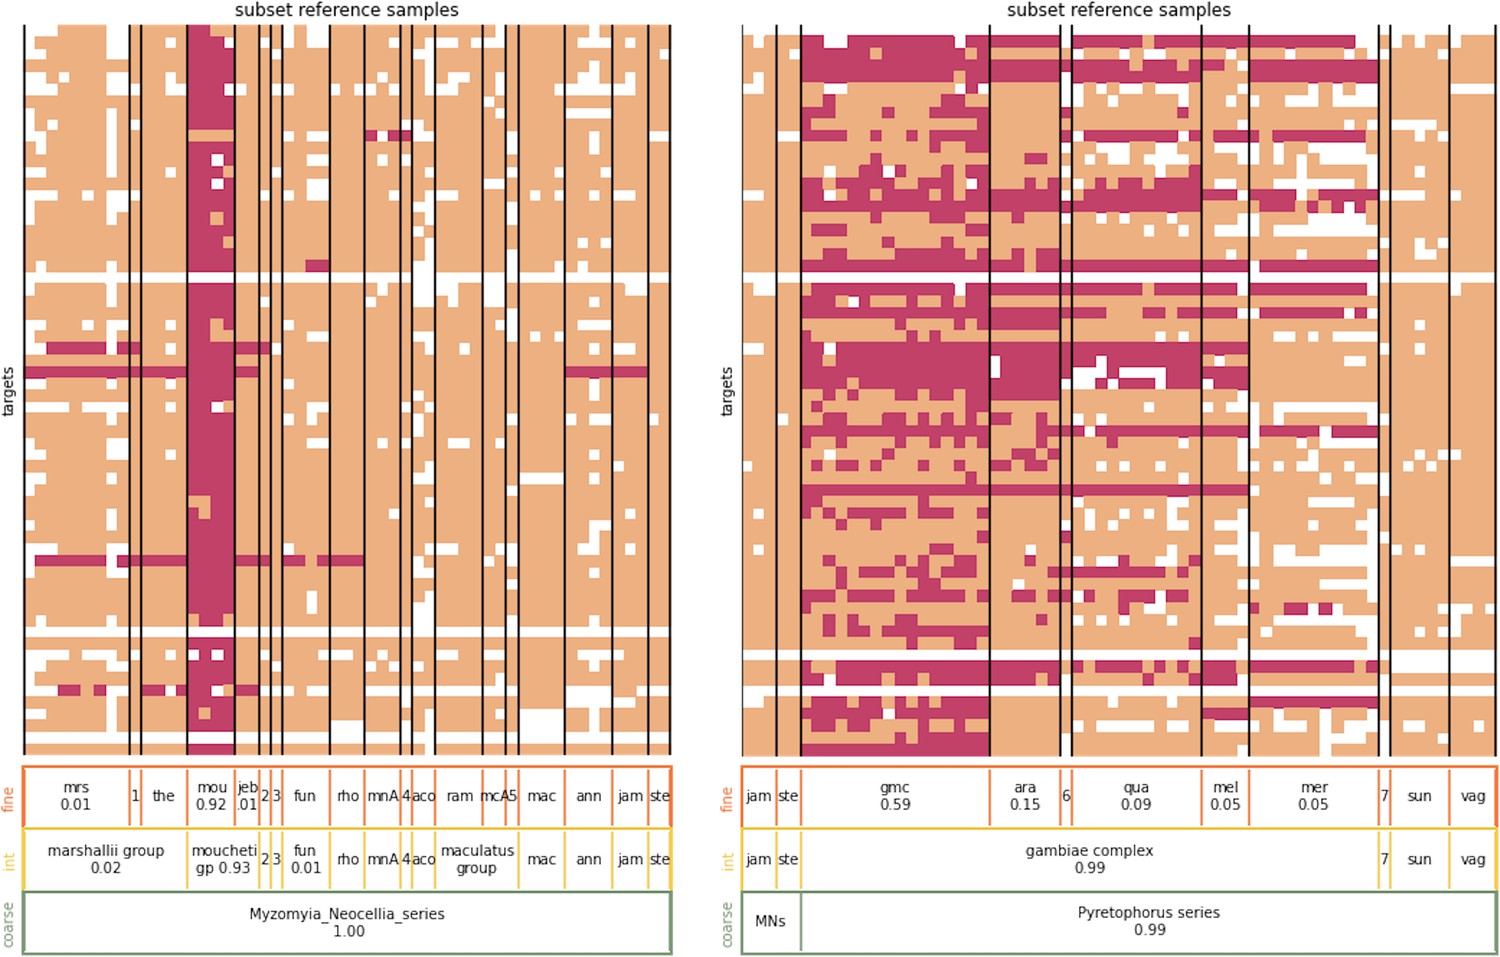
Nearest neighbour assignment example.
Left panel: The heatmap shows the nearest neighbours of sample Amou-2–3, an An. moucheti specimen, at its different targets. For clarity, not all samples in the reference database have been displayed, only those in the Myzomyia and Neocellia series (except Amou-2–3). The samples from the reference database are arranged along the x-axis and the targets along the y-axis. An entry is coloured pink if the corresponding sample from the reference database has a nearest neighbour sequence at the corresponding target. Peach entries indicate that the corresponding sample from the reference database does not carry a nearest neighbour sequence at the corresponding target. If either the test sample or the reference sample did not amplify at the corresponding target, the entry is white. The bars at the bottom show the overall assignment proportions for the displayed species-groups, only assignment proportions of at least 1% are shown. From top to bottom the assignment proportions are for the fine, intermediate,, and coarse level. For the three-letter code abbreviations of species-groups, see Supplementary file 1. The numeric abbreviations stand for 1: An. marshallii complex sp1, 2: Myzomyia sp1, 3: An. gabonensis, 4: An. culicifacies, 5: An. maculatus B; none of these species-groups represent more than 1% of the assignment. Right panel: The heatmap showing the nearest neighbours of sample Agam-35, an An. gambiae specimen. Not all samples in the reference database are displayed, only those in the Pyretophorus series (except Agam-35) as well as five samples from the Neocellia series. The numeric abbreviations stand for 6: An. gambiae complex sp1 (0.06 assignment proportion), 7: An. christyi and MNs stands for Myzomyia_Neocellia_series.
Figure 3 with 1 supplement
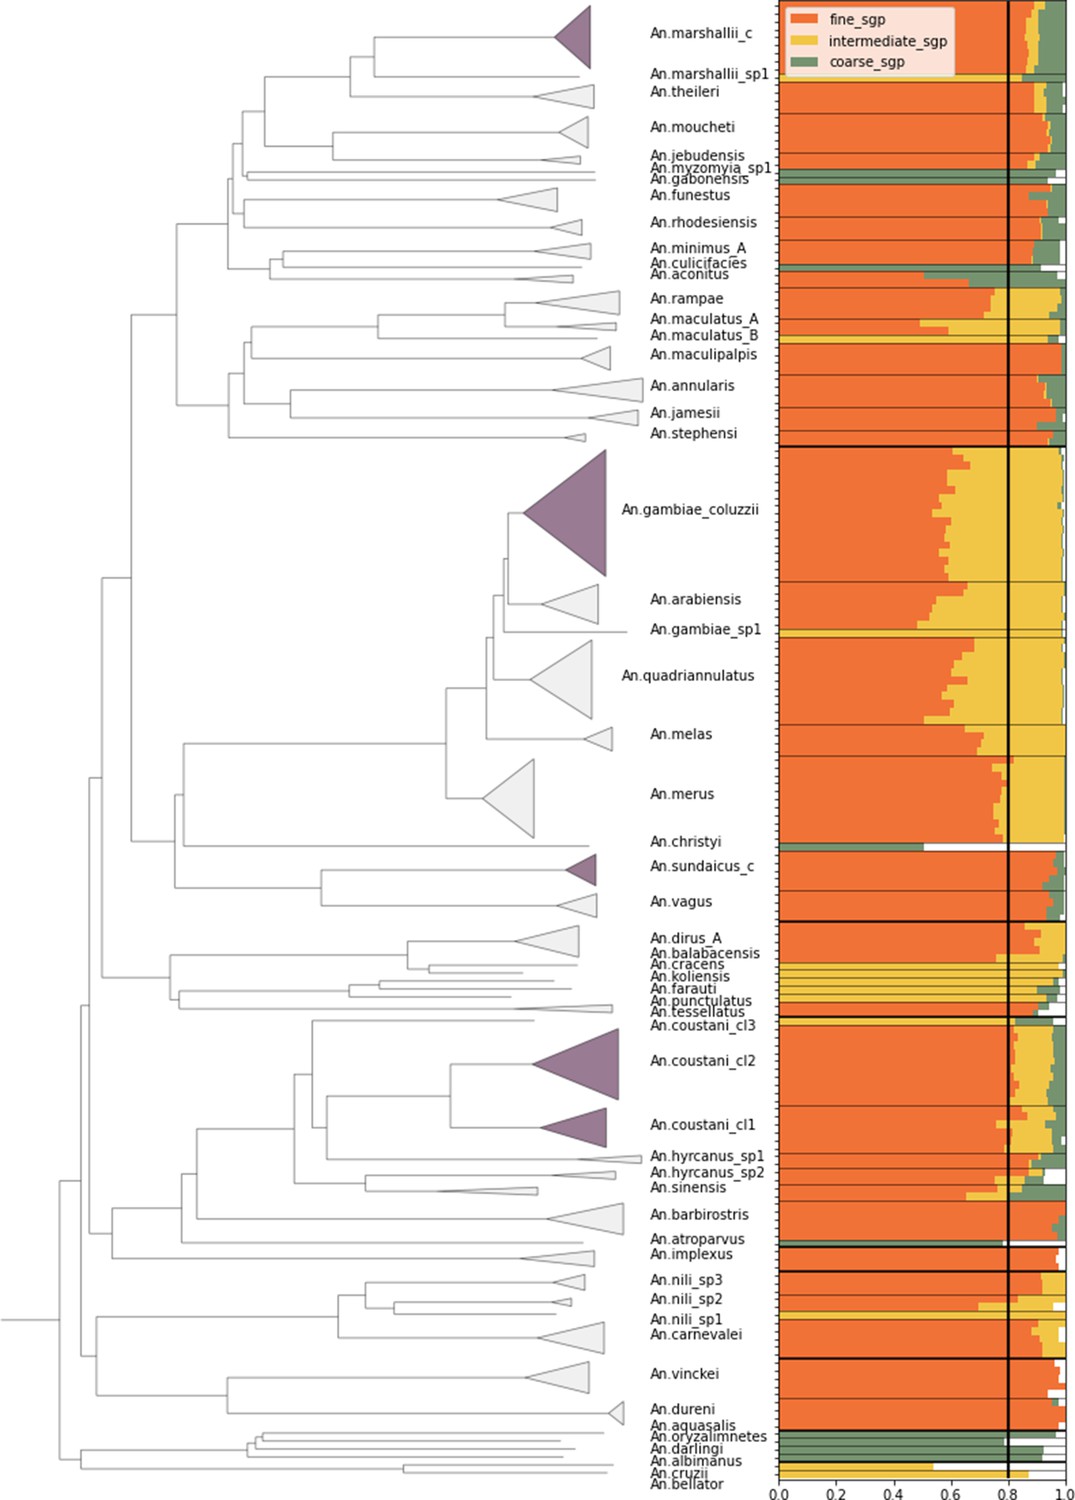
Species-group assignment accuracy on reference database NNv1.
Samples were dropped out of the database one at a time to test the assignment accuracy. Left: phylogenetic tree of the samples in the reference database NNv1 constructed from pairwise 8-mer distances using fastme. Samples are labelled by their fine level species-group label. Dark-shaded clades are instances of species-groups that contain more than one species. Right: Samples are placed along the vertical axis, ordered by the species tree. The bars represent the assignment proportion to the correct species-group and the colours indicate the species-group level. As an example, the first sample is assigned to the correct species-group with a proportion of 0.88 at the fine level, with a proportion of 0.91 at the intermediate level and with a proportion of 0.99 at the coarse level. The thin horizontal lines indicate the different species-groups at the fine level and the thick horizontal lines at the coarse level. The separation of the species-groups at the intermediate level has not been displayed for clarity. The vertical line represents the assignment threshold of 0.8.
Figure 3—figure supplement 1
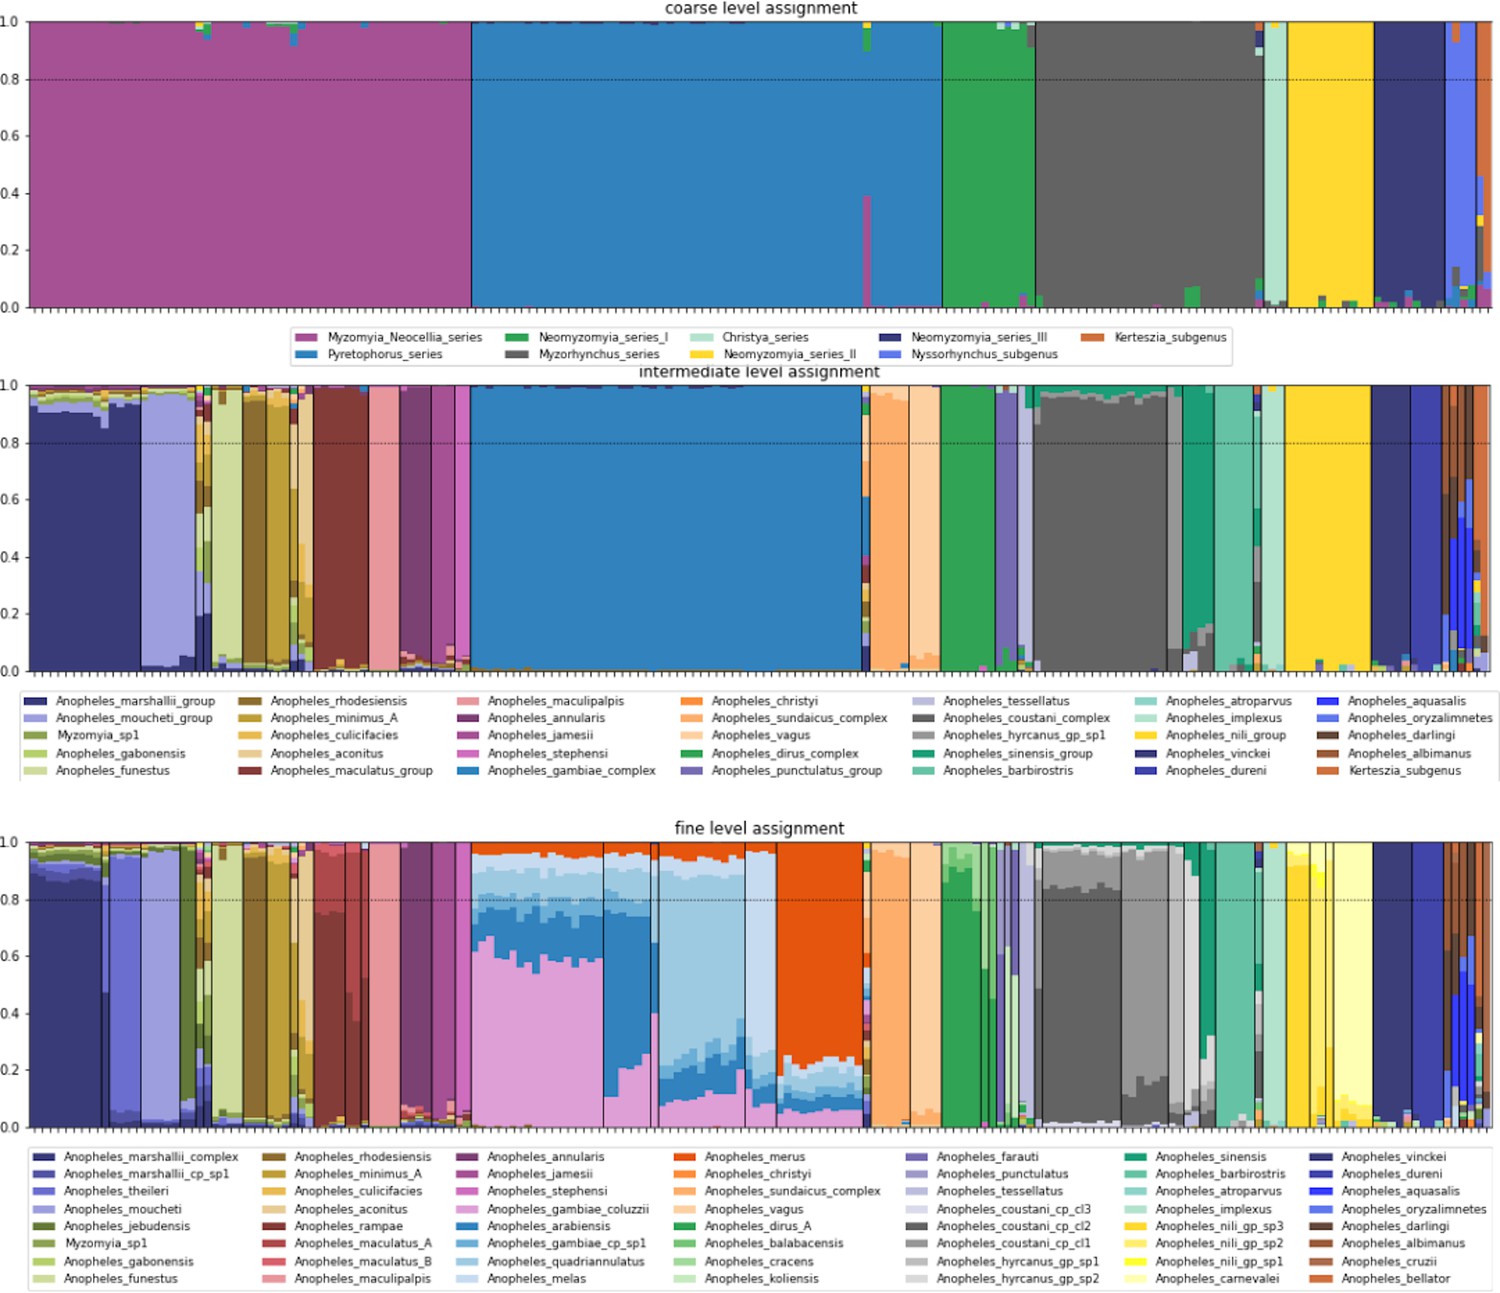
Species-group assignment proportions.
From top to bottom at the coarse, intermediate and fine level. Samples are ordered along the x-axis in the same order as the tree in Figure 3. For each sample, the overall assignment proportions are plotted as a bar, with colours indicating the species-groups. A sample has to have an assignment proportion of at least 0.8 for a certain species-group to be classified as a member of that species-group, else it remains unassigned. Vertical bars separate the different species-groups. The horizontal bar represents the 0.8 assignment threshold (but note that the assignment proportions are plotted in the same order for every sample, not from largest to smallest).
Figure 4

VAE projection of the gambiae complex reference dataset GCref v1.
Top panels: the samples are represented by dots at the inferred mean position in three-dimensional latent space and coloured by their species label. The left panel shows latent dimension 1 versus latent dimension 2 and the right panel shows latent dimension 1 versus latent dimension 3. Bottom panel: the same projection as above, but here the samples are coloured by the country of collection revealing structure related to geography.
Figure 5
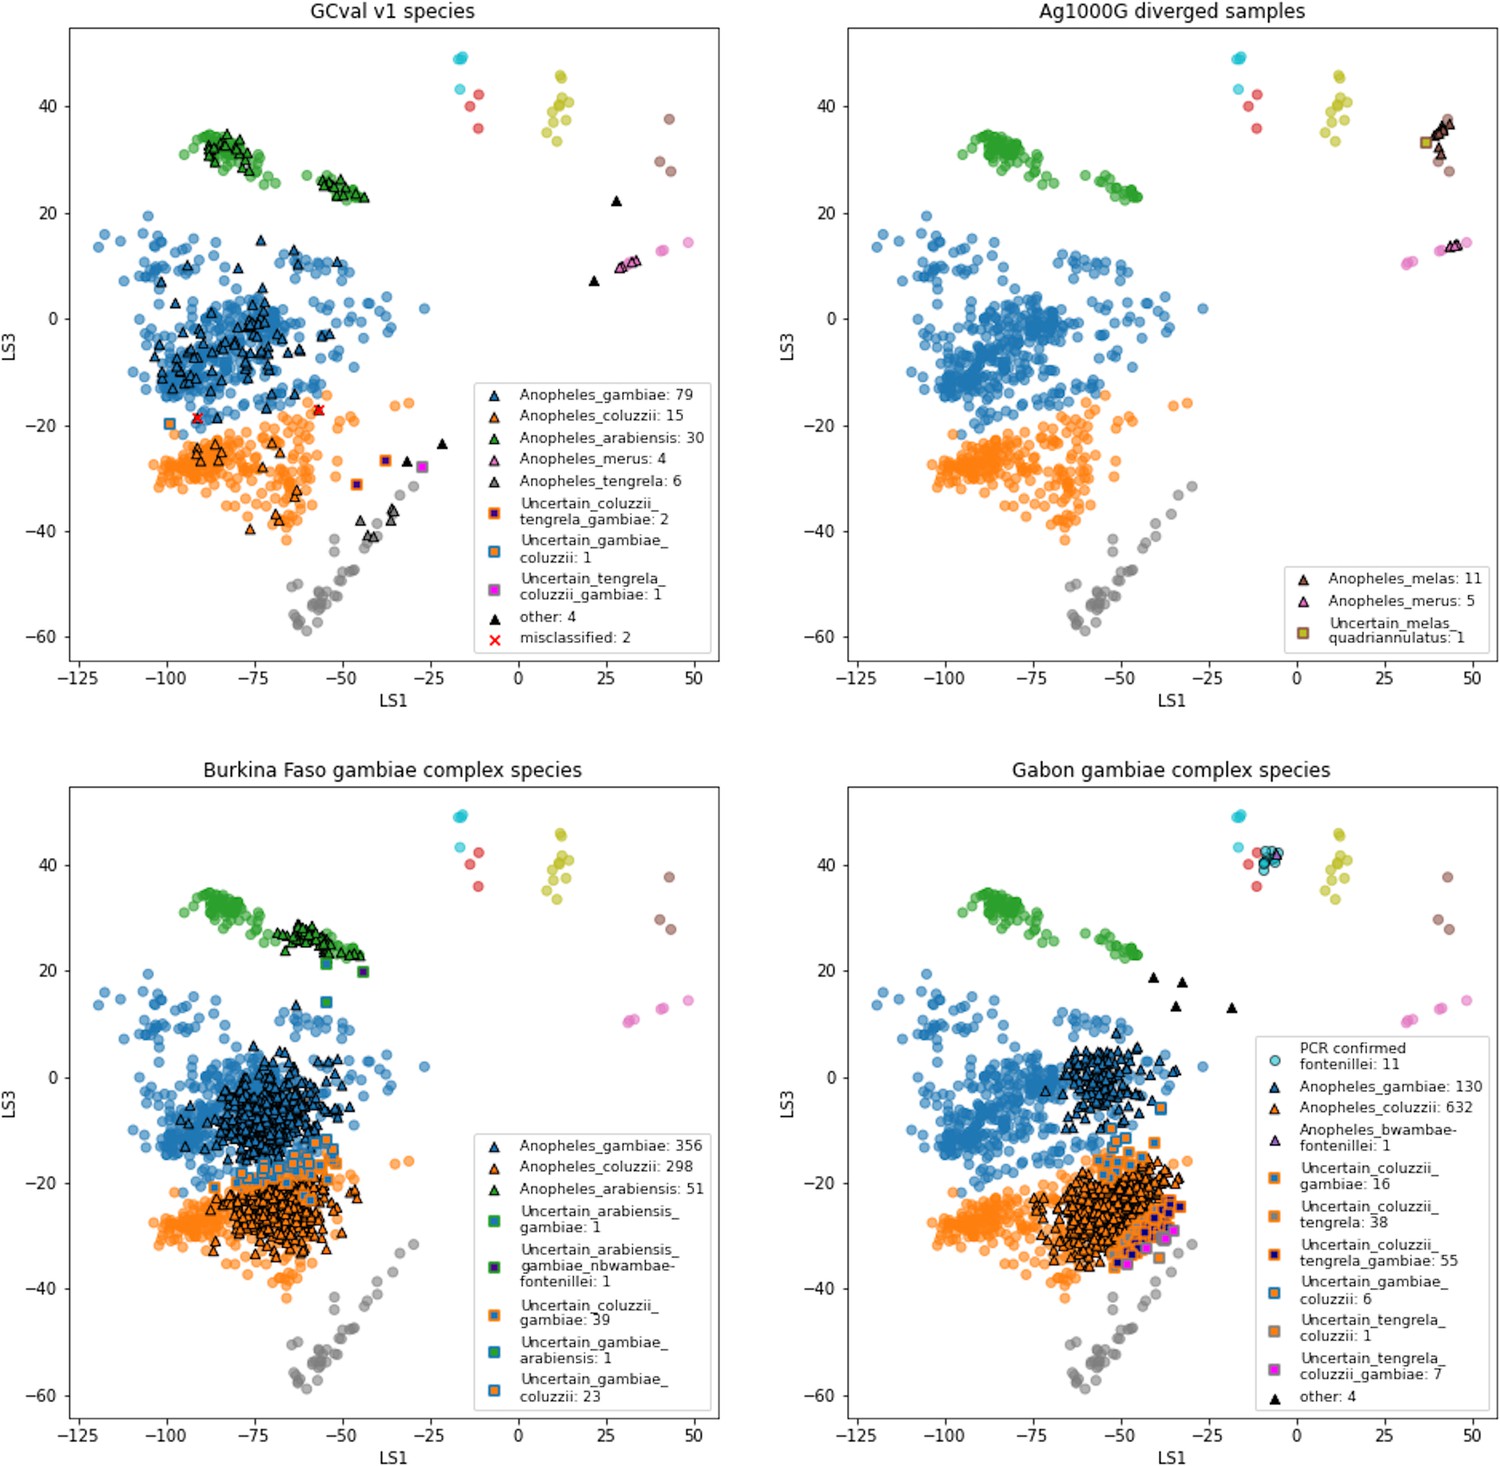
VAE projections of (A) validation set GCval v1 (B) diverged samples from Ag1000G (C) sample set from Burkina Faso (D) sample set from Gabon.
The samples from the reference set GCref v1 are displayed as half transparent circles, coloured by species as in Figure 4. The samples from each of the projected sample sets are coloured by their assigned labels. The numbers behind each label corresponds to the number of samples in that category. Samples with more than 3 species-labels are listed as ‘other’. The two samples from GCval v1 for which the species label does not match the assigned species are marked with a red cross.
Appendix 2—figure 1
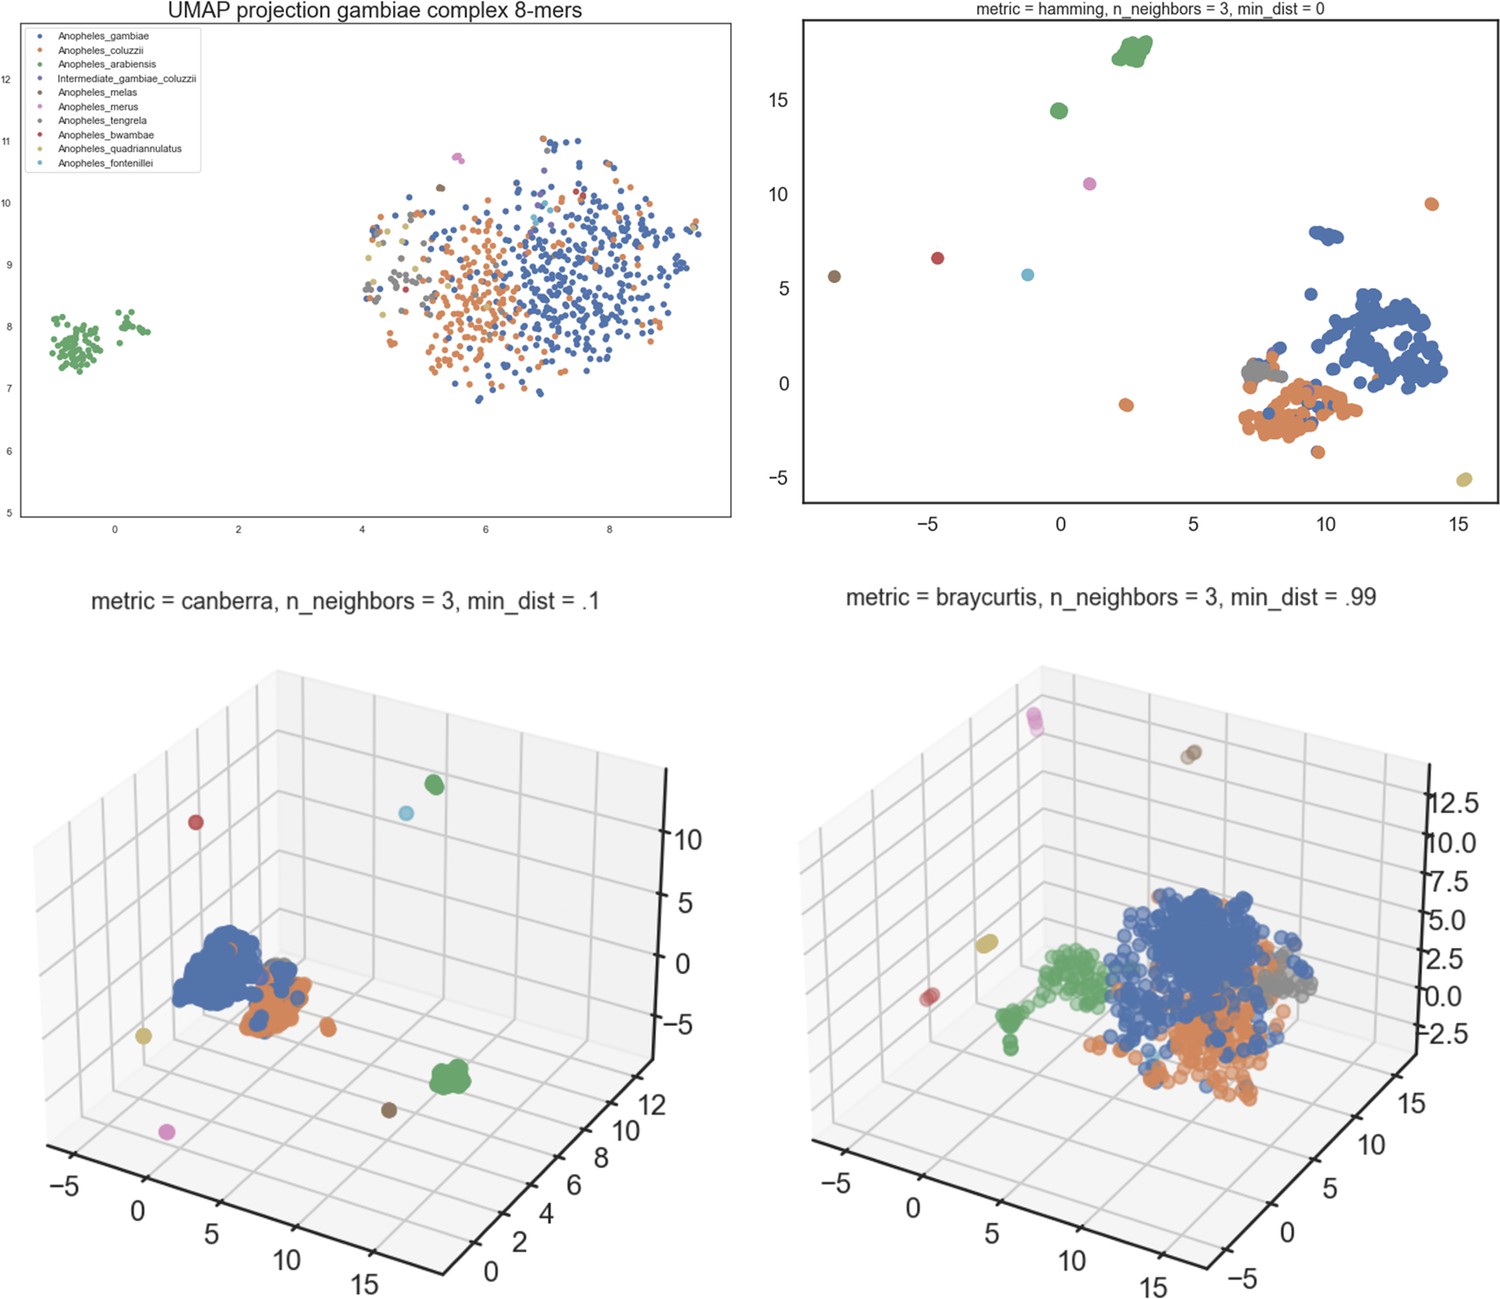
UMAP run on 8-mer count table of An.
gambiae complex dataset GCref v1. Left top is using the default UMAP settings, for the other three projections, the settings are specified in the title. UMAP was run unsupervised; the samples are coloured by their species labels after projecting them.
Appendix 3—figure 1
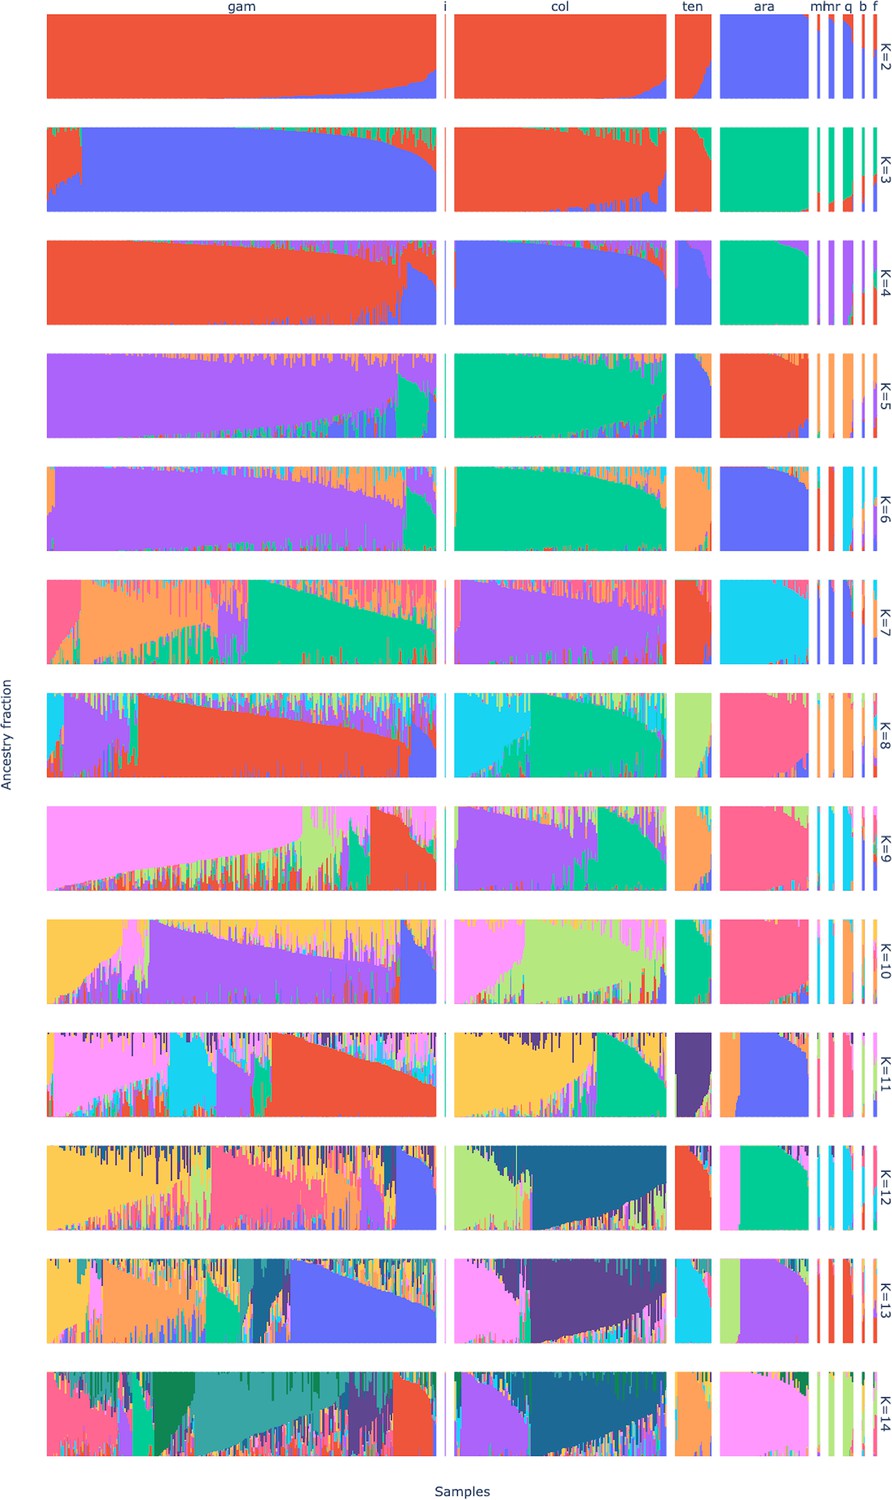
Admixture fractions of the GCref v1 samples for K from 2 to 14.
The samples are ordered by species, from left to right An. gambiae, Agamp4 reference genome, An. coluzzii, An. tengrela, An. arabiensis, An. melas, An. merus, An. quadriannulatus, An. bwambae and An. fontenillei. The samples within a species are ordered by ancestry fraction and the within species ordering is not the same between rows.
Appendix 3—figure 2
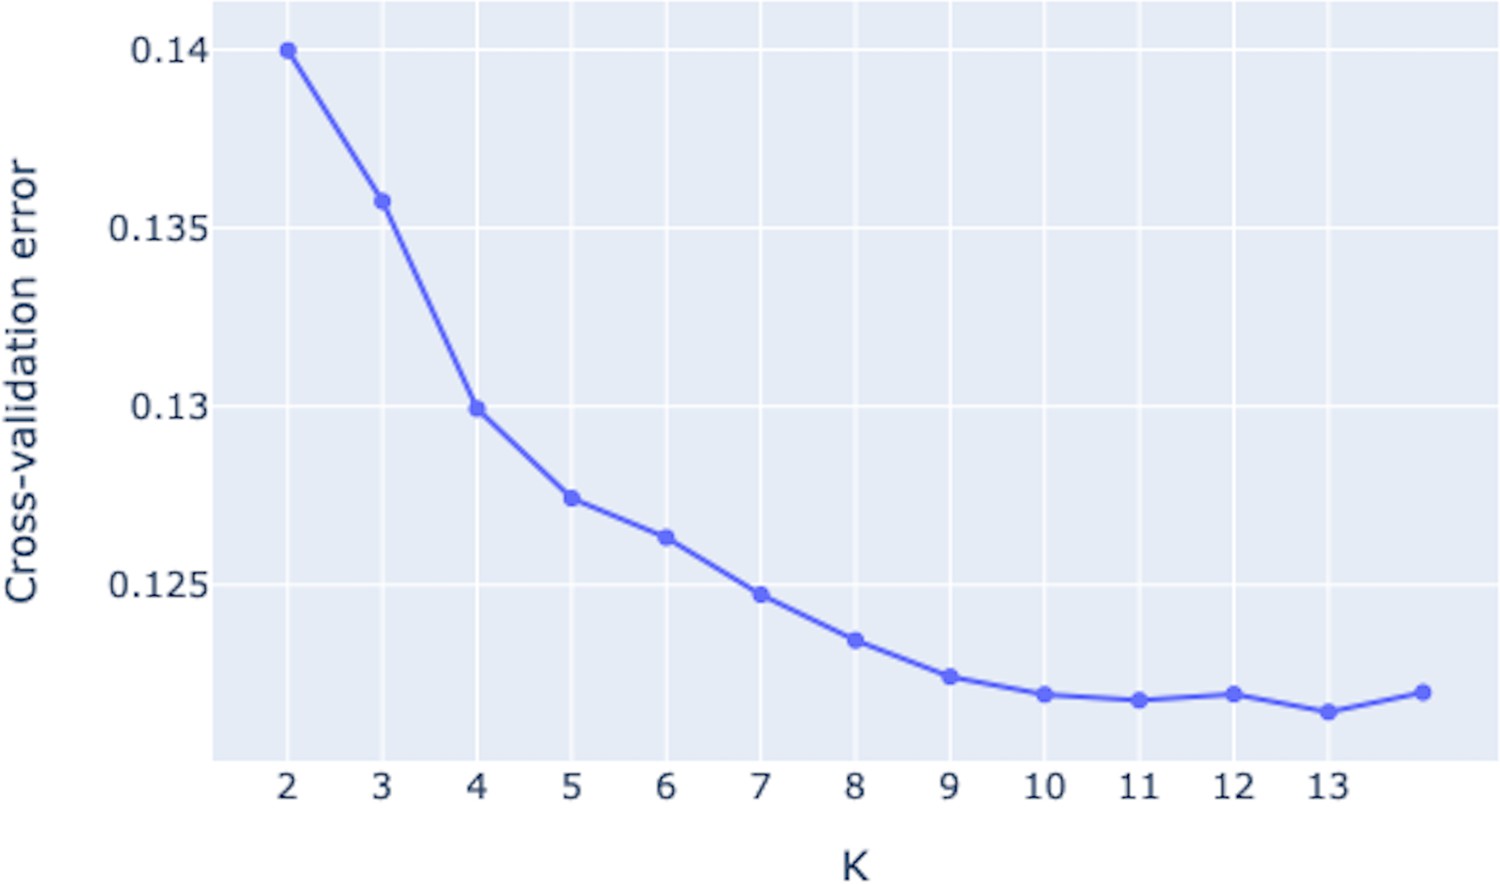
Cross-validation error for different values of K.
Only one replicate shown.
Appendix 4—figure 1
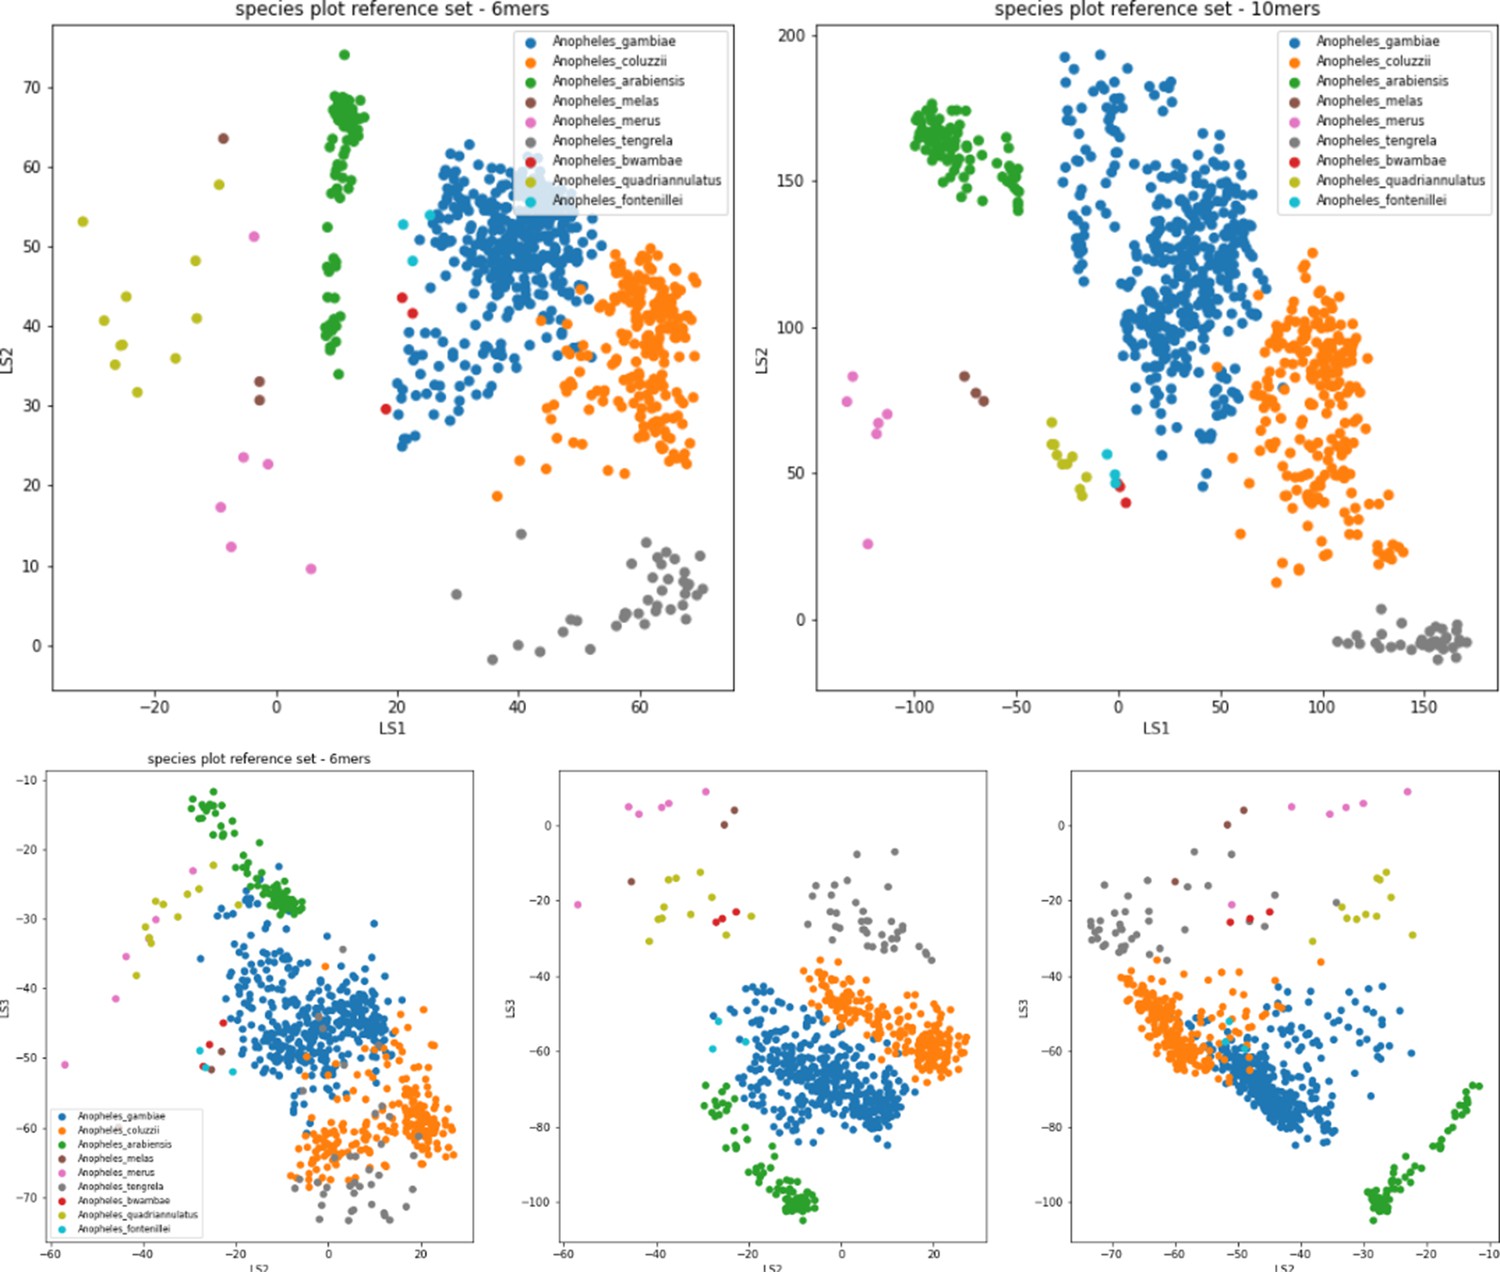
VAE projection of GCref v1 in two dimensions (top) using 6-mers (left) and 10-mers (right) and in three dimensions using 6-mers (bottom).
Appendix 5—figure 1
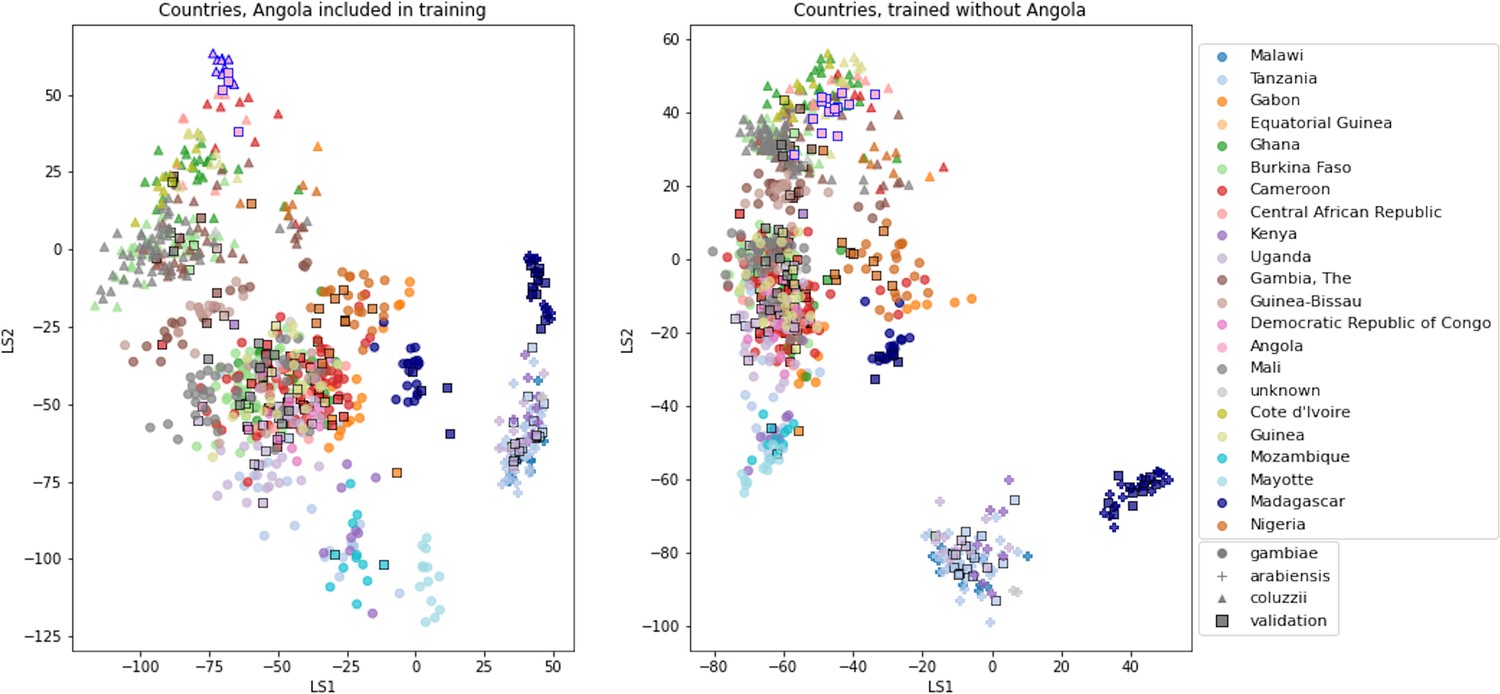
VAE projections of An.
arabiensis, An. coluzzii and An. gambiae from different geographic locations. Left: samples from Angola included in VAE training. Right: samples from Angola excluded from VAE training. Samples are coloured by country of collection. Squares are validation samples (not used in VAE training), triangles are An. coluzzii individuals, circles are An. gambiae individuals and crosses are An. arabiensis individuals. Samples from Angola are highlighted with a blue edge, all other validation samples have a black edge.
Appendix 5—figure 2

VAE projections of An.
arabiensis, An. coluzzii and An. gambiae from different geographic locations. Left: samples from Cameroon included in VAE training. Right: samples from Cameroon excluded from VAE training. Samples are coloured by country of collection. Squares are validation samples (not used in VAE training), triangles are An. coluzzii individuals, circles are An. gambiae individuals and crosses are An. arabiensis individuals. Samples from Cameroon are highlighted with a blue edge, all other validation samples have a black edge.
Appendix 5—figure 3
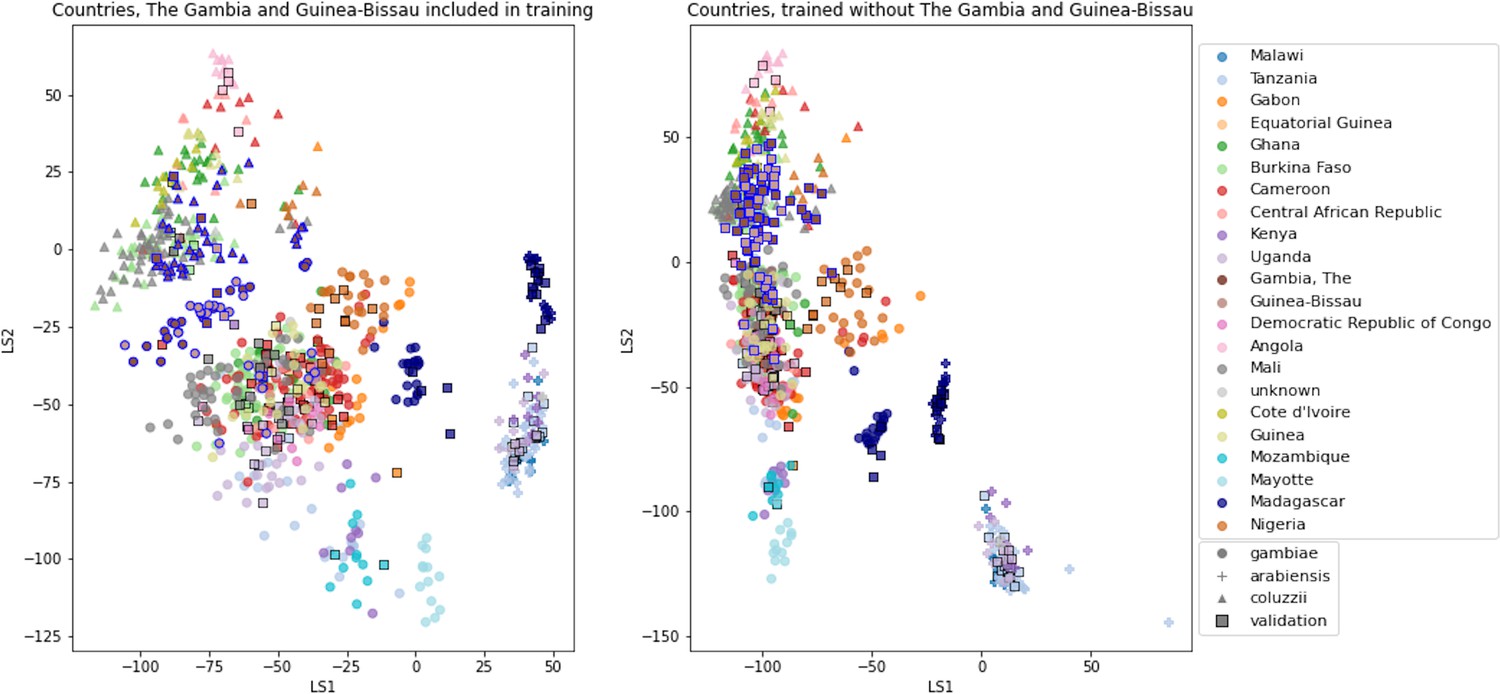
VAE projections of An.
arabiensis, An. coluzzii and An. gambiae from different geographic locations. Left: samples from The Gambia and Guinea-Bissau included in VAE training. Right: samples from The Gambia and Guinea-Bissau excluded from VAE training. Samples are coloured by country of collection. Squares are validation samples (not used in VAE training), triangles are An. coluzzii individuals, circles are An. gambiae individuals and crosses are An. arabiensis individuals. Samples from The Gambia and Guinea-Bissau are highlighted with a blue edge, all other validation samples have a black edge.
Appendix 5—figure 4
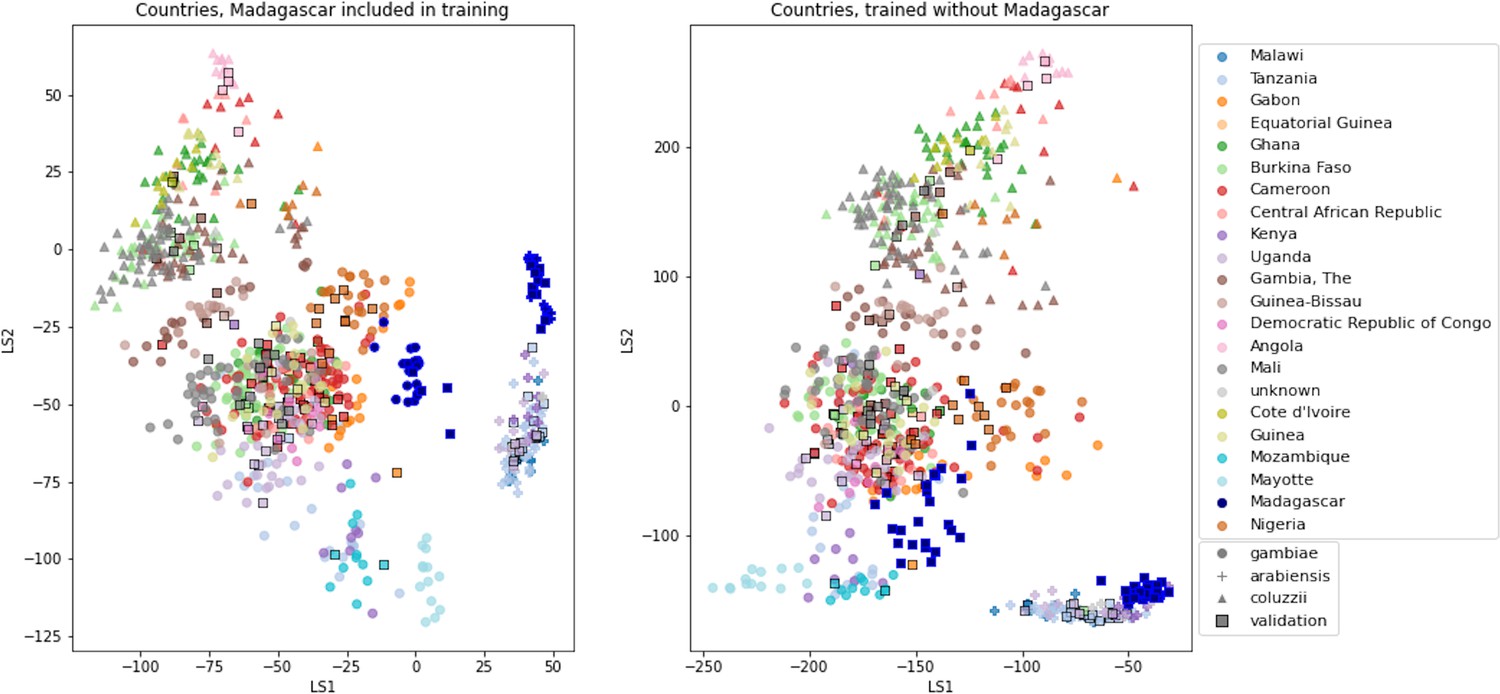
VAE projections of An. arabiensis, An. coluzzii and An. gambiae from different geographic locations.
Left: samples from Madagascar included in VAE training. Right: samples from Madagascar excluded from VAE training. Samples are coloured by country of collection. Squares are validation samples (not used in VAE training), triangles are An. coluzzii individuals, circles are An. gambiae individuals and crosses are An. arabiensis individuals. Samples from Madagascar are highlighted with a blue edge, all other validation samples have a black edge.
Appendix 5—figure 5
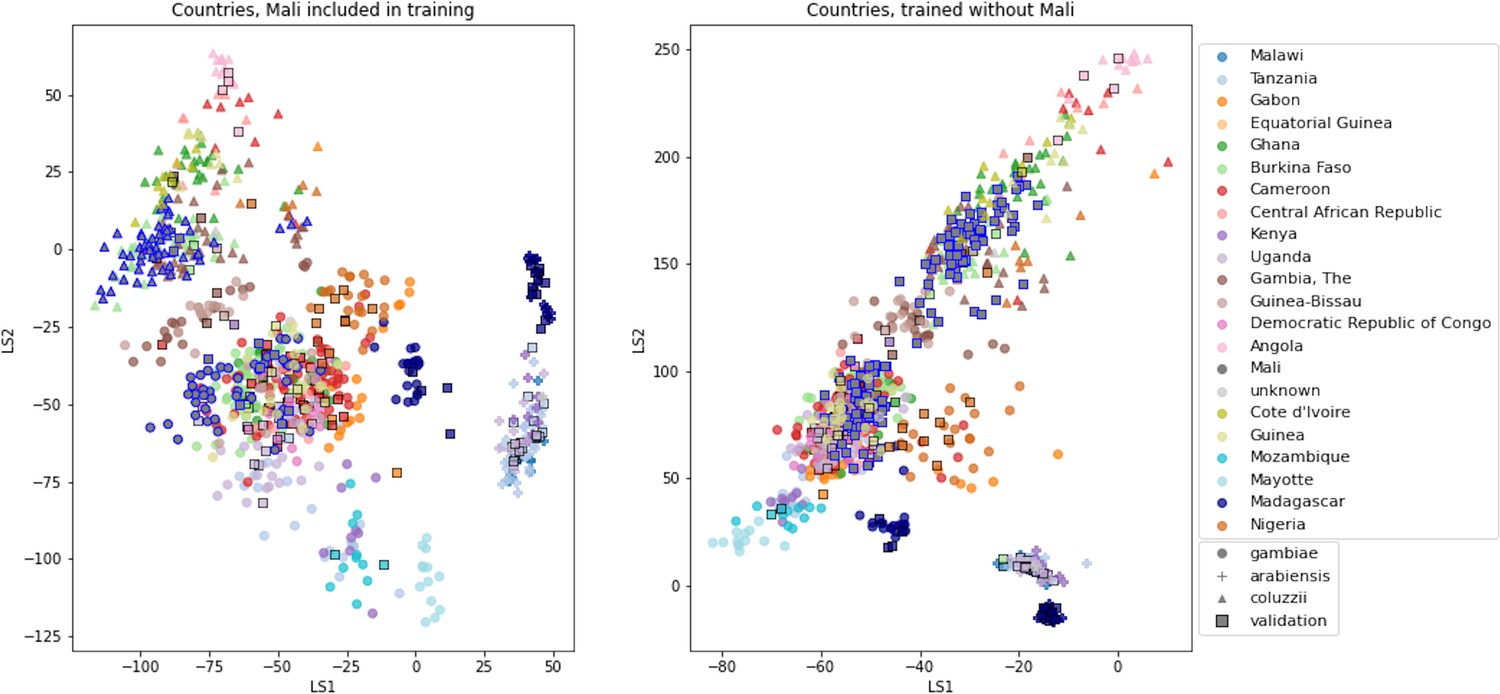
VAE projections of An. arabiensis, An. coluzzii and An. gambiae from different geographic locations.
Left: samples from Mali included in VAE training. Right: samples from Mali excluded from VAE training. Samples are coloured by country of collection. Squares are validation samples (not used in VAE training), triangles are An. coluzzii individuals, circles are An. gambiae individuals and crosses are An. arabiensis individuals. Samples from Mali are highlighted with a blue edge, all other validation samples have a black edge.
Appendix 5—figure 6
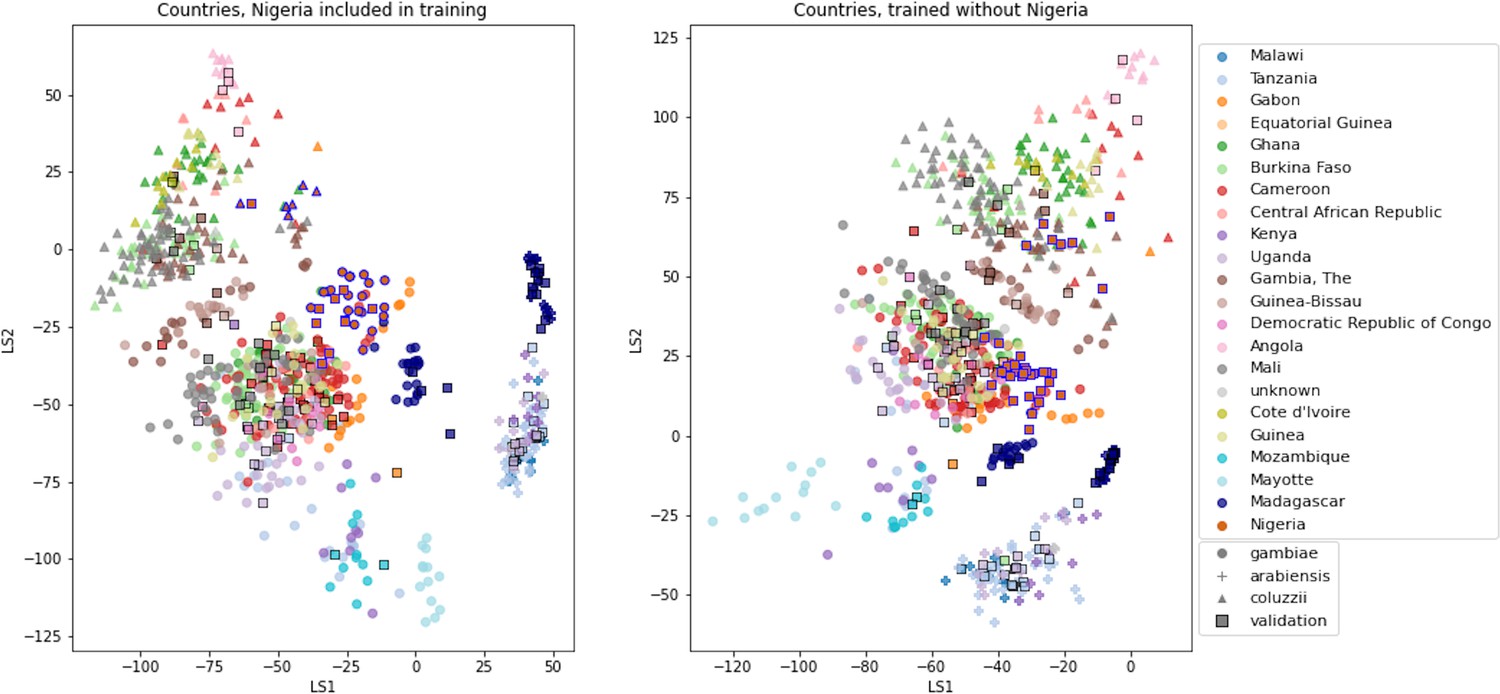
VAE projections of An. arabiensis, An. coluzzii and An. gambiae from different geographic locations.
Left: samples from Nigeria included in VAE training. Right: samples from Nigeria excluded from VAE training. Samples are coloured by country of collection. Squares are validation samples (not used in VAE training), triangles are An. coluzzii individuals, circles are An. gambiae individuals and crosses are An. arabiensis individuals. Samples from Nigeria are highlighted with a blue edge, all other validation samples have a black edge.
Appendix 5—figure 7
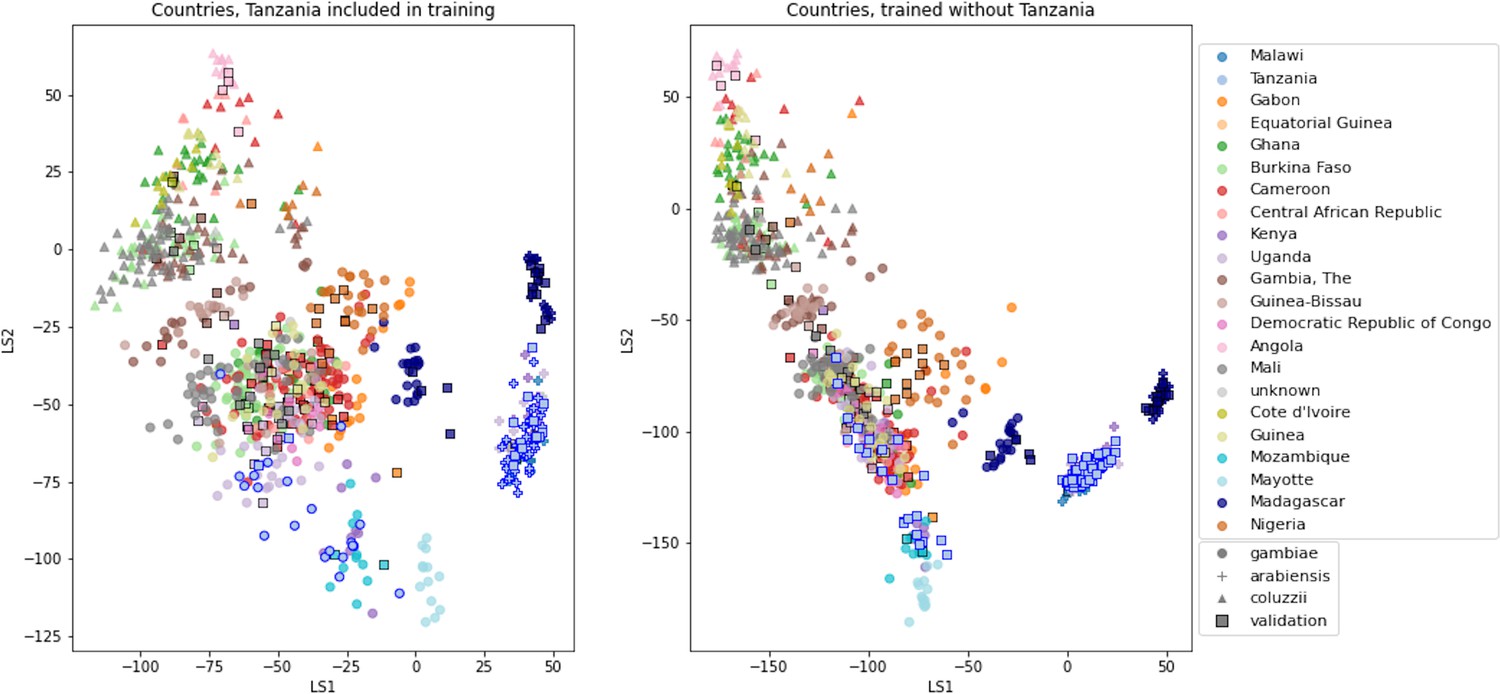
VAE projections of An. arabiensis, An. coluzzii and An. gambiae from different geographic locations.
Left: samples from Tanzania included in VAE training. Right: samples from Tanzania excluded from VAE training. Samples are coloured by country of collection. Squares are validation samples (not used in VAE training), triangles are An. coluzzii individuals, circles are An. gambiae individuals and crosses are An. arabiensis individuals. Samples from Tanzania are highlighted with a blue edge, all other validation samples have a black edge.
Author response image 1
Additional files
-
Supplementary file 1
NNv1 metadata and species labelling information.
- https://cdn.elifesciences.org/articles/78775/elife-78775-supp1-v2.tsv
-
Supplementary file 2
NNv1 coarse level assignment proportions.
- https://cdn.elifesciences.org/articles/78775/elife-78775-supp2-v2.tsv
-
Supplementary file 3
NNv1 intermediate level assignment proportions.
- https://cdn.elifesciences.org/articles/78775/elife-78775-supp3-v2.tsv
-
Supplementary file 4
NNv1 fine level assignment proportions.
- https://cdn.elifesciences.org/articles/78775/elife-78775-supp4-v2.tsv
-
Supplementary file 5
GCref v1 metadata and VAE projection coordinates.
- https://cdn.elifesciences.org/articles/78775/elife-78775-supp5-v2.tsv
-
Supplementary file 6
GCval v1 metadata and assignment results.
- https://cdn.elifesciences.org/articles/78775/elife-78775-supp6-v2.tsv
-
Supplementary file 7
Additional samples for convex hull definitions, metadata and VAE projection coordinates.
- https://cdn.elifesciences.org/articles/78775/elife-78775-supp7-v2.tsv
-
Supplementary file 8
Ag1000G diverged samples metadata and assignment results.
- https://cdn.elifesciences.org/articles/78775/elife-78775-supp8-v2.tsv
-
Supplementary file 9
Burkina Faso metadata and assignment results.
- https://cdn.elifesciences.org/articles/78775/elife-78775-supp9-v2.tsv
-
Supplementary file 10
Gabon metadata and assignment results.
- https://cdn.elifesciences.org/articles/78775/elife-78775-supp10-v2.tsv
-
MDAR checklist
- https://cdn.elifesciences.org/articles/78775/elife-78775-mdarchecklist1-v2.pdf
Download links
A two-part list of links to download the article, or parts of the article, in various formats.
Downloads (link to download the article as PDF)
Open citations (links to open the citations from this article in various online reference manager services)
Cite this article (links to download the citations from this article in formats compatible with various reference manager tools)
High-resolution species assignment of Anopheles mosquitoes using k-mer distances on targeted sequences
eLife 11:e78775.
https://doi.org/10.7554/eLife.78775


