Morphogenetic forces planar polarize LGN/Pins in the embryonic head during Drosophila gastrulation
- Biology Department, Massachusetts Institute of Technology, United States
- Center for Interdisciplinary Research in Biology (CIRB), Collège de France, CNRS, INSERM, Université PSL, France
Figures
Figure 1 with 1 supplement
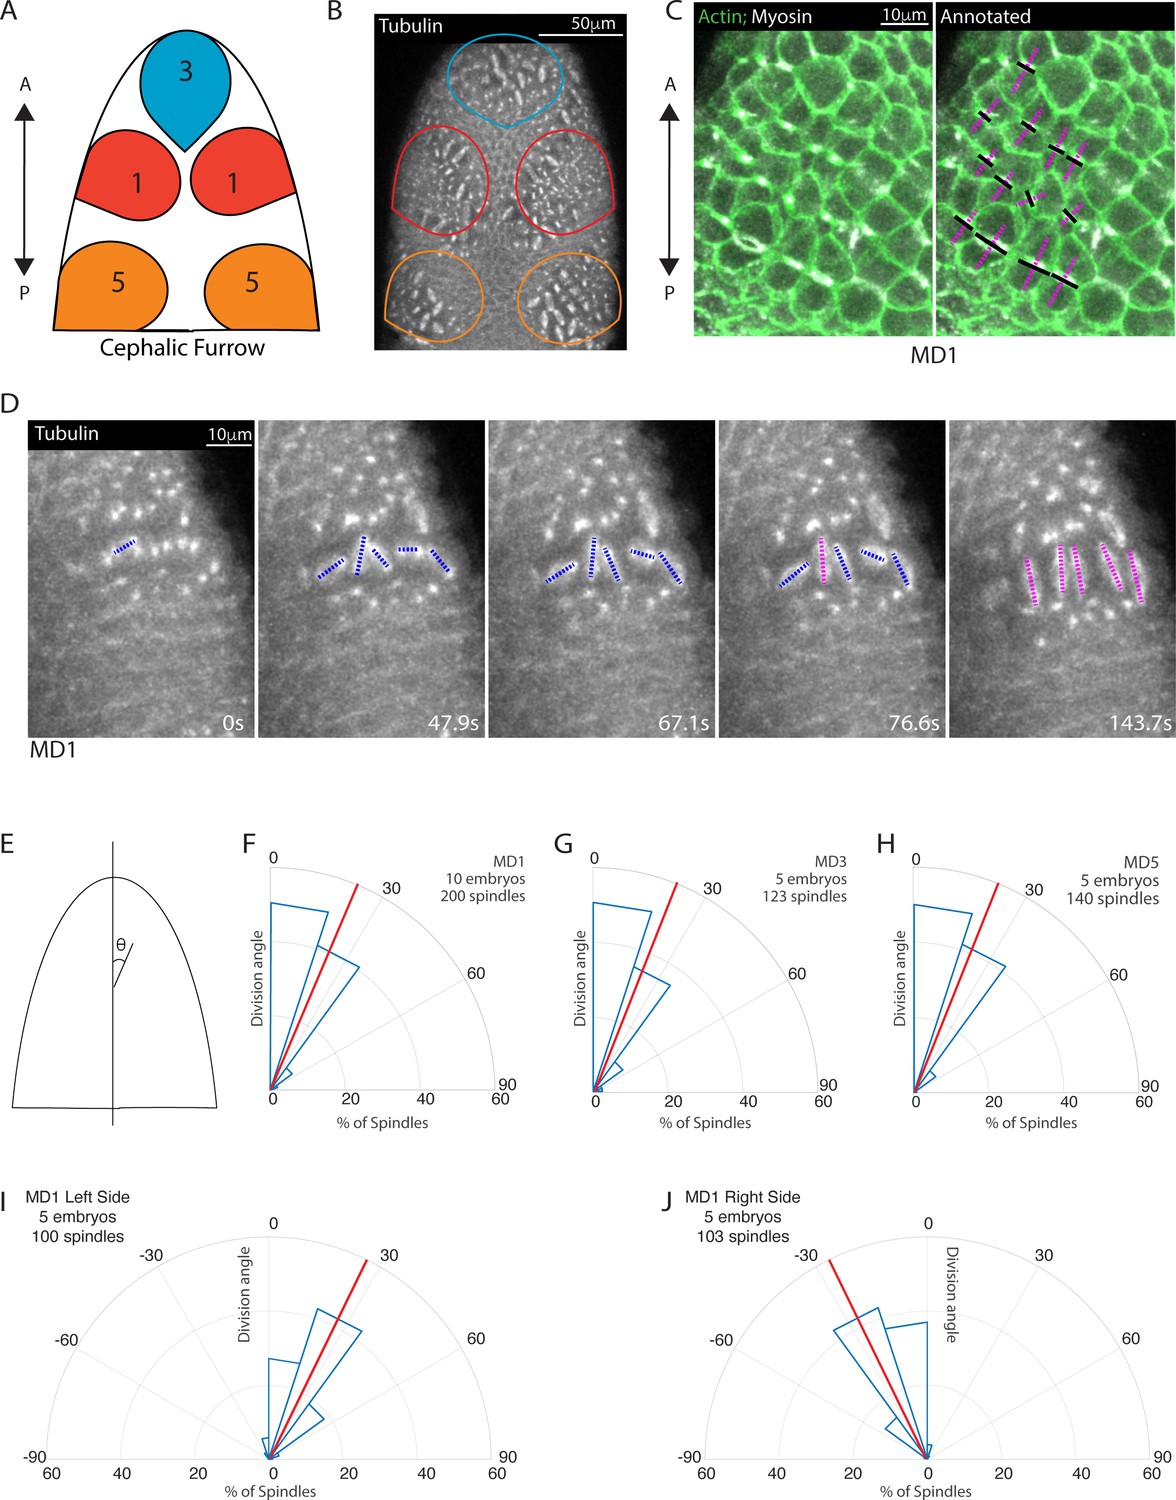
Early mitotic domains in the Drosophila head exhibit spindle rotation and oriented division.
(A) Schematic of the dorsal head of a Drosophila embryo with mitotic domain 1 (MD1) in red, mitotic domain 3 (MD3) in blue, and mitotic domain 5 (MD5) in orange. Anterior-posterior (AP) axis is indicated by arrow, the top of images will consistently be anterior, as in the schematic. (B) Image of the dorsal head of a live Drosophila embryo expressing CLIP170::GFP to label microtubules/spindle (grayscale). CLIP170::GFP signal is detected in image. MD1 is outlined in red, MD3 in blue, and MD5 in orange, scale bar is 50 µm. (C) MD1 cells exhibit planar polarized cell division. Left, image of MD1 in live embryo showing labeled myosin (grayscale, Sqh::mCherry), to show cytokinetic rings, and labeled F-actin (green, UtrABD::GFP) to show cell cortex, scale bar is 10 µm. Right, same image of MD1 annotated with black lines marking the cytokinetic ring of each dividing cell and magenta dashed lines marking division angle. (D) MD1 cells exhibit spindle rotation and alignment. Images are time series of MD1 with CLIP170::GFP marking the mitotic spindle (grayscale), blue lines indicate spindles still rotating and magenta lines represent spindle that have reached their final orientation, scale bar is 10 µm. (E) Schematic of division angle analysis. Division angle is taken with respect to the AP axis such that angle of 0 indicates alignment with the AP axis. Note only spindles during or after anaphase, when division angle is fixed, are measured. (F–H) Rose plots indicating division angles of MD1 (F), MD3 (G), and MD5 (H). Red lines indicate mean division angle. Mean division angle for MD1 = 21.6°, MD3=20.4°, and MD5=19.0°. For MD1, n=10 embryos and 200 spindles, MD3, n=5, embryos and 123 spindles, and MD5, n=5 embryos and 140 spindles. (I–J) Rose plots indicating division angles of left (I) or right (J) side of MD1. For left side, n=5 embryos and 100 spindles and right side, n=5 embryos and 103 spindles.
Figure 1—video 1
Max intensity projection (with Gaussian blur) of control embryo expressing Jup::GFP (to label mitotic spindle) during divisions of mitotic domains (MDs) 1, 3, and 5.
Scale bar = 50 μm.
Figure 2 with 2 supplements
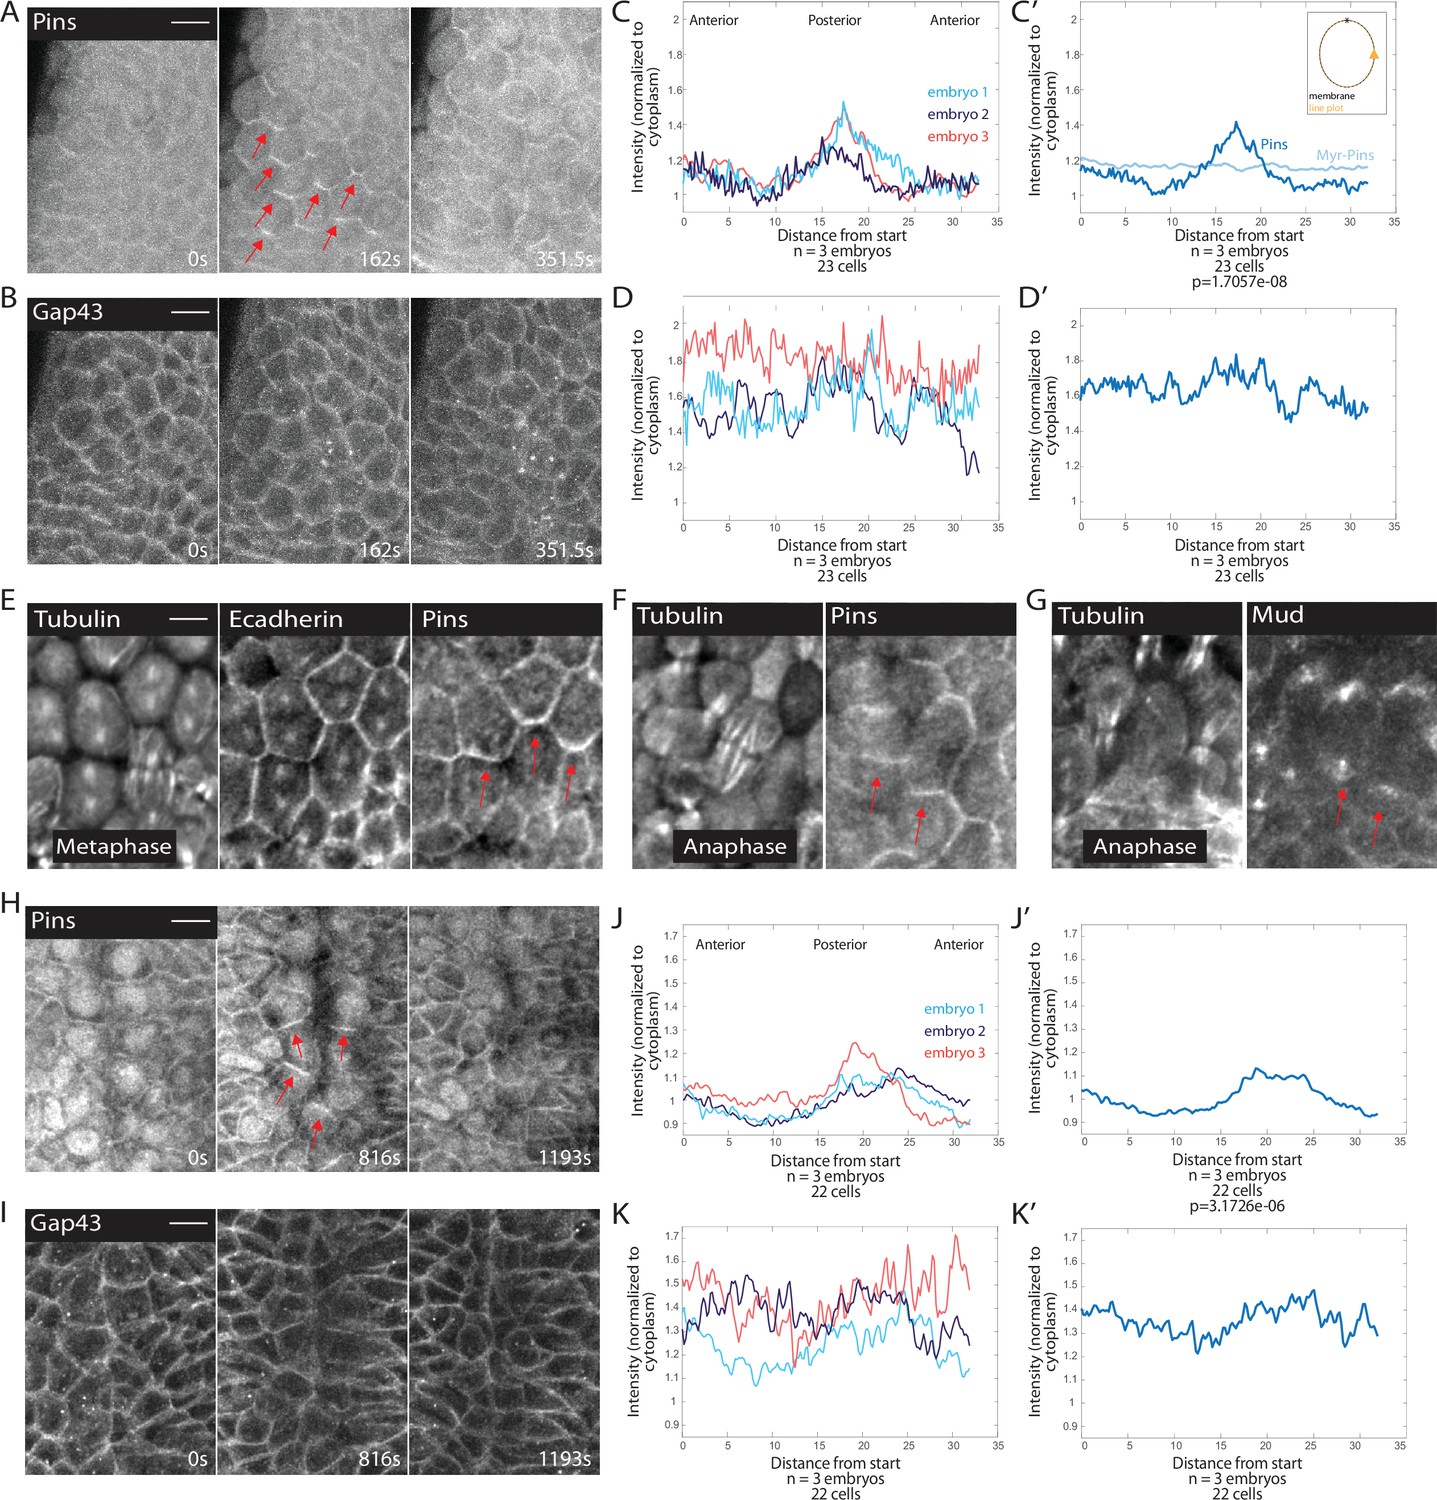
Pins is planar polarized in mitotic domain cells.
(A–B) Time series of mitotic domain 1 (MD1) of embryo expressing Pins::YFP, to label spindle rotation machinery, and Gap43::mCherry, to mark membranes. scale bar is 10 µm. (C, J) Quantification of average cellular (7–9 cells) Pins::YFP signal intensity around the mitotic cell cortex for three separate embryos, lines indicate average of cells in each embryo for MD1 (C) or MD14 (J). Cortical intensity was measured at anaphase, indicated by cell elongation, and normalized to cytoplasmic Pins::YFP signal. (C’, J’) Average of embryos in C or J. (D, K) Quantification of Gap43::mCherry (membrane marker) intensity for same cells and three embryos as in C for MD1 or J for MD14. (D’, K’) Average of embryos in D, MD1, or K, MD14. Intensity was normalized to cytoplasmic Gap43::mCherry signal. (E) Fixed sample of metaphase cells in MD1 stained for tubulin (left), E-cadherin (center), and Pins (right). (F) Fixed sample of anaphase cells in MD1 stained for tubulin (left) and Pins (right). (G) Fixed sample of anaphase cells in MD1 stained for tubulin (left) and Mud (right). (H–I) Time series of MD14 cells expressing Pins::YFP and Gap43::mCherry, similar to A and B. scale bar is 10 µm.
Figure 2—figure supplement 1
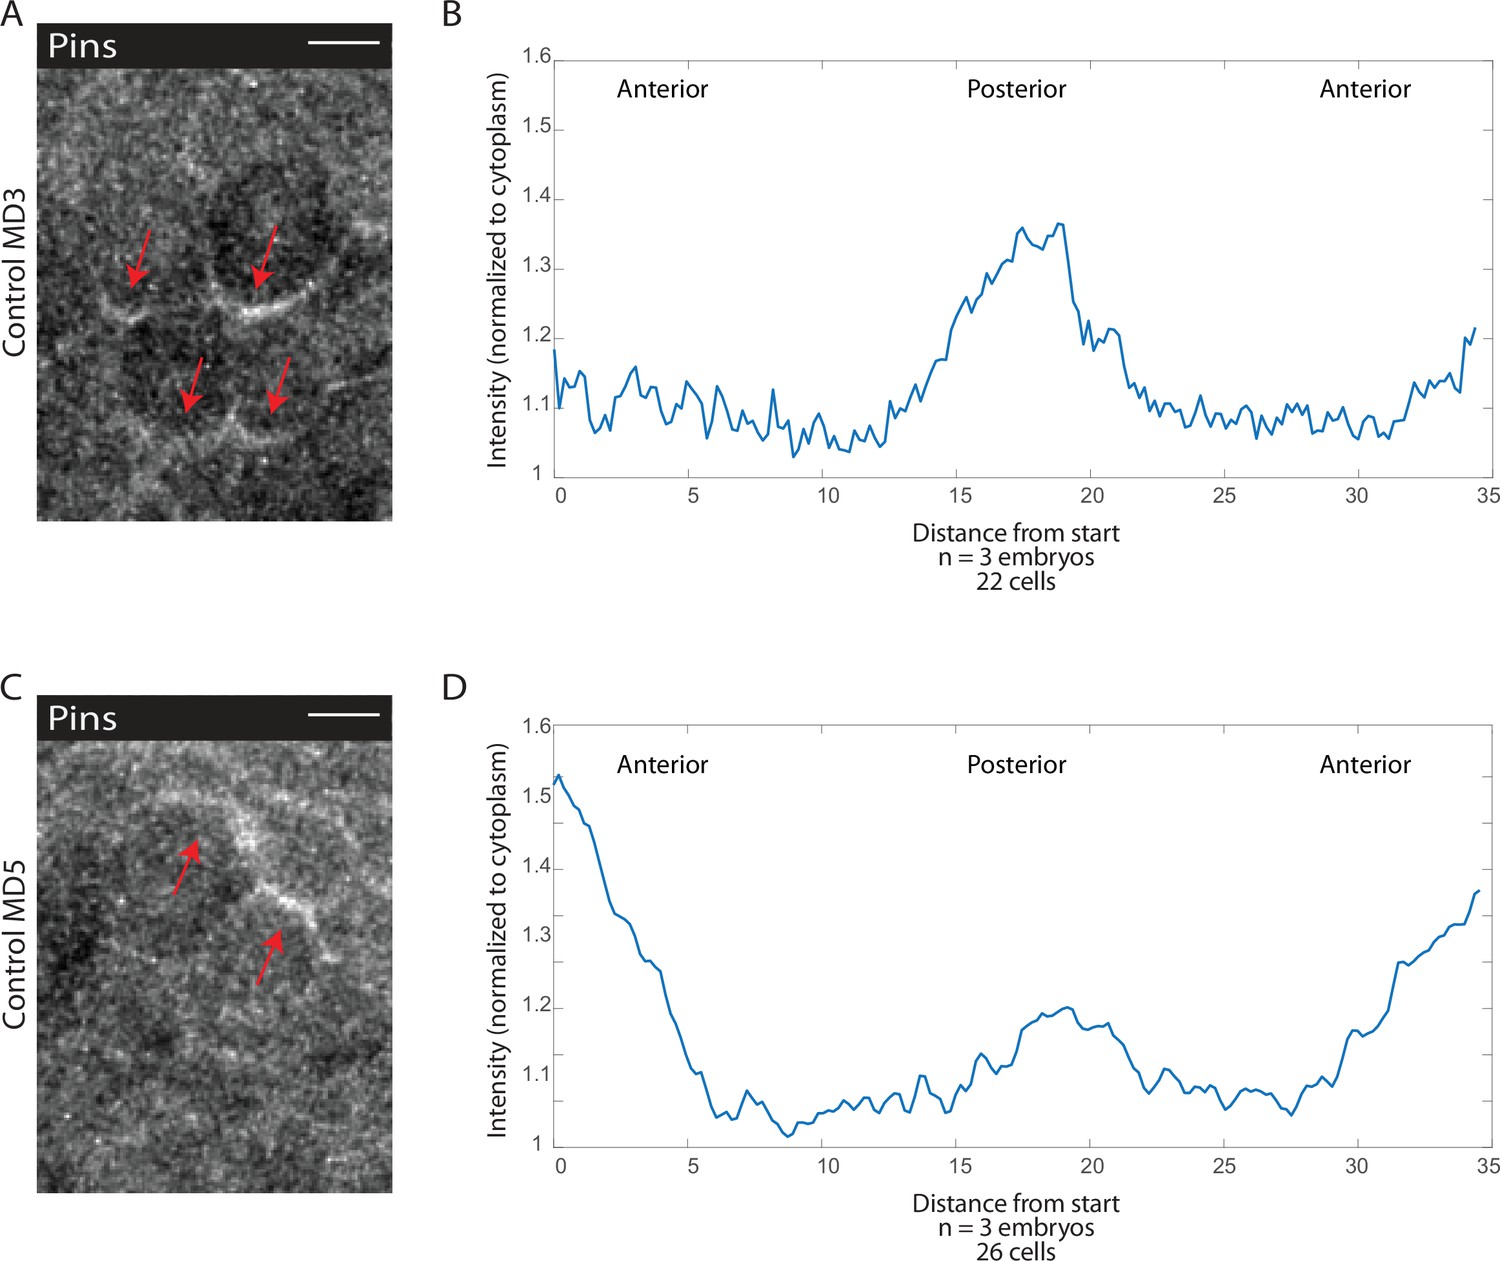
Pins is planar polarized on the posterior side of mitotic domain 3 (MD3) and anterior side of MD5 cells.
(A, C) Image of MD3 (A) or MD5 (C) of embryo expressing Pins::YFP, to label spindle rotation machinery, scale bar is 10 µm. (B, D) Quantification of average cellular (6–10 cells) Pins::YFP signal intensity around the mitotic cell cortex for three separate embryos, lines indicate average of cells in embryos for MD3 (B) or MD5 (D).
Figure 2—video 1
Max intensity projection (with Gaussian blur) of control embryo expressing Pins::GFP cropped to focus on divisions of mitotic domain 1 (MD1).
Scale bar = 10 μm.
Figure 3 with 5 supplements
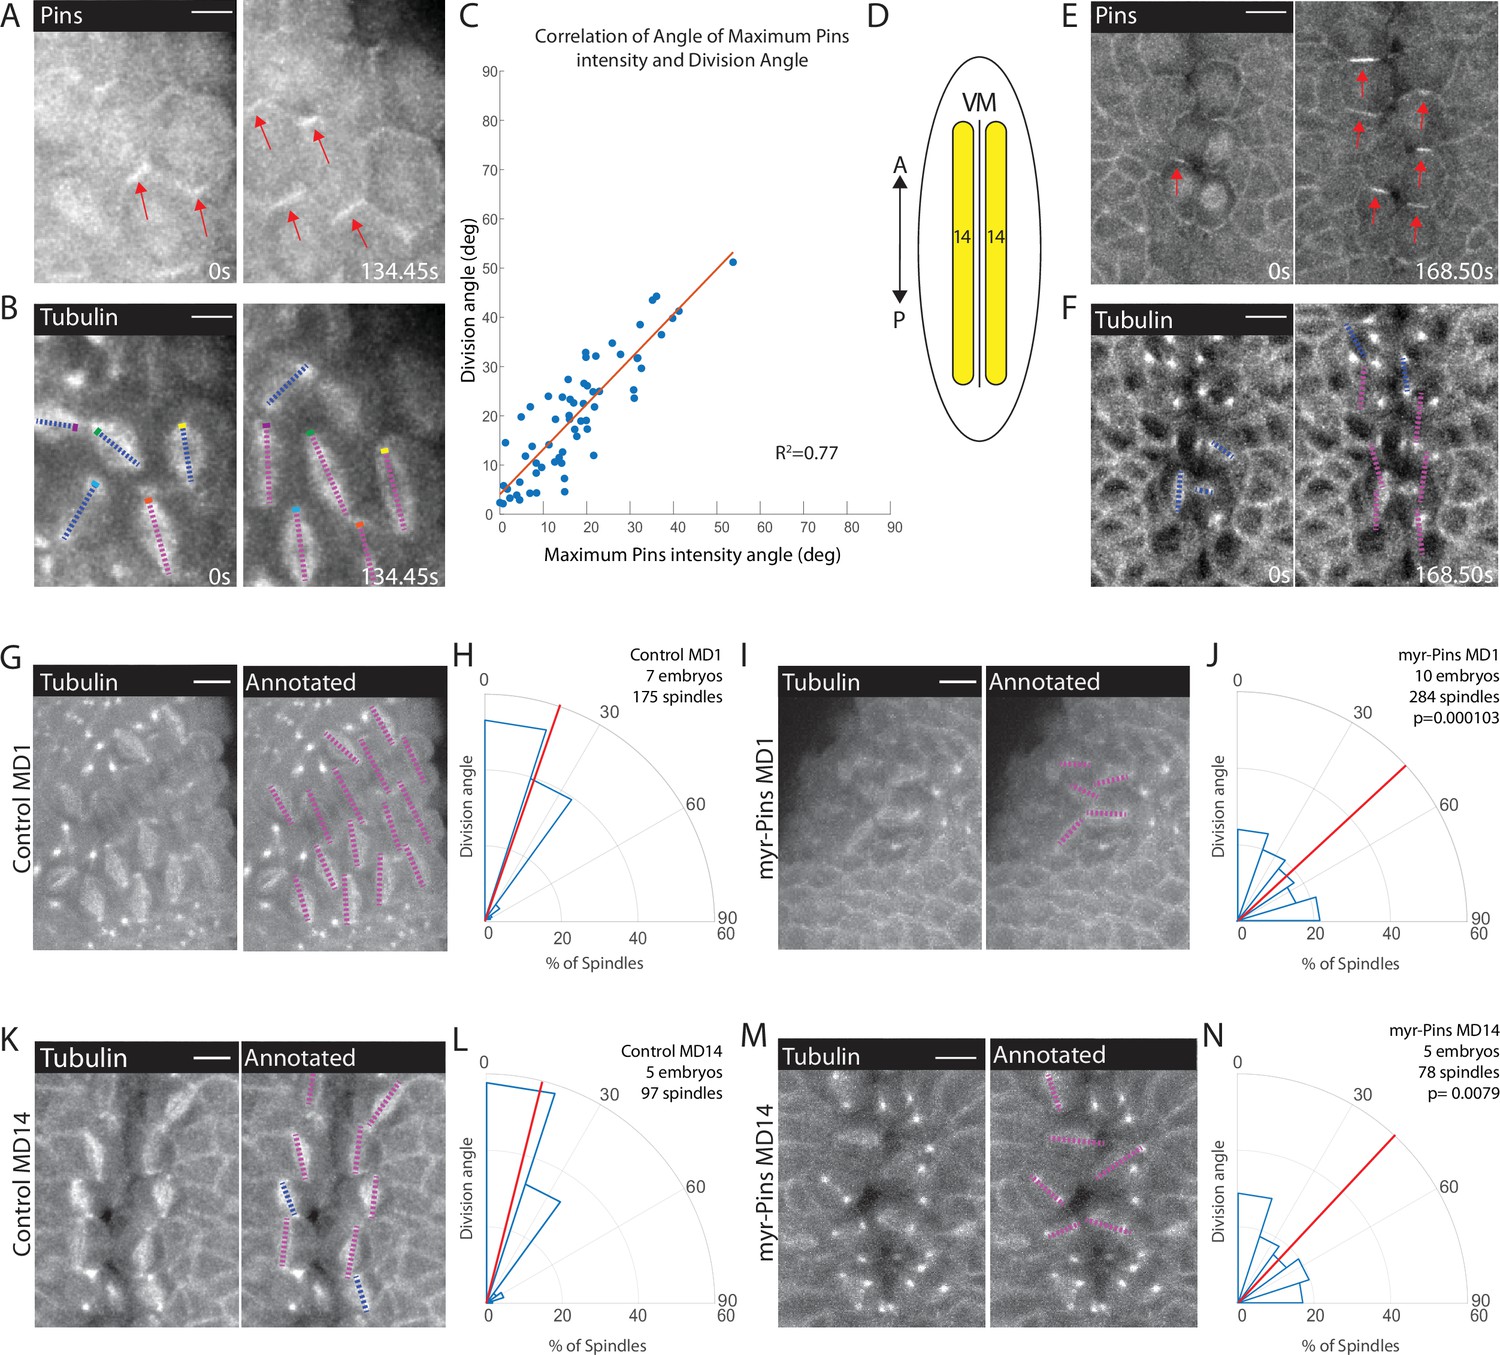
Planar polarized divisions depend on asymmetric Pins localization.
(A–B) Pins localizes in planar polarized crescents immediately prior to spindle orientation. Images are time series of mitotic domain 1 (MD1) of embryo with labeled Pins (Pins::YFP) and labeled tubulin (Tubulin::mCherry), to mark mitotic spindles, blue lines indicate spindles that are still rotating, magenta lines indicate spindles that have reached their final orientation. Colored boxes at tips of lines label spindles with the color marking the same spindle at each time point. Scale bar is 10 µm. (C) Spindle orientation is correlated with Pins polarity. Plot of the correlation between the angle of maximum Pins::YFP intensity and division angle. R2=0.77. (D) Schematic of MD14, located on either side of the ventral midline (VM). (E–F) Images are a time series of MD14 cells labeled with Pins::YFP and tubulin::mCherry, to mark mitotic spindles. (G, I) Myristoylated Pins disrupts division orientation. Left, image of MD1 of control embryo (G, UAS >PinsGFP) or MD1 of Myristoylated Pins expressing embryo (I, UAS >myr::Pins::GFP). Images show marker (CLIP170::GFP) to mark mitotic spindles (grayscale), scale bar is 10 µm. Right, same image annotated with dashed lines to indicate spindle position. (H, J) Quantification of spindle angles for control embryos (H, UAS >PinsGFP) using rose plots or Myristoylated Pins expressing embryos (J, UAS >myr::Pins::GFP). For control embryos (H, UAS-PinsGFP) MD1, n=7 embryos and 175 spindles. For Myristoylated Pins expressing embryos, n=10 embryos and 284 spindles. Average orientation angles per embryo were statistically different between control and Myristoylated Pins expressing embryos, Mann-Whitney, p=0.000103. (K, M) Pins asymmetry is required for MD14 spindle orientation. Left, image of MD14 of control embryo (G, UAS-PinsGFP) or MD14 of Myristoylated Pins expressing embryo (I, UAS >myr::Pins::GFP). Images show marker (CLIP170::GFP) to mark mitotic spindles (grayscale), scale bar is 10 µm. Right, same image annotated with dashed lines to indicate spindle position. (L, N) Quantification of spindle angles for control embryos (UAS >PinsGFP) or Myristoylated Pins expressing embryos (N, UAS >myr::Pins::GFP) using rose plots. For control embryos (L, UAS >PinsGFP) MD14, n=5 embryos and 97 spindles. For Myristoylated Pins expressing embryos, n=5 embryos and 78 spindles. Average orientation angles per embryo were statistically different between control and Myristoylated Pins expressing embryos, Mann-Whitney, p=0.0079.
Figure 3—figure supplement 1

Division angle is not correlated with interphase cell shape.
(A) Images are time series of mitotic domain 1 (MD1) of embryo with labeled Utr (Utr::GFP) magenta lines indicate division angle. Scale bar is 10 µm. (B) Division angle is not correlated with interphase cells shape. Plot of the correlation between interphase cell shape and division angle, R2=0.0002.
Figure 3—figure supplement 2

Myristoylated Pins is uniformly recruited to the apical membrane.
(A, C) Image of mitotic domain 1 (MD1) of embryo expressing Pins::YFP, to label spindle rotation machinery (A), and Gap43::mCherry, to mark membranes (C). Scale bar is 10 µm. (B, D) Quantification of average cellular (10 cells) Pins::YFP (B) or Gap43::mCherry (D) signal intensity around the mitotic cell cortex for three separate embryos, lines indicate average of cells in all embryos for MD1. Cortical intensity was measured at anaphase, indicated by cell elongation, and normalized to cytoplasmic Pins::YFP (B) or Gap43::mCherry signal (D).
Figure 3—figure supplement 3

Results from mitotic domains (MDs) 3 and 5 are consistent with results from MD1.
(A–D) Quantification of spindle angles in MDs 3 (A–B) and 5 (C–D) for Myristoylated Pins expressing embryos (B, D, UAS >myr::Pins::GFP) and control (A, C, UAS >Pins::GFP). Average orientation angles per embryo were statistically different between control and Myristoylated Pins expressing embryos for MDs 3 and 5, Mann-Whitney, p=0.0079 and 0.0317, respectively.
Figure 3—video 1
Max intensity projection (with Gaussian blur) of control embryo expressing Pins::GFP and Tubulin::Ch (to label mitotic spindle) cropped to focus on divisions of mitotic domain 1 (MD1).
Scale bar = 10 μm.
Figure 3—video 2
Max intensity projection (with Gaussian blur) of control embryo (Rh3 RNAi) (left), embryo expressing α-catenin RNAi (center), or embryo expressing Myr-Pins (right) with fluorescently labeled Clip170::GFP (to label mitotic spindle) and cropped to focus on divisions of MD1.
Scale bar = 10 μm. Note: Myr-Pins time step is longer than control.
Figure 4 with 2 supplements
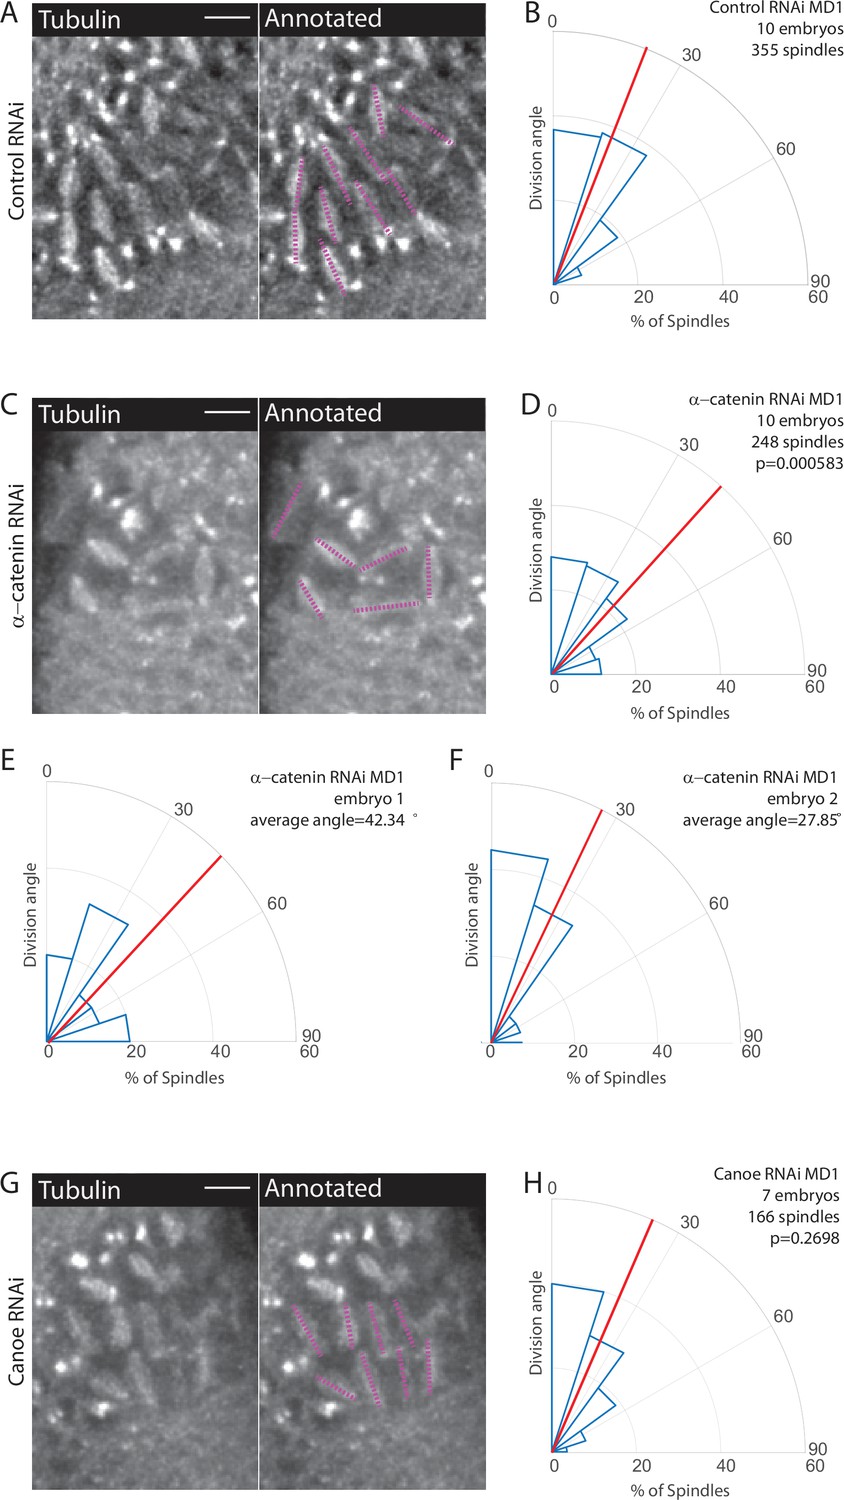
Disruption of adherens junctions, but not Canoe, inhibits planar polarized division orientation.
(A, C, G) α-Catenin depletion disrupts division orientation. Left, image of MD1 of control knockdown (A, Rh3 RNAi), MD1 of α-catenin-depleted embryo (C, α-catenin RNAi), or MD1 of Canoe-depleted embryo (G, Canoe RNAi). Images show marker (CLIP170::GFP) to mark mitotic spindles (grayscale), scale bar is 10 µm. Right, same image annotated with dashed lines to indicate spindle position. (B, D, H) Quantification of spindle angles for control embryos (B, Rh3 RNAi), α-catenin-depleted embryos (D, α-catenin RNAi), or Canoe-depleted embryos (H, Canoe RNAi) using rose plots. For control embryos (Rh3 RNAi) MD1, n=10 embryos and 355 spindles. For α-catenin RNAi MD1, n=10 embryos and 248 spindles. For Canoe RNAi MD1, n=7 embryos and 166 spindles. Average orientation angles per embryo were statistically different between control and α-catenin RNAi, Mann-Whitney, p=0.000583, but not for canoe RNAi, Mann-Whitney, p=0.2698. (E–F) Quantification of spindle angles for individual α-catenin-depleted embryos using rose plots.
Figure 4—figure supplement 1

Disruption of Toll-like receptors (TLRs) does not disrupt polarized division orientation.
(A, C) Injection of TLRs 2, 6, and 8 dsRNA does not disrupt division orientation. (A) Left, image of mitotic domain 1 (MD1) of control injection (0.1× TE buffer injection) or (C) image of MD1 of embryo injected with TLRs 2, 6, and 8 dsRNA. Images show marker (Jup::GFP) to mark mitotic spindles (grayscale), scale bar is 10 µm. Right, same image annotated with dashed lines to indicate spindle position. (B, D) Quantification of spindle angles for control embryos (B, 0.1× TE buffer injection) or TLRs 2, 6, 8 dsRNA injected embryos (D) using rose plots. For control embryos (0.1× TE buffer injection) MD1, n=8 embryos and 199 spindles. For TLRs 2, 6, and 8 dsRNA injection MD1, n=4 embryos and 138 spindles. Average orientation angles per embryo were not statistically different between control and TLRs 2, 6, and 8 dsRNA injection, Mann-Whitney, p=0.0635. Note: 0.1× TE buffer is the same control and B the same plot as used for Figure 7B, but representative images are different. (E, F) Quantification of spindle angles for fixed control embryos (E, OR) and fixed TLRs 2, 6, and 8 triple mutant embryos (F). For control embryos (OR) MD1, n=10 embryos and 246 spindles. For TLRs 2, 6, and 8 triple mutant embryos MD1, n=3 embryos and 38 spindles. Average orientation angles per embryo were statistically different between control and TLRs 2, 6, and 8 triple mutant embryos, Mann-Whitney, p=0.0070.
Figure 4—figure supplement 2
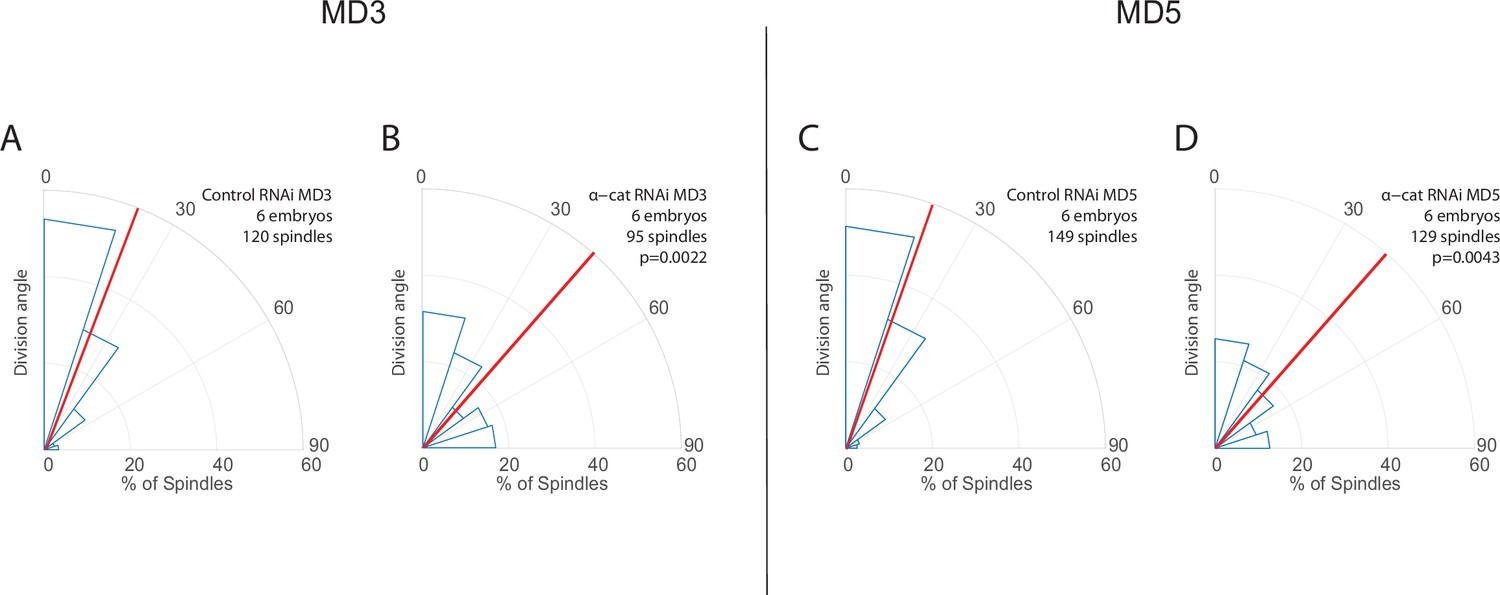
Results from mitotic domains (MDs) 3 and 5 are consistent with results from MD1.
(A–D) Quantification of spindle angles in MDs 3 (A–B) and 5 (C–D) for α-catenin-depleted embryos (B, D, α-catenin RNAi) and control (A, C, Rh3 RNAi). For α-catenin-depleted embryos MD3, n=6 embryos, 95 spindles, and for MD5, n=6 embryos, 129 spindles. For control (Rh3 RNAi) MD3, n=6 embryos, 120 spindles, and for MD5 n=6 embryos, 149 spindles. Average orientation angles per embryo were statistically different between control and α-catenin-depleted embryos for MDs 3 and 5, Mann-Whitney, p=0.0022 and 0.0043, respectively.
Figure 5 with 1 supplement
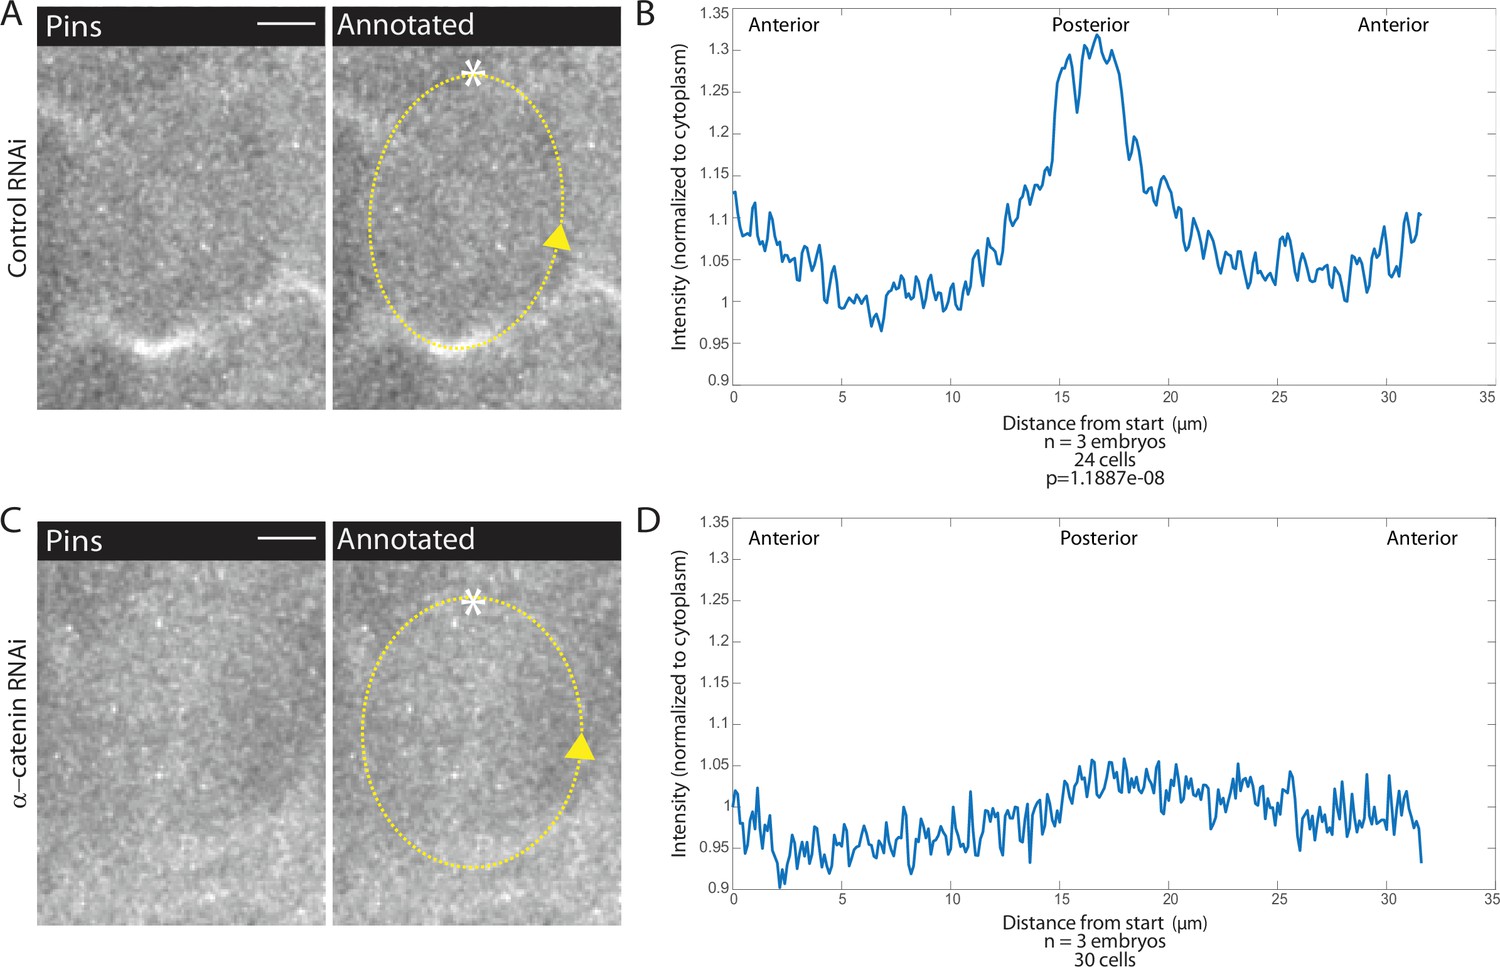
Adherens junction depletion disrupts Pins planar cell polarity.
(A, C) αCatenin depletion disrupts Pins localization. Left, image of a mitotic domain 1 (MD1) cell of control embryo (A, Rh3 RNAi) or an MD1 cell of α-catenin-depleted embryo (C, α-catenin RNAi). Images show labeled Pins (Pins::YFP), scale bar is 10 µm. Right, same image annotated with dashed line to indicate cell outline used to plot intensity profile, * to indicate start, and arrow to indicate direction of line. (B, D) Quantification of Pins intensity for control embryos (Rh3 RNAi) or α-catenin-depleted embryos (D, α-catenin RNAi). Intensity was normalized to cytoplasm. For control (Rh3) MD1, n=3 embryos and 25 cells. For α-catenin RNAi MD1, n=3 and 30 cells.
Figure 5—video 1
Max intensity projection (with Gaussian blur) of control embryo (Rh3 RNAi) (left), embryo expressing α-catenin RNAi (center), or embryo injected with 0.25 mg/mL cytochalasin D (cytoD) (right) with fluorescently labeled Pins::YFP and cropped to focus on divisions of mitotic domain 1 (MD1).
Scale bar = 10 μm. Note, cell outlines are not obvious in cytoD movie, so tubulin channel (not shown) was used to find mitotic cells at similar time points to control.
Figure 6 with 4 supplements
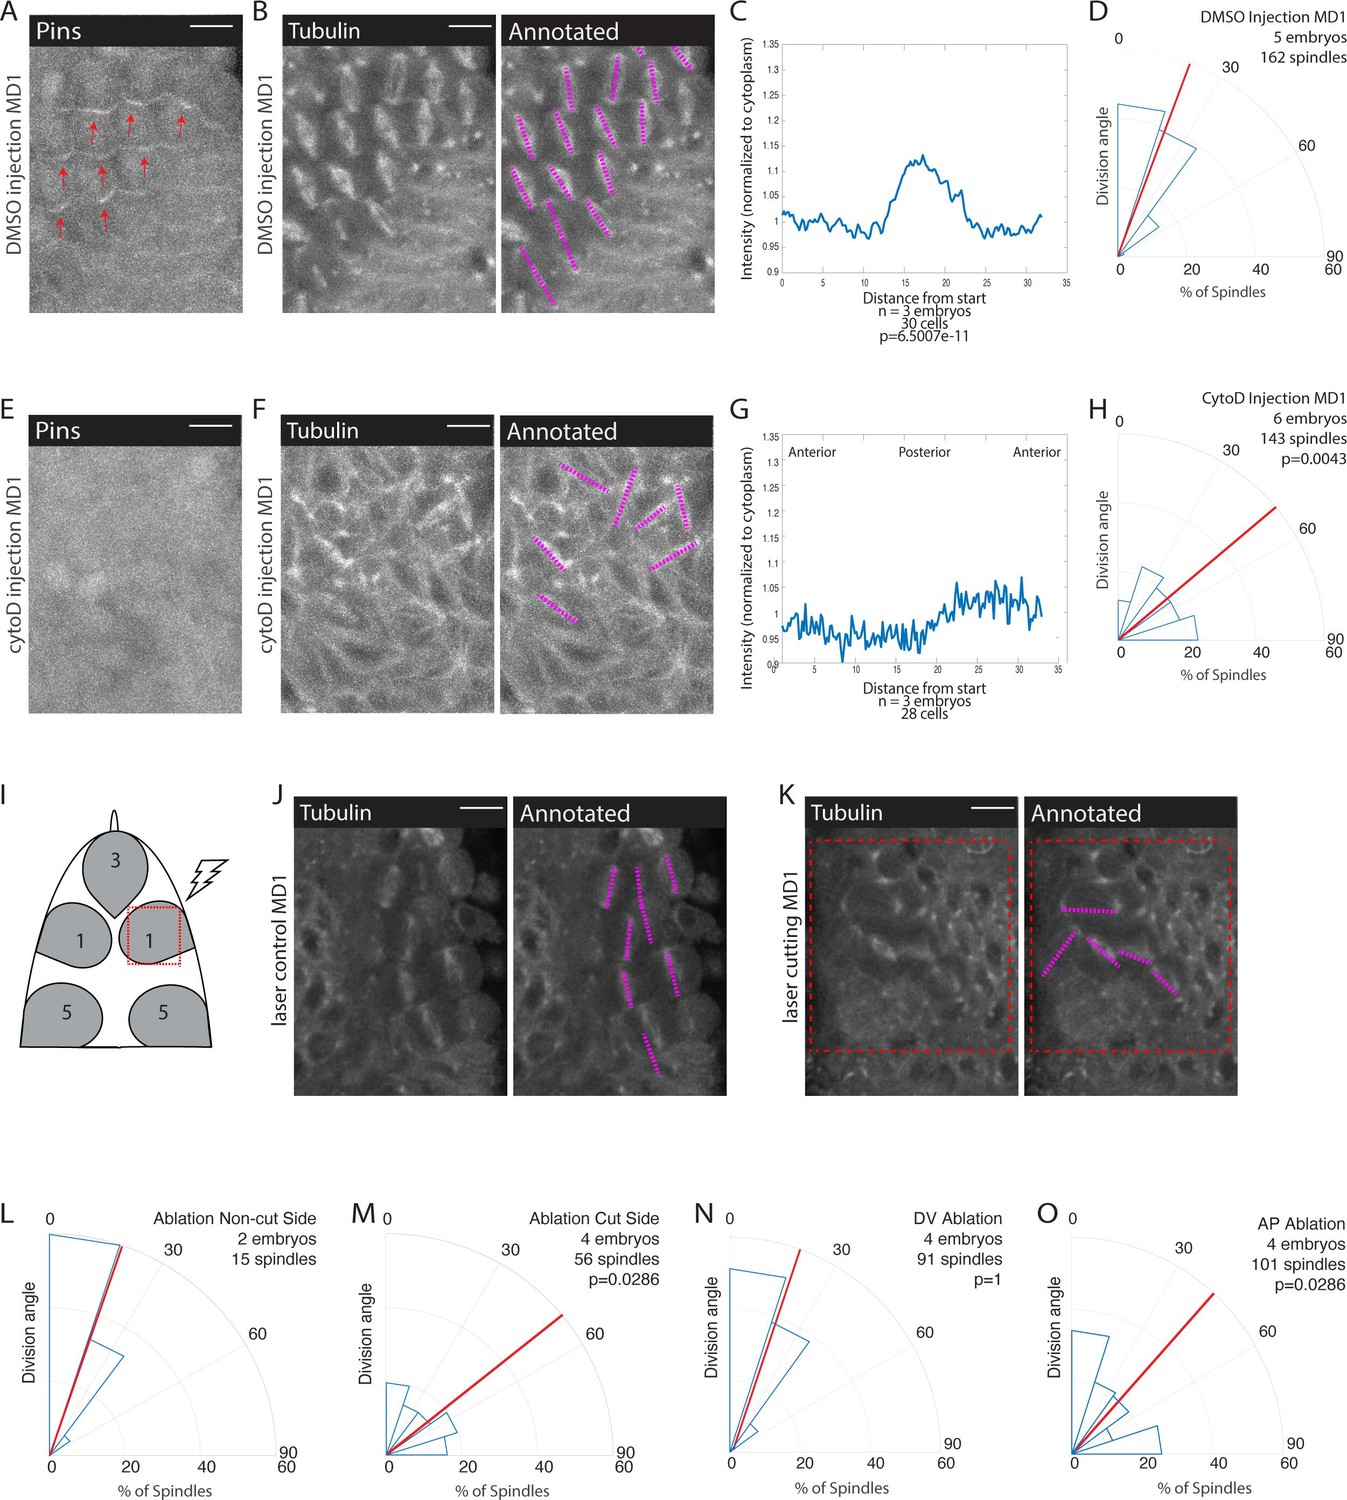
Mechanical force is necessary for Pins polarity and spindle orientation.
(A, E) Cytoskeletal disruption prevents Pins localization. Image of mitotic domain 1 (MD1) in control embryo (A, DMSO injection) or MD1 of cytochalasin D (CytoD) injected embryo (E, 0.25 mg/mL CytoD injection). Images show labeled Pins (Pins::YFP), red arrows point to crescents of Pins in control MD1, scale bar is 10 µm. (B, F) Cytoskeletal disruption interferes with division orientation. Image of MD1 of control embryo, same embryo as A, (B, DMSO injection) or MD1 of CytoD injected embryo (F). Images, from same embryo as E, show marker (Tubulin::mCherry) to mark mitotic spindles (grayscale), scale bar is 10 µm. Right, same image annotated with dashed lines to indicate spindle position. (C, G) Quantification of Pins intensity for control embryos (C, DMSO injection) or CytoD injected embryo (G, 0.25 mg/mL CytoD injection). Intensity was normalized to cytoplasm. For control (DMSO injection) MD1, n=3 embryos and 30 cells. For CytoD injection MD1, n=3 and 28 cells. (D, H) Quantification of spindle angles for control embryos (D, DMSO injection) or CytoD injected embryo (H) using rose plots. For control embryos (DMSO injection) MD1, n=5 embryos and 162 spindles. For CytoD injection MD1, n=6 embryos and 143 spindles. When compared to control (DMSO injection) using Mann-Whitney, p=0.0043. (I) Schematic of laser ablation schema. The ROI for laser cutting was drawn around MD1 on one side of the embryo to mechanically uncouple MD1 from surrounding tissue. The other side of MD1 was not cut. (J–K) Separating MD1 from surrounding tissue disrupts spindle orientation. Left, image of MD1 on control side of embryo (J, non-cut) or laser cut side of embryo (K). Images show marker (Tubulin::mCherry) to mark mitotic spindles (grayscale), scale bar is 10 µm. Right, same image annotated with dashed lines to indicate spindle position, red box indicates laser cut ROI. (L-M) Quantification of spindle angles for MD1 of control side (L, non-cut), or laser cut side (M) using rose plots. For control side (non-cut) MD1, n=2 embryos and 15 spindles. For laser cut side MD1, n=4 embryos and 56 spindles. Average orientation angles per embryo were statistically different between laser cut embryos and sham ablation embryos, Mann-Whitney, p=0.0286. (N-O) Quantification of spindle angles for dorsal-ventral (DV) cut embryos (N) or anterior-posterior (AP) cut embryos (O) using rose plots. For DV cut embryos MD1, n=4 embryos and 91 spindles. Average orientation angles per embryo were not different between DV cut and sham ablated control embryos, Mann-Whitney, p=1. For AP cut embryos MD1, n=4 embryos and 101 spindles. Average orientation angles per embryo were different between AP cut and sham ablated control embryos, Mann-Whitney, p=0.0286.
Figure 6—figure supplement 1
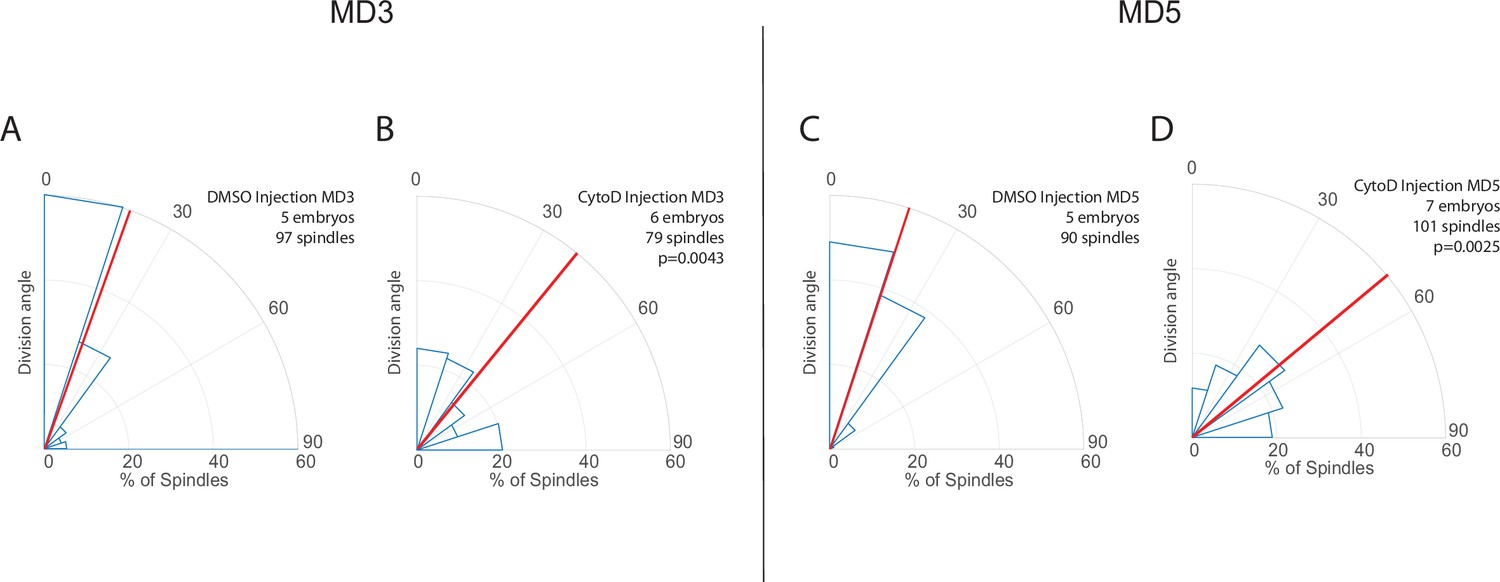
Results from mitotic domains (MDs) 3 and 5 are consistent with results from MD1.
(A–D) Quantification of spindle angles in MDs 3 (A–B) and 5 (C–D) for cytochalasin D (CytoD) injected embryos (B, D, 0.25 mg/mL CytoD injected) and control (A, C, DMSO injection). For CytoD injected embryos MD3, n=6 embryos, 79 spindles, and for MD5, n=7 embryos, 101 spindles. For control (DMSO injection) MD3, n=5 embryos, 97 spindles, and for MD5 n=5 embryos, 90 spindles. Average orientation angles per embryo were statistically different between control and CytoD injected embryos for MDs 3 and 5, Mann-Whitney, p=0.0043 and 0.0025, respectively.
Figure 6—figure supplement 2
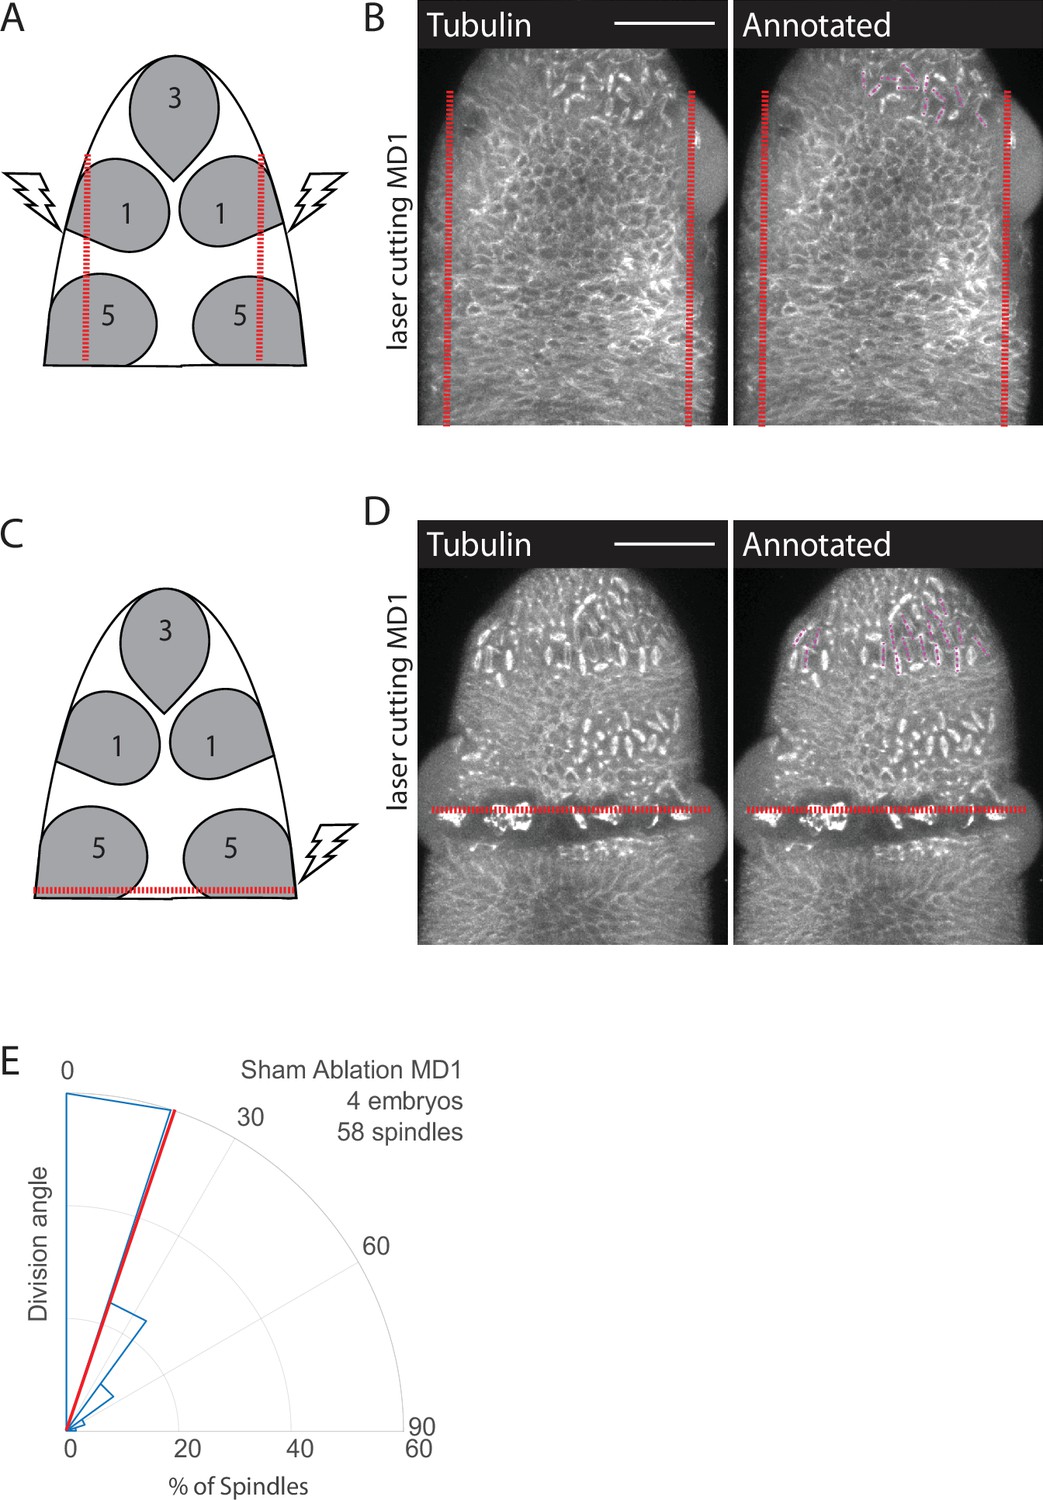
Laser cutting schema and control.
(A, B) Schematics of laser ablation schema, anterior-posterior (AP) cuts to disrupt forces from ventral furrow (A) or dorsal-ventral (DV) cut to disrupt forces from cephalic furrow (C). Separating mitotic domain 1 (MD1) from ventral furrow forces disrupts spindle orientation. Image of dorsal head of AP (B) or DV cut (D) embryos. Images show marker (Jupiter::GFP) to mark mitotic spindles (grayscale), scale bar is 50 µm. (E) For sham ablated embryos the ROI for was drawn around MD1 with laser power set to half ablation power. Sham ablated embryos were used as controls for ablation cut side, DV ablation, and AP ablation. For sham ablated embryos MD1, n=4 embryos and 58 spindles.
Figure 6—video 1
Max intensity projection (with Gaussian blur) of embryo expressing Tubulin::Ch.
Left side of mitotic domain 1 (MD1) was laser cut as indicated by red box and right side of MD1 was left uncut. Scale bar = 10 μm.
Figure 6—video 2
Max intensity projection (with Gaussian blur) of embryos expressing Tubulin::Ch.
Dorsal-ventral (DV) laser cut to disrupt force transmission from the cephalic furrow as indicated by red line (left) and anterior-posterior (AP) laser cuts to disrupt force transmission from the ventral furrow as indicated by red lines (right). Scale bar = 50 μm.
Figure 7 with 1 supplement
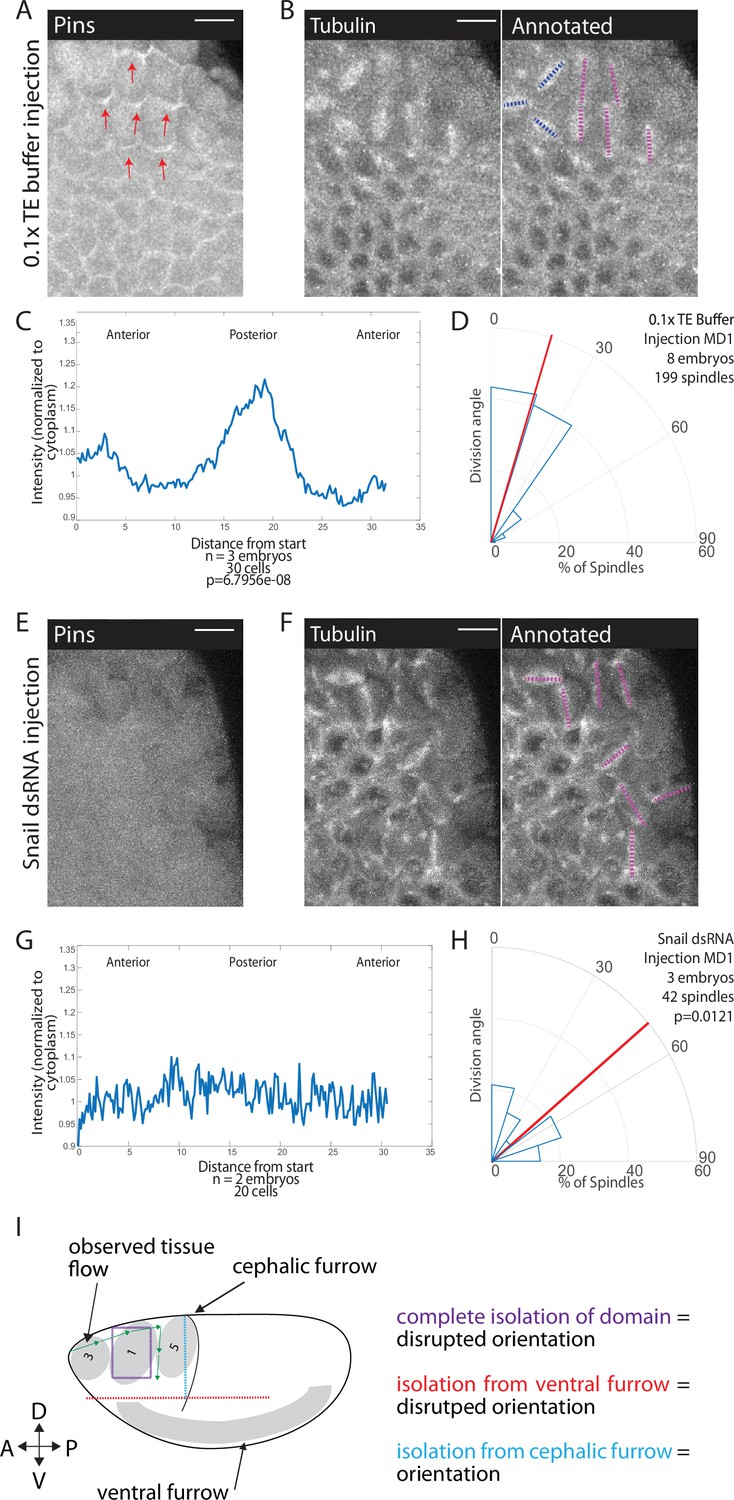
Snail depletion disrupts Pins polarization and spindle orientation.
(A,E) Disrupting ventral furrow formation disrupts Pins polarity. Image of mitotic domain 1 (MD1) of control embryo (A, 0.1× TE buffer injection) or MD1 of Snail dsRNA injected embryo (E). Images show labeled Pins (Pins::YFP), red arrows point to crescents of Pins in control, scale bar is 10 µm. (B, F) Snail depletion disrupts division orientation. Left, image of MD1 of control embryo (B, 0.1× TE buffer injection) or MD1 of Snail-depleted embryo (F). Images show marker (Tubulin::mCherry) to mark mitotic spindles (grayscale), scale bar is 10 µm. Right, same image annotated with dashed lines to indicate spindle position. (C, G) Quantification of Pins intensity for control embryos (C, 0.1× TE buffer injection) or Snail dsRNA injected embryo (G). Intensity was normalized to cytoplasm. For control (0.1× TE buffer injection) MD1, n=3 embryos and 30 cells. For Snail depletion MD1, n=2 and 20 cells. (D, H) Quantification of spindle angles for control embryos (H, 0.1× TE buffer injection) or Snail dsRNA injected embryo (H) using rose plots. For control embryos (0.1× TE buffer injection) MD1, n=8 embryos and 199 spindles. For Snail dsRNA injection MD1, n=3 embryos and 42 spindles. Average orientation angles per embryo were statistically different between control and Snail dsRNA injected embryos, Mann-Whitney, p=0.0121. (I) Schematic summary of laser cutting experiments. Complete domain isolation results in disrupted division orientation. Isolation from the ventral furrow through anterior-posterior (AP) cutting also resulted in disrupted division orientation, whereas isolation from the cephalic furrow through dorsal-ventral (DV) cutting did not affect division orientation.
Figure 7—video 1
Top. Max intensity projection (with Gaussian blur) of control embryo (0.1× TE buffer injection) (left) or embryo injected with Snail dsRNA (right) with fluorescently labeled Pins::YFP and cropped to focus on divisions of mitotic domain 1 (MD1).
Scale bar = 10 μm. Bottom. Max intensity projection (with Gaussian blur) of same control embryo (0.1× TE buffer injection) (left) or same embryo injected with Snail dsRNA (right) with fluorescently labeled tubulin (to label mitotic spindle).
Additional files
-
MDAR checklist
- https://cdn.elifesciences.org/articles/78779/elife-78779-mdarchecklist1-v1.pdf
-
Supplementary file 1
Fly stocks and crosses used in this study.
- https://cdn.elifesciences.org/articles/78779/elife-78779-supp1-v1.xlsx
Download links
A two-part list of links to download the article, or parts of the article, in various formats.
Downloads (link to download the article as PDF)
Open citations (links to open the citations from this article in various online reference manager services)
Cite this article (links to download the citations from this article in formats compatible with various reference manager tools)
Morphogenetic forces planar polarize LGN/Pins in the embryonic head during Drosophila gastrulation
eLife 11:e78779.
https://doi.org/10.7554/eLife.78779


