A cellular and molecular analysis of SoxB-driven neurogenesis in a cnidarian
- Centre for Chromosome Biology, School of Natural Sciences, National University of Ireland Galway, Ireland
- Centre for Microscopy and Imaging, Discipline of Anatomy, National University of Ireland, Galway, Ireland
- National Centre for Biomedical Engineering Science, National University of Ireland, Galway, Ireland
- Carbohydrate Signalling Group, Microbiology, School of Natural Sciences, National University of Ireland Galway, Ireland
- Whitney Laboratory for Marine Bioscience, University of Florida, United States
- Department of Biology, University of Florida, United States
- Computational and Statistical Genomics Branch, Division of Intramural Research, National Human Genome Research Institute, National Institutes of Health, United States
Figures
Figure 1 with 4 supplements
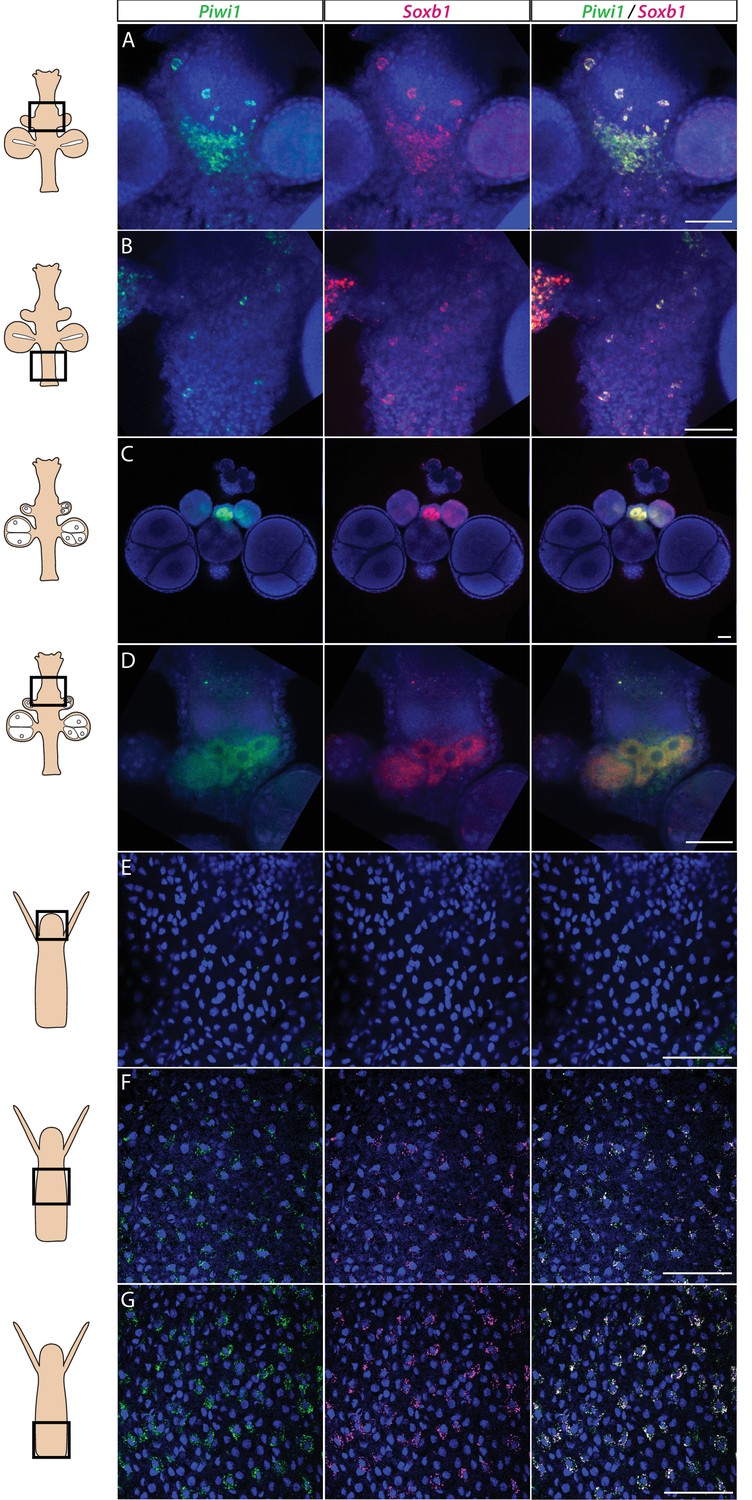
Piwi1 and Soxb1 are co-expressed in i-cells and germ cells.
(A–D) Analysis of sexual polyps’ mid (A) and lower (B) body column, and early (C) and late (D) oocytes. (E–G) Analysis of feeding polyps’ head (E), mid-(F), and lower (G) body column. (A–D) were tyramide-based fluorescence in situ hybridization (FISH); (E–G) were single-molecule FISH. Scale bars = 40 μm.
Figure 1—figure supplement 1
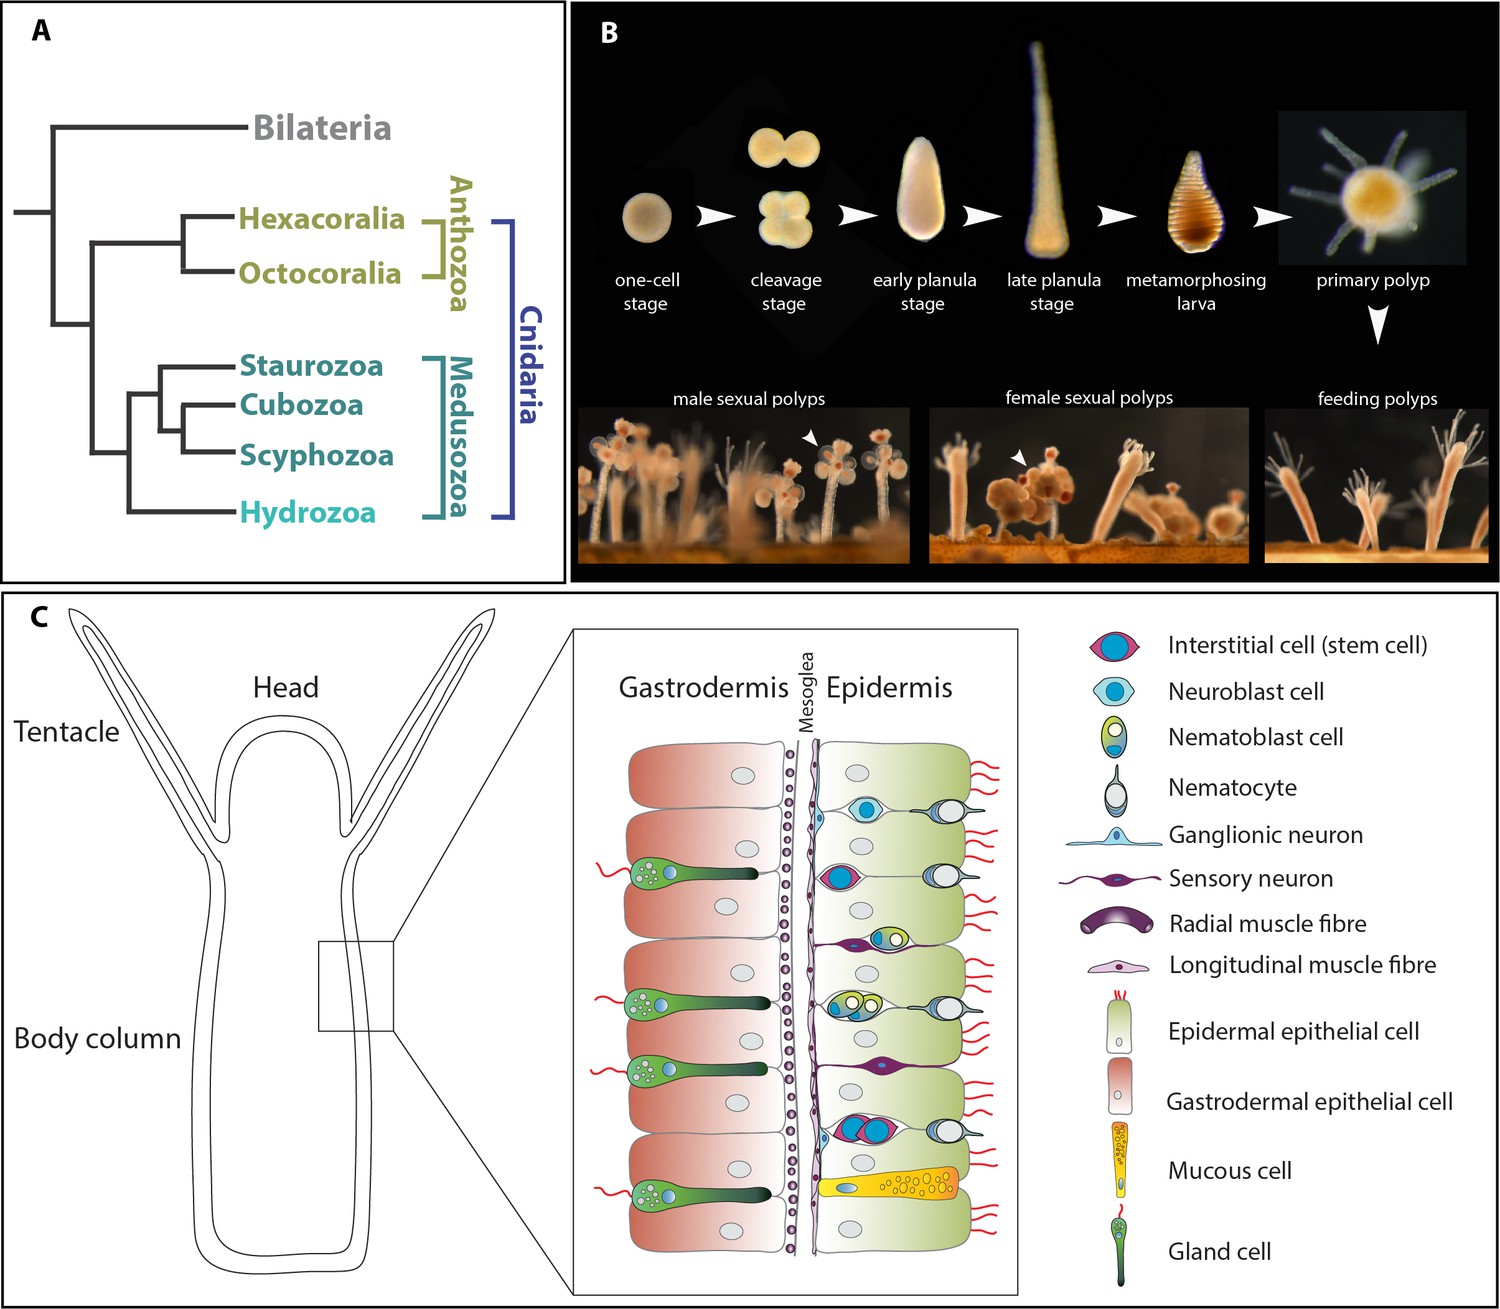
The animal model Hydractinia.
(A) Simplified cladogram showing the position of various cnidarian clades relative to bilaterians. (B) The life cycle of Hydractinia. (B) Schematic representation of Hydractinia’s body wall and the cell types composing it.
Figure 1—figure supplement 2
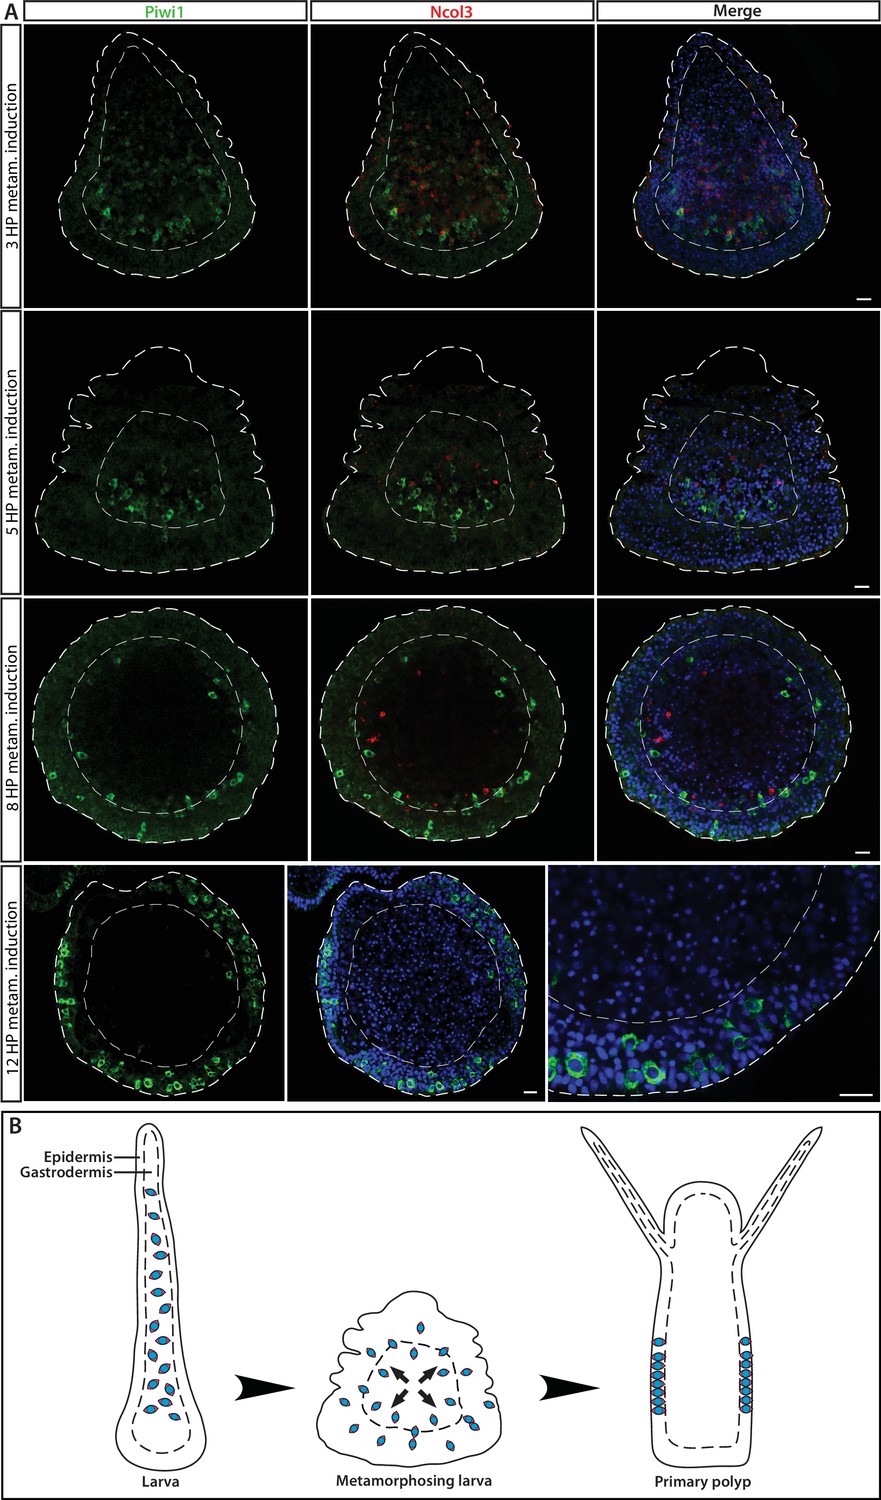
i-Cell location during different stages in ontogeny, marked by Piwi1.
(A) During embryogenesis and in the larval stage, i-cells are exclusively present in the endoderm; they migrate to the epidermis during metamorphosis. (B) Schematic representation.
Figure 1—figure supplement 3
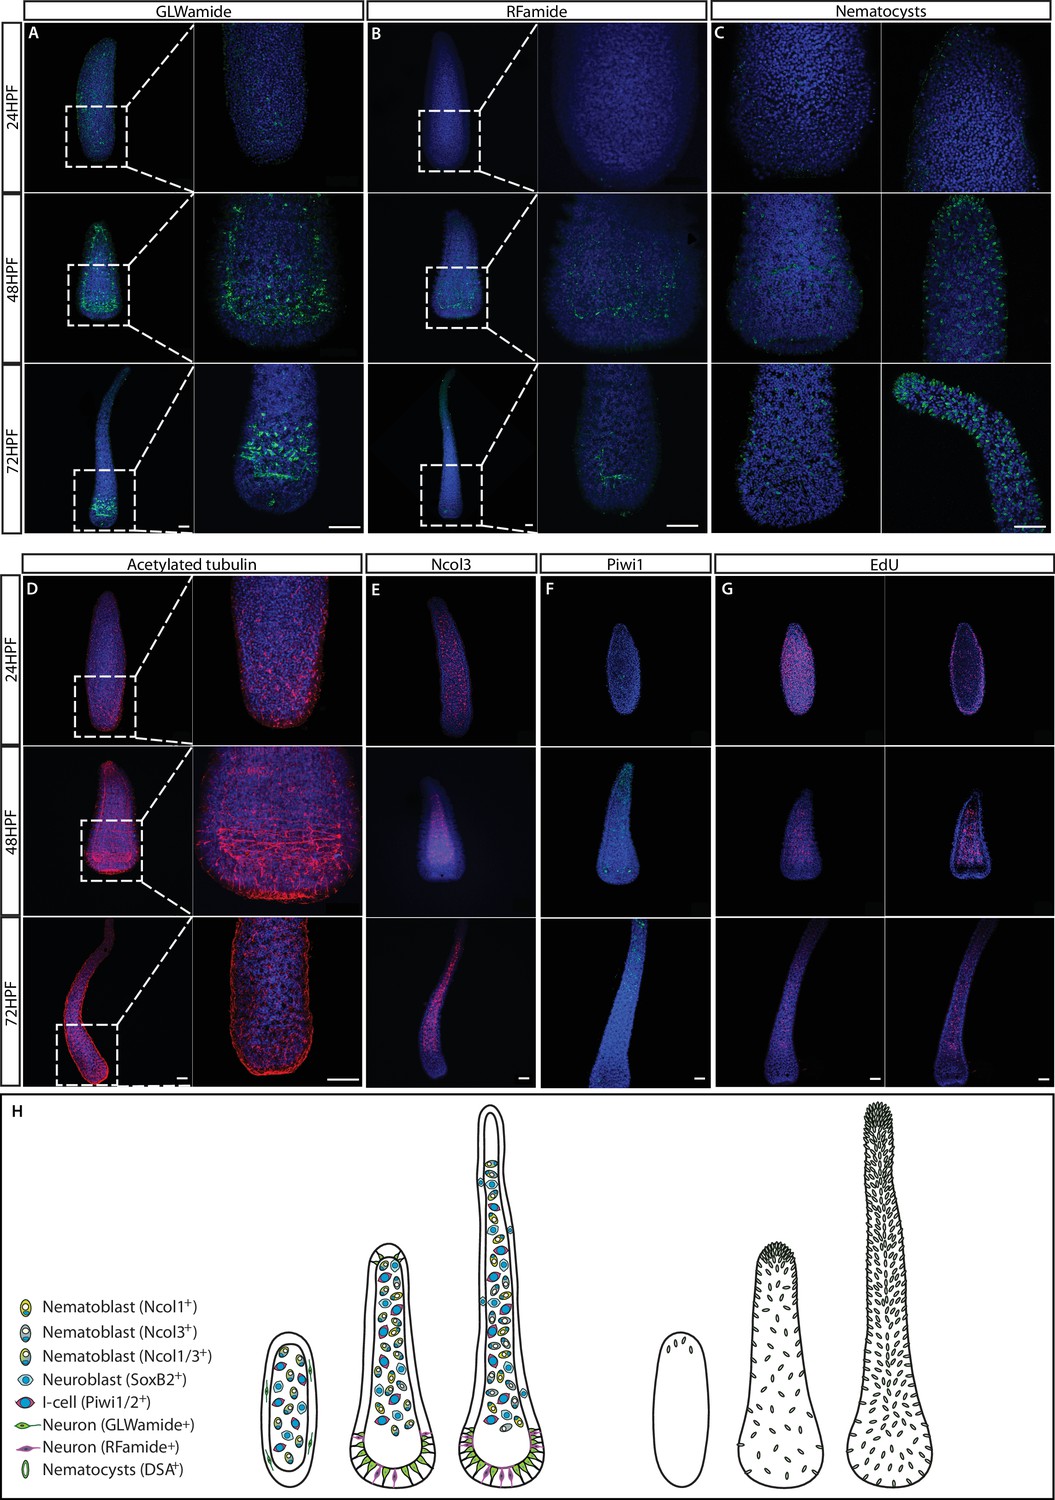
The structure of the nervous system in embryogenesis and larvae.
(A) GLWamide+ neurons. (B) RFamide+ neurons. (C) Nematocyst capsules, representing mature nematocytes, visualized by lectin staining. (D) Acetylated tubulin immunostaining. (E) Ncol3+ nematoblasts. (F) Piwi1+ i-cells. (G) S-phase cells. (H) Schematic representation showing 24 hr embryos, 2-day pre-panula, and 3-day planula larva that is metamorphosis competent. Scale bars = 40μm.
Figure 1—figure supplement 4
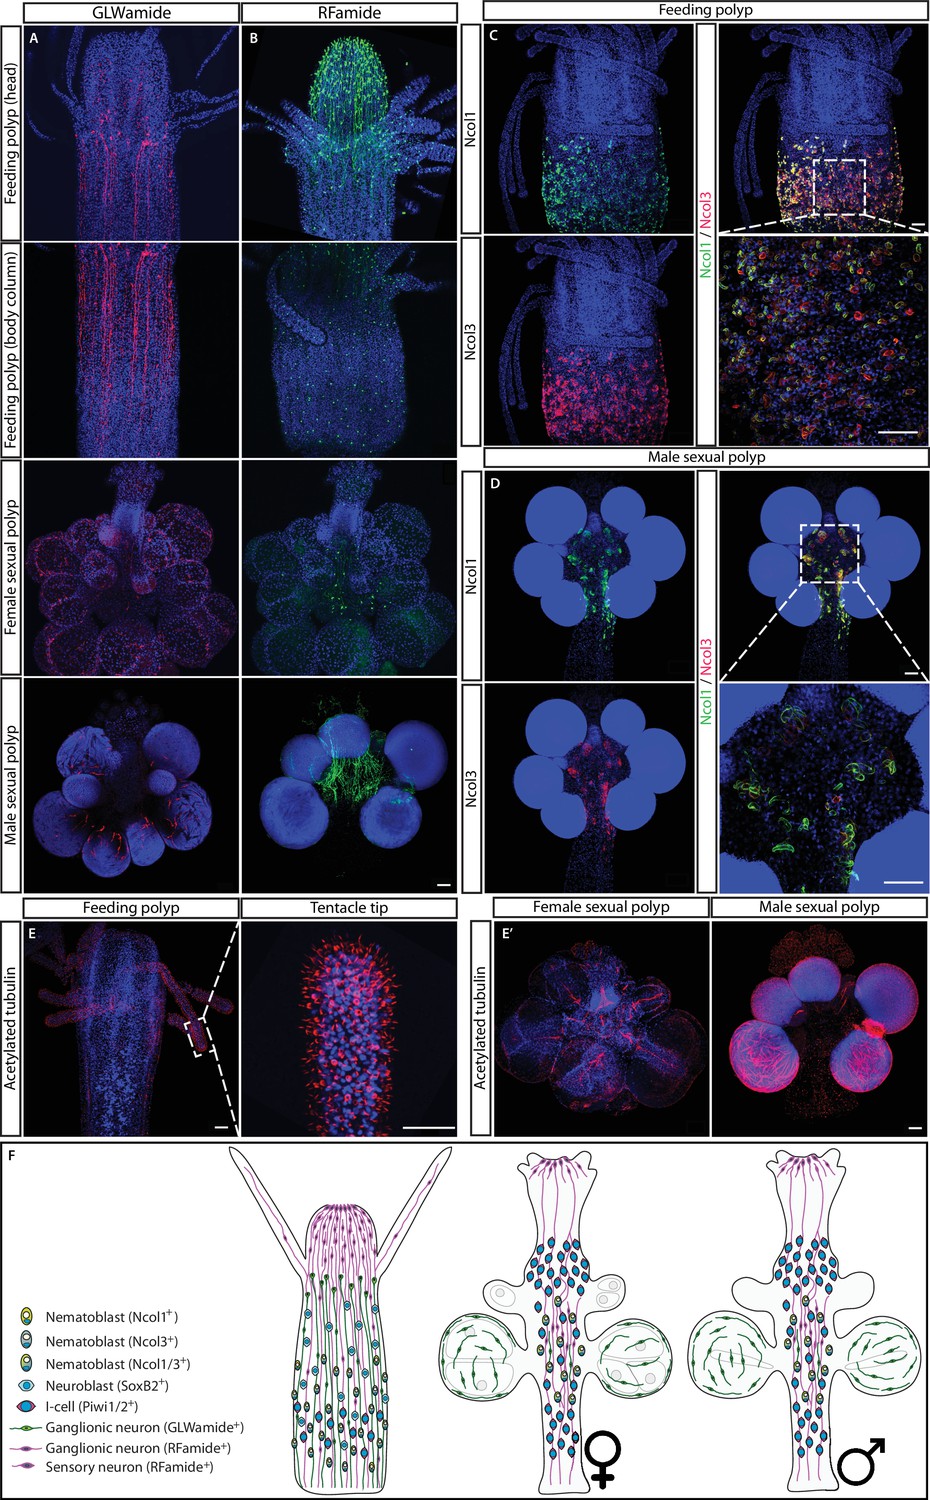
The structure of the nervous system in adult feeding and sexual polyps.
(A) GLWamide+ neurons. (B) RFamide+ neurons. (C) Ncol1+ and Ncol3+ nematoblasts in feeding polyps. (D) Ncol1+ and Ncol3+ nematoblasts in sexual polyps. (E) Acetylated tubulin immunostaining in sexual polyps. (F) Schematic representation. Scale bars = 40μm.
Figure 2
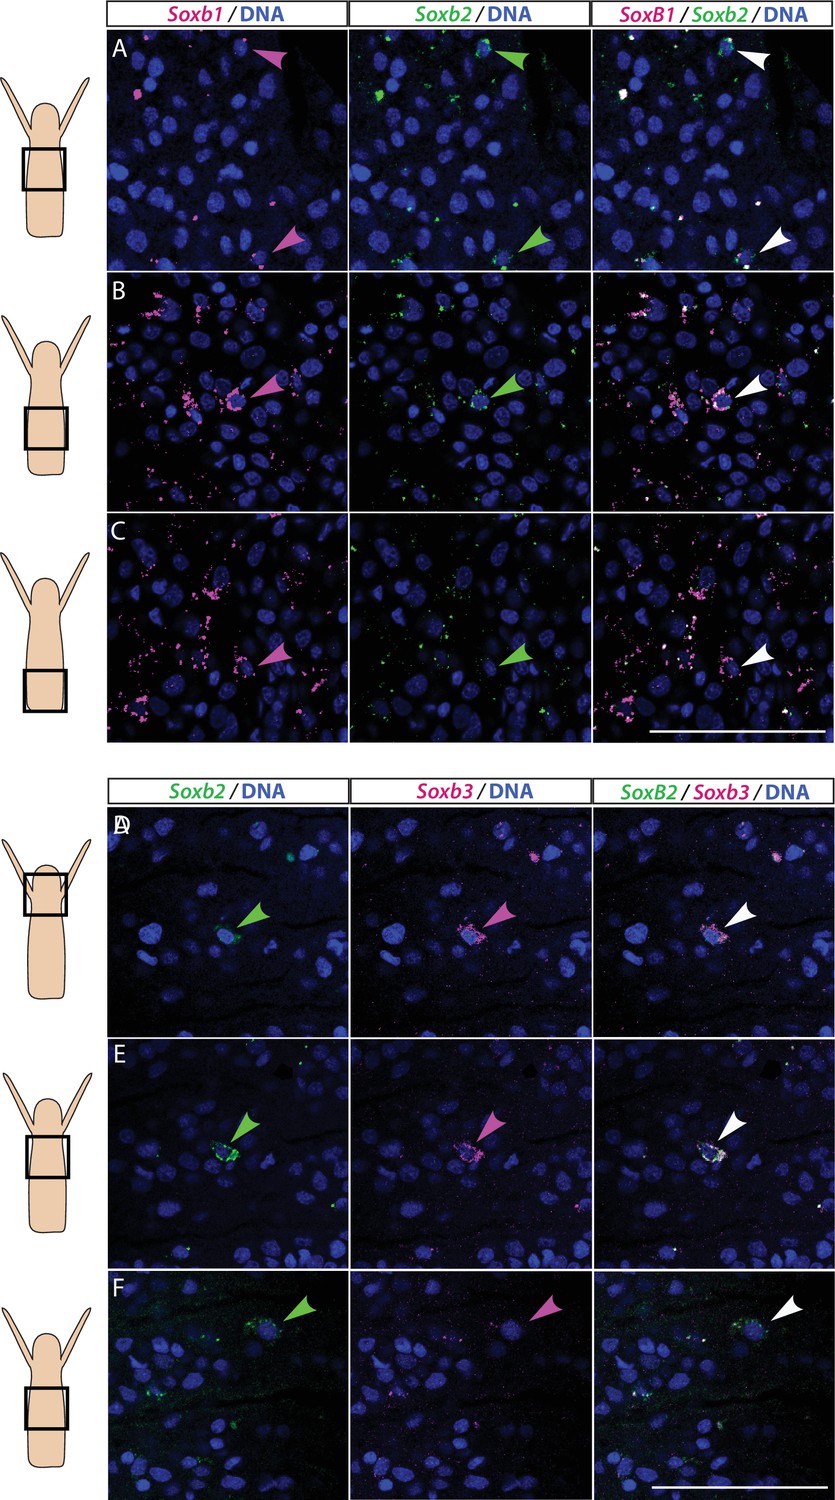
Partial overlap in the expression of Soxb1 and Soxb2, and Soxb2 and Soxb3 in feeding polyps.
(A–C) Single-molecule fluorescence in situ hybridization (FISH) with probes against Soxb1 and Soxb2 showing upper-mid (A), lower-mid (B), and lower (C) body column. (D–F) Single-molecule FISH with probes against Soxb2 and Soxb3 showing the head region (D), upper-mid (E), and lower-mid (F) body column. Arrowheads point to double-positive cells. Scale bars = 40 μm.
Figure 3
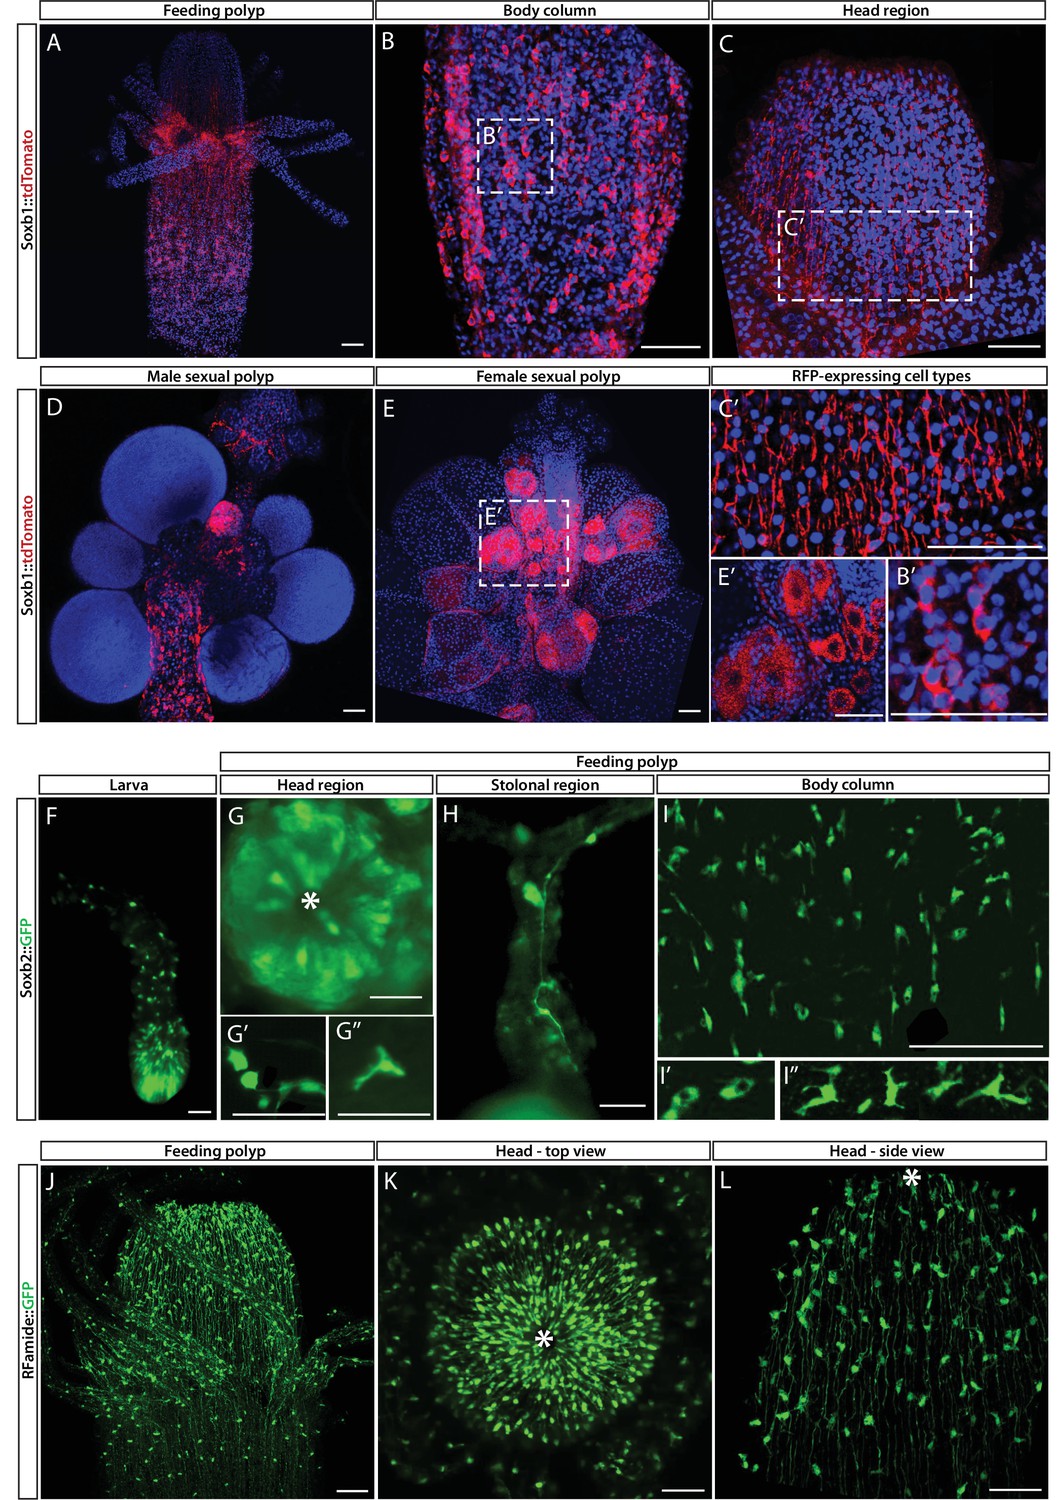
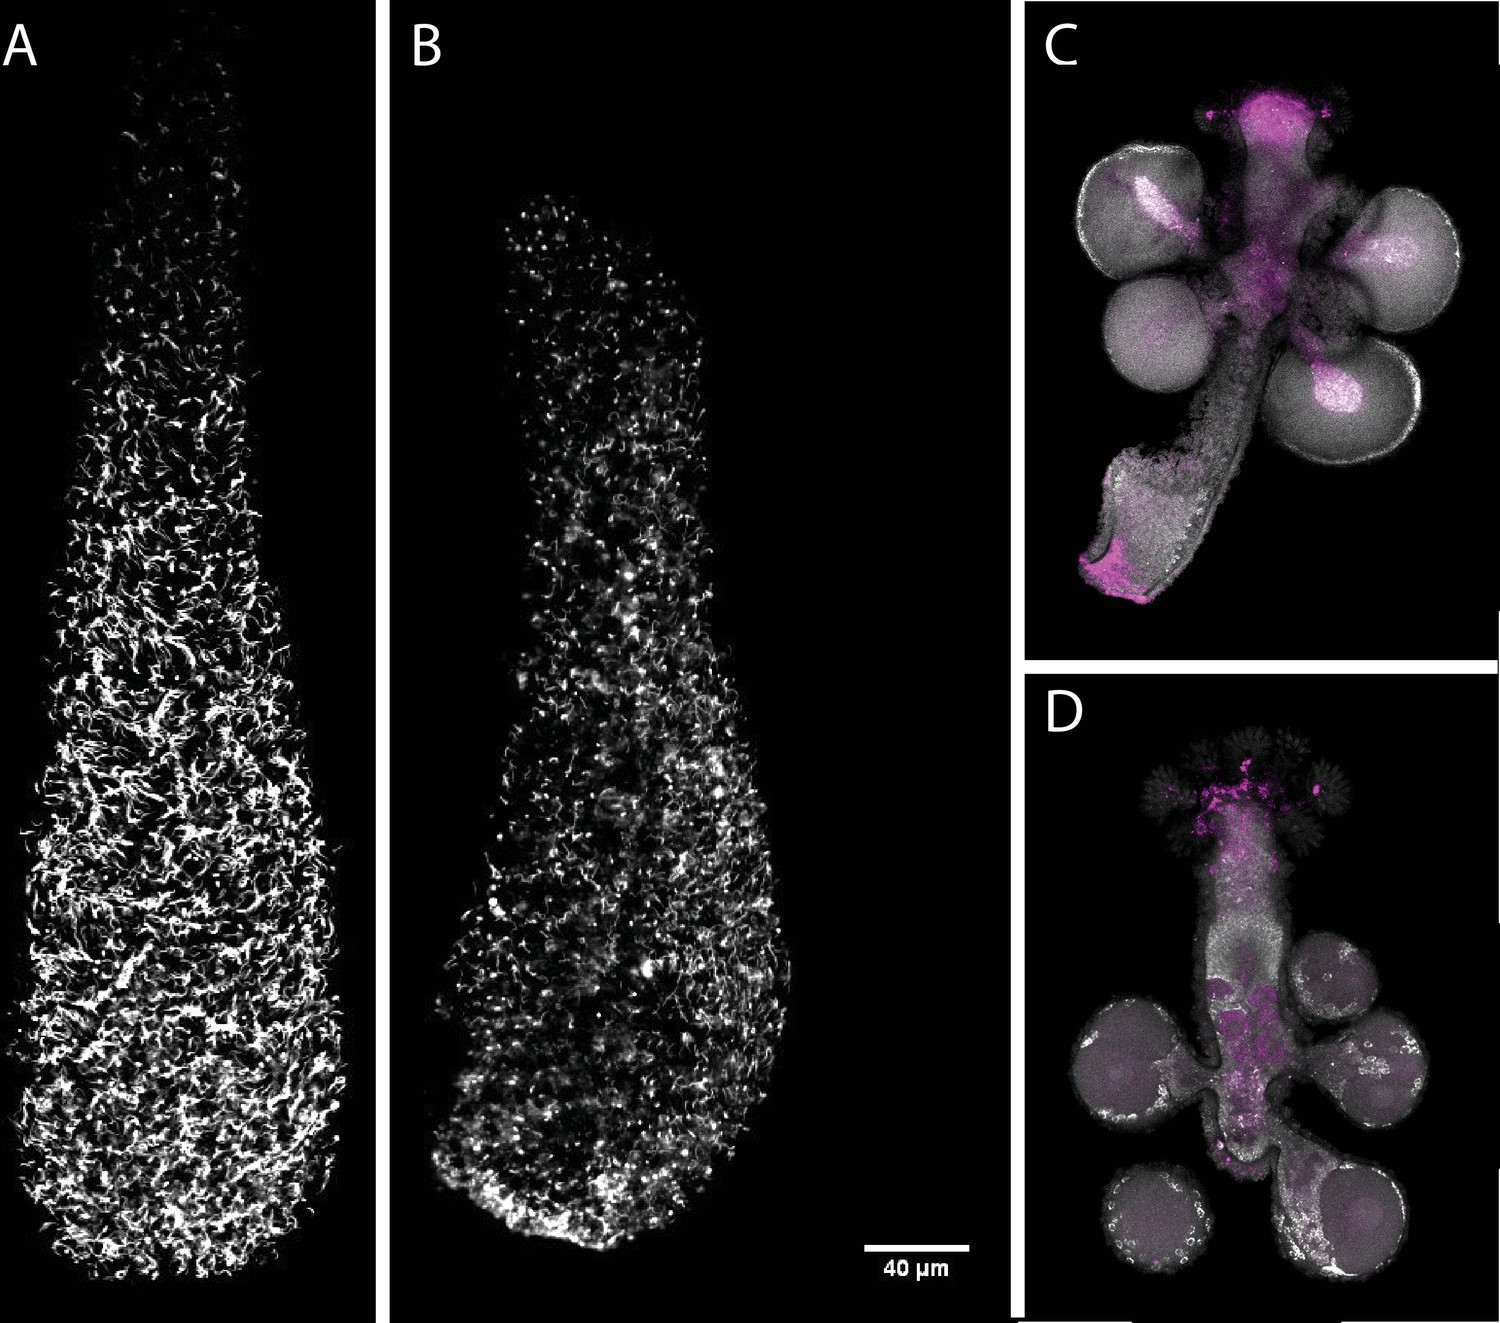
Soxb1, Soxb2, and Rfamide transgenic reporter animals.
(A–E) Soxb1::tdTomato reporter animal. Animals were fixed and stained with an anti-dsRed antibody. (A) Whole feeding polyp. (B) Lower polyp body column. (B’) Higher magnification of tdTomato+ i-cells. (C) Head region including base of tentacles. (C’) Close-up showing tdTomato+ neurites. (D) Male sexual polyp. (E) Female sexual polyp. (E’) Higher magnification of tdTomato+ oocytes. (F–I) Live imaging of a Soxb2::GFP reporter animal. (F) planula larva. (G) Oral pole of a polyp viewed from above. (G’, G’’) Higher magnification of GFP+ cells with neural morphology. (H) GFP+ interconnected neurons in stolon. (I) Mid-body column region of polyp showing GFP+ cells. (I’) GFP+ nematoblasts (based on the presence of a nematocyst capsule). (I’’) GFP+ neurons. (J–L) Live imaging of Rfamide::GFP+ reporter feeding polyps. (J) Upper polyp region including head and tentacles. (K) Oral pole of feeding polyp viewed from above. (L) Higher magnification of the head region, showing GFP+ neural network. Asterisks point to oral ends. Scale bars = 40 μm.
Figure 4 with 1 supplement
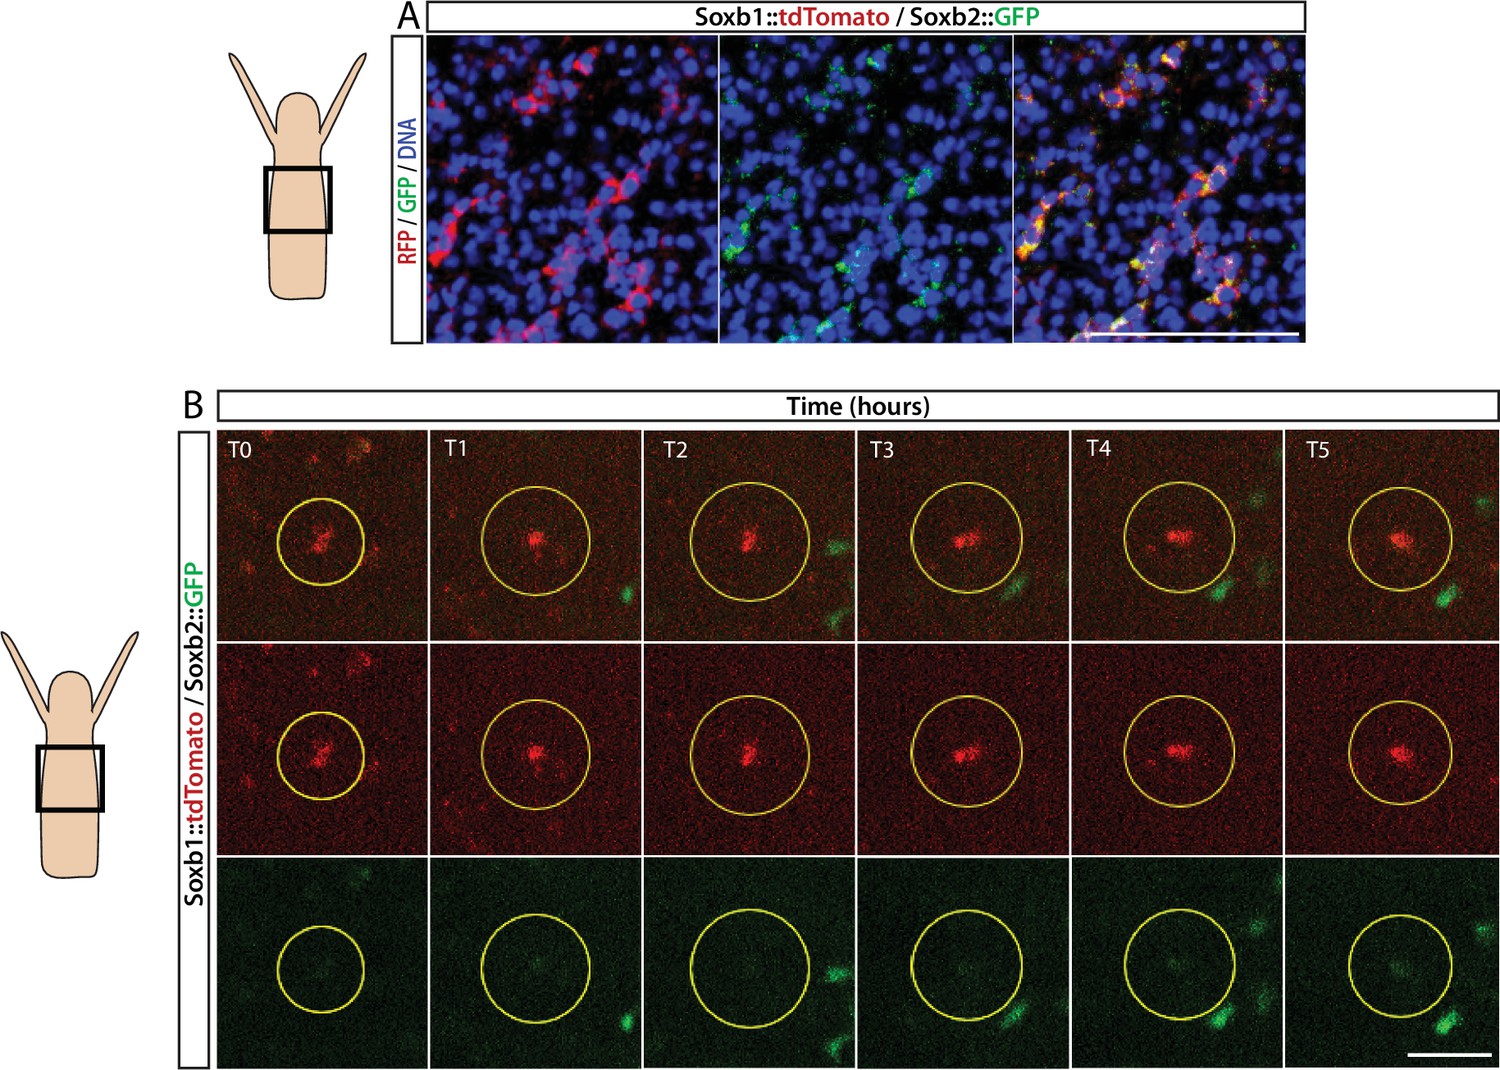
Sequential expression of Soxb1 and Soxb2.
(A) Immunofluorescence of Soxb1::tdTomato and Soxb2::GFP double positive cells that resemble differentiating neurons by morphology. (B) In vivo time lapse imaging of a Soxb1::tdTomato+ cells (shown in red) with increasing levels of Soxb2::GFP (shown in green) over a time frame of 8 hr (T0=3 hr post decapitation (hpd); T1=4 hpd;...; T5=8 hpd). Green Soxb2::GFP cells that appear in the image probably migrated into the confocal plane during imaging. Scale bars = 40 μm.
Figure 4—figure supplement 1
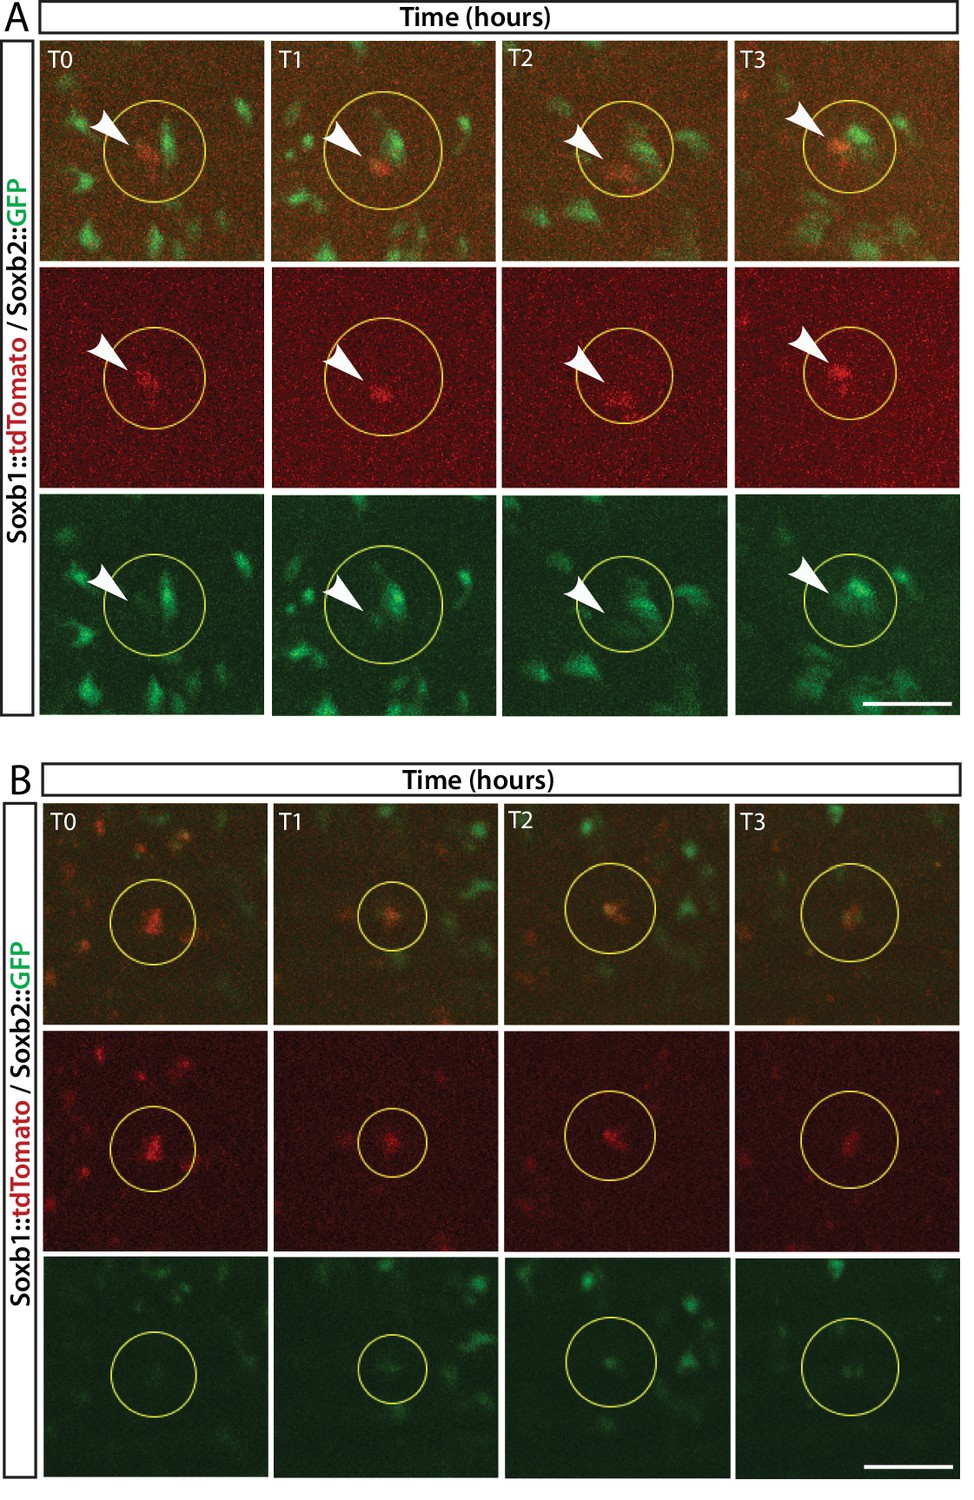
In vivo time lapse imaging of a Soxb1::tdTomato/Soxb2::GFP double transgenic reporter animal.
(A, B) Two cases of gradual upregulation of the Soxb2 reporter in Soxb1-expressing cells over an 8 hr time frame.
Figure 5 with 3 supplements
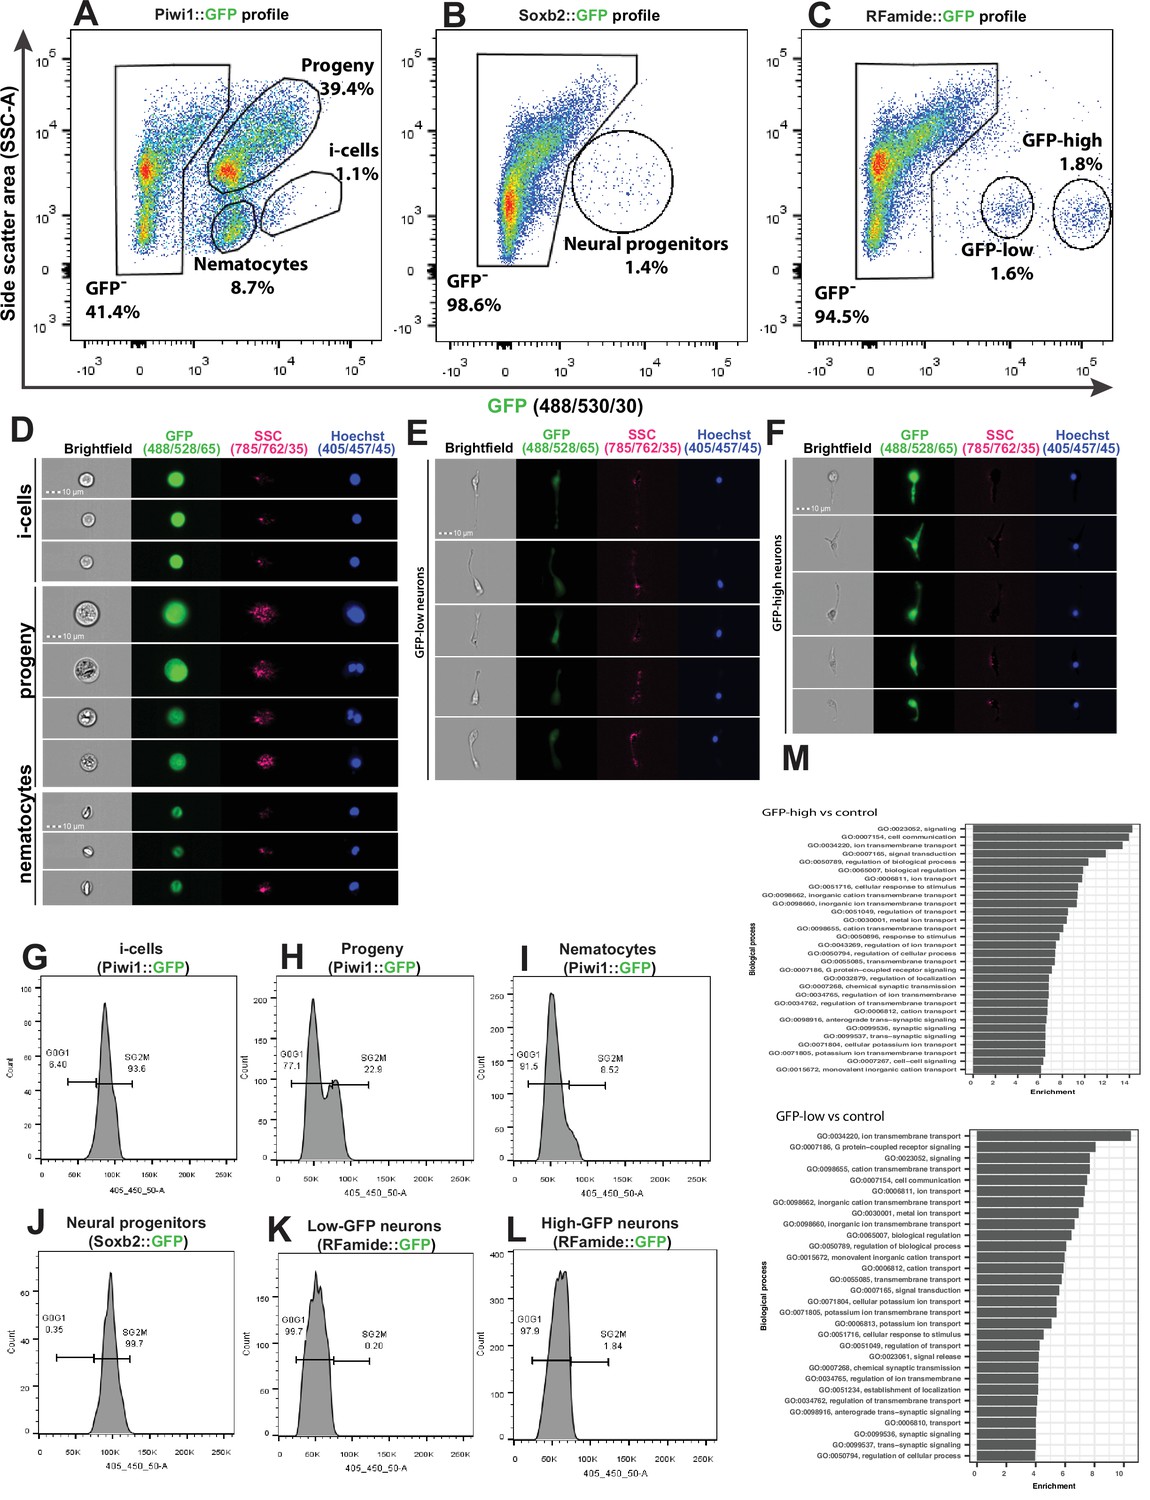
Analysis of dissociated Hydractinia cells by conventional and imaging flow cytometry.
(A) Gating strategy of i-cells, nematocytes, mixed progenitors, and GFP- cells from a Piwi1 reporter animal. (B) Gating of putative neural progenitors from a Soxb2 reporter animal. (C) Gating two distinct populations of Rfamide::GFP+ neurons. (D–F) Imaging flow cytometric analysis of cells from the transgenic reporter animals. (G–L) Cell cycle analysis of distinct, sorted cell populations. (G) i-Cells are mostly in S/G2/M. (H) i-Cell progeny are distributed along the cell cycle. (I) Nematocytes are mostly in G1. (J) SoxB+ (putative neural progenitors) are mostly in S/G2/M. (K) Low and (L) high Rfamide+ neurons. (M) Differential gene expression analysis of sorted cell populations. Genes expressed by Rfamide-high and Rfamide-low neurons are listed.
Figure 5—figure supplement 1
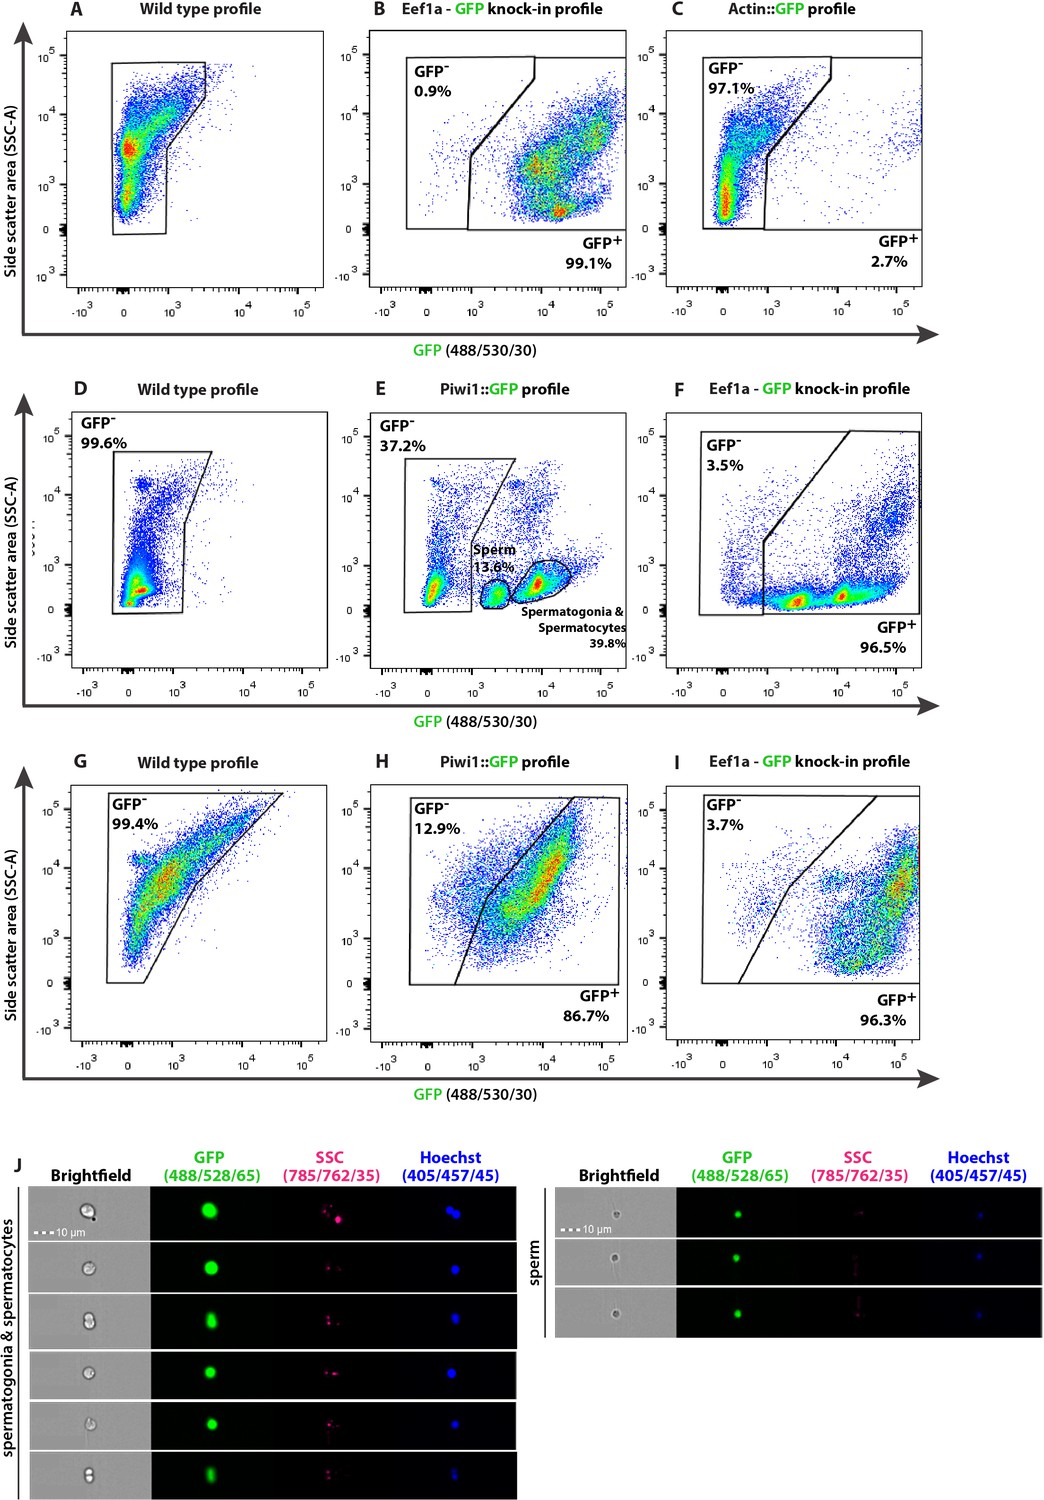
Representative flow cytometry density plots identifying subpopulations as defined by internal complexity (side scatter [SSC]) and level of GFP expression of Hydractinia transgenic reporter animals and matched wild type animals (A–I) and imaging flow cytometry (J).
(A–C) Characterization of feeding polyps, (D–F) male and (G–I) female sexual polyps. The nature of the reporter transgene is indicated above each density plot. (J) Imaging flow cytometric analysis of dissociated male sexual polyps of Piwi1::GFP reporter line, displaying the different stages of spermiogenesis including mature sperm cells. Scale bars = 10 μm.
Figure 5—figure supplement 2
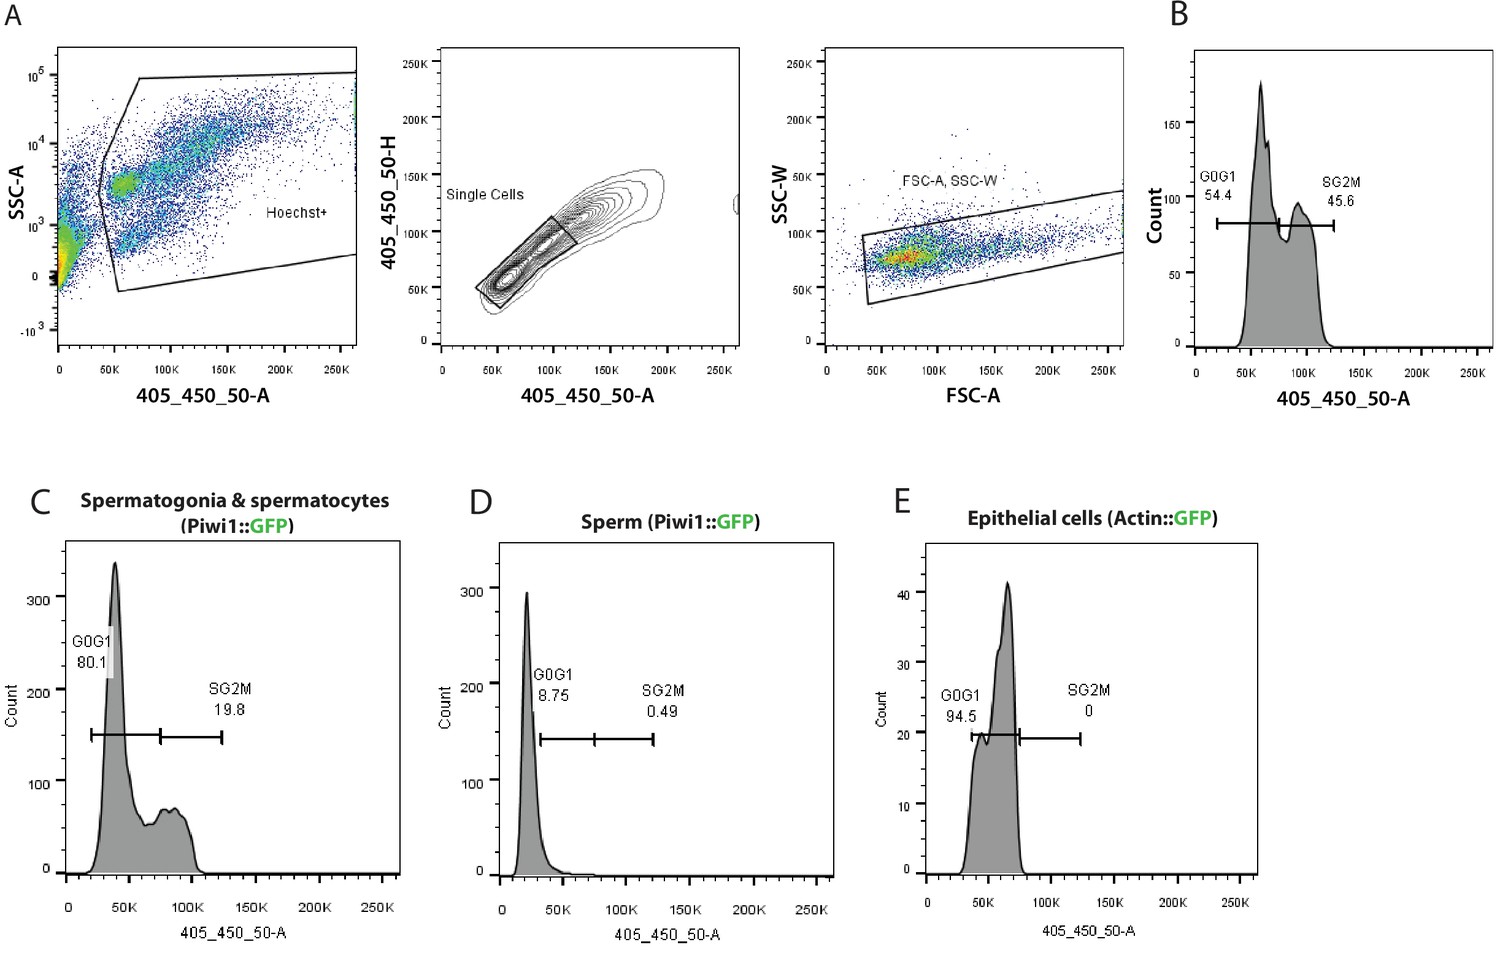
Typical flow cytometry gating strategy used for cell cycle analysis of transgenic animals and a wild type animal.
(A) Density plot of cells stained with Hoechst 33342 cell permeant dye versus side scatter (SSC-A). The gated population represents Hoechst positive live, nucleated cells. Doublets are subsequently discriminated by Hoechst area verus Hoescht height (contour plot) and forward scatter area (FSC-A) versus side scatter width (SSC-W) density plot. (B) Histogram showing a typical cell cycle profile of Hoechst labelled cells disassociated from a wild type Hydractinia animal. Cell cycle profile of cell subpopulations identified in the male sexual polyps of Piwi1::GFP reporter line (C) and (D) cell cycle profile of post-meiotic sperm characterized by a haploid genome. (E) Cell cycle profile of epithelial cells isolated by fluorescence-activated cell sorting (FACS) from an epithelial reporter animal.
Figure 5—figure supplement 3
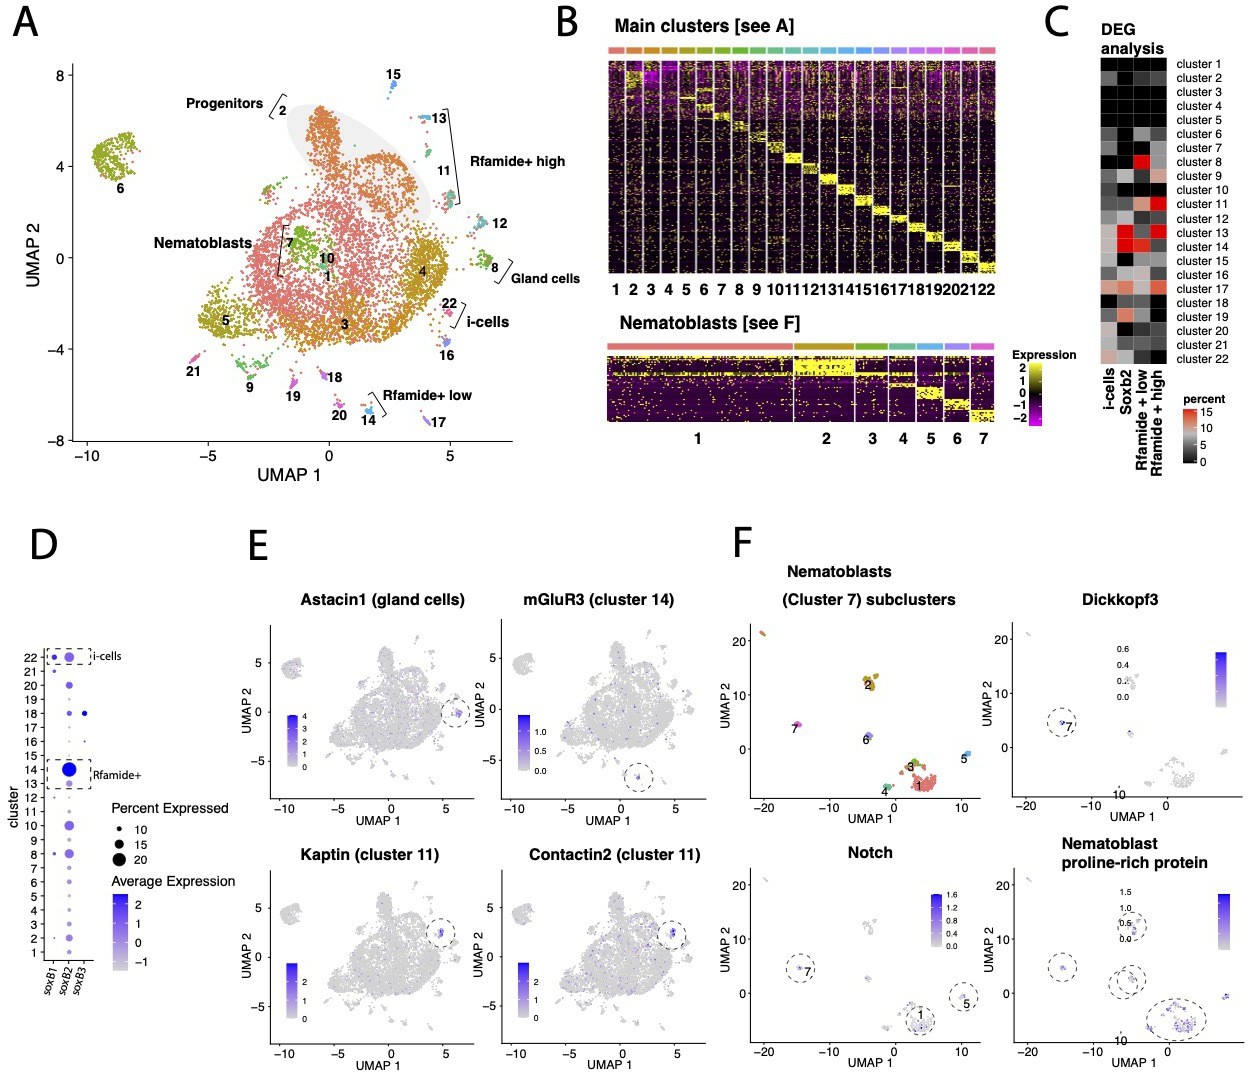
Transcriptomic analysis of Hydractinia single cells.
(A) UMAP dimensional reduction projection of 7071 Hydractinia symbiolongicarpus cells. (B) Heatmap showing the top 10 markers for each cell cluster across all clusters and within nematoblast (cluster 7) subclusters following Seurat analysis. (C) Heatmap showing the percentage overlap between single-cell RNA cluster markers and differentially upregulated genes in fluorescence-activated cell sorting (FACS)-sorted cells from transgenic reporter animals. The heatmap shows that the overlap between Soxb2+ sorted cells and clusters 13 and 14 is highest, that is, consistent with Soxb2 being most highly expressed in these clusters. (D) Dotplot depicting both the percentage proportion and average log-normalized expression of Soxb1, Soxb2, and Soxb3 genes in all cells across the main clusters as shown in (A). We find that both soxB1 and soxB2 are expressed in a subset of i-cells; presumably in transition to become soxB2-positive progenitor cells (clusters 13 and 14 in A), while soxB3 is only expressed in few cells in cluster 18 (see A and D). It also appears that subpopulations of neural cells in H. symbiolongicarpus transition from a soxB2/RFamide low state (cluster 14) that express a G-protein coupled receptor for glutamate (see E) to a soxB2/RFamide high state (cluster 13), of which some eventually become soxB2-negative while still expressing high levels of RFamide (cluster 11); presumably as terminally differentiated axonal neurons as determined by the markers Kaptin and Contactin2, which are important in synapse and axon formation, maintenance and function (see E). This is consistent with our model and bolsters the role of soxB2 as a marker for a neural progenitor cells. (E) UMAP dimensional reduction projections of relevant marker gene expression in representative cluster as annotated in panel (A). (F) Subclustering of nematoblasts (cluster 7 in panel A): UMAP dimensional reduction projection of 259 cells of H. symbiolongicarpus nematoblasts accompanied by projections showing the expression of nematogenesis marker genes (Dickkopf3, Notch and a proline-rich protein homologous to the nematoblast-specific protein nb039a-sv15 of Hydra vulgaris) across several subclusters.
Figure 6 with 2 supplements
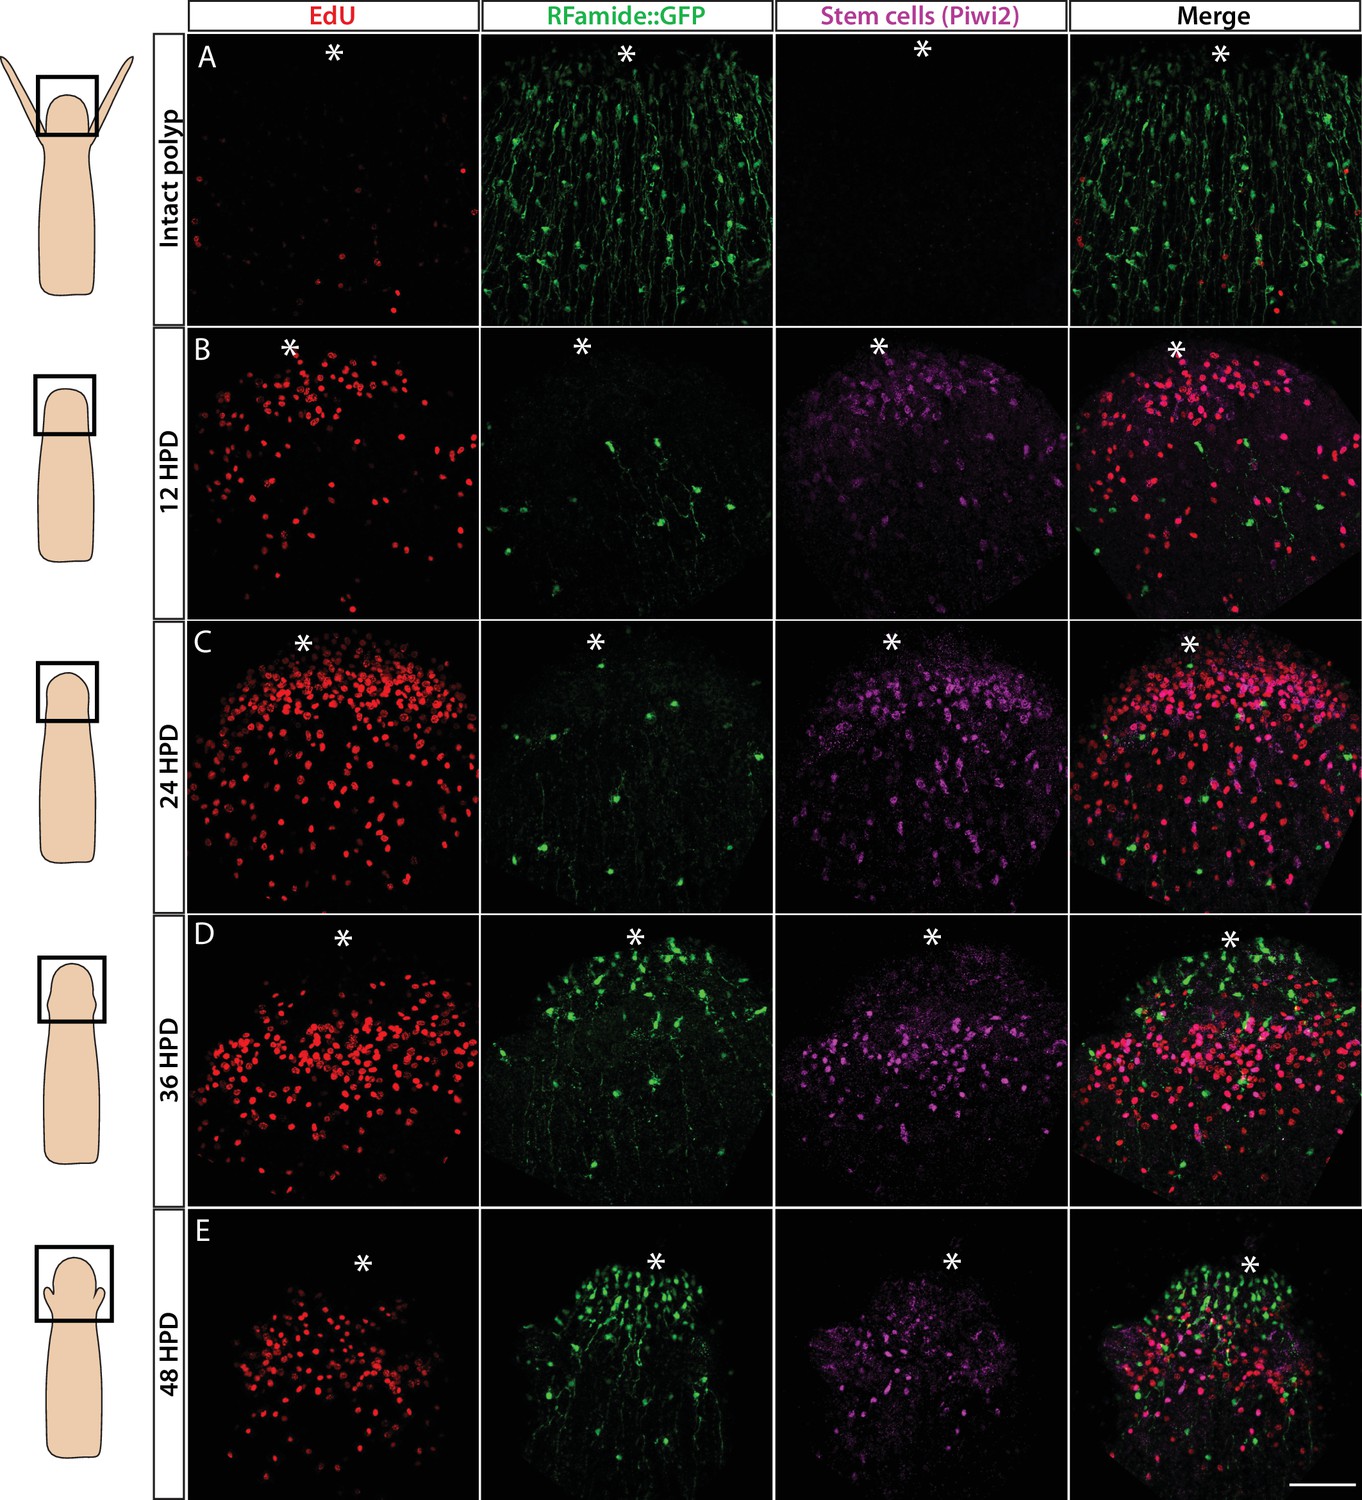
Cellular events during Hydractinia head regeneration in an Rfamide::GFP transgenic reporter animal.
(A) Intact head, characterized by few S-phase cells, extensive RFamide+ neuronal network, and no Piwi1high i-cells or their putative Piwi1low progeny. (B) 12 hr post decapitation (hpd) showing many proliferative cells, only few remnant RFamide + neurons, and few immigrating i-cells and progeny. (C) 24 hpd. High numbers of EdU incorporating cells, few RFamide+ neurons, and increasing i-cells and putative progeny are seen at the oral regenerating end. (D) 36 hpd. High number of S-phase cells, increased number of RFamide+ neurons, and further increase in i-cell numbers are seen. (E) 48 hpd. Decreasing numbers of S-phase cells, increasing numbers of RFamide+ neurons, and decreasing numbers of i-cells are observed. Scale bars = 40μm.
Figure 6—figure supplement 1
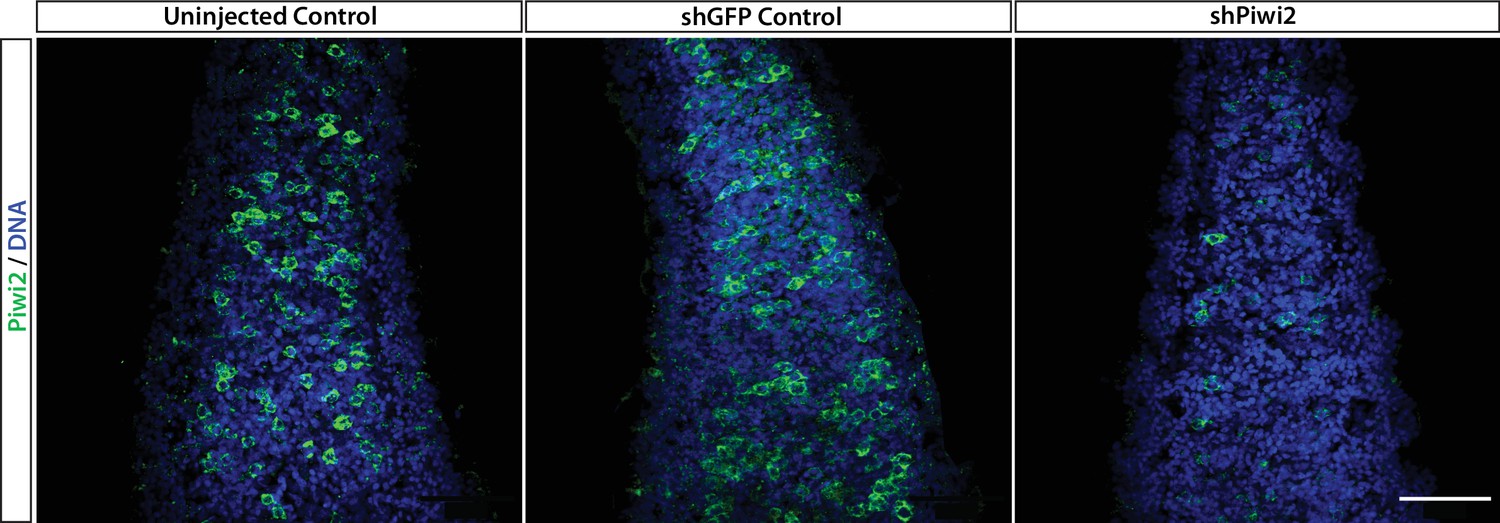
Piwi2 antibody validation.
Zygotes were injected with an shRNA targeting Piwi2 (shPiwi2) or a control shRNA targeting the GFP sequence (shGFP). At 48 hr post fertilization, animals were fixed and stained with the anti-Piwi2 antibody. Fewer Piwi2+ i-cells are detectable in shPiwi2 than in the control. Scale bars = 40μm.
Figure 6—figure supplement 2
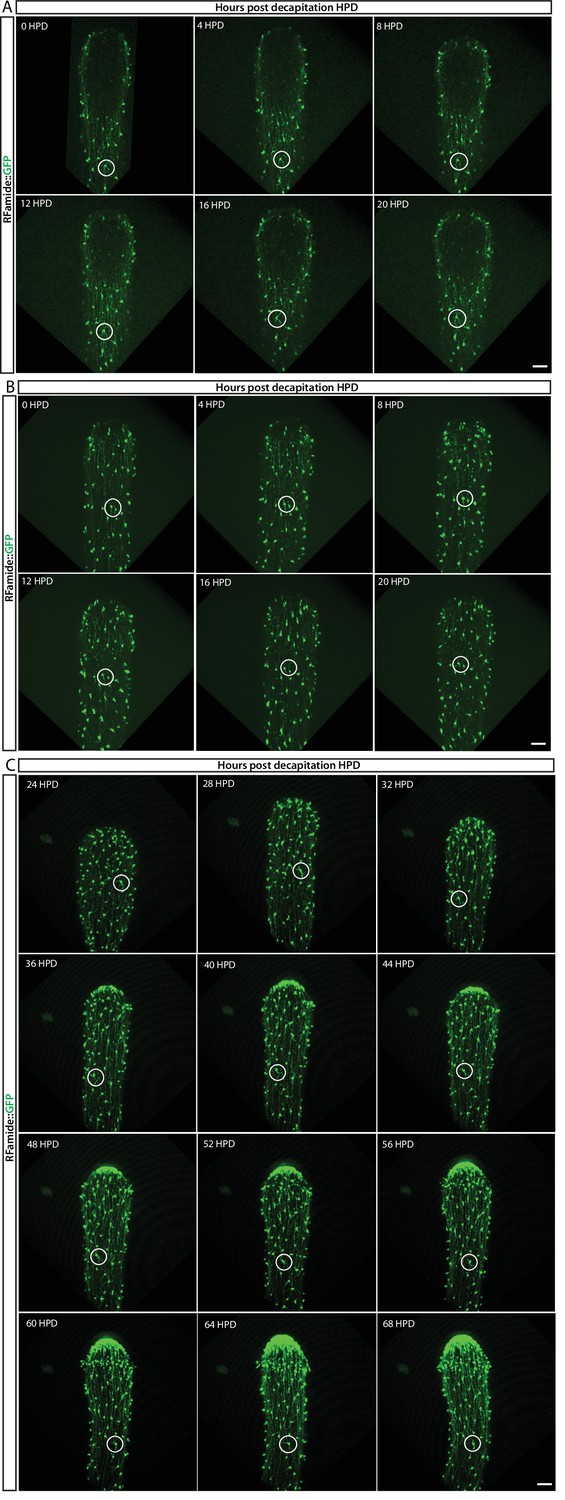
In vivo tracing of RFamide-GFP+ neurons during regeneration located in the (A) lower part and (B) upper part of the body column during the first 20 hr post decapitation (hpd), and (C) from 24 hpd until 72 hpd.
No cell proliferation or migration of individual neurons (circled) was observed, indicating no role during this process. Images are single optical slices. Scale bars = 40 μm.
Figure 7 with 2 supplements

Effects of SoxB genes downregulation in embryogenesis.
(A) Short hairpin RNA (shRNA)-mediated knockdown of Soxb1, Soxb2, and Soxb3. (B) Higher magnification of Piwi1+ and S-phase cells showing reduced i-cell numbers following Soxb1 downregulation. Note proliferative cells in epidermis, not seen in untreated and following Soxb2 or Soxb3 downregulation. (C) Quantification of phenotypes. Scale bars = 40μm.
Figure 7—figure supplement 1
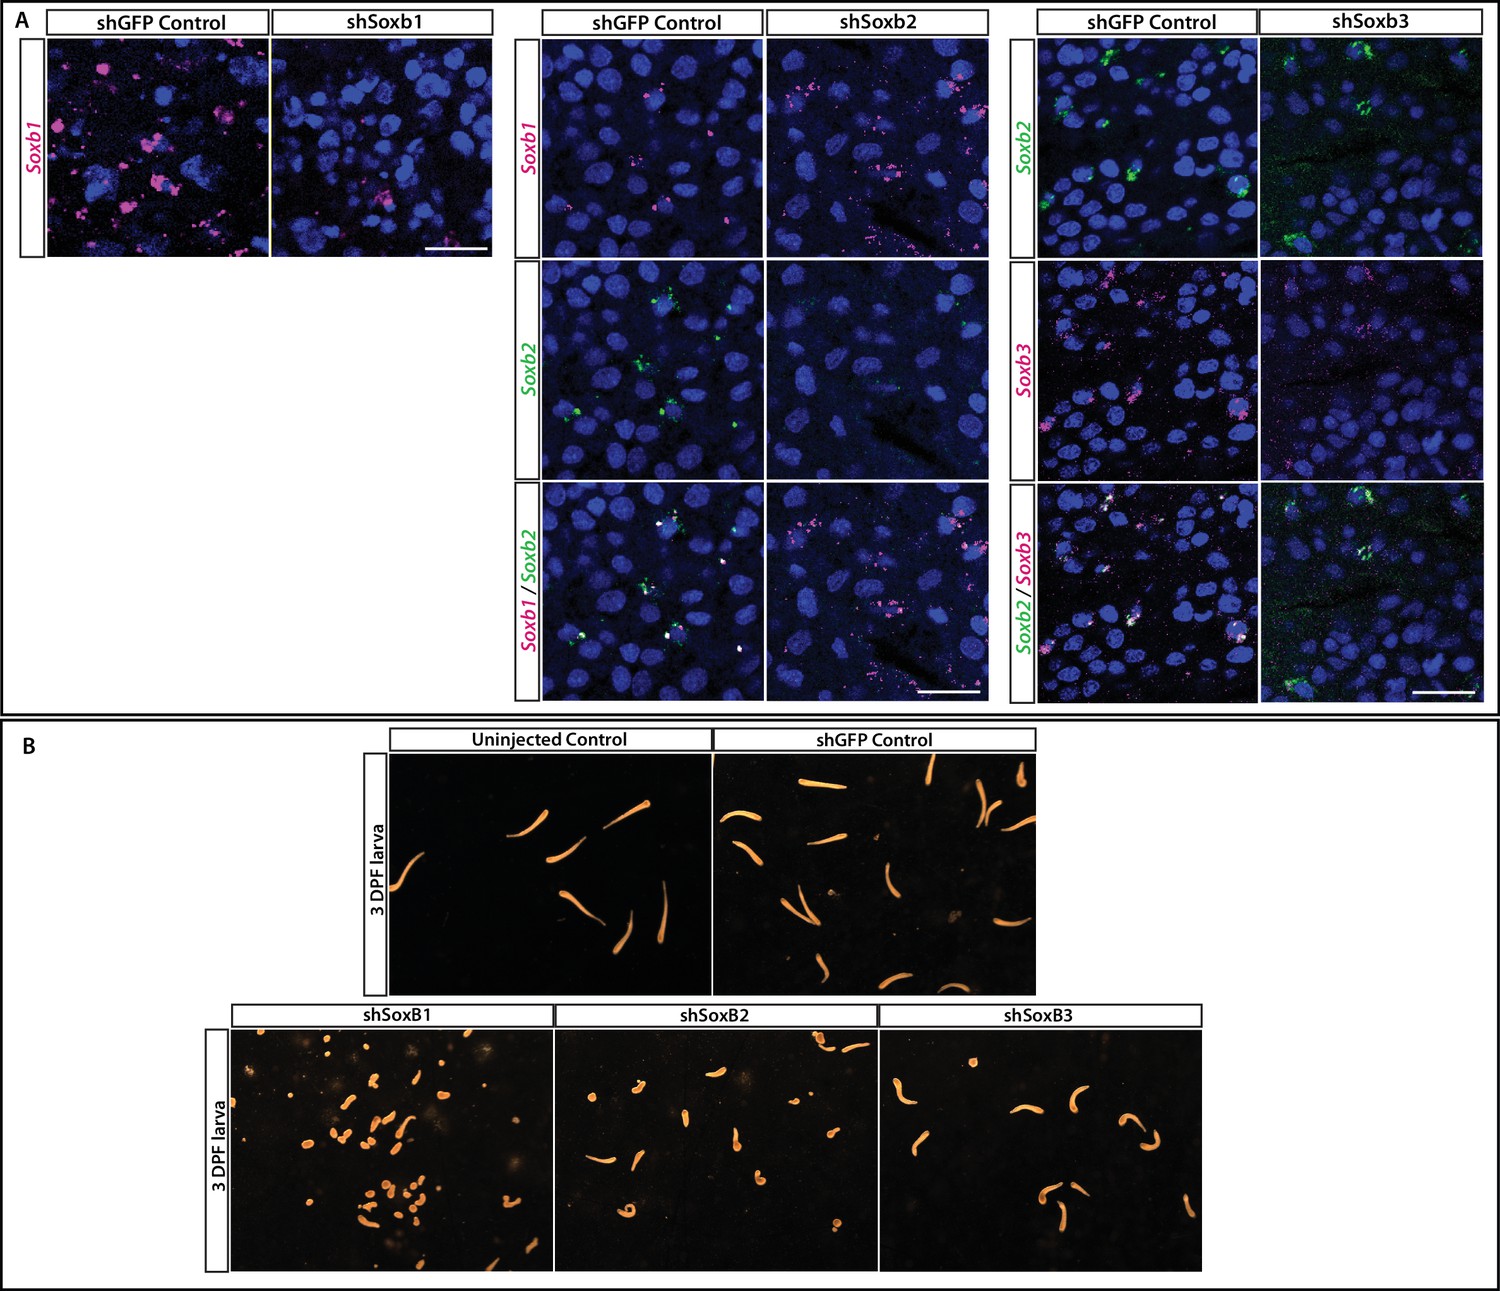
Validation of shRNA experiments.
(A) Validation of shSoxB1, shSoxB2, and shSoxB3 knockdowns by single-molecule fluorescence in situ hybridization (SABER FISH) on 3DPF larvae. Larvae injected with shSoxB1 showed lower expression levels of SoxB1 compared to the control animals. Larvae injected with shSoxB2 showed lower expression levels of SoxB2 compared to the control animals and SoxB1 levels remained unaffected. Larvae injected with shSoxB3 showed lower expression levels of SoxB3 compared to the control animals and SoxB2 levels remained unaffected. Images are single optical slices. Scale bars = 40 μm. (B) Morphology of control, shGFP-injected, shSoxB1-injected, shSoxB2-injected, and SoxB3-injected larvae. Scale bar = 498 μm. (C) Forced expression of SoxB1::GFP in a neuronal context was lethal. Remnants of GFP could be seen in the vacuoles of phagocytic cells. (1) Polyp head and body. (2) Part of stolonal tissue. GFP was identified by direct fluorescence; Ncol1 by IF. Images are z-stack maximum projections. Scale bars = 40 μm.
Figure 7—figure supplement 2
Effect of Soxb1 downregulation on epidermal ciliation in 3-day old larvae using acetylated tubulin antibody staining and in situ hybridization of Soxb2 in sexual polyps (A) shGFP-injected animal.
(B) shSoxb1-injected animal. (C) Male sexual polyp. (D) Female sexual polyp.
Tables
Key resources table
| Reagent type (species) or resource | Designation | Source or reference | Identifiers | Additional information |
|---|---|---|---|---|
| Antibody | Anti-Piwi1 (rabbit polyclonal) | https://doi.org/10.1126/science.aay6782 | N/A | IF (1:2000) |
| Antibody | Anti-Piwi2 (Guinea pig polyclonal) | In-house | N/A | IF (1:500) |
| Antibody | Anti-acetylated tubulin (mouse monoclonal) | Sigma-Aldrich | Ca# T7451 | IF (1:1000) |
| Antibody | Anti-RFamide (mouse polyclonal) | https://doi.org/10.1007/s004270050181 | IF (1:1000) | |
| Antibody | Anti-GLWamide (rabbit polyclonal) | https://doi.org/10.1007/s004270050181 | IF (1:1000) | |
| Antibody | Anti-Ncol1 (rabbit polyclonal) | https://doi.org/10.1371/journal.pone.0022725.g001 | IF (1:500) | |
| Antibody | Anti-Ncol3 (guinea pig polyclonal) | https://doi.org/10.1371/journal.pone.0022725.g001 | IF (1:500) | |
| Antibody | Anti-GFP (rabbit polyclonal) | Santa Cruz | Ca# 8334 | IF (1:1000) |
| Antibody | Anti-RFP (rat polyclonal) | Chromotek | Ca# 5F8 | IF (1:1000) |
| Strain, strain background (Hydractinia symbiolongicarpus) | 293-10 wild type animals | This paper | N/A | Materials and methods |
| Strain, strain background (Hydractinia symbiolongicarpus) | SoxB1::tdTomato line | This paper | N/A | Materials and methods |
| Strain, strain background (Hydractinia symbiolongicarpus) | SoxB2::GFP line | This paper | N/A | Materials and methods |
| Strain, strain background (Hydractinia symbiolongicarpus) | RFamide::GFP line | This paper | N/A | Materials and methods |
| Strain, strain background (Hydractinia symbiolongicarpus) | RFamide::SoxB1::GFP | This paper | N/A | Materials and methods |
Additional files
-
Supplementary file 1
Combination of cell fractions used for differential gene expression analysis.
- https://cdn.elifesciences.org/articles/78793/elife-78793-supp1-v3.docx
-
Supplementary file 2
Differentially expressed gene lists.
- https://cdn.elifesciences.org/articles/78793/elife-78793-supp2-v3.xlsx
-
Supplementary file 3
Files pertaining to single-cell transcriptomic analysis.
- https://cdn.elifesciences.org/articles/78793/elife-78793-supp3-v3.zip
-
Supplementary file 4
List of SRA accession numbers.
- https://cdn.elifesciences.org/articles/78793/elife-78793-supp4-v3.xlsx
-
MDAR checklist
- https://cdn.elifesciences.org/articles/78793/elife-78793-mdarchecklist1-v3.pdf
Download links
A two-part list of links to download the article, or parts of the article, in various formats.
Downloads (link to download the article as PDF)
Open citations (links to open the citations from this article in various online reference manager services)
Cite this article (links to download the citations from this article in formats compatible with various reference manager tools)
A cellular and molecular analysis of SoxB-driven neurogenesis in a cnidarian
eLife 11:e78793.
https://doi.org/10.7554/eLife.78793


