CD169+ macrophages orchestrate plasmacytoid dendritic cell arrest and retention for optimal priming in the bone marrow of malaria-infected mice
- Albert Einstein College of Medicine, Department of Microbiology and Immunology, United States
- Albert Einstein College of Medicine, Department of Pathology, United States
Figures
Figure 1 with 3 supplements
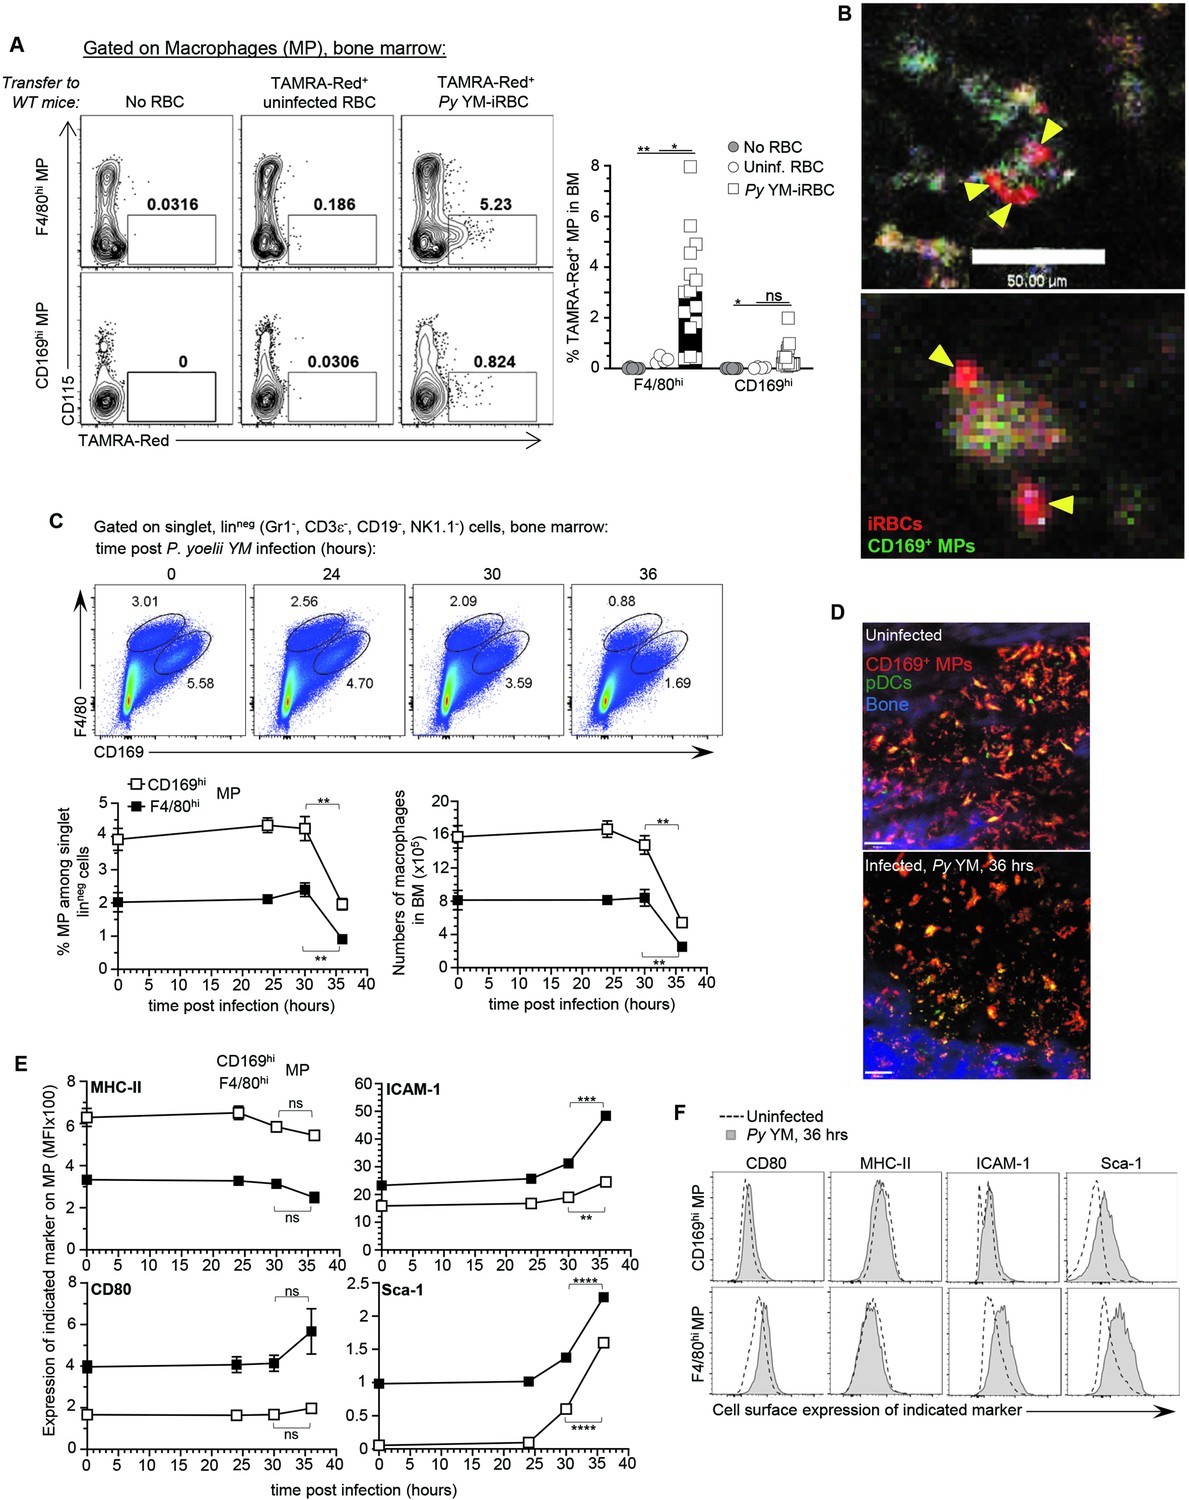
CD169+ MP uptake Plasmodium yoelii-infected RBC (iRBC) in the bone marrow and undergo activation and loss.
F4/80hi and CD169hi MP were gated as depicted in Figure 1—figure supplement 1A. (A) Representative dot plots of frequency of TAMRA-Red+ F4/80hi or CD169hi MP from control (no transfer), uninfected RBC (uRBC), and infected RBC (iRBC) transferred recipient mice are shown. Bar graphs show the mean frequencies ± standard error of the mean (SEM) of TAMRA-Red+ MP subsets in a pool of six independent replicate experiments with each symbol representing one mouse (n = 4–15 mice/condition). (B) Intravital image of TAMRA-Red+ Py-iRBC (red) associated with anti-CD169-FITC labeled CD169+ MP (green) in tibial BM 6 hr post-transfer. Sixteen hours prior to imaging, mice were i.v. administered CD169-FITC mAb to label CD169+ MP. Yellow arrowheads show Py-iRBC that are associated with CD169+ MP. Images are representative of two replicate experiments. (C, E, F) BM cells from uninfected or Py YM-infected (5 × 10⁵ Py-iRBC) WT mice were harvested at indicated time points and stained with cell-surface expression of linneg (CD3, CD19, NK1.1, CD19), F4/80, CD169, and several activation markers (MHC-II, ICAM-1, CD80, Sca-1). In (C), representative FACS dot plots of CD169hi and F4/80hi MP in the BM. The relative proportion and absolute numbers CD169hi and F4/80hi MP in mouse leg of WT B6 mice are shown in a pool of two replicate experiments with SEM (n = 3–7 mice for each time point). (D) Representative image of tibial BM of PTCRA-EGFP mice administered with CD169-PE mAb 16 hr prior to imaging either uninfected or 36 hr post Py infection in 1 of >10 imaged BM. (E, F) Representative overlay FACS histograms for indicated activation marker on CD169hi and F4/80hi MP from indicated mice and conditions. When relevant, p values were calculated with *p < 0.05; **p < 0.01; ***p < 0.001; ****p < 0.0001; ns, not significant, using two-tailed unpaired Student’s t-test.
-
Figure 1—source data 1
Raw values for Figure 1A, C, E graphs.
- https://cdn.elifesciences.org/articles/78873/elife-78873-fig1-data1-v2.xlsx
Figure 1—figure supplement 1
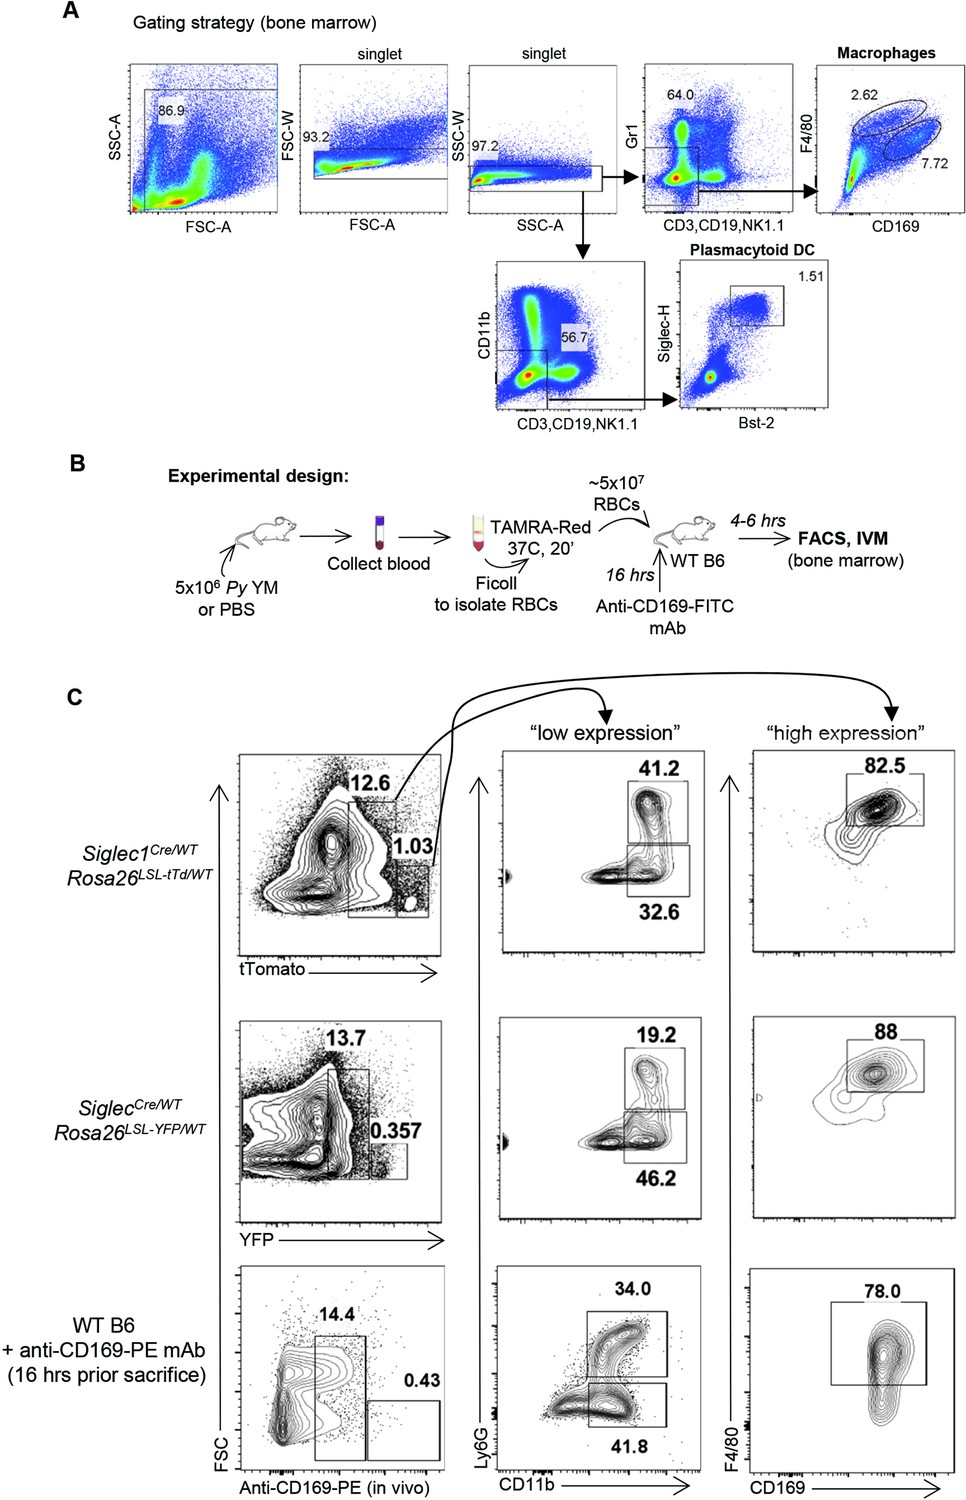
Gating strategies and experimental design for Figure 1.
(A) Gating strategy for bone marrow MP and pDC. (B) Schematic of experimental design. Peripheral blood was harvested from uninfected (uRBC) or Py YM-infected mice (iRBC) and labeled with the Tetramethylrodamine (TAMRA-Red) dye before transfer to naive recipient mice. BM was harvested 6 hr later and stained for live/dead and cell-surface expression of linneg (CD3, CD19, NK1.1), F4/80, CD169, CD11b, BST2, and SiglecH markers. For intravital microscopy (IVM) experiments, TAMRA-Red+ Py-iRBC recipient mice were injected i.v. with 5 μg anti-CD169-FITC mAb to label CD169+ MP 16 hr prior to imaging. (C) FACS analysis of CD169+ cells in siglec1Cre mice crossed to Rosa26LSL-tTomato or to Rosa26LSL-YFP mice, and in anti-CD169-PE mAb injected mice.
Figure 1—figure supplement 2
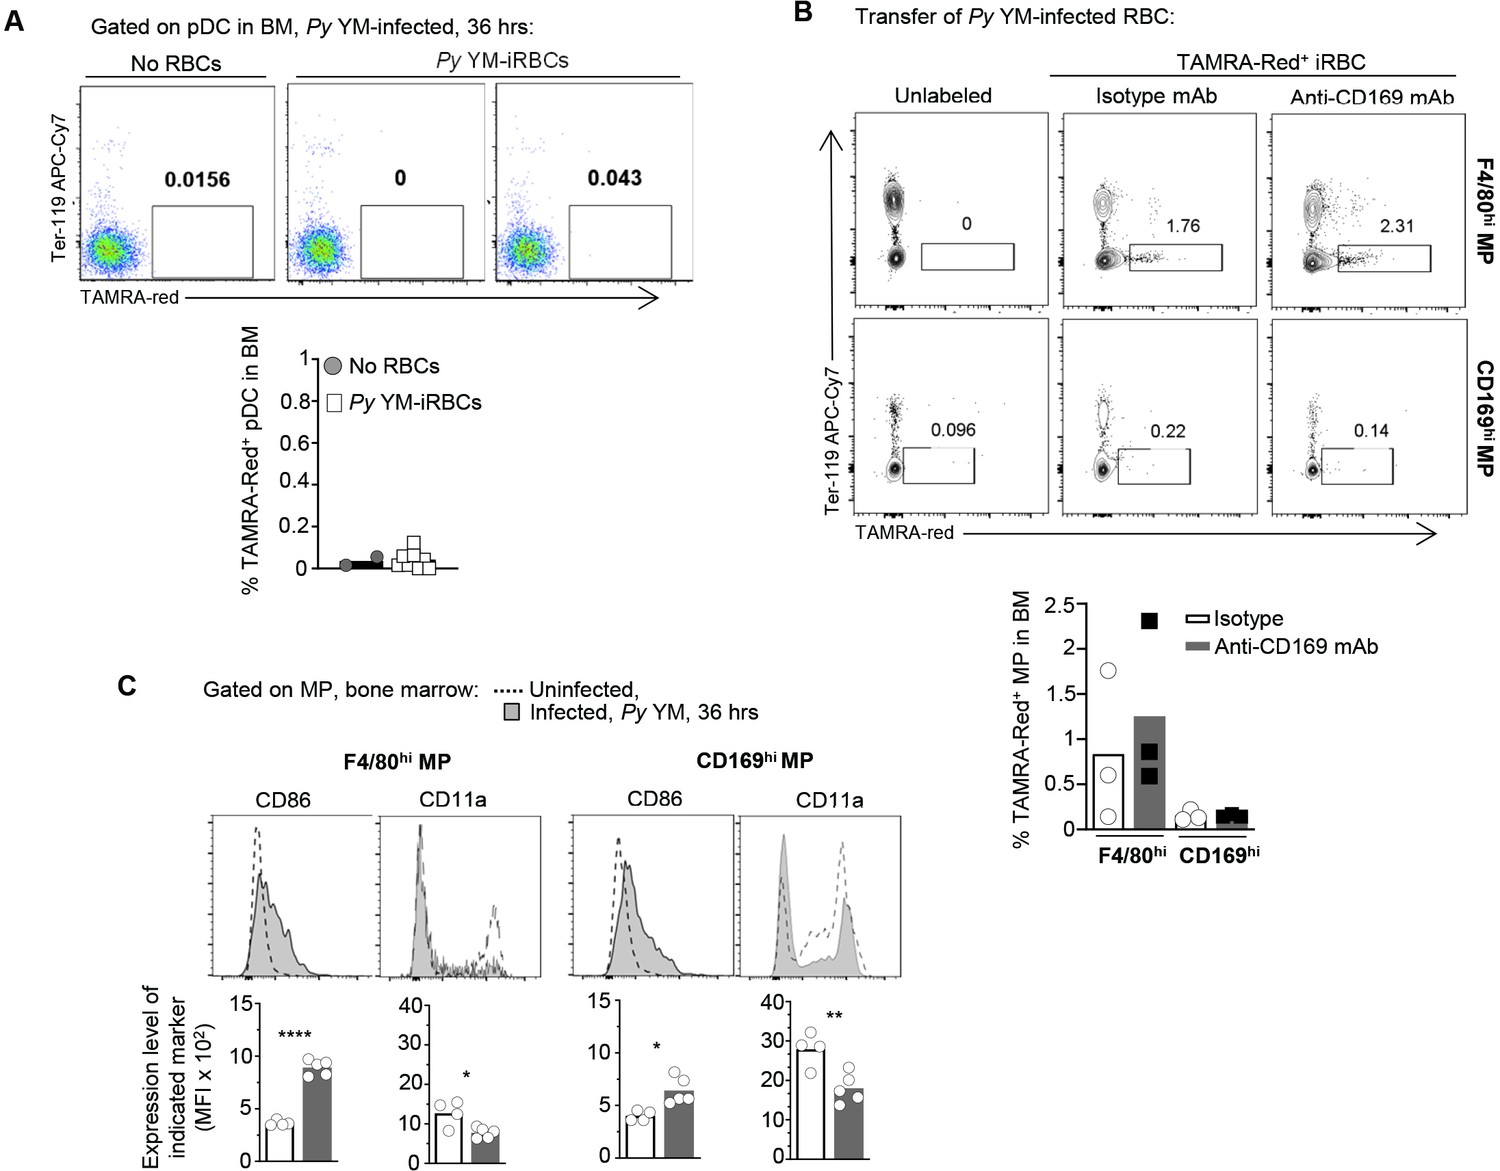
Analysis of pDC and CD169 roles in uptake of Py-iRBC, and CD169+ MP activation in infected mice.
(A) Analysis of TAMRA-red+ Py-iRBC pDC by FACS from experiment in Figure 1—figure supplement 1 (n = 2–10 mice). (B) Py-iRBC (unlabeled or TAMRA-Red-labeled) were transferred to mice injected with isotype or anti-CD169 mAb 16 hr prior and TAMRA-Red+ iRBC uptake by bone marrow (BM) MP was quantified by FACS. (C) BM cells from uninfected or Py YM-infected WT mice were harvested at 36 hr and stained with cell-surface expression of linneg (CD3, CD19, NK1.1, CD19), F4/80, CD169 and CD86 and CD11a activation markers. Representative FACS histogram overlays of CD86 and CD11a activation marker expression on CD169hi and F4/80hi MP with MFI across two pooled replicate experiments. p values were calculated with *p < 0.05; **p < 0.01; ; ****p < 0.0001; ns, not significant, using two-tailed unpaired Student’s t-test.
-
Figure 1—figure supplement 2—source data 1
Raw values for for Figure 1—figure supplement 2A-C graphs.
- https://cdn.elifesciences.org/articles/78873/elife-78873-fig1-figsupp2-data1-v2.xlsx
Figure 1—video 1
Visualization of Py iRBCs uptake by CD169+ MP in the bone marrow of living mice.
Series of movies represent 1 z plane from tibial BM of WT mice 3–5 hr after transfer of TAMRA-Red iRBC. CD169+ MP were visualized by injecting CD169-FITC i.v. 16 hr prior to imaging. Movies depict iRBC flowing through vasculature, arrested in proximity with CD169+ MP, and moving in the BM parenchyma. Time shown in min:s.
Figure 2 with 3 supplements
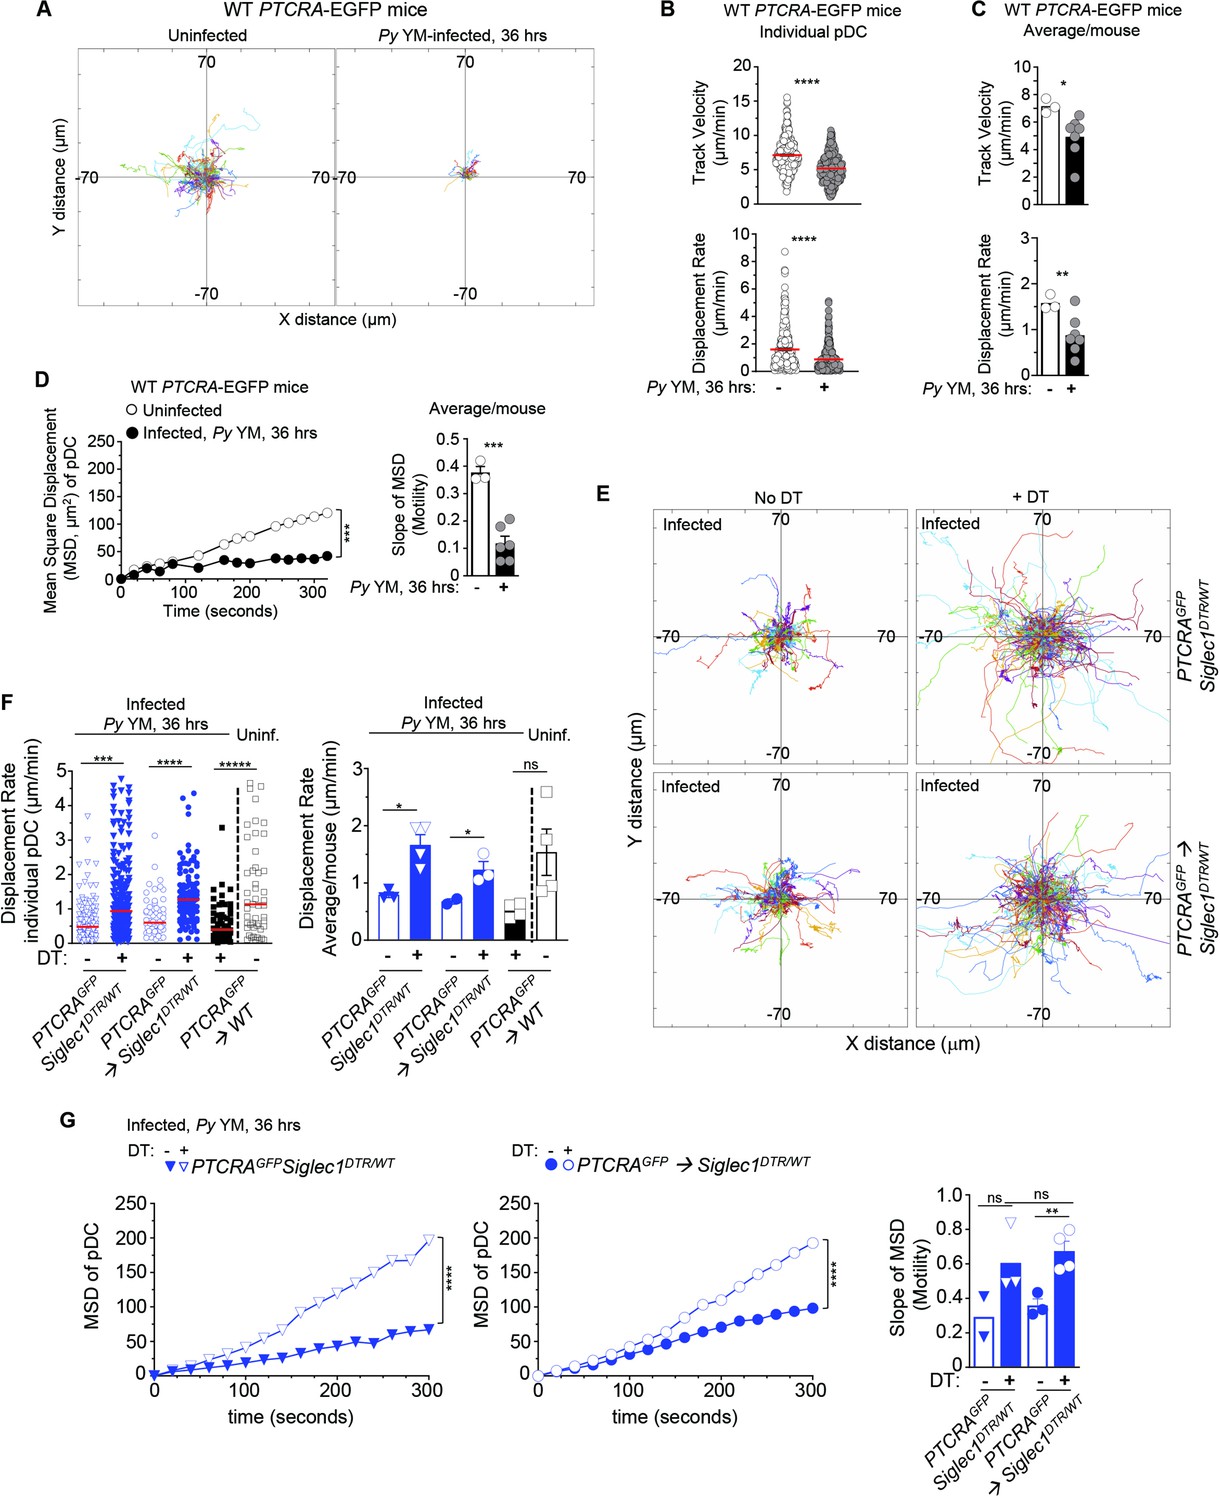
CD169+ MP control pDC arrest in Py-infected mice.
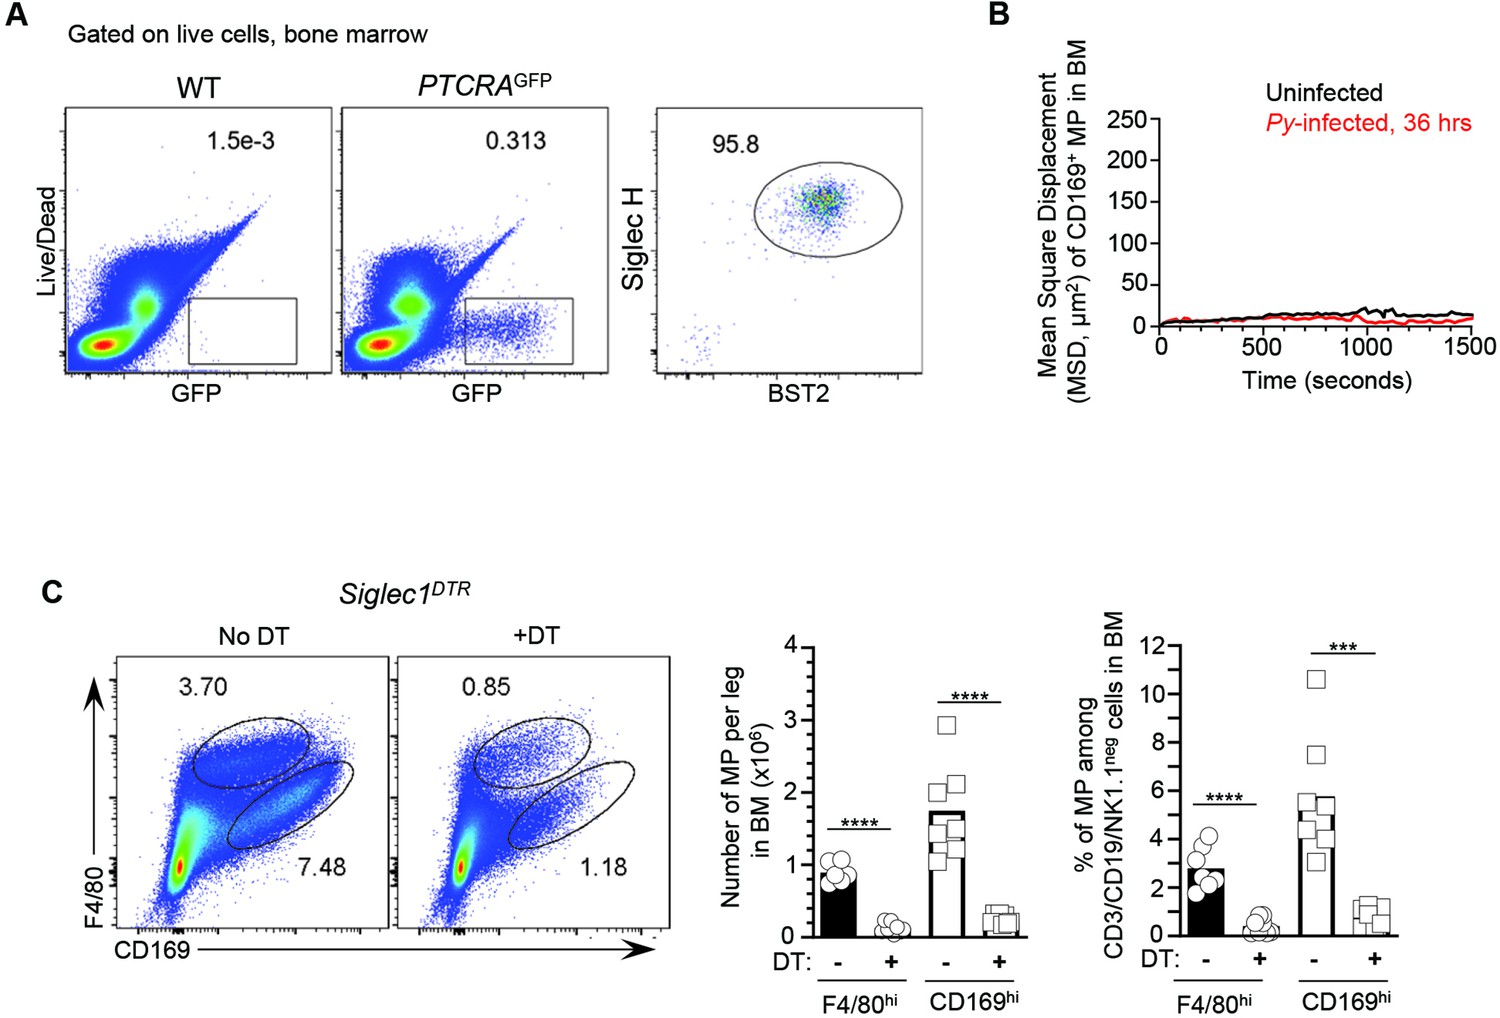
PTCRA-EGFP reporter mice (WT, siglec1DTR/WT, or partial bone marrow chimeras) either received PBS (uninfected) or were infected with 5 × 10⁵ Py-iRBCs, and administered with CD169-PE mAb 16 hr prior to intravital imaging microscopy (IVM) of tibial BM. (A–D) Analysis of pDC dynamic behavior in uninfected or 36 hr Py-infected WT PTCRA-EGFP mice. (A) Flower plots of 2D tracks of individual pDCs, superimposed after normalization of their starting coordinates to the origin over 30 min of imaging. (B) Track velocity (TV) and displacement rates (DRs) of individual pDC with (C) average in all mice, and (D) mean square displacement (MSD) analysis of pDC over time and slope of MSD/motility. For bar graphs, each symbol features one mouse with mean ± standard error of the mean (SEM) (n = 3–7 mice were imaged for each experimental condition and genotype). (E–G) PTCRA-EGFP siglec1DTR/WT or PTCRA-EGFP/siglec1DTR/WT and PTCRA-EGFP/WT partial BM chimeras were injected with diphtheria toxin (DT) or control PBS 12 hr prior to Py infection. (E) Tracks of individual pDC in the indicated experimental conditions over 1 hr of imaging. (F) DRs of individual pDC and average in all mice. (G) MSD analysis of pDC over time and slope of MSD/motility. For all bar graphs, each symbol features one mouse with mean ± SEM (n = 2–4 mice were imaged for each experimental condition and genotype). p values were calculated with *p < 0.05; **p < 0.01; ***p < 0.001; ****p < 0.0001; ns, not significant, using two-tailed unpaired Student’s t-test for flow-cytometry comparisons and Welch’s t-test for comparison of IVM quantifications. Multiple linear regression analyses were applied for statistical analysis of the MSD plots.
-
Figure 2—source data 1
Raw values for Figure 2A-G data.
- https://cdn.elifesciences.org/articles/78873/elife-78873-fig2-data1-v2.xlsx
Figure 2—figure supplement 1
Validation of reporter mouse tools.
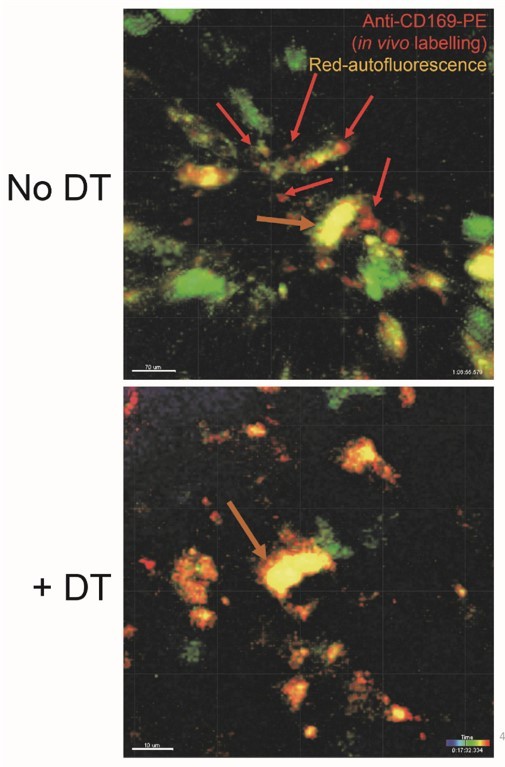
(A) Bone marrow cells from WT B6 or WT PTCRA-EGFP reporter mice were stained for cell-surface expression of linneg (CD3, CD19, NK1.1, CD11b, Gr1), BST-2, Siglec-H, and pDC expression of GFP is shown in one representative of 10–15 mice. (B) Mean square displacement (MSD) of CD169+ MP obtained after intravital microscopy (IVM) imaging in the BM of uninfected and Py-infected WT PTCRA-EGFP reporter mice. (C) Representative FACS dot plots of CD169hi and F4/80hi MP analysis in the BM of siglec1DTR/WT mice injected with diphtheria toxin (DT) treated or not 12 hr before, using cell staining as in Figure 1—figure supplement 1A. Bar graphs show mean numbers of pDC per BM leg and proportion of each MP subset in two independent replicate experiments with each symbol representing one mouse (n = 6 mice). p values were calculated with ***p < 0.001; ****p < 0.0001; ns, not significant, using two-tailed unpaired Student’s t-test.
-
Figure 2—figure supplement 1—source data 1
Raw values for Figure 2—figure supplement 1B, C graphs/data.
- https://cdn.elifesciences.org/articles/78873/elife-78873-fig2-figsupp1-data1-v2.xlsx
Figure 2—video 1
Py infection induces pDC arrest.
Visualizing pDC motility in a PTCRA-EGFP mouse. CD169-PE was i.v. injected 16 hr prior to imaging to visualize CD169+ MP (red). pDCs (green) are highly motile in the tibial bone marrow (BM) at steady state (uninfected WT, left). Note that pDCs are immobile at 36 hr post-infection with Py YM, exhibiting an elongated morphology in close approximation to CD169+ MP (red) (36 hr Py YM WT, right). Time is shown as h:mm:ss:mms.
Figure 2—video 2
CD169+ MP depletion prevents pDC arrest during Py infection.
PTCRA-EGFP/siglec1DTR/WT mice were treated with control PBS (left) or diphtheria toxin (DT, +) (right) 12 hr prior to Py infection. Thirty-six hours post-Py YM infection pDC (green) motility is significantly increased in DT-treated mice (right) versus vehicle-treated controls (left). Time is shown as h:mm:ss:mms.
Figure 3 with 4 supplements
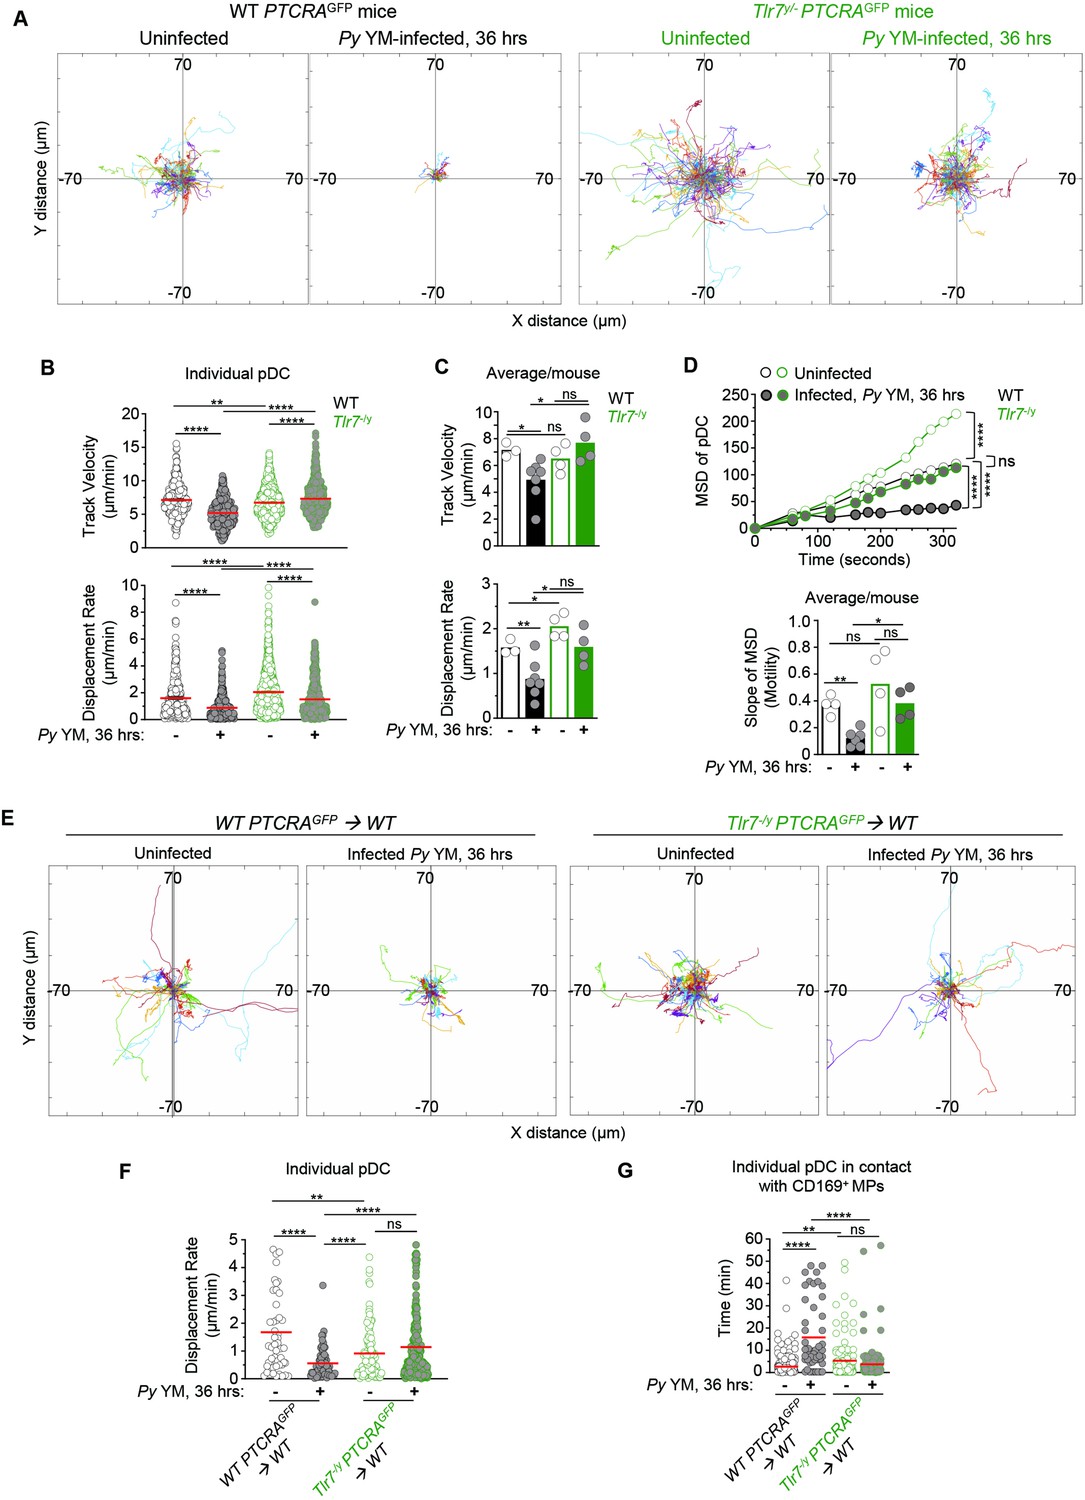
TLR7 sensing in pDC is required for their arrest and clustering in Py-infected mice.
WT and Tlr7−/y PTCRA-EGFP reporter mice, and WT PTCRA-EGFP/WT and Tlr7−/y PTCRA-EGFP/WT partial bone marrow (BM) chimeras either received PBS (uninfected) or were infected with 5 × 10⁵ Py-iRBCs, and administered with CD169-PE mAb 16 hr prior to intravital microscopy (IVM) of tibial BM. (A) Tracks of individual pDC dynamic behavior in uninfected or 36 hr Py-infected mice with starting positions in the same origin over 30 min of imaging. (B) Track velocity (TV) and displacement rates (DRs) of individual pDC with (C) average in all mice, and (D) mean square displacement (MSD) analysis of pDC over time and slope of MSD/motility. Each symbol feature one mouse with mean ± standard error of the mean (SEM). Four to six individual mice were imaged for each experimental condition and genotype. (E) Tracks of individual pDC in uninfected or Py-infected WT PTCRA-EGFP/WT and Tlr7−/y PTCRA-EGFP/WT partial BM chimeras over 1 hr of imaging. (F) DR of individual pDC and (G) quantification of individual pDC contact time with CD169+ MP are shown. Three to four individual mice were imaged for each experimental condition and genotype. p values were calculated with *p < 0.05; **p < 0.01; ; ****p < 0.0001; ns, not significant, using two-tailed unpaired Student’s t-test for flow-cytometry comparisons and Welch’s t-test for comparison of IVM quantifications. Multiple linear regression analyses were applied for statistical analysis of the MSD plots. The WT PTCRA-EGFP data depicted in (A) are the same as in Figure 2A; (B, C) are identical as in Figure 2B, C; (D) are the same as in Figure 2D; (F) are the same as in Figure 2F. This enabled comparisons across mutant mouse conditions relative to WT.
-
Figure 3—source data 1
Raw values for Figure 3A-G graphs/data.
- https://cdn.elifesciences.org/articles/78873/elife-78873-fig3-data1-v2.xlsx
Figure 3—figure supplement 1
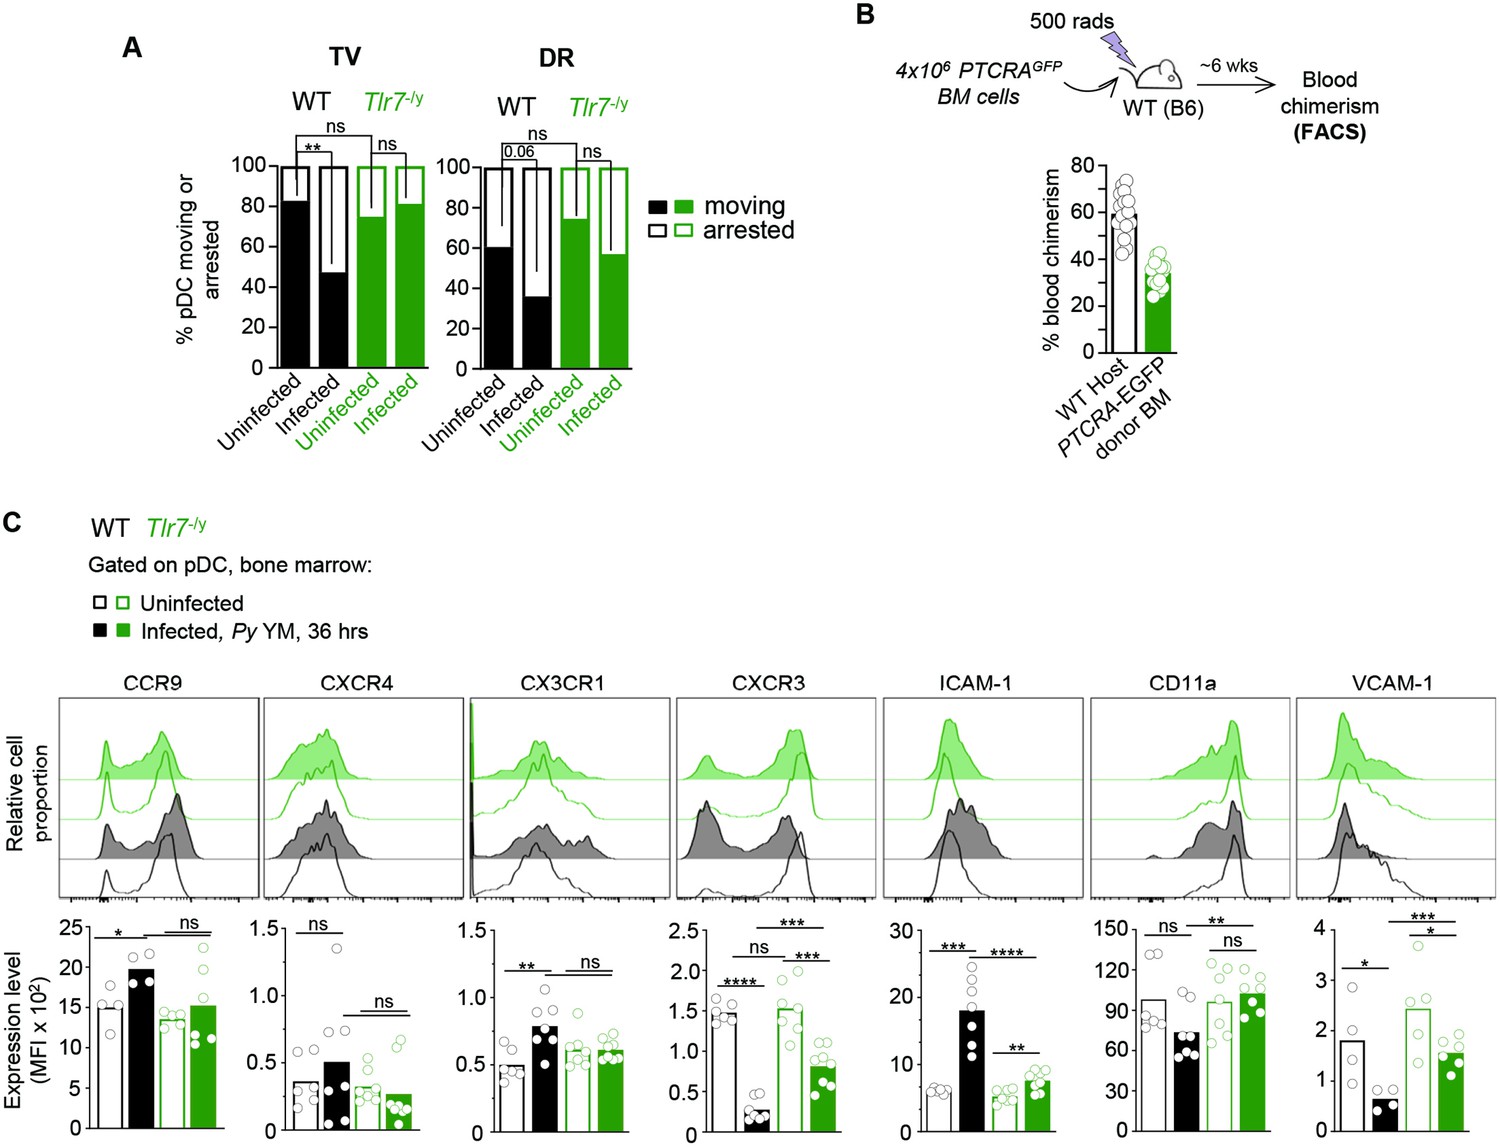
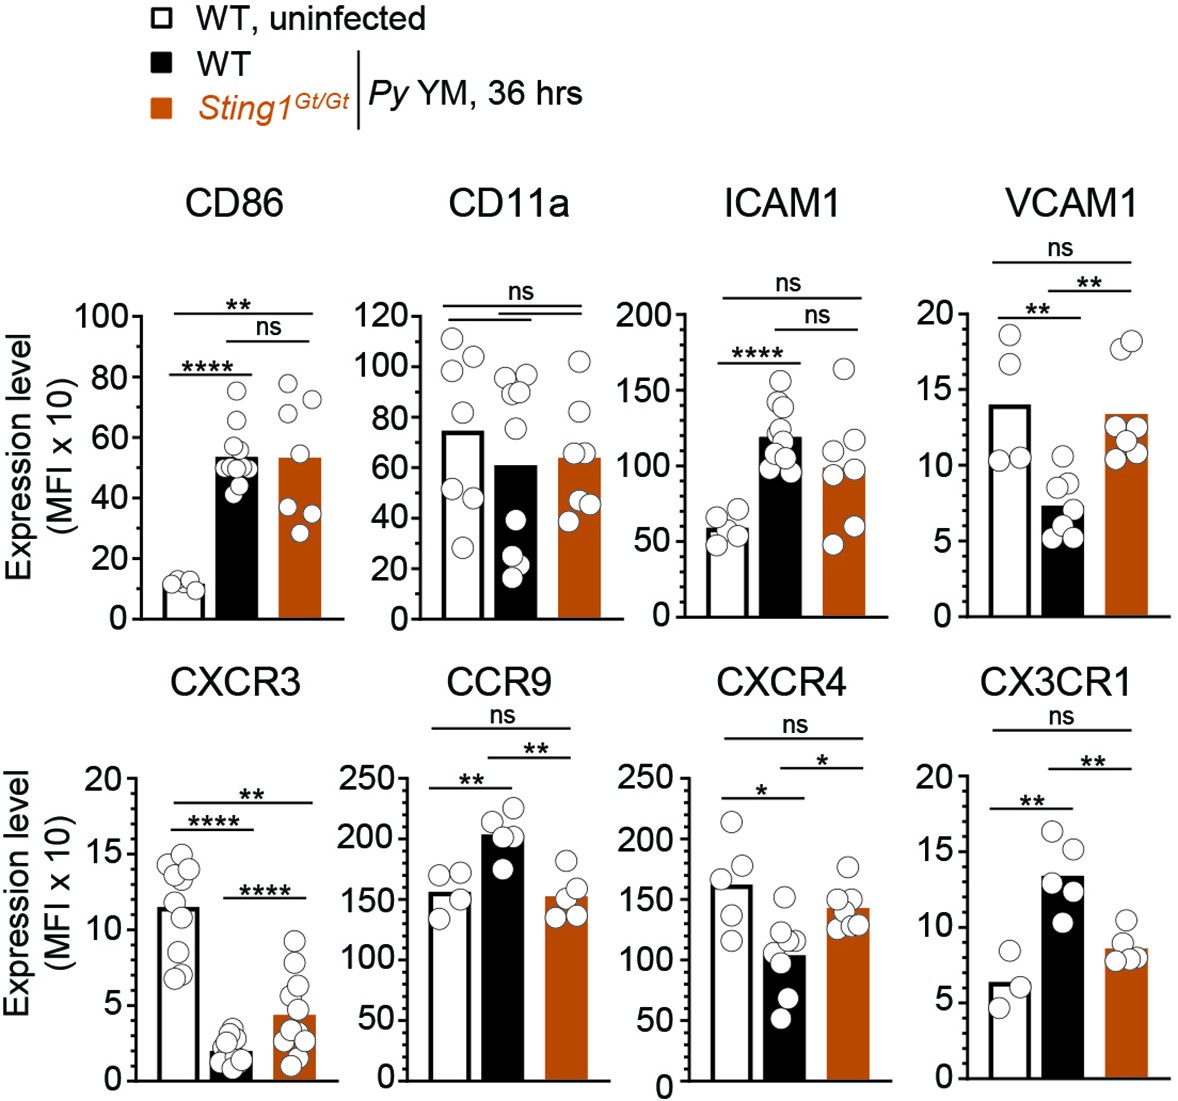
Impaired pDC expression of chemokine receptors and adhesion molecules in Py-infected TLR7-deficient mice.
(A) Proportion of pDC either moving or arrested using both track velocity (TV) and displacement rate (DR) as measurements in naive or Py-infected WT or Tlr7−/y mice. Bar graphs pool three naive and eight infected WT mice, and four naive and four infected Tlr7−/y mice. (B) Schematic of partial PTCRA-EGFP bone marrow (BM) chimera generation and blood analysis of chimerism 6 weeks post-reconstitution. (C) WT or Tlr7−/y mice either received PBS (uninfected) or were infected with 5 × 10⁵ Py-iRBCs for 36 hr before harvesting BM for FACS analysis. BM cells were stained for cell-surface expression of linneg (CD3, CD19, NK1.1, CD11b), BST-2, and Siglec-H and indicated chemokine receptors or adhesion molecules. Representative FACS histograms after gating on pDC for each experimental condition and genotype are shown. Bar graphs average cell-surface expression levels (MFI) for indicated markers across three replicate experiments with mean, and each symbol feature one mouse (n = 4–8 mice). p values were calculated with *p < 0.05; **p < 0.01; ***p < 0.001; ****p < 0.0001; ns, not significant, using two-tailed unpaired Student’s t-test.
-
Figure 3—figure supplement 1—source data 1
Raw values for Figure 3—figure supplement 1C graphs.
- https://cdn.elifesciences.org/articles/78873/elife-78873-fig3-figsupp1-data1-v2.xlsx
Figure 3—video 1
pDCs are highly motile in bone marrow of WT and Tlr7−/y naive mice.
Four-dimensional data series represented using extended focus from tibial BM of WT or Tlr7−/y PTCRA-EGFP mice at steady state. CD169+ MP were visualized by injecting CD169-PE i.v. 16 hr prior to imaging. EGFP-pDCs are shown in green. Time is shown as h:mm:ss:mms. Scale bar represents 20 μm.
Figure 3—video 2
pDC remains highly motile in the bone marrow (BM) of Tlr7−/y mice during Py YM infection.
Four-dimensional data series represented using extended focus from tibial BM of WT or Tlr7−/y PTCRA-EGFP N1 mice that had been infected with Py YM 36 hr prior to imaging. CD169+ MP were visualized by injecting CD169-PE i.v. 16 hr prior to imaging. EGFP-pDCs are shown in green. Time is shown as h:mm:ss:mms. Scale bar represents 40 μm.
Figure 3—video 3
TLR7-deficient pDC fail to arrest in the bone marrow (BM) of Tlr7−/y PTCRA-EGFP/WT partial BM chimeras during Py infection.
Intravital imaging in the tibia demonstrates pDC (green) arrest in PTCRA-EGFP/WT (left) but not Tlr7−/y PTCRA-EGFP/WT (right) chimeras 36 hr post-infection with Py YM. To visualize CD169+ MP, mice were injected with CD169-PE i.v. 16 hr prior to imaging. Scale bar represents 50 μm. Time is shown as h:mm:ss:mms.
Figure 4 with 1 supplement
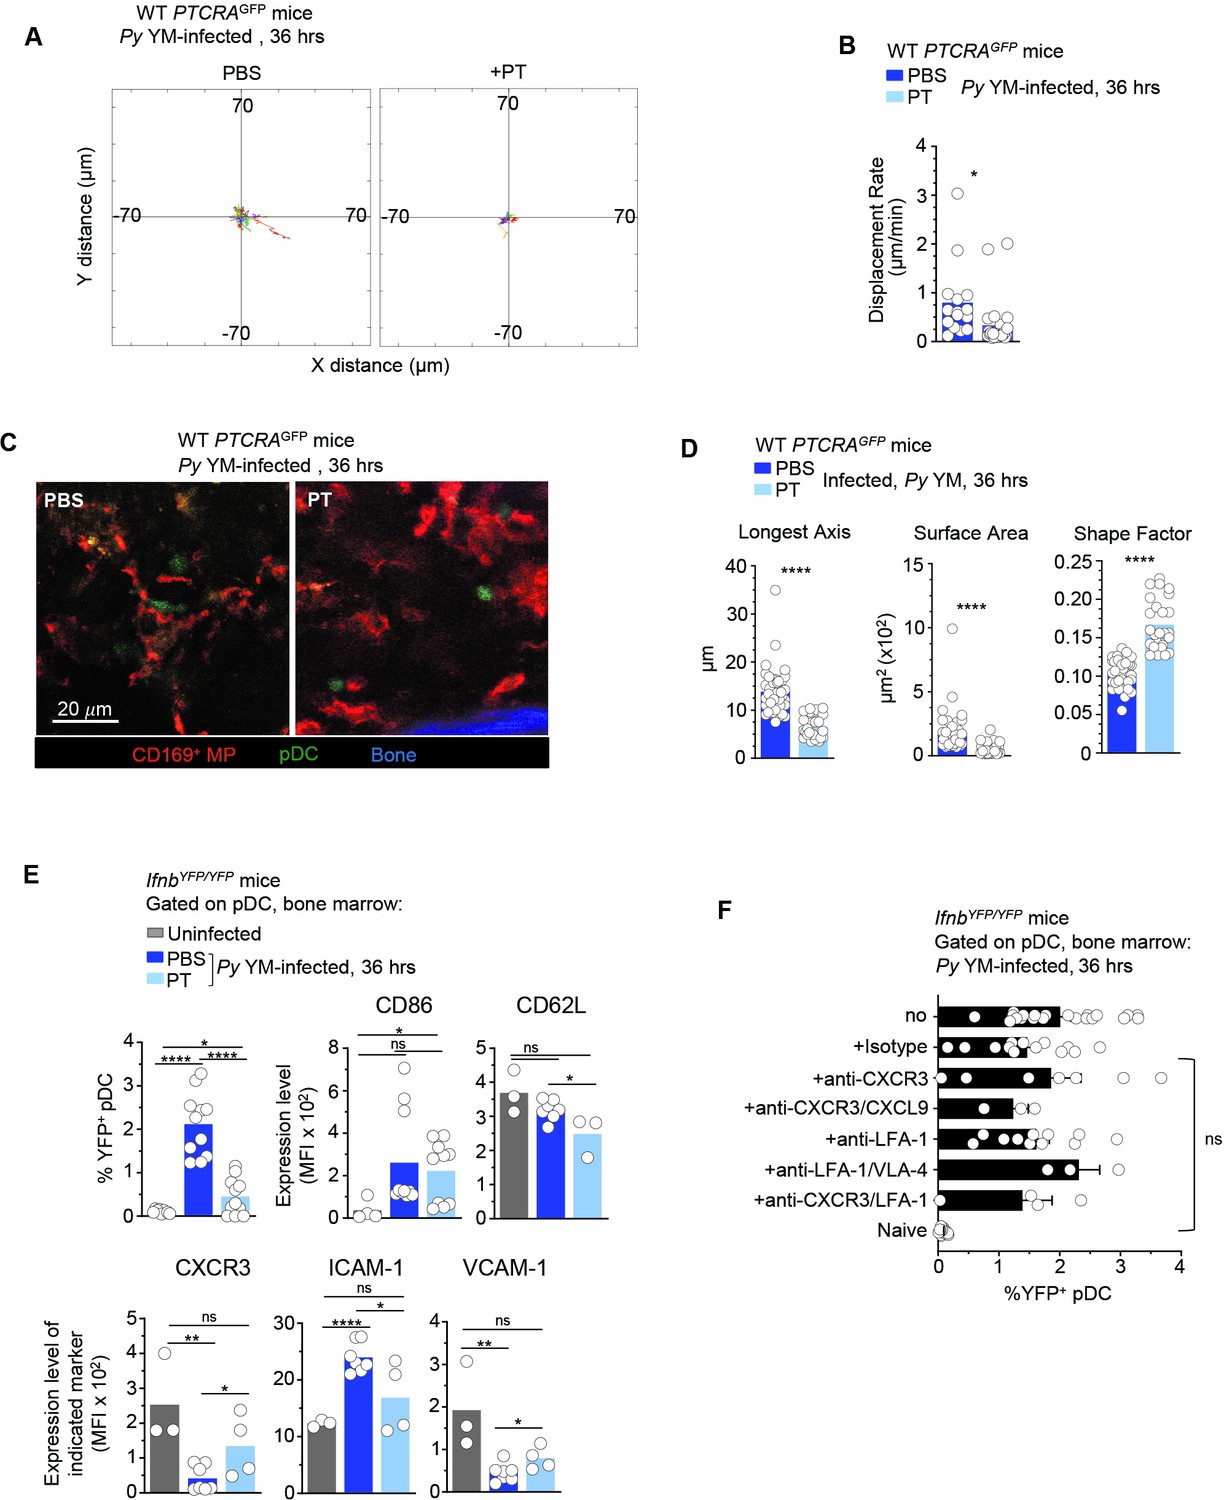
pDC arrest is not sufficient to achieve robust type I IFN production during Py infection.
WT PTCRA-EGFP (A–D) or IfnbYFP/YFP (E, F) reporter mice either received PBS or pertussis toxin (PT) and were infected with 5 × 10⁵ Py-iRBCs. In (A–D), mice were injected with PT or control PBS at the time of Py infection and administered with CD169-PE mAb 16 hr prior to intravital microscopy (IVM) of tibial bone marrow (BM). The analysis of pDC dynamic behavior of PT-treated or untreated, 36 hr Py-infected mice are shown. (A) Flower plots of 2D tracks of individual pDCs, superimposed after normalization of their starting coordinates to the origin over 30 min of imaging. (B) Displacement rate (DR) of individual pDC. (C) Representative IVM images of tibial BM. (D) Quantification of cell morphology of arrested pDC in PBS versus PT-treated infected mice. (E, F) IfnbYFP/YFP reporter mice received indicated treatments (PBS, PT, Isotype Ab, anti-CXCR3+/−CXCL9+/−LFA-1, anti-LFA-1+/−VLA-4) and the time of Py infection, and 36 hr later BM cells were stained for cell-surface expression of linneg (CD3, CD19, NK1.1, CD11b, Gr1), BST-2, Siglec-H, CD86, CD62L, CXCR3, VCAM-1, and ICAM-1. Bar graphs quantify the expression of YFP, CD86, and ICAM-1 by pDCs with mean ± standard error of the mean (SEM) across two to five independent replicate experiments, with each symbol featuring one mouse (n = 3–10 mice). p values were calculated with *p < 0.05; **p < 0.01; ****p < 0.0001; ns, not significant, using two-tailed unpaired Student’s t-test for flow-cytometry comparisons and Welch’s t-test for comparison of IVM quantifications.
-
Figure 4—source data 1
Raw values for Figure 4A, B, D-F graphs/data.
- https://cdn.elifesciences.org/articles/78873/elife-78873-fig4-data1-v2.xlsx
Figure 4—video 1
Blocking GαI signaling induces robust pDC arrest and a morphologically distinct phenotype.
WT PTCRA-EGFP reporter mice either received PBS or pertussis toxin (PT) and were infected with 5 × 10⁵ Py-iRBCs. To visualize CD169+ MP, CD169-PE mAb was i.v. administered 16 hr prior to intravital microscopy (IVM) of tibial bone marrow (BM). Intravital imaging in the tibia demonstrates pDCs (green) arrest 36 hr post-Py YM in vehicle and PT-treated mice. Note that pDC morphology is distinctly rounded in setting of PT treatment (right), although directly adjacent to MP (red) in both preps. Scale bar represents 30 μm. Time is shown as h:mm:ss:mms.
Figure 5 with 4 supplements
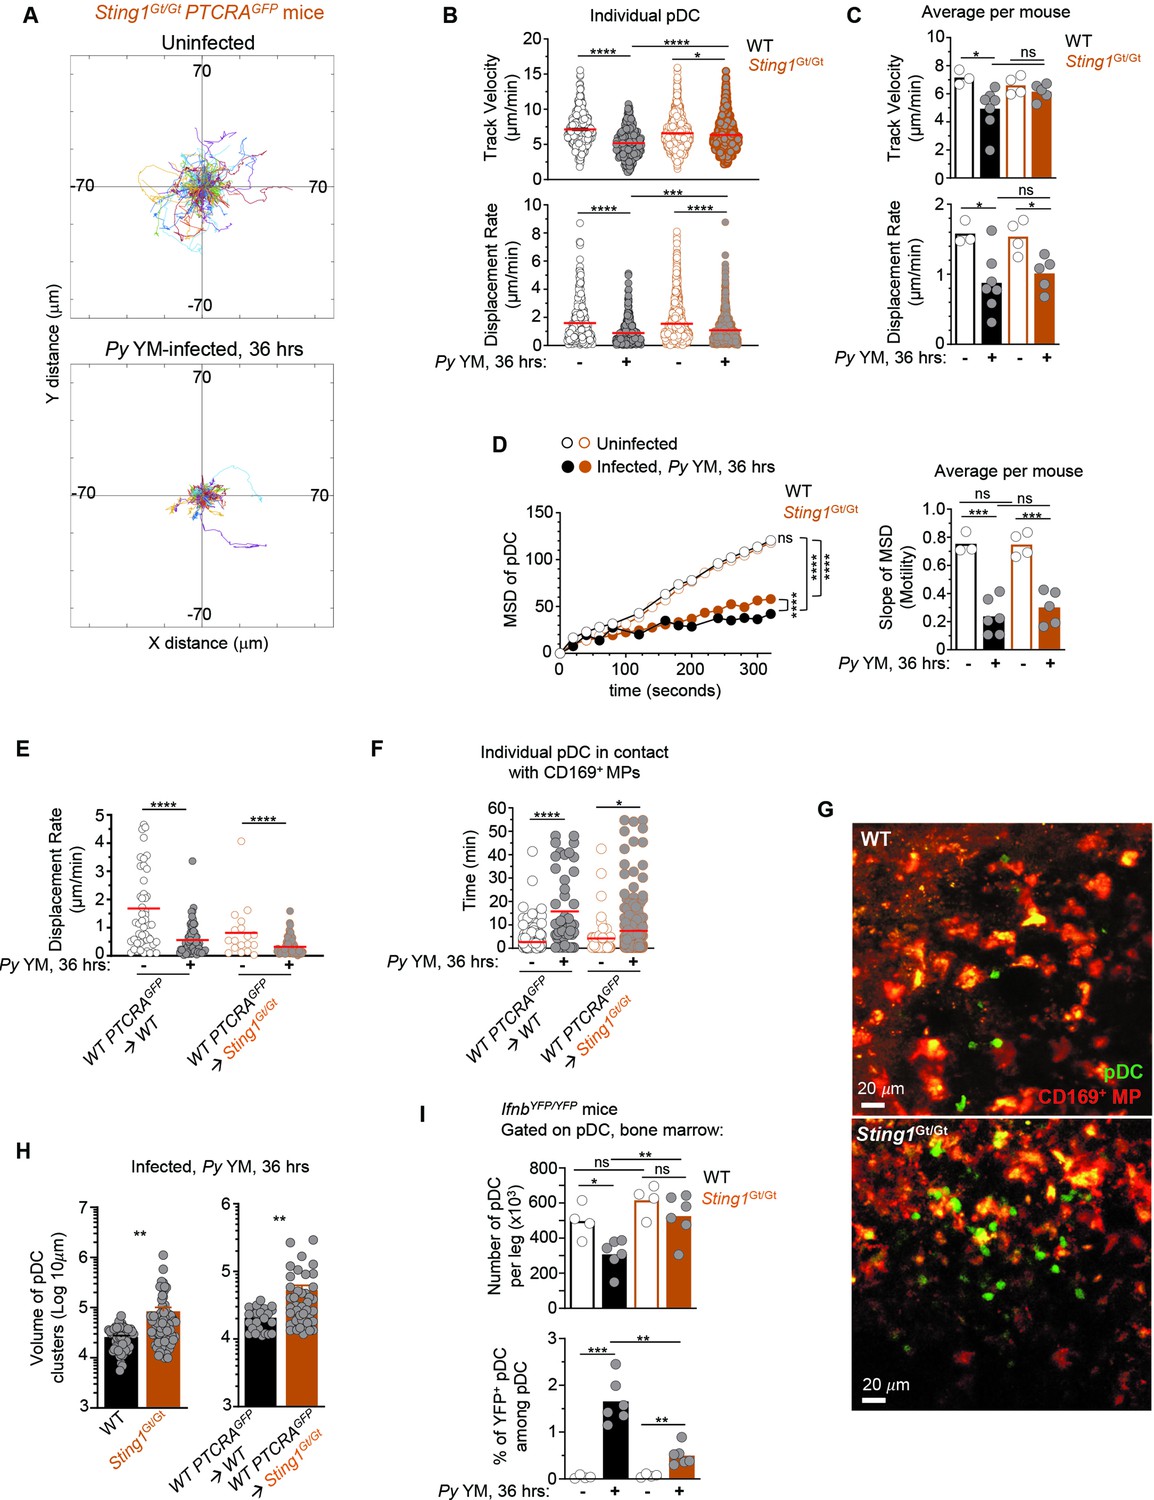
pDCs arrest, form larger clusters and accumulate in the bone marrow of STING-deficient compared to WT Py-infected mice.
WT or Sting1Gt/Gt PTCRA-EGFP reporter mice either received PBS (uninfected) or were infected with 5 × 10⁵ Py-iRBCs, and administered with CD169-PE mAb 16 hr prior to intravital microscopy (IVM) imaging of tibial BM. The analysis of pDC dynamic behavior of uninfected or 36 hr Py-infected mice is shown. (A) Tracks of individual pDC in Sting1Gt/Gt PTCRA-EGFP reporter mice with starting positions in the same origin over 30 min of imaging. (B) Track velocity (TV) and displacement rate (DR) of individual pDC with (C) average in all mice, and (D) mean square displacement (MSD) analysis of pDC over time and slope of MSD/motility. Each symbol features one mouse with mean ± standard error of the mean (SEM). Three to seven individual mice were imaged for each experimental condition and genotype. (E) DR of individual pDC and (F) individual pDC contact time with CD169+ MP, in uninfected or Py-infected Sting1Gt/Gt PTCRA-EGFP/WT and WT PTCRA-EGFP/WT partial BM chimeras. (H) Quantification of cluster volume in WT, Sting1Gt/Gt, Sting1Gt/Gt PTCRA-EGFP/WT, and WT PTCRA-EGFP/WT partial BM chimeras. (G) Image from IVM of tibial BM showing pDC clusters 36 hr post Py infection. For (E–H), three to four individual mice were imaged for each experimental condition and genotype. (I) Number of pDC per leg and relative proportion of YFP+ pDC in the BM of uninfected or Py-infected (36 hr) WT- and Sting1Gt/Gt-IfnbYFP/YFP reporter mice, as quantified by FACS after staining for cell-surface expression of linneg (CD3, CD19, NK1.1, CD11b, Gr1), BST-2, Siglec-H. Bar graphs quantify the expression of YFP in pDCs with mean ± SEM across two independent replicate experiments (n = 4–6 mice/group). p values were calculated with *p < 0.05; **p < 0.01; ***p < 0.001; ****p < 0.0001; ns, not significant, using two-tailed unpaired Student’s t-test for flow-cytometry comparisons and Welch’s t-test for comparison of IVM quantifications. Multiple linear regression analyses were applied for statistical analysis of the MSD plots. Data of WT PTCRA-EGFP depicted in (B, C) are the same as in Figures 2B, C, 3B, C; (D) are also in Figures 2D and 3D. WT PTCRA-EGFP/WT partial BM chimera in (E) are also in Figures 2F and 3F. These are included for ease of comparisons across conditions relative to WT.
-
Figure 5—source data 1
Raw values for Figure 5A-F, H, I graphs/data.
- https://cdn.elifesciences.org/articles/78873/elife-78873-fig5-data1-v2.xlsx
Figure 5—figure supplement 1
Bone marrow cells from WT B6 mice were stained cell-surface expression of linneg (CD3, CD19, NK1.1, CD11b, Gr1), BST-2, and Siglec-H and indicated chemokine receptors or no stain (fluorescence minus one, FMO).
Representative FACS histograms of one of five to eight mice after gating on pDC are shown. WT- and Sting1Gt/Gt-IfnbYFP/YFP reporter mice were either injected with PBS (uninfected) or infected with 5 × 10⁵ Py-iRBCs. Thirty-six hours later BM cells were stained with live/dead and for cell-surface expression of linneg (CD3, CD19, NK1.1, CD11b, Gr1), BST-2, Siglec-H, and indicated cell-surface markers. Bar graphs quantify mean expression levels of indicated markers on pDC across two to six independent replicate experiments, each symbol is one mouse (n = 3–13 mice). p values were calculated with *p < 0.05; **p < 0.01; ****p < 0.0001; ns, not significant, using two-tailed unpaired Student’s t-test.
-
Figure 5—figure supplement 1—source data 1
Raw values for all graphs/data.
- https://cdn.elifesciences.org/articles/78873/elife-78873-fig5-figsupp1-data1-v2.xlsx
Figure 5—video 1
pDC movement and clustering in the bone marrow of naive compared to Py-infected Sting1Gt/Gt mice.
Four-dimensional data series represented using extended focus from tibial BM of Sting1Gt/Gt PTCRA-EGFP N9 mice at steady state or 36 hr post-infection Py YM. CD169+ MP were visualized by injecting CD169-PE i.v. 16 hr prior to imaging. EGFP-pDC are shown in green. Time is shown as h:mm:ss:mms. Scale bar represents 40 μm.
Figure 5—video 2
WT pDCs arrest and form large clusters in Py-infected Sting1Gt/Gt PTCRA-EGFP/WT chimeras.
WT PTCRA-EGFP/WT partial BM chimeras were infected with Py YM. Thirty-six hours post-infection, intravital microscopy imaging of the BM reveals markedly increased quantity and side of pDC (clusters) in Sting1Gt/Gt PTCRA-EGFP/WT (left) compared to WT PTCRA-EGFP/WT (right) chimeras. Time is shown as h:mm:ss:mms. Scale bar represents 50 μm.
Figure 5—video 3
pDC forms large clusters in Py-infected Sting1Gt/Gt compared to WT mice.
Four-dimensional data series represented using extended focus from tibial BM of WT or Sting1Gt/Gt PTCRA-EGFP N9 mice 36 hr post-infection Py YM. CD169+ MP were visualized by injecting CD169-PE i.v. 16 hr prior to imaging. EGFP-pDCs are shown in green. Clusters of pDC around CD169+ MP are emphasized with a dotted line encircling them. Yellow arrowheads pointed to the relatively sparse pDC in WT compared to Sting1Gt/Gt mice. The lucent tissue in RL movie is bone. Time is shown as h:mm:ss:mms. Scale bar represents 40 μm.
Figure 6 with 1 supplement

STING signaling in CD169+ MP is required for plasmacytoid dendritic cells (pDCs) production of type I interferon (IFN) and egress from the bone marrow (BM).
WT-, Sting1Gt/WT-, or CD169Cre/CreSting1Gt/F-IfnbYFP/YFP reporter mice were infected with 5 × 10⁵ Py-iRBCs. Thirty-six hours later BM cells were stained with live/dead and for cell-surface expression of linneg (CD3, CD19, NK1.1, Gr1), CD11b, BST-2, Siglec-H, CD169, F4/80, and indicated cell-surface markers. (A) Representative FACS dot plots of YFP/ICAM-1+ pDC are shown, together with the proportion and numbers of YFP+ pDC/leg in summary bar graphs. (B) Number of pDC per leg in indicated mouse genotype. (C) Representative dot plots of CD169hi and F4/80hi MP in indicated mice. Bar graphs show numbers per leg and proportions. Data represent the pool of three independent replicate experiments with each symbol featuring one mouse (n = 3–18 mice). p values were calculated with *p < 0.05; **p < 0.01; ***p < 0.001; ****p < 0.0001; ns, not significant, using two-tailed unpaired Student’s t-test. (D) Working model: during Py YM malaria infection, CD169+ MP rapidly take-up Py-infected RBC (step 1). Next, pDC, which is highly motile in the BM of naive mice, home to and establish interactions with CD169+ MP at peak production of type I IFN by pDC (steps 2 and 3). This process is dependent on GaI-mediated chemotaxis. CD169+ MP and TLR7 sensing in pDC are both required for pDC arrest. Lastly, STING signaling in CD169+ MP is needed for pDC to initiate type I IFN secretion, regulate pDC clustering/retention, and egress from the BM to the blood (step 4).
-
Figure 6—source data 1
Raw values for Figure 6A-C graphs/data.
- https://cdn.elifesciences.org/articles/78873/elife-78873-fig6-data1-v2.xlsx
Figure 6—figure supplement 1
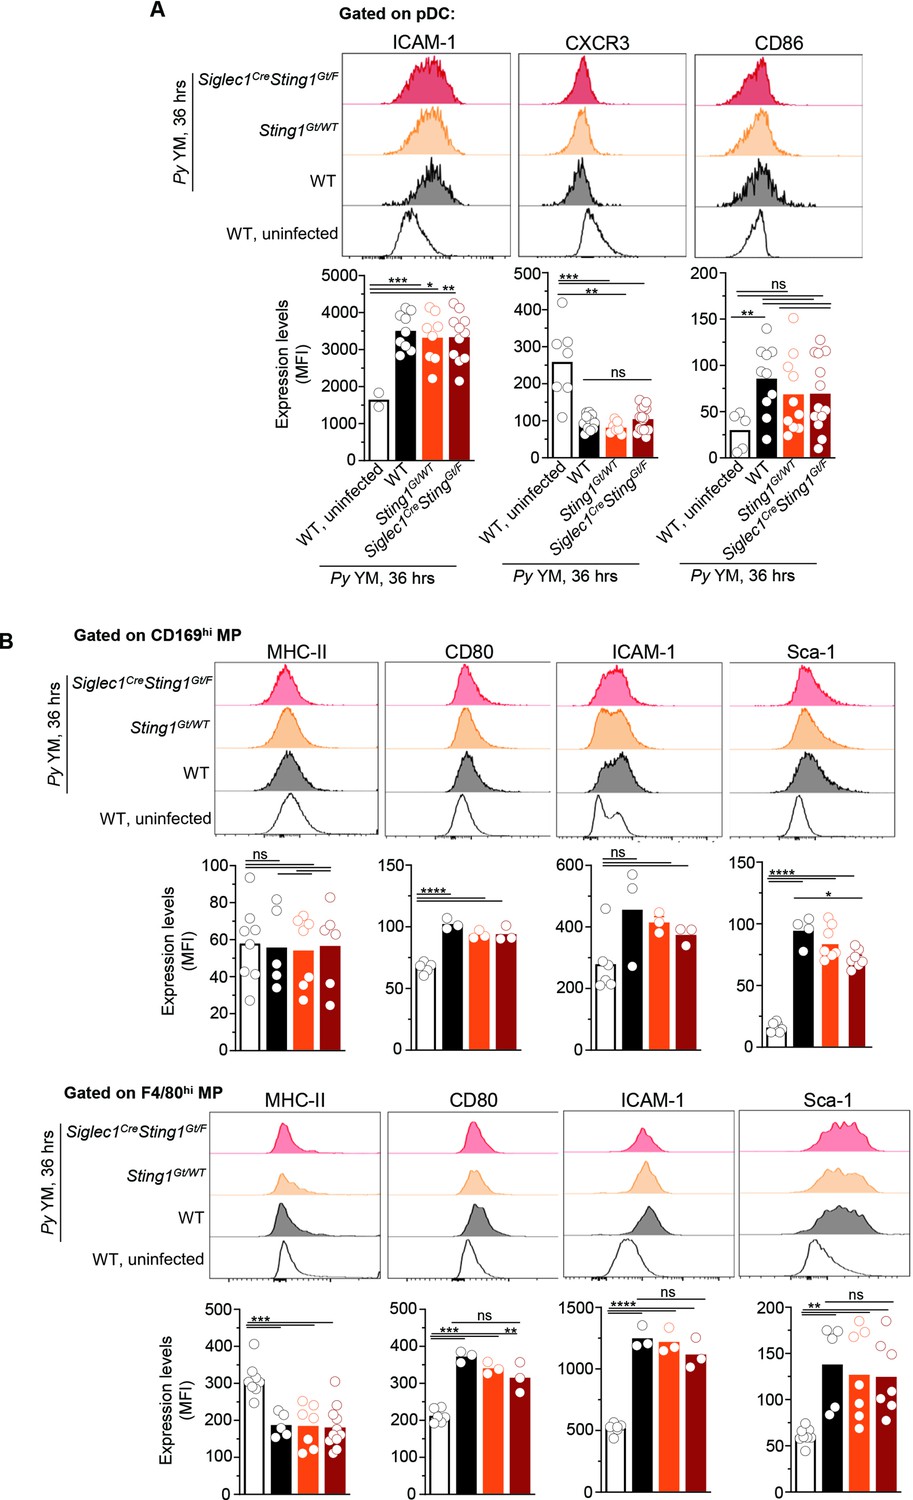
WT-, Sting1Gt/WT-, or CD169Cre/CreSting1Gt/F-IfnbYFP/YFP reporter mice were infected with 5 × 10⁵ Py-iRBCs.
Thirty-six hours later bone marrow (BM) cells were stained with live/dead and for cell-surface expression of linneg (CD3, CD19, NK1.1, Gr1), CD11b, BST-2, Siglec-H, CD169, F4/80, and indicated cell-surface markers. Representative FACS histograms of indicated activation markers on (A) pDC and (B) MP subsets are shown. Bar graphs pool three independent replicate experiments with each symbol featuring one mouse (n = 2–18 mice). p values were calculated with *p < 0.05; **p < 0.01; ***p < 0.001; ****p < 0.0001; ns, not significant, using two-tailed unpaired Student’s t-test.
Author response image 1
Additional files
-
Supplementary file 1
Table of antibodies used for FACS, microscopy, and in vivo depletion experiments.
- https://cdn.elifesciences.org/articles/78873/elife-78873-supp1-v2.pdf
-
MDAR checklist
- https://cdn.elifesciences.org/articles/78873/elife-78873-mdarchecklist1-v2.pdf
Download links
A two-part list of links to download the article, or parts of the article, in various formats.
Downloads (link to download the article as PDF)
Open citations (links to open the citations from this article in various online reference manager services)
Cite this article (links to download the citations from this article in formats compatible with various reference manager tools)
CD169+ macrophages orchestrate plasmacytoid dendritic cell arrest and retention for optimal priming in the bone marrow of malaria-infected mice
eLife 11:e78873.
https://doi.org/10.7554/eLife.78873


