Learning of probabilistic punishment as a model of anxiety produces changes in action but not punisher encoding in the dmPFC and VTA
- Department of Behavioral Neuroscience, Oregon Health & Science University, United States
- Department of Psychiatry, Oregon Health & Science University, United States
- Janelia Research Campus, Howard Hughes Medical Institute, United States
Figures
Figure 1 with 2 supplements

Schematic of punishment risk task (PRT) design and PRT behavior.
(A) Outline of trial structure in the PRT where action led to reward delivery with a varying risk of footshock. (B) The multi-component schedule used to probabilistically punish the action with ascending risk of footshock. (C) Trial completion over the first three sessions in each block and when comparing risk blocks over those sessions (right-side bar plot). (D) Changes in latency to action completion over the first three sessions and specifically in risk blocks (right-side bar plot). (E) Latency to retrieve the food reward over the first three sessions and specifically in risk blocks (right-side bar plot). Gray lines on bar plots indicate the average for the safe block in Session 1 (i.e. before punishment was ever encountered). Data are presented as mean ± SEM with small dots reflecting individual subjects.*p<0.05, ns = not significant, for exact p-values see Table 1. n=8–9 rats.
-
Figure 1—source data 1
Source data for Figure 1 and Figure 1—figure supplements 1–2.
- https://cdn.elifesciences.org/articles/78912/elife-78912-fig1-data1-v2.xlsx
Figure 1—figure supplement 1
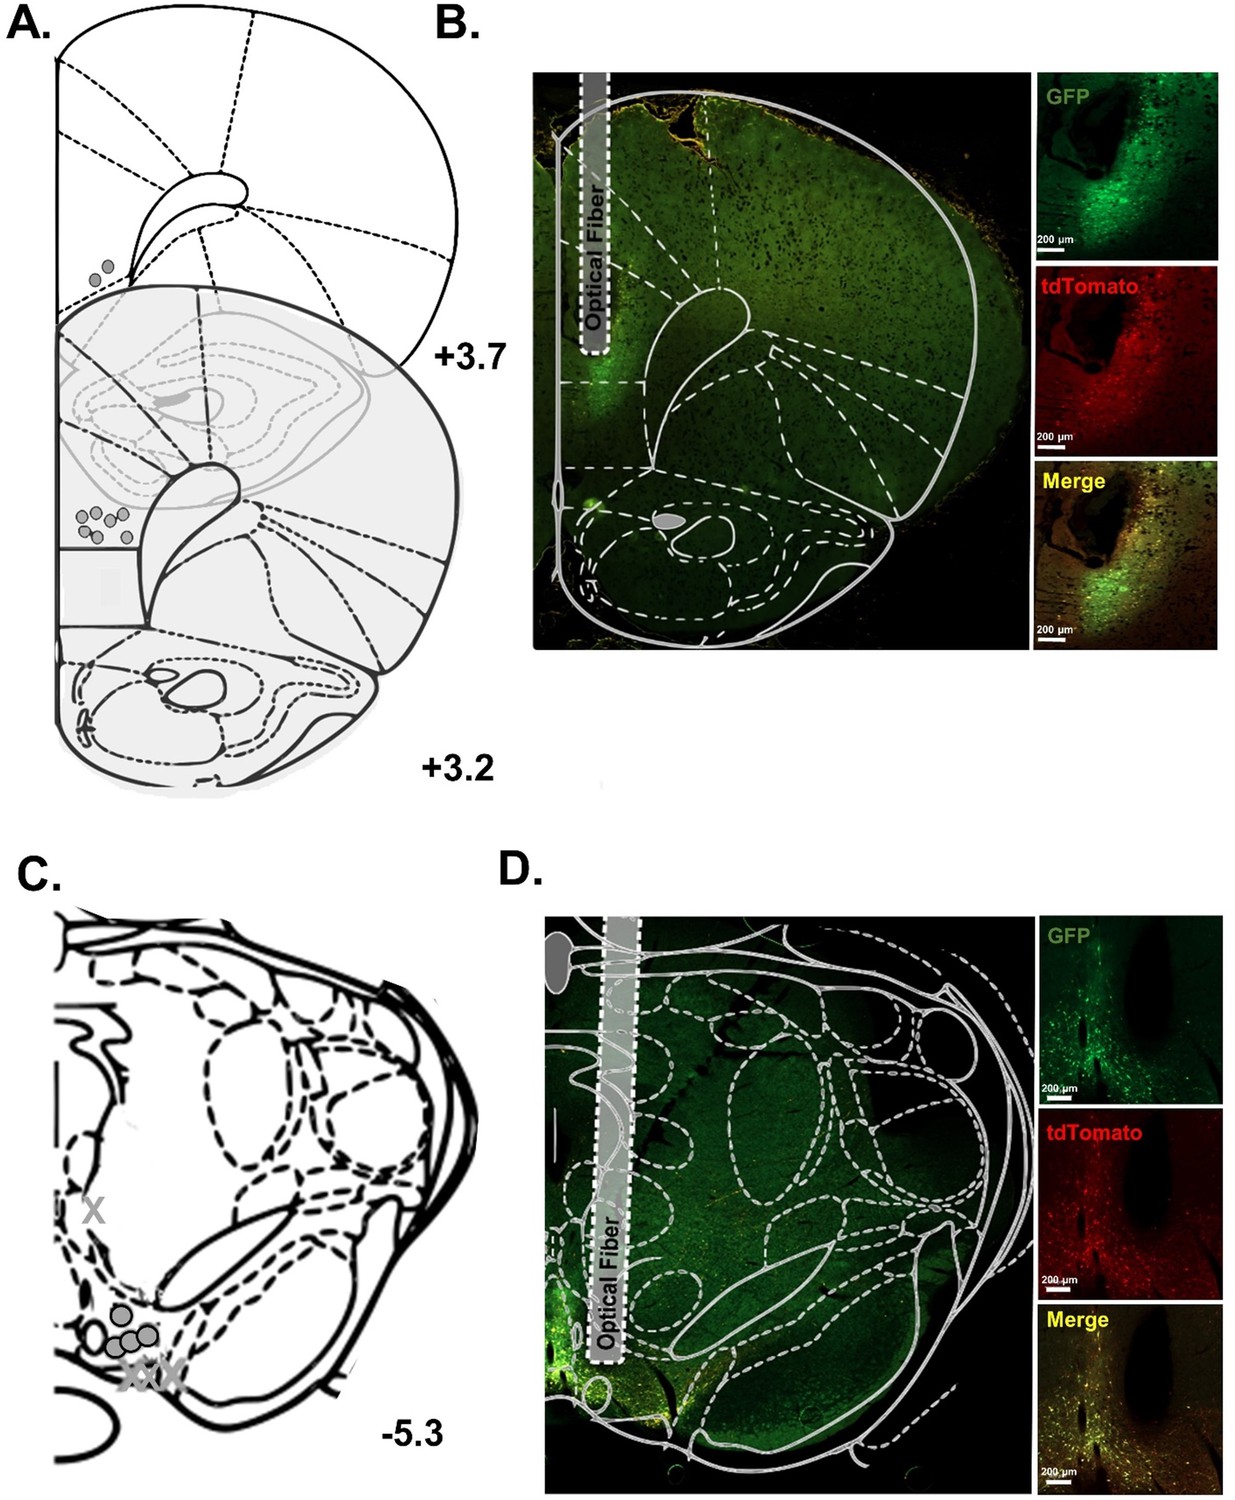
Hit map and representative image of GFP-GCaMP6s and tdTomato expression in the dorsomedial prefrontal cortex (dmPFC) and ventral tegmental area (VTA).
(A) Fiber locations for individual subjects for the dmPFC. (B) Representative image demonstrating expression of both GFP-GCaMP and tdTomato around the fiber tip in the dmPFC. (C) Fiber locations for individual subjects for the VTA. X indicates placement of excluded subjects. (D) Representative image demonstrating expression of both GFP-GCaMP and tdTomato around the fiber tip in the VTA. Scale bar = 200 µm. Brain outlines adapted from Paxinos and Watson, 1998, panels A and B from Figure 8 and panels C and D from Figure 41.
Figure 1—figure supplement 2
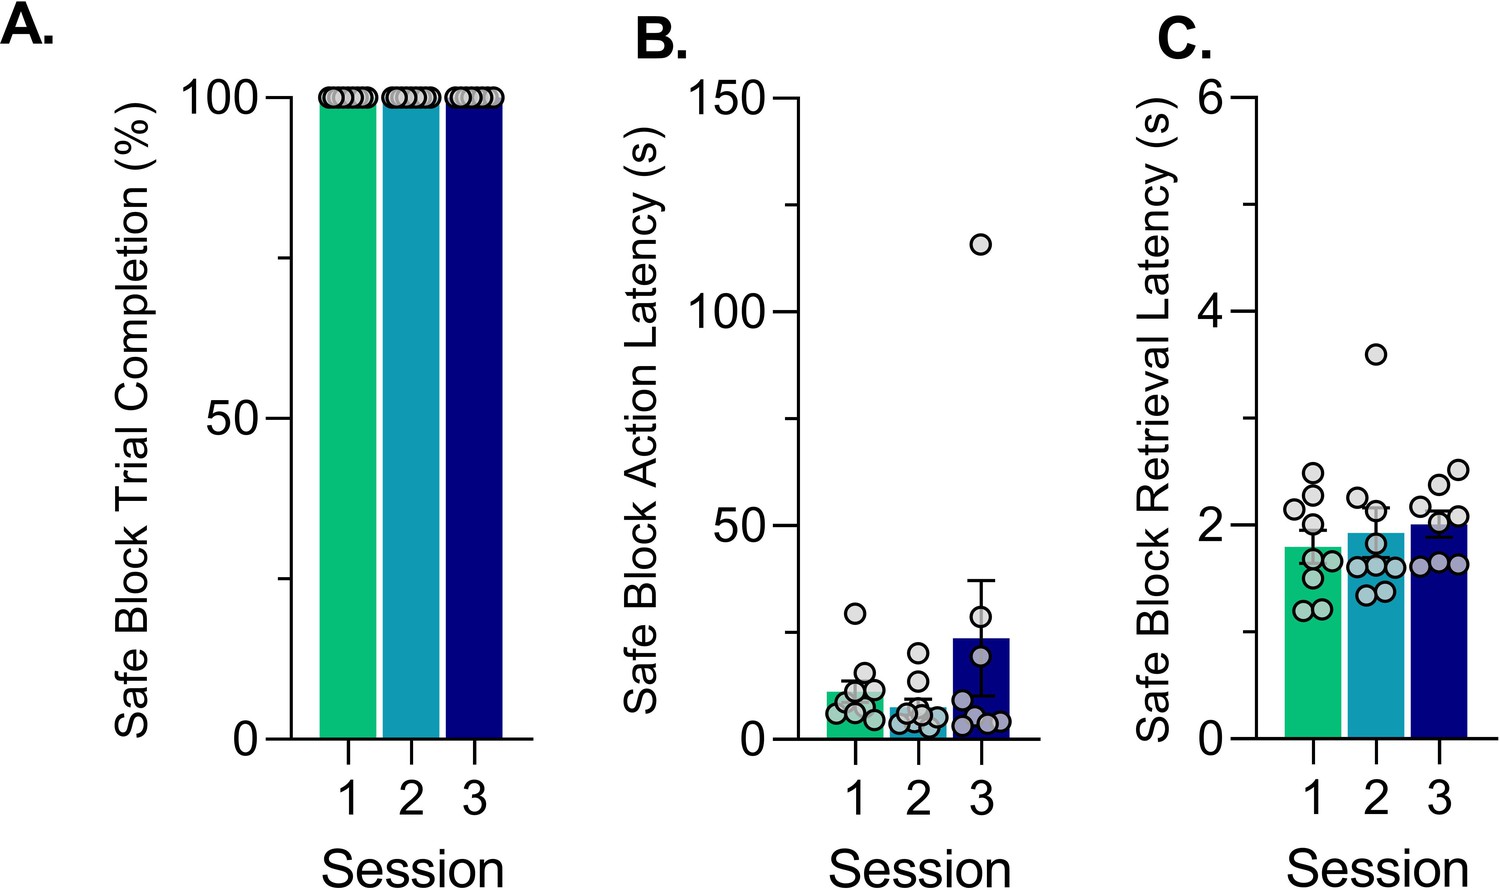
Average (mean ± SEM) and individual (gray dots) behavior during the safe (0% risk) block for the first three learning sessions.
(A) Percentage of completed trials in the safe block. (B) Latency to perform the action for the safe block. (C) Latency to retrieve the food pellet in the safe block. Green – Session 1, light blue – Session 2, purple – Session 3. Data are presented as mean ± SEM with small dots reflecting individual subjects.
Figure 2 with 4 supplements
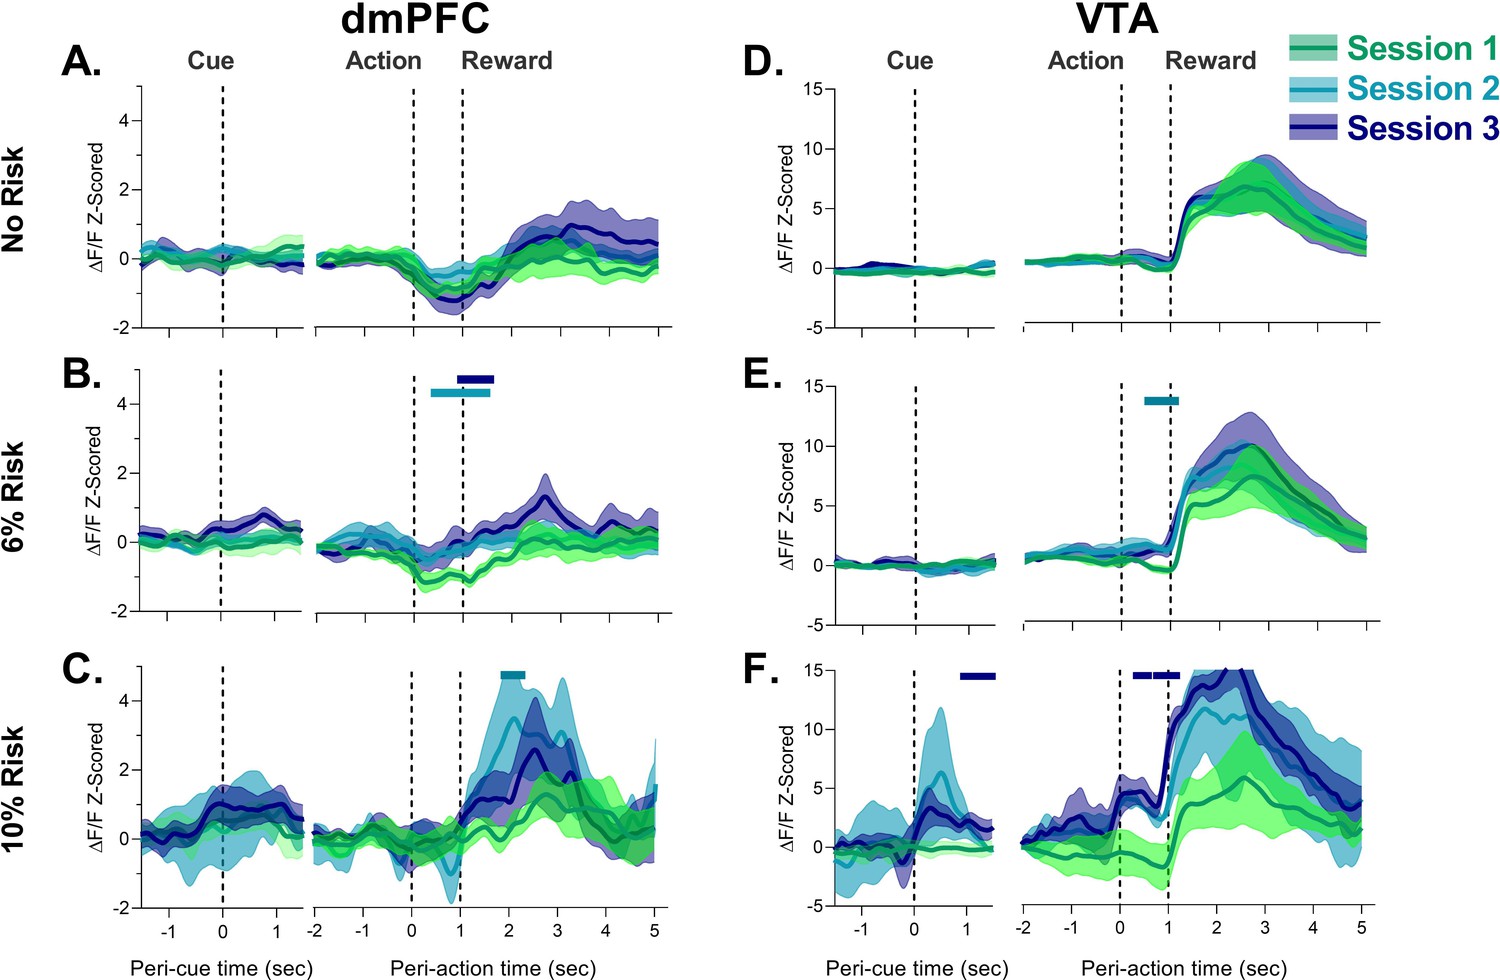
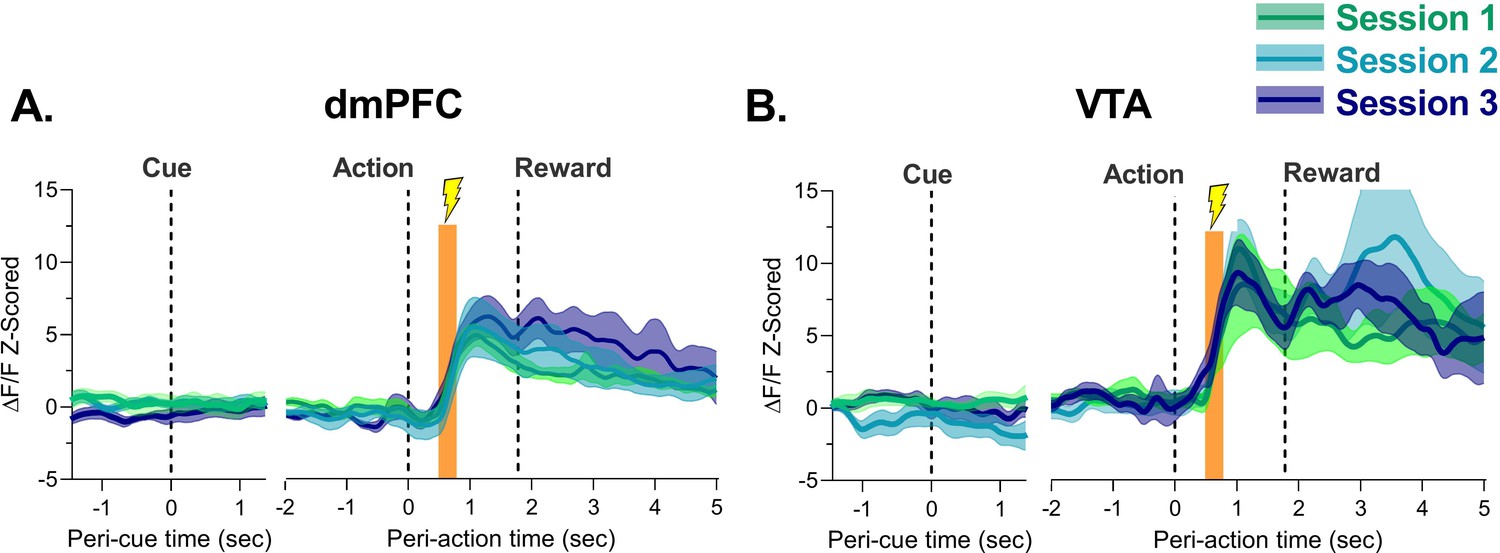
Neural calcium responses to task events in unpunished trials by dorsomedial prefrontal cortex (dmPFC) and ventral tegmental area (VTA) during punishment risk task (PRT) learning.
(A–C) dmPFC responses to cue, action, and reward delivery for each block during the PRT task. Changes in dmPFC peri-action response were observed when risk was present. (D–F) VTA responses to cue, action, and reward delivery in the VTA. Changes in VTA action and cue and action responses were detected with task training. Solid bars indicate significant differences from Session 1, where the color of the bar denotes the different session. Traces represent the mean with shaded region indicating ± SEM. n=3–9 rats, n=2 rats for VTA Session 2 at 10% risk.
-
Figure 2—source data 1
Source data for Figure 2 and Figure 2—figure supplements 2–4.
- https://cdn.elifesciences.org/articles/78912/elife-78912-fig2-data1-v2.xlsx
Figure 2—figure supplement 1
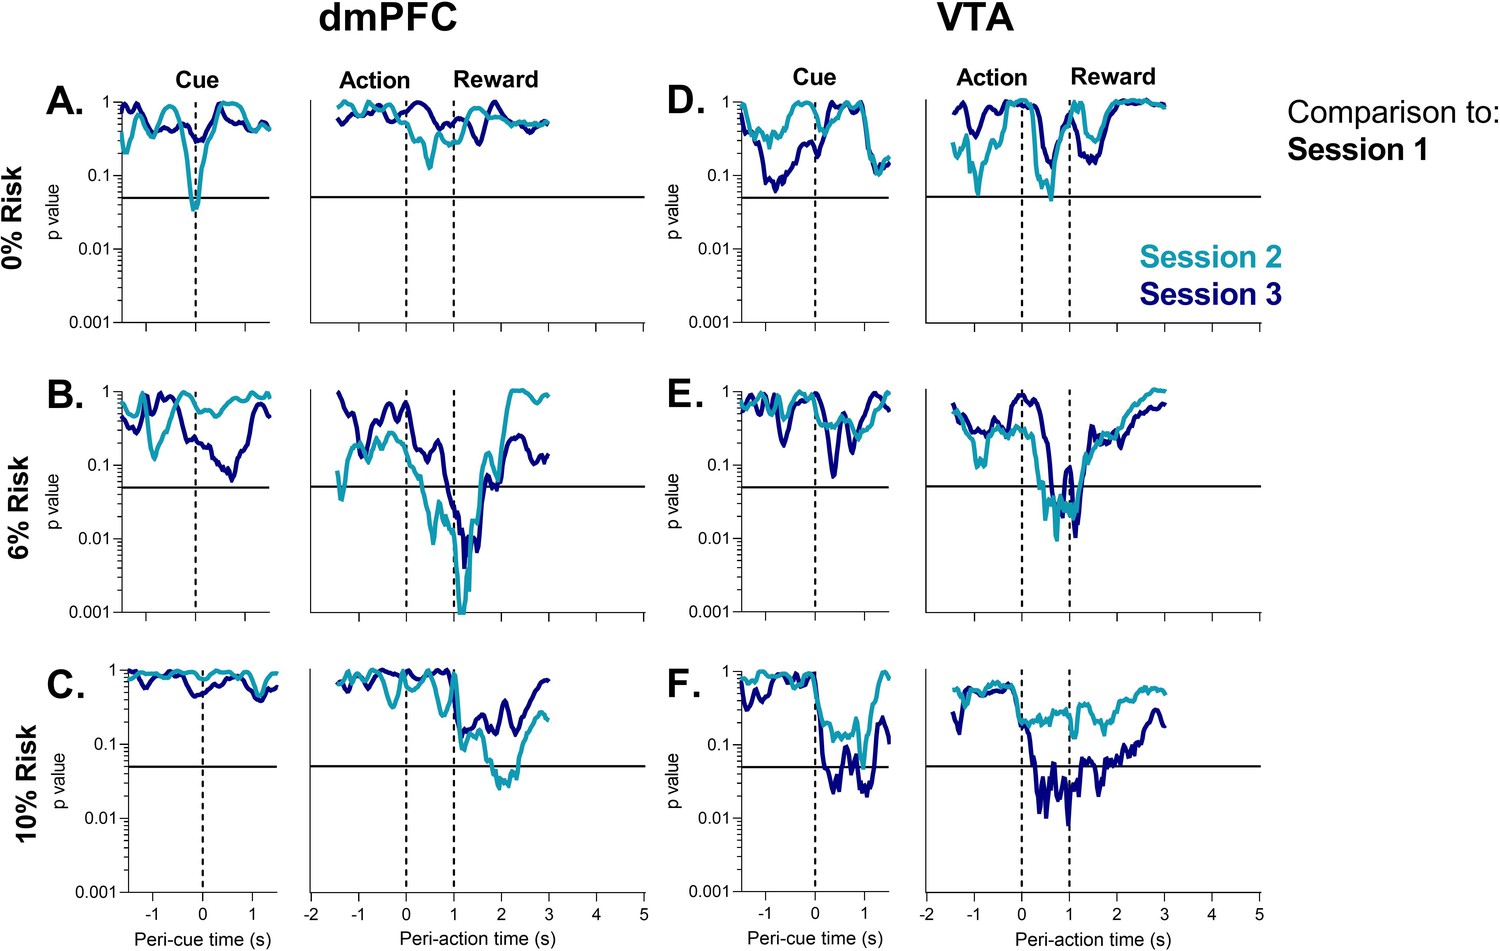
Permutation test results for recordings in the dorsomedial prefrontal cortex (dmPFC) and ventral tegmental area (VTA) for unpunished trials during punishment risk task (PRT) learning.
(A–C) dmPFC p-value for tests in the cue, action, and reward delivery periods for each block during the PRT task. (D–F) VTA p-value for tests in the cue, action, and reward delivery periods for each block during the PRT task. All comparisons are to the first PRT session (Session 1). Light blue – Session 2, purple – Session 3. Solid black line indicates p=0.05
Figure 2—figure supplement 2
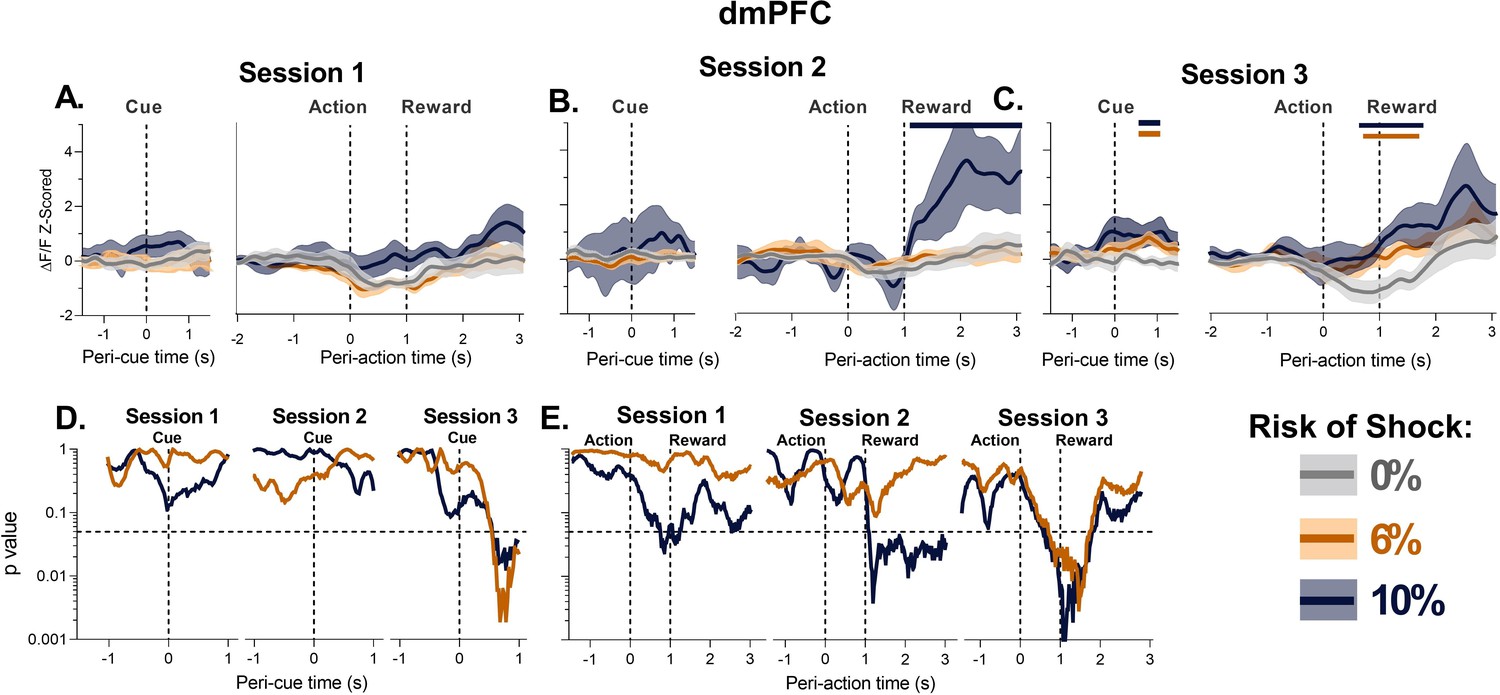
Dorsomedial prefrontal cortex (dmPFC) neural calcium responses to task events in unpunished trials.
(A–C) dmPFC responses to cue, action, and reward delivery for the first three punishment risk task (PRT) sessions. Changes in dmPFC calcium activity during action and reward were observed when risk was present after Session 1 and to the cue in Session 3. Solid bars indicate significant differences from 0% risk block, where the color of the bar denotes the 6% or 10% risk block. Traces represent the mean with shaded region indicating ± SEM. (D–E) Permutation test results for above recordings in the dmPFC for cue (D) and action-reward periods. (E) All comparisons are to the corresponding time points in the 0% risk block. Orange – 6% risk, navy – 10% risk. Dashed horizontal black line indicates p=0.05. n=5–9.
Figure 2—figure supplement 3
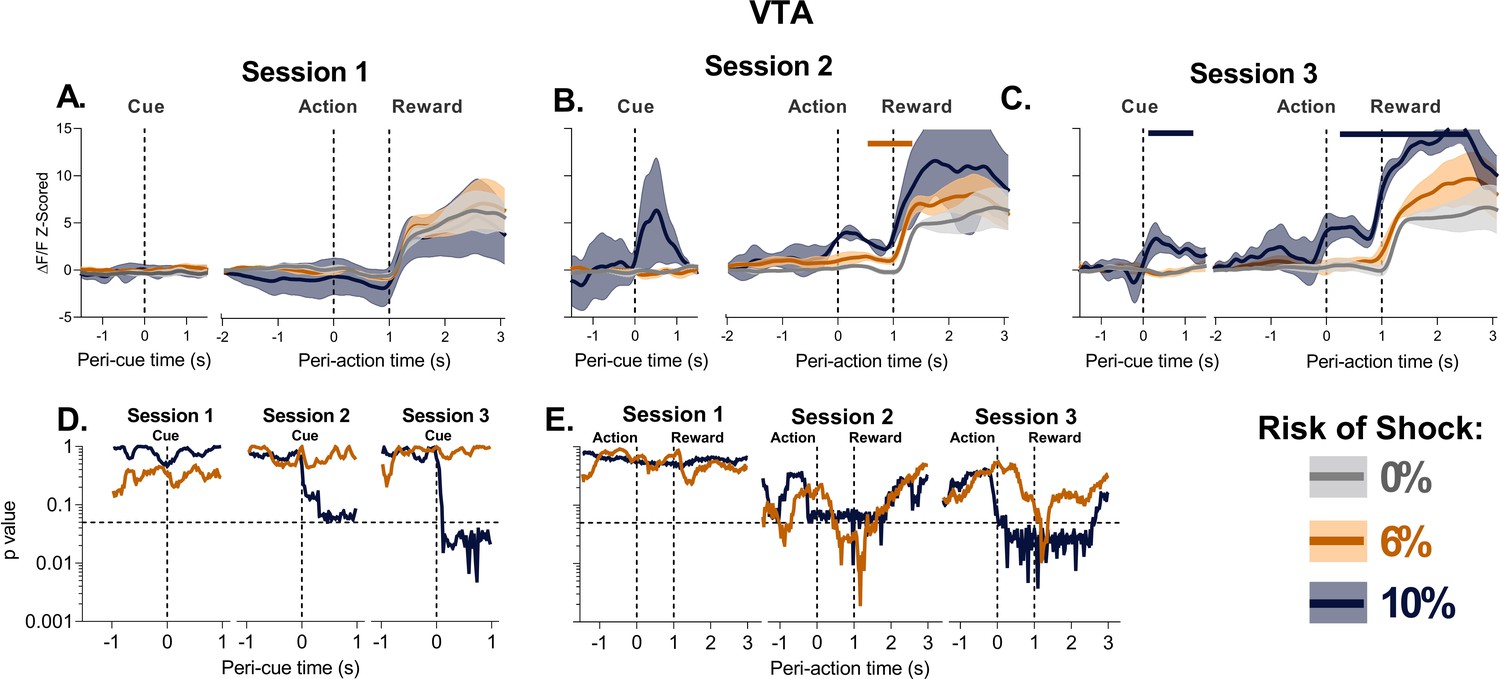
Ventral tegmental area (VTA) neural responses to task events in unpunished trials.
(A–C) VTA responses to cue, action, and reward delivery for the first three punishment risk task (PRT) sessions. Changes in VTA calcium activity during action and reward were observed when risk was present after Session 1 and to the cue in Session 3. Solid bars indicate significant differences from 0% risk block, where the color of the bar denotes the 6% or 10% risk block. Traces represent the mean with shaded region indicating ± SEM. (D–E) Permutation test results for above recordings in the VTA for cue (D) and action-reward periods (E). All comparisons are to the corresponding time points in the 0% risk block. Orange – 6% risk, navy – 10% risk. Dashed horizontal black line indicates p=0.05. n=2–4.
Figure 2—figure supplement 4
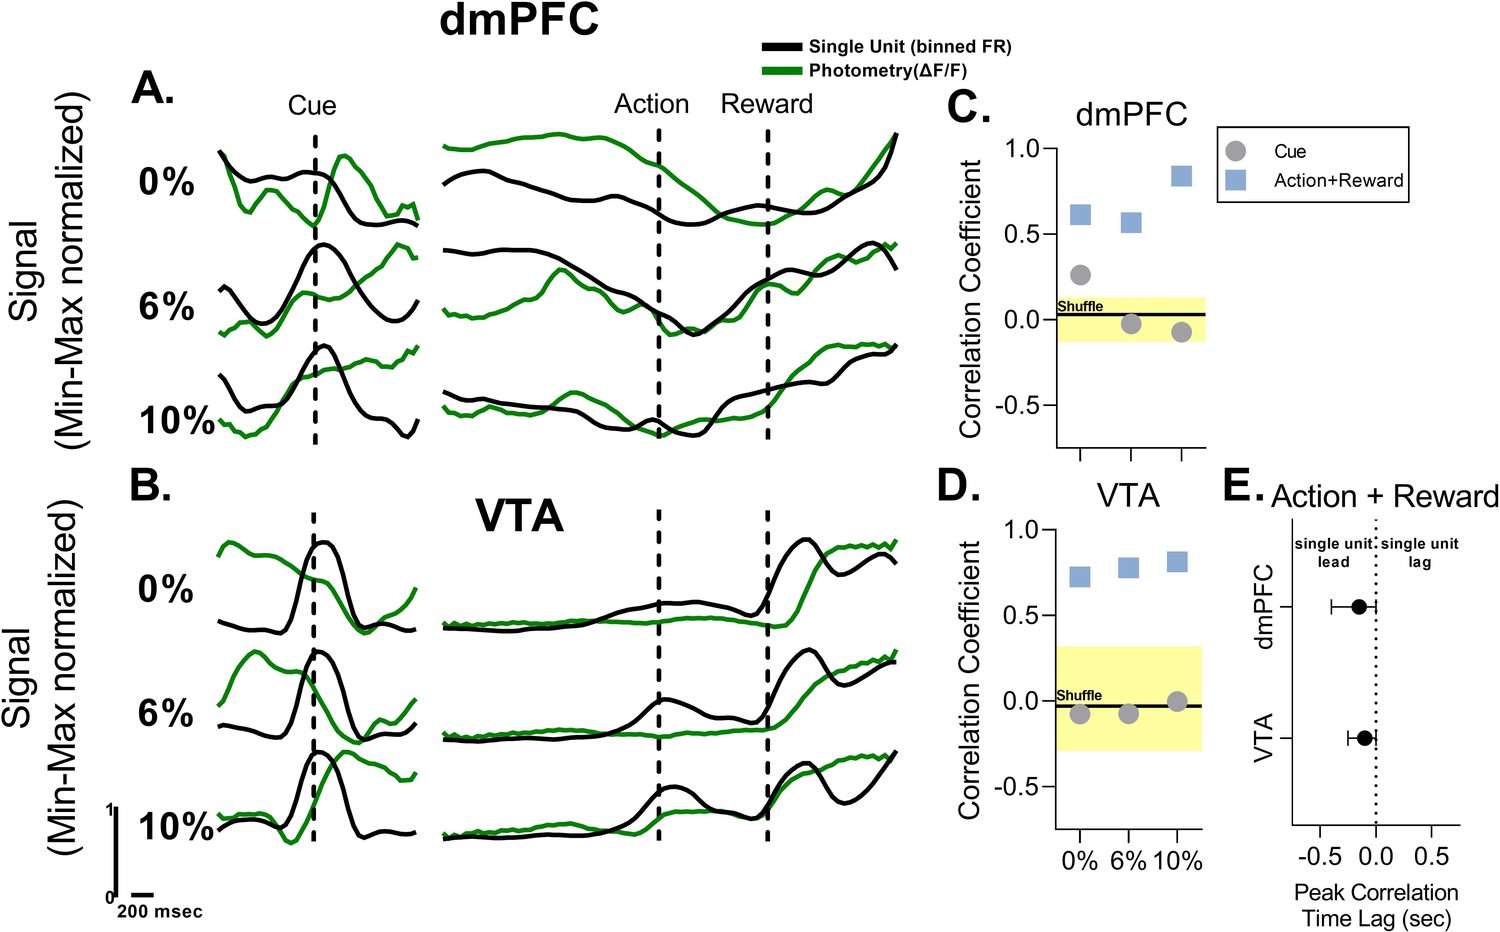
Comparison between mean dorsomedial prefrontal cortex (dmPFC) and ventral tegmental area (VTA) fiber photometry (green trace – current study) and electrophysiological single unit recordings (black trace – Park and Moghaddam, 2017) during the corresponding session and epochs in the punishment risk task (PRT).
Data are min-max normalized to adjust for differences in magnitude of the signals. (A) Changes in signal for photometry and single unit recordings in cue, action, and reward periods for the dmPFC. (B) Changes in signal for photometry and single unit recordings in cue, action, and reward periods for the VTA. Single unit data reflect the average of putative DA and non-DA units. (C) dmPFC correlation coefficient for cue and action + reward periods for comparison of single unit and fiber photometry. Black line and yellow shading reflects mean and 95% CI for correlation coefficient after random shuffling of the photometry signal. (D) VTA correlation coefficient for cue and action + reward periods for comparison of single unit and fiber photometry. Black line and yellow shading reflects mean and 95% CI for correlation coefficient after random shuffling of the photometry signal. (E) Lag for peak correlation coefficients discovered after time-lagged cross-correlation in the dmPFC and VTA. Data in E reflect the mean of all three blocks with bars representing range of the data.
Figure 3 with 1 supplement
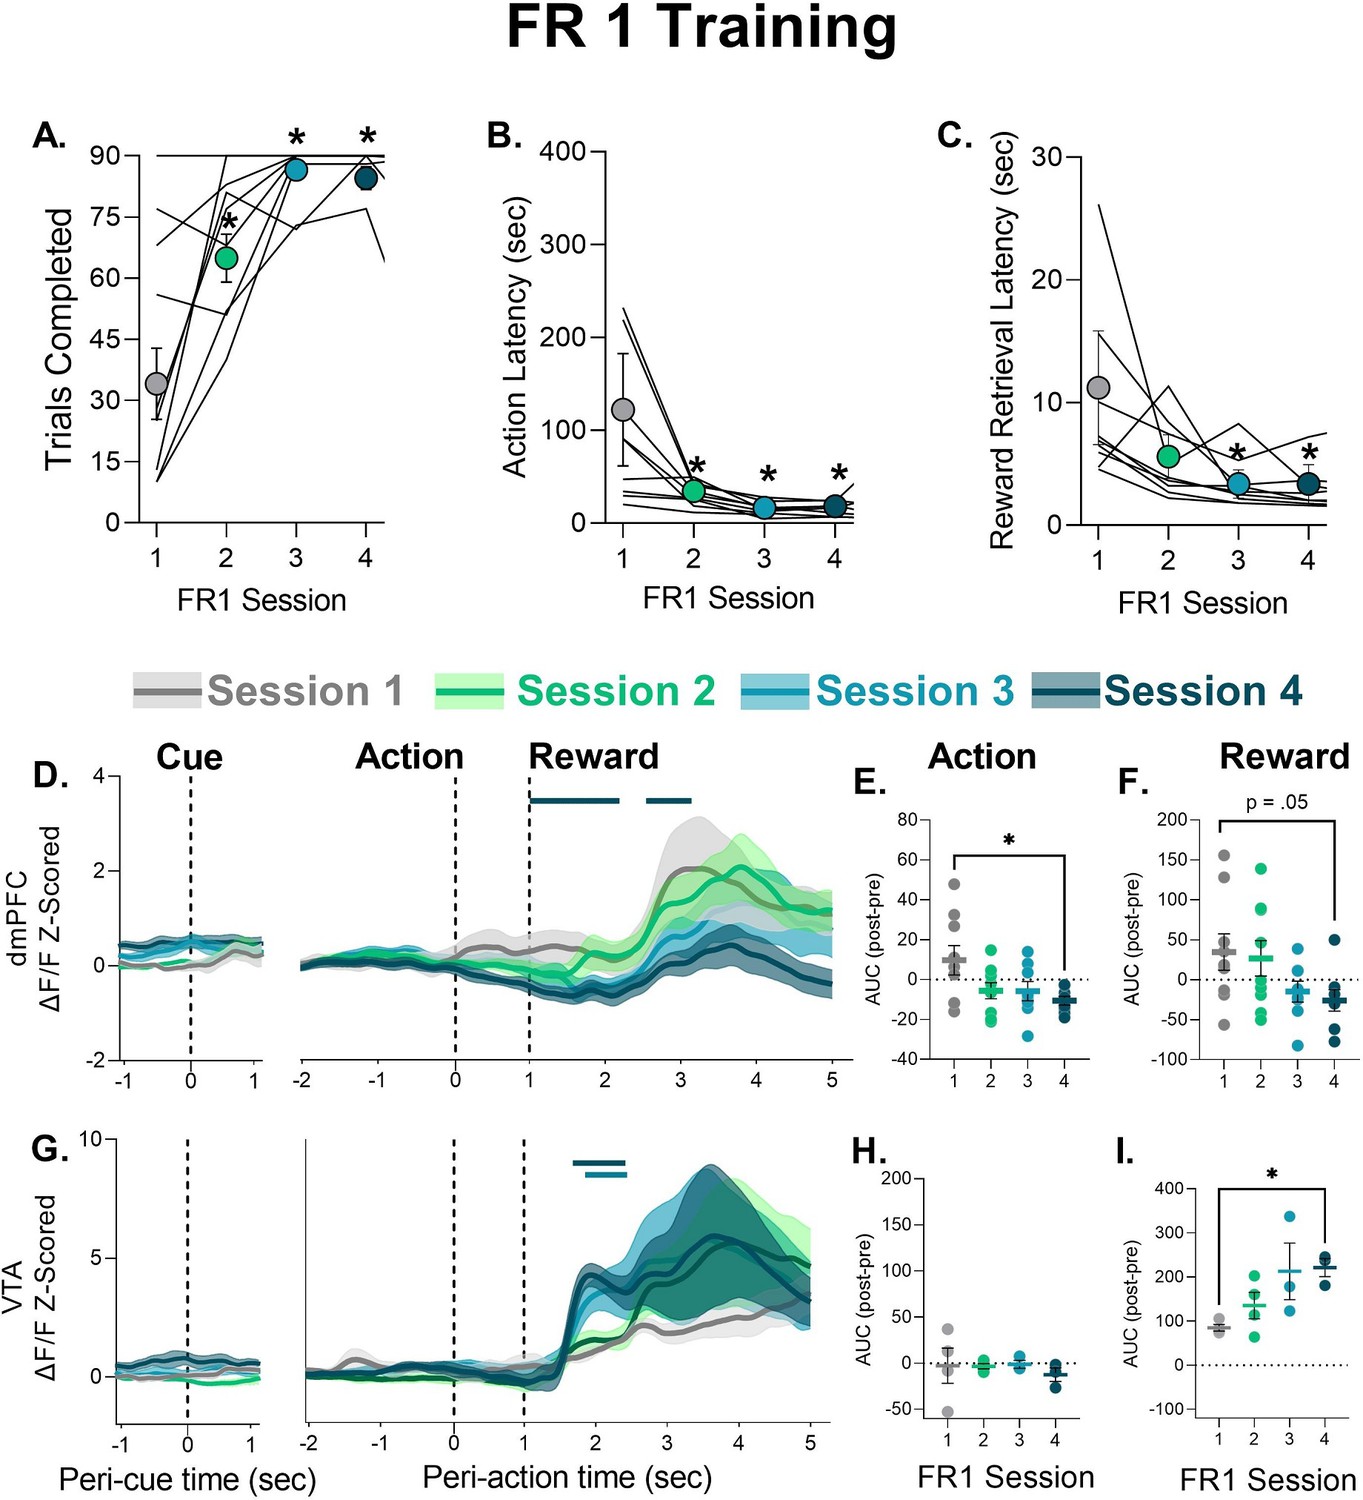
Behavior during FR1 training and corresponding neural calcium responses in cue, action, and reward epochs.
(A) Number of trials completed. (B) Latency to perform the nosepoke after the tone cue. (C) Latency to retrieve the food pellet. Data are presented as mean ± SEM. Lines indicate individual subjects. (D) Mean ± SEM trace of neural calcium activity in the dorsomedial prefrontal cortex (dmPFC) for each epoch over the first four FR1 sessions. Solid bar above traces indicates significant difference from Session 1. (E–F) Mean ± SEM area under the curve (AUC) change scores for action and reward, respectively, with circles denoting individual subjects. (G) Mean ± SEM trace of neural calcium activity in the ventral tegmental area (VTA) for each epoch over the first four FR1 sessions. Solid bar above traces indicates significant difference from Session 1. (H–I) Mean ± SEM AUC change scores for action and reward, respectively, with circles denoting individual subjects. *p<0.05 vs. Session 1, for exact p-values see Table 1. n=8–9 dmPFC, n=3–4 VTA.
-
Figure 3—source data 1
Source data for Figure 3 and Figure 3—figure supplement 1.
- https://cdn.elifesciences.org/articles/78912/elife-78912-fig3-data1-v2.xlsx
Figure 3—figure supplement 1
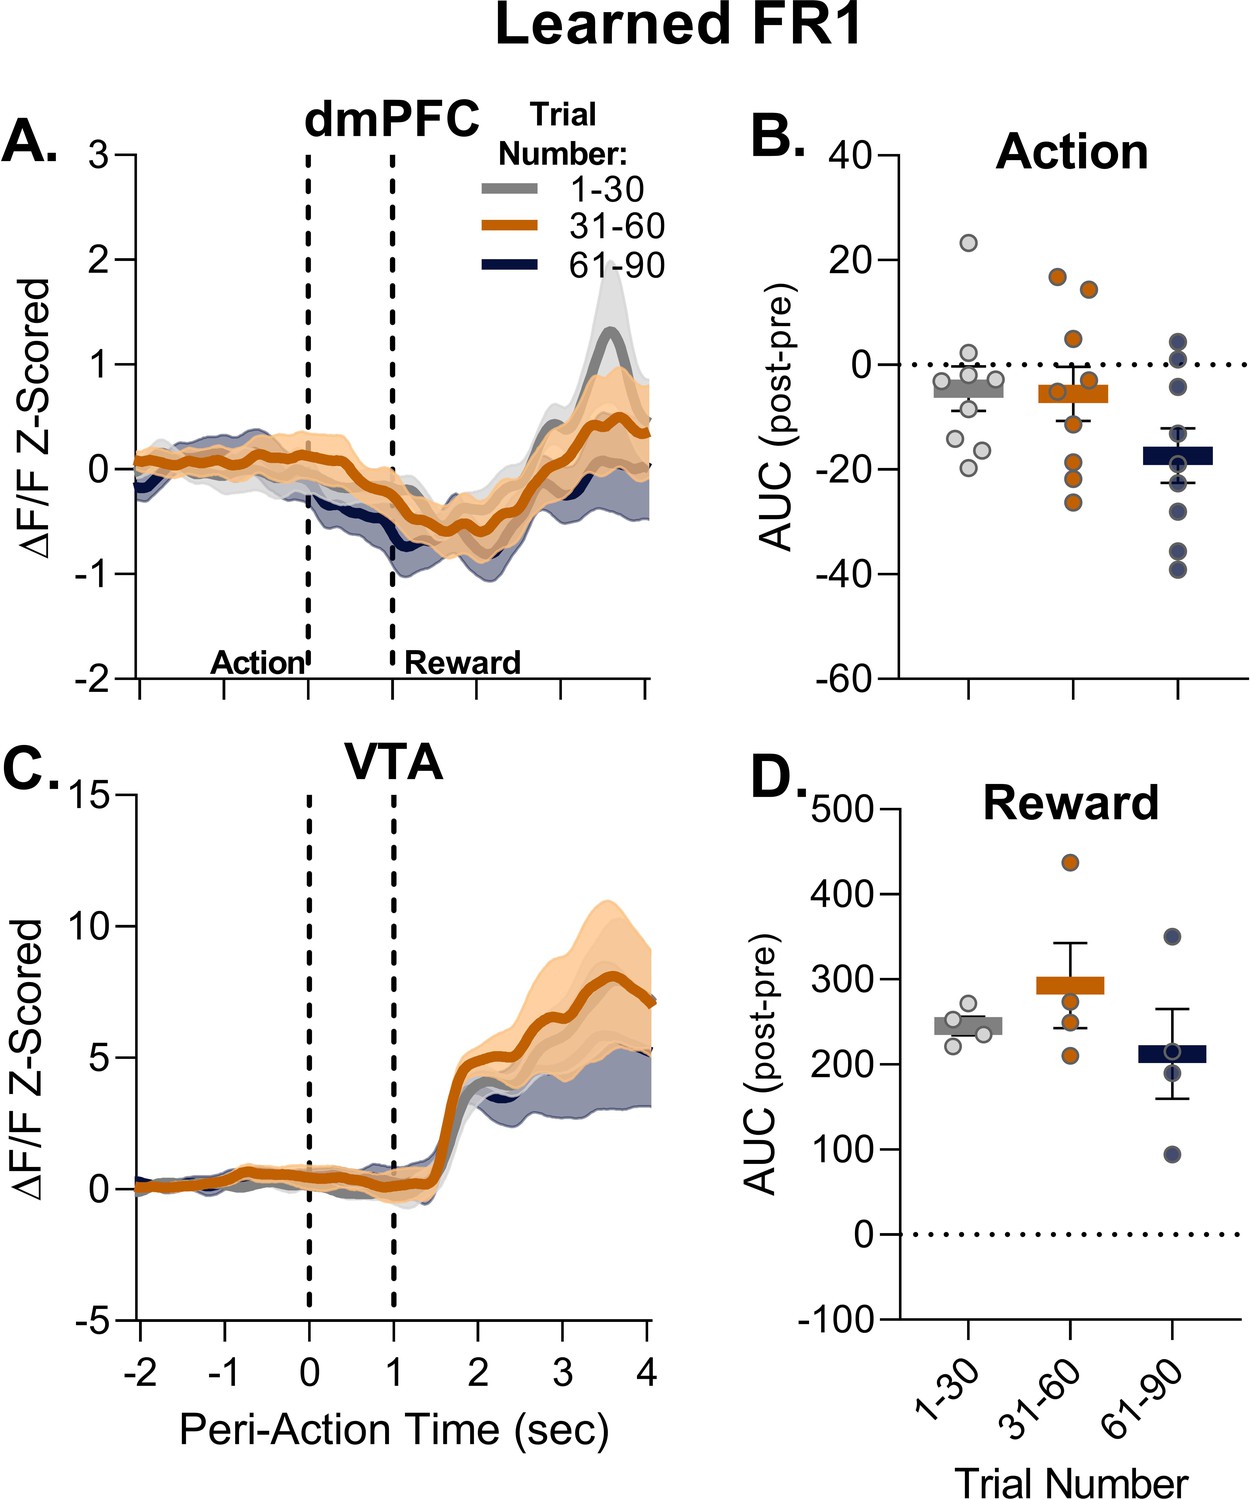
Response of dorsomedial prefrontal cortex (dmPFC) and ventral tegmental area (VTA) to action and reward after FR1 was learned.
Data are split based on if the trial was in the first, middle, or last third of the session to match the three blocks used in the punishment risk task (PRT) task. (A) Traces representing mean ± SEM for the action and reward period in the dmPFC and the corresponding mean ± SEM area under the curve (AUC) values for the action epoch are shown in (B). (C) Traces representing mean ± SEM for the action and reward period in the VTA and the corresponding mean ± SEM AUC values for the reward epoch in (D). Note: data are from the fourth FR1 session with the exception of a rat whose third session was used because that rat only completed three FR1 sessions and Session 5 in another rat was used in lieu of Session 4 due to the patchcord being misaligned. n=4–9.
Figure 4 with 3 supplements
Neural calcium responses to action-contingent footshock by dorsomedial prefrontal cortex (dmPFC) and ventral tegmental area (VTA) during punishment risk task (PRT) learning.
(A) The dmPFC demonstrated robust phasic increases in neural calcium activity at the time of footshock administration over the three initial PRT sessions. (B) Same as (A) but for the VTA. Orange bar indicates the period where footshock was administered. Traces represent mean with shaded region indicating ± SEM. n=4–9 rats.
-
Figure 4—source data 1
Source data for Figure 4 and Figure 4—figure supplement 3.
- https://cdn.elifesciences.org/articles/78912/elife-78912-fig4-data1-v2.xlsx
Figure 4—figure supplement 1
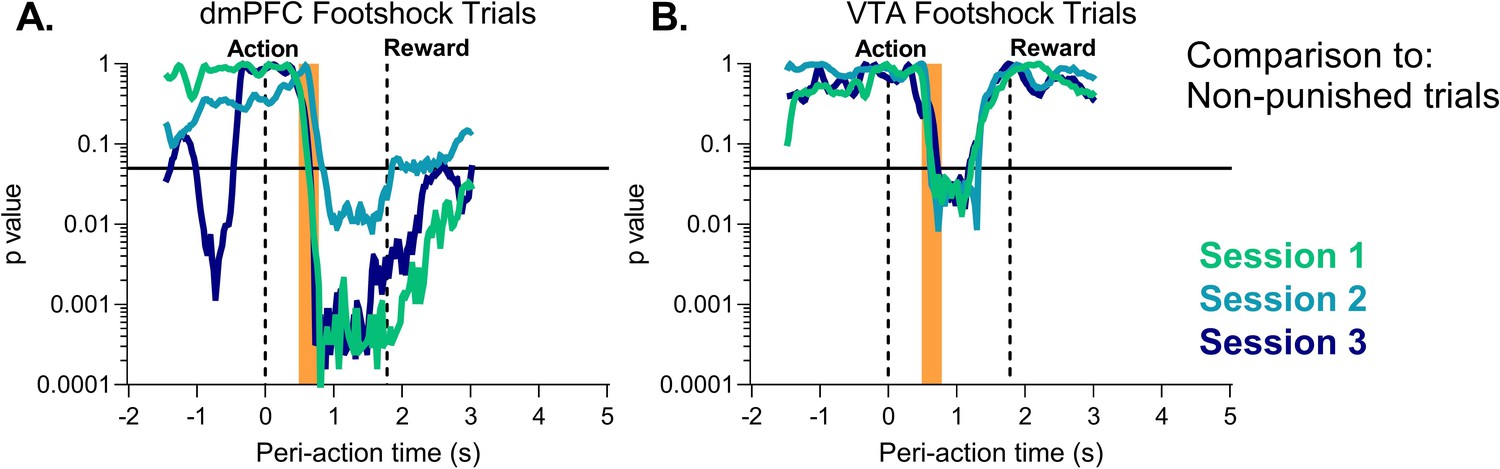
Permutation test results for recordings in the dorsomedial prefrontal cortex (dmPFC) and ventral tegmental area (VTA) for punished trials during punishment risk task (PRT) learning.
(A) dmPFC p-value for tests in the action, footshock (orange bar), and reward delivery periods for the first three session in the PRT task. (B) VTA p-value for tests in the action, footshock (orange bar), and reward delivery periods for the first three session in the PRT task. All comparisons are to the corresponding time points in the 0% risk block (no footshock). Green – Session 1, light blue – Session 2, purple – Session 3. Solid black line indicates p=0.05.
Figure 4—figure supplement 2
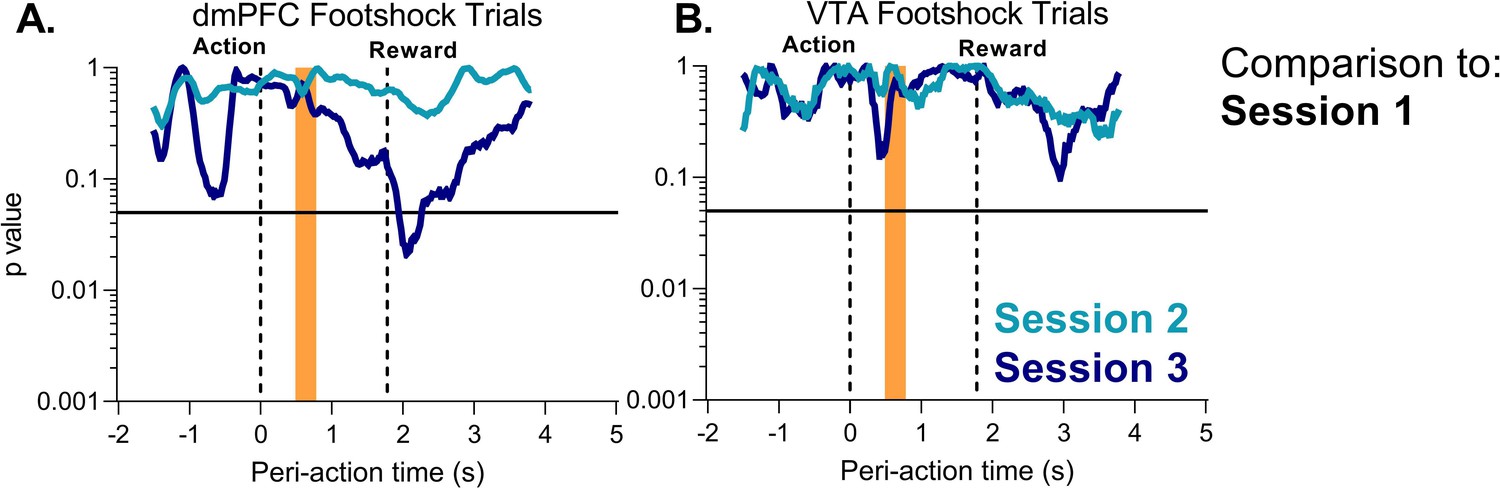
Permutation test results for recordings in the dorsomedial prefrontal cortex (dmPFC) and ventral tegmental area (VTA) for punished trials during punishment risk task (PRT) learning.
(A) dmPFC p-value for tests in the action, footshock (orange bar), and reward delivery periods for the first three session in the PRT task. (B) VTA p-value for tests in the action, footshock (orange bar), and reward delivery periods for the first three session in the PRT task. All comparisons are to the first PRT session. Light blue – Session 2, purple – Session 3. Solid black line indicates p=0.05.
Figure 4—figure supplement 3
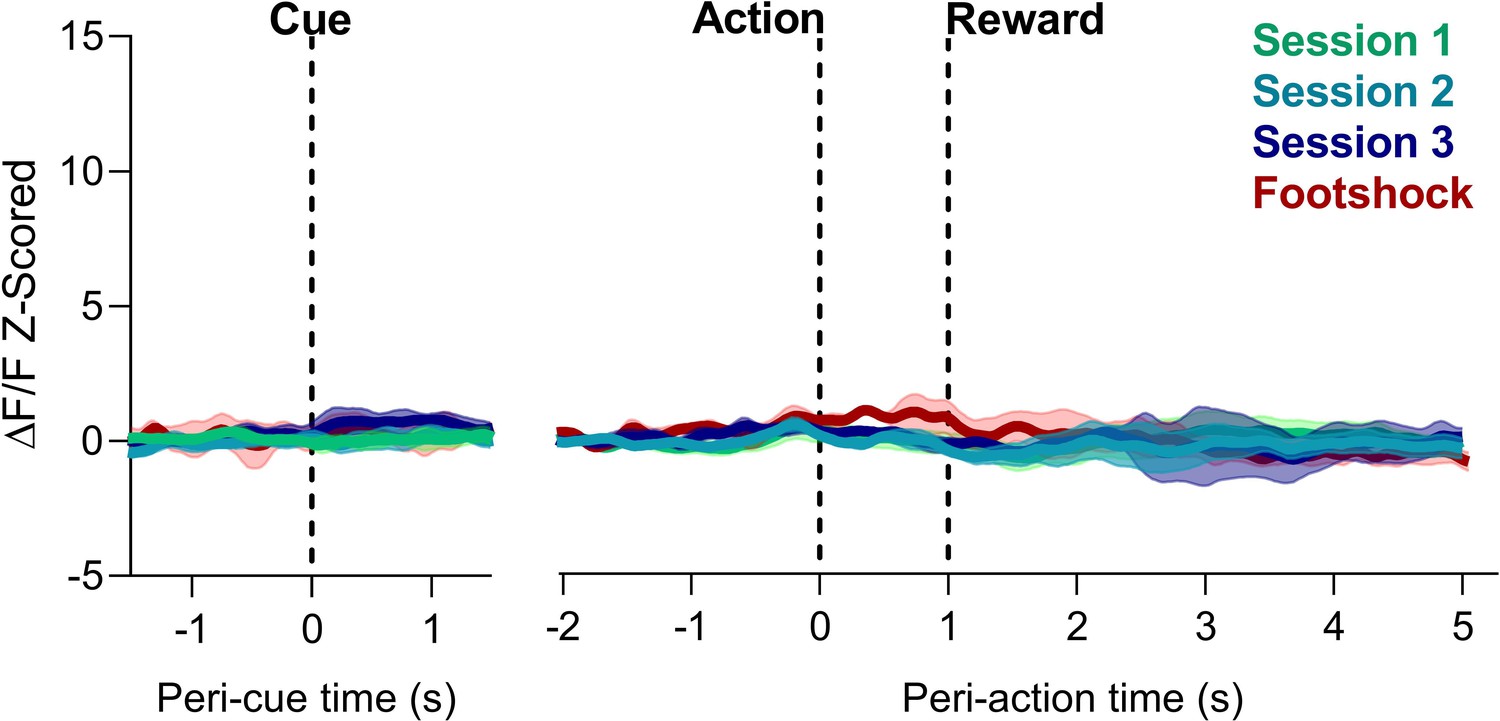
Ventral tegmental area (VTA) fiber photometry traces for unpunished (0% risk block) and punished (footshock) trials during punishment risk task (PRT) learning in rats with misplaced fibers or no GCaMP6s expression.
Large responses to the footshock or reward delivery were not observed. Data are presented as mean (trace) ± SEM (shaded region). n=3–4 rats.
Figure 5 with 1 supplement
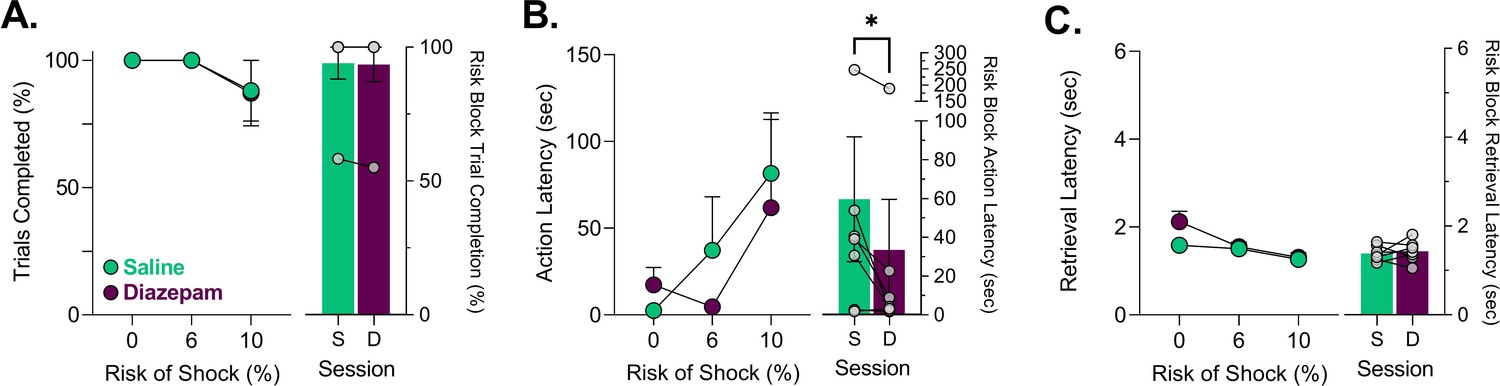
Effects of saline and diazepam (2 mg/kg) on punishment risk task (PRT) behavior.
(A) Trial completion was unaffected by 2 mg/kg diazepam. (B) Action latencies for trials where risk was present or absent. Diazepam significantly and consistently attenuated action latency increases seen from probabilistic punishment only when risk was present. (C) Increases in reward retrieval latency which indicate motoric disruption from diazepam in block 1 dissipated in blocks 2 and 3 where risk was present. Data are presented as mean ± SEM with gray dots reflecting individual subjects. *p<0.05, for exact p-values see Table 1. n=7 rats. S = Saline, D= Diazepam.
-
Figure 5—source data 1
Source data for Figure 5 and Figure 5—figure supplement 1.
- https://cdn.elifesciences.org/articles/78912/elife-78912-fig5-data1-v2.xlsx
Figure 5—figure supplement 1
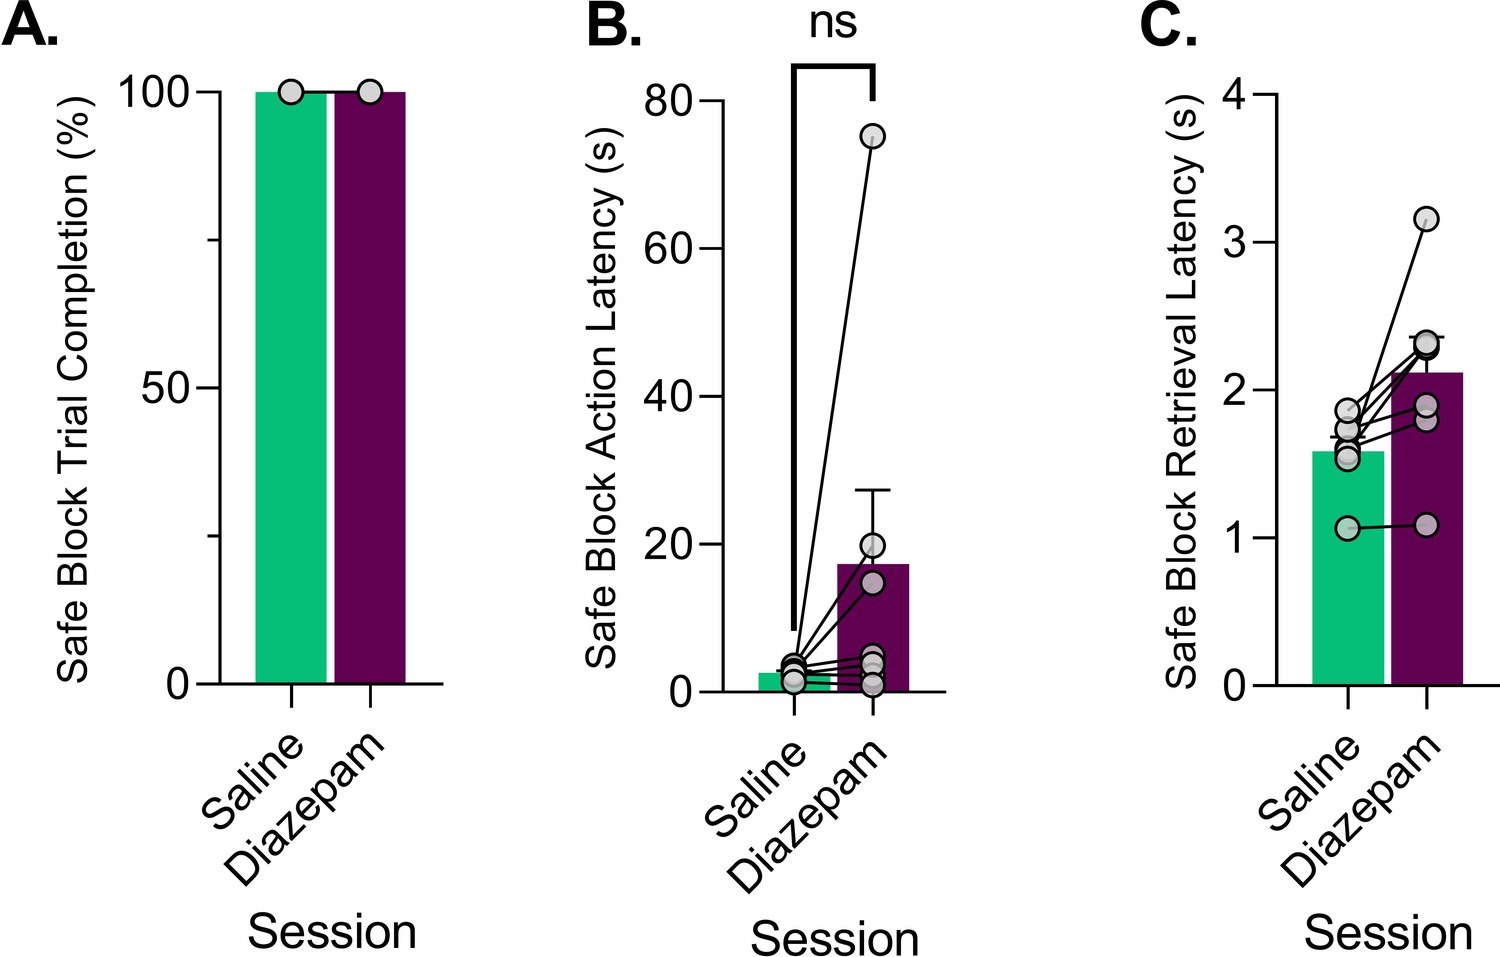
Average (mean ± SEM) and individual (gray dots) behavior during the safe (0% risk) block for saline and diazepam pretreatment sessions.
(A) Percentage of completed trials in the safe block. (B) Latency to perform the action for the safe block. (C) Latency to retrieve the food pellet in the safe block. Green – saline, magenta – diazepam. ns = not significant, for exact p-values see Table 1. n=7. Data are presented as mean ± SEM with gray dots reflecting individual subjects.
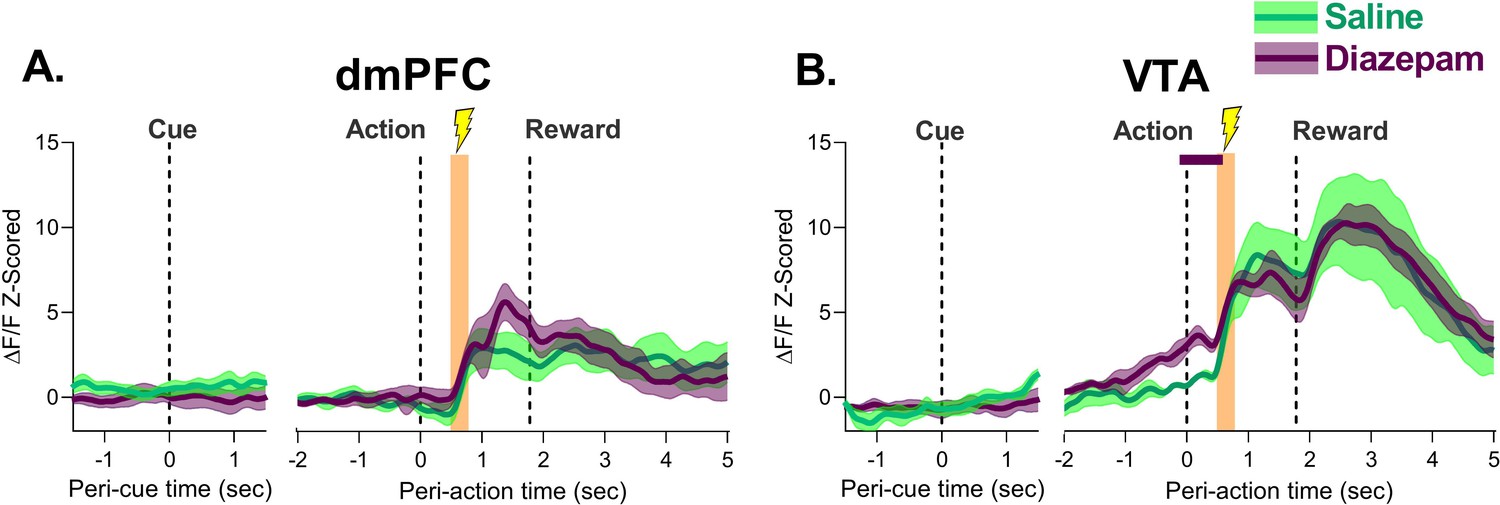
Figure 6 with 1 supplement

Effects of diazepam on neural calcium activity during unpunished trials in the punishment risk task (PRT) in the dorsomedial prefrontal cortex (dmPFC) (left) and ventral tegmental area (VTA) (right).
(A–C) No effect of diazepam was observed during the cue or action epoch in the dmPFC, and a small but significant downward shift was seen following treatment early in the reward epoch in the safe block. (D–F) Diazepam had no effect on neural calcium activity during the reward period in the VTA. The peri-action activity was enhanced by diazepam until after action execution (D–E) but dissipated at high risk. (F) Traces represent the mean with shaded region indicating ± SEM. Solid lines above traces indicate significant differences from saline at those time points. n=4–7 rats.
-
Figure 6—source data 1
Source data for Figure 6.
- https://cdn.elifesciences.org/articles/78912/elife-78912-fig6-data1-v2.xlsx
Figure 6—figure supplement 1

Permutation test results for recordings in the dorsomedial prefrontal cortex (dmPFC) and ventral tegmental area (VTA) for unpunished punishment risk task (PRT) trials after saline or diazepam (2 mg/kg) pretreatment.
(A–C) dmPFC p-value for tests in the cue, action, and reward delivery periods for each block during the PRT task. (D–F) VTA p-value for tests in the cue, action, and reward delivery periods for each block during the PRT task. All comparisons are to the saline session. Magenta – diazepam. Solid black line indicates p=0.05.
Figure 7 with 3 supplements
Effect of diazepam on neural response to action-contingent footshock in the dorsomedial prefrontal cortex (dmPFC) and ventral tegmental area (VTA).
(A) dmPFC footshock responses were not different following diazepam treatment. (B) VTA response to the footshock did not change with diazepam treatment. The only significant differences were observed during action execution, before the shock was administered. Orange bar indicates period of footshock administration. Traces represent the mean with shaded region indicating ± SEM. Solid lines indicate a significant difference from saline. n=4–7 rats.
-
Figure 7—source data 1
Source data for Figure 7 and Figure 7—figure supplements 2–3.
- https://cdn.elifesciences.org/articles/78912/elife-78912-fig7-data1-v2.xlsx
Figure 7—figure supplement 1
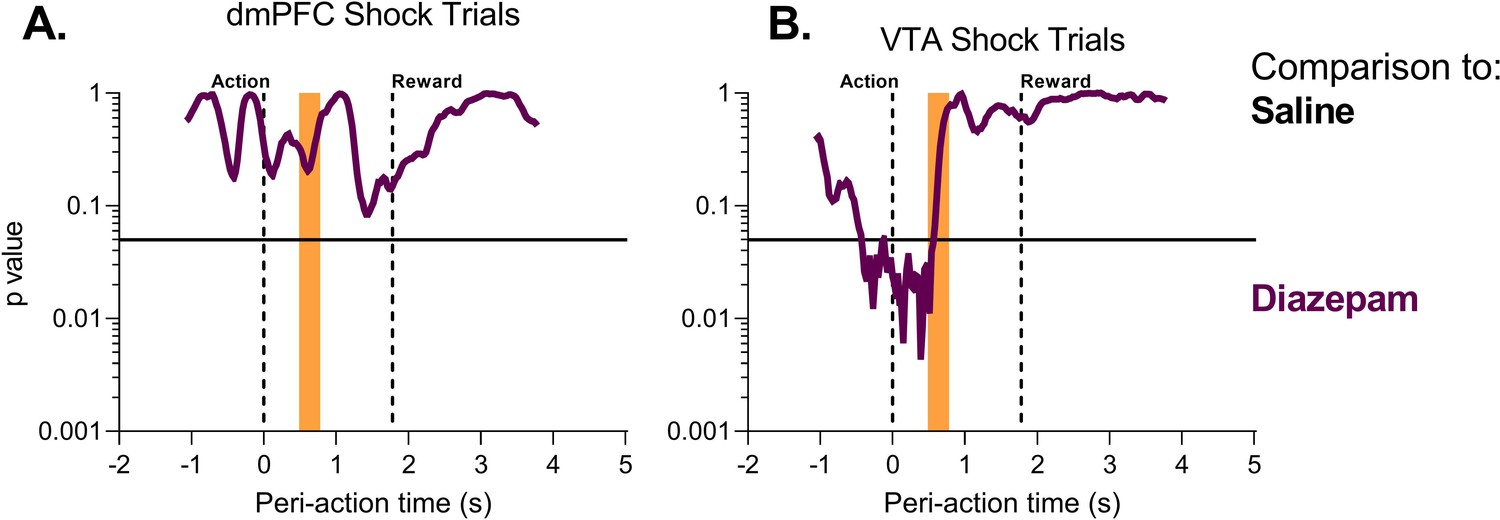
Permutation test results for recordings in the dorsomedial prefrontal cortex (dmPFC) and ventral tegmental area (VTA) for punished punishment risk task (PRT) trials after diazepam (2 mg/kg) pretreatment.
(A) dmPFC p-value for tests in the action, footshock (orange bar), and reward delivery periods for the first three session in the PRT task. (B) VTA p-value for tests in the action, footshock (orange bar), and reward delivery periods for the first three session in the PRT task. All comparisons are to the saline session. Magenta – diazepam. Solid black line indicates p=0.05.
Figure 7—figure supplement 2
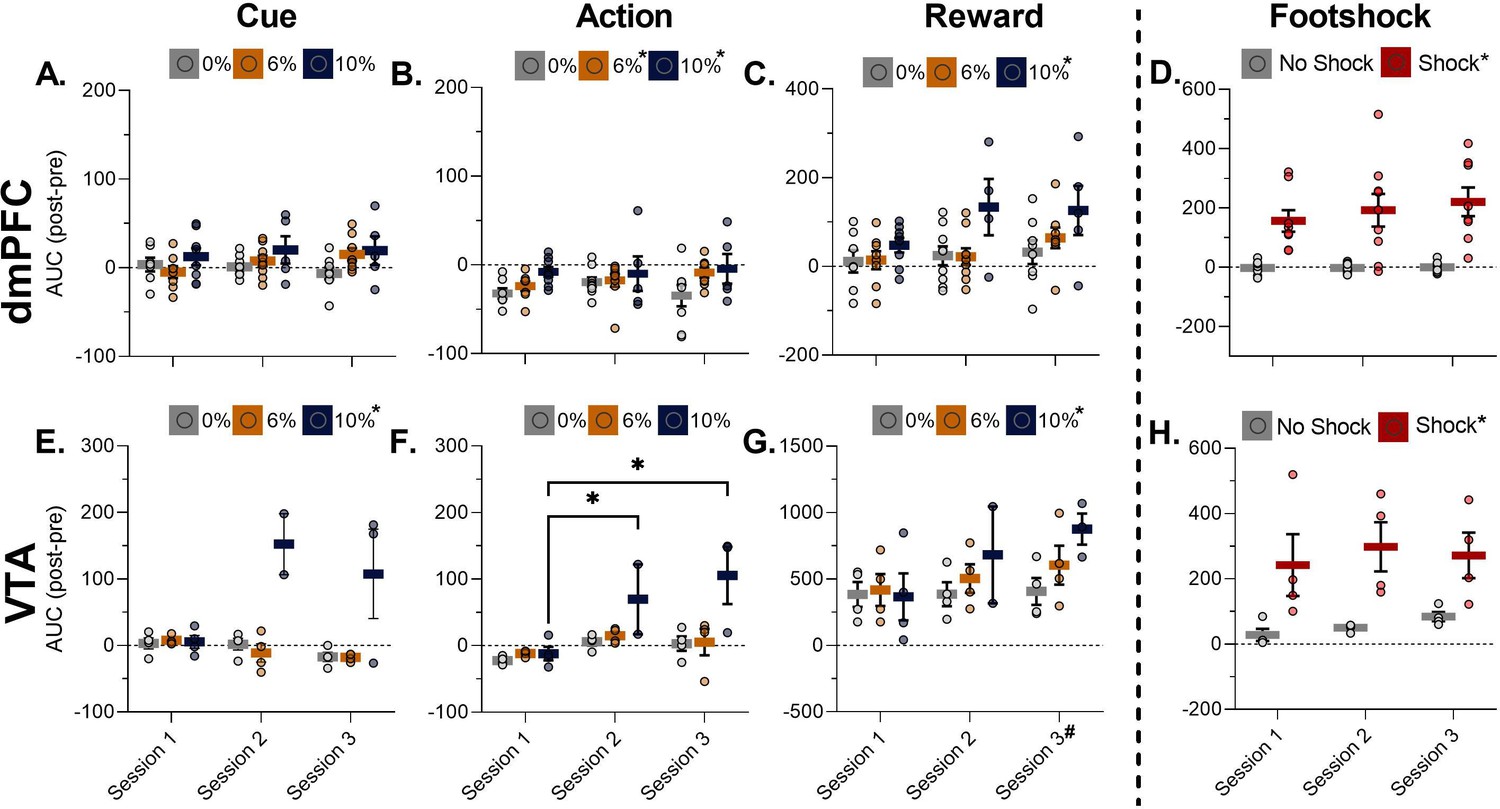
Area under the curve analysis for each epoch and learning sessions (see Figure 7—figure supplement 3 for saline/diazepam).
Data represent the mean ± SEM (line and bars) with individual data represented by circles. Colors denote risk block. (A–D) Post-pre change scores for cue (A), action (B), reward (C), and footshock (D) epochs in the dorsomedial prefrontal cortex (dmPFC). (E–H) Post-pre change scores for cue (E), action (F), reward (G), and footshock (H) epochs in the VTA. *p<0.05 vs. 0% risk, no shock, or corresponding block in Session 1, #p<0.05 vs. Session 1, for exact p-values see Table 1.
Figure 7—figure supplement 3
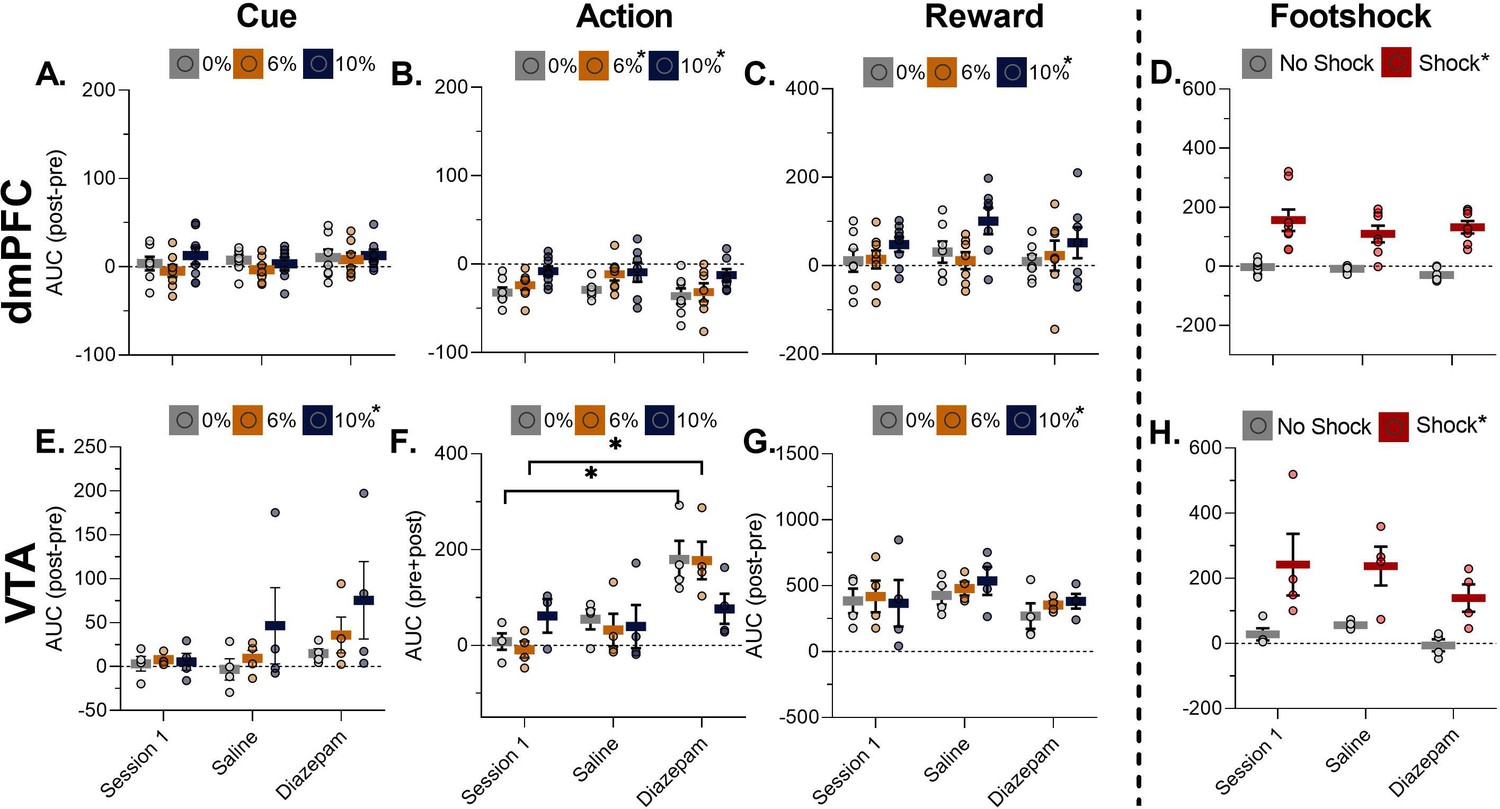
Area under the curve analysis for each epoch and saline/diazepam sessions (see Figure 7—figure supplement 7–S2 for learning data).
Data represent the mean ± SEM (line and bars) with individual data represented by circles. Colors denote risk block. (A–D) Post-pre change scores for cue (A), action (B), reward (C), and footshock (D) epochs in the dorsomedial prefrontal cortex (dmPFC). (E–H) Post-pre change scores for cue (E), reward (G), and footshock (H) epochs in the ventral tegmental area (VTA). For VTA action (F) area under the curve (AUC) values reflect sum of post and pre action period. *p<0.05 vs. 0% risk, no shock, or corresponding block in Session 1, for exact p-values see Table 1.
Figure 8 with 1 supplement

Correlated activity between the dorsomedial prefrontal cortex (dmPFC) and ventral tegmental area (VTA) during action and reward epochs in the punishment risk task (PRT) after saline or diazepam treatment.
(A.–C) Correlated activity during action execution was enhanced by diazepam treatment in the safe block and the lower risk block. While correlated activity reached its lowest level at the highest risk block, regardless of treatment. (D) Peak correlation coefficient values and 95% confidence interval for each cross-correlation function in A–C. (E–G) Correlated activity was enhanced by diazepam during the reward epoch across all blocks. (H) Peak correlation coefficient values and 95% confidence interval for each cross-correlation function in D–F. *p<0.05,****p<0.001. Lines represent the mean with shaded region indicating ± SEM. n=77–120 trials from four rats.
-
Figure 8—source data 1
Source data for Figure 8 and Figure 8—figure supplement 1.
- https://cdn.elifesciences.org/articles/78912/elife-78912-fig8-data1-v2.xlsx
Figure 8—figure supplement 1
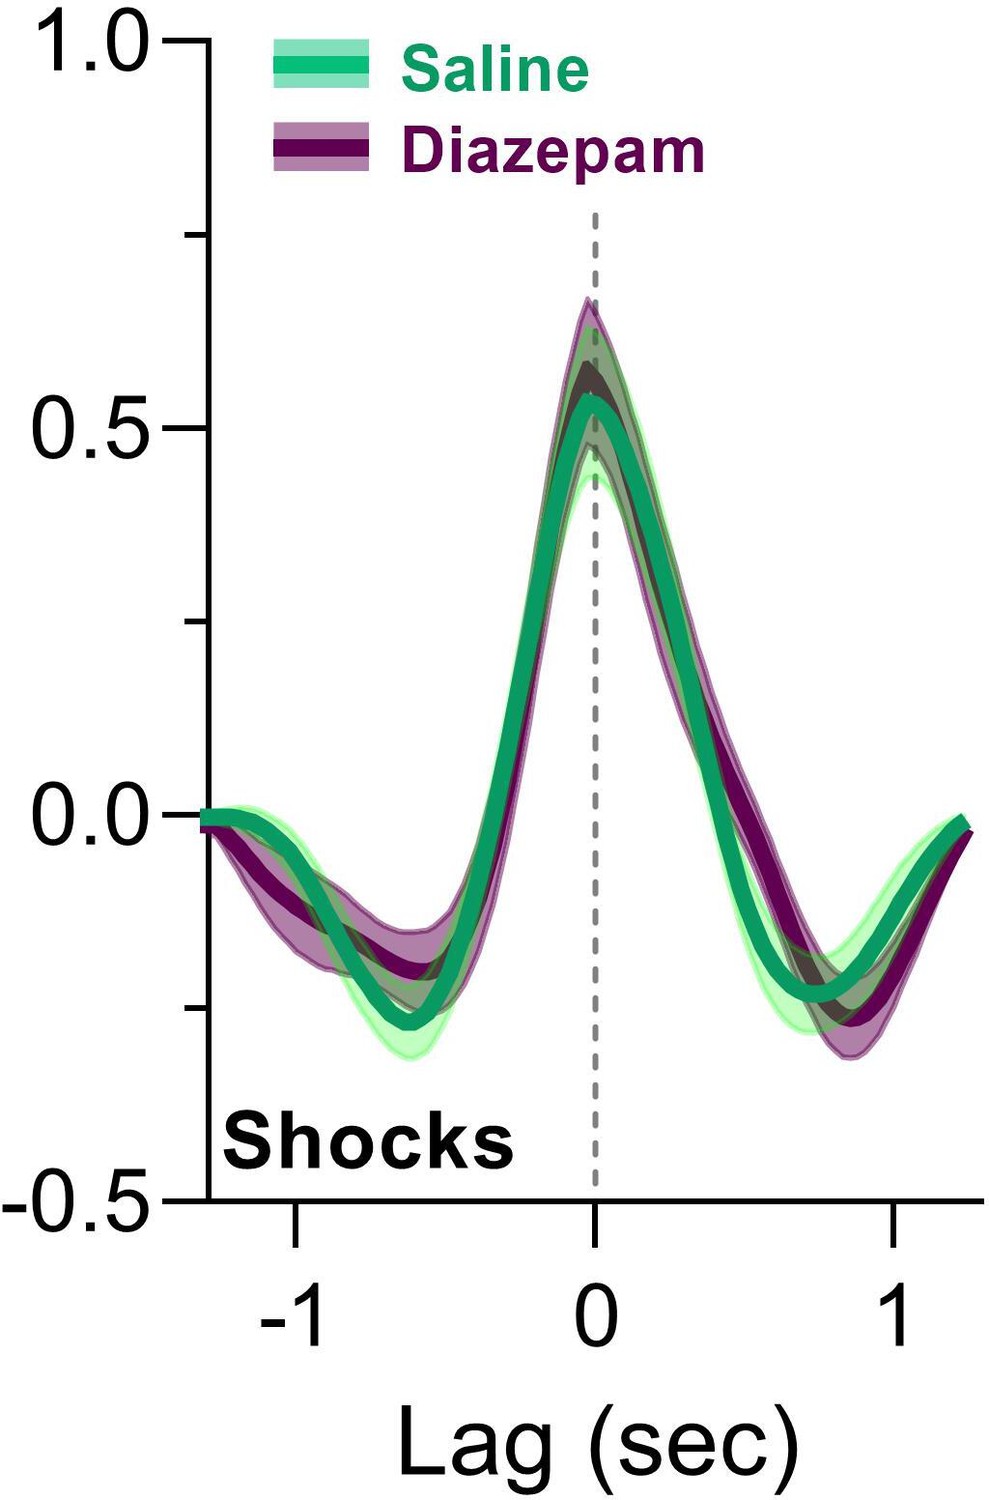
Cross-correlation results for dorsomedial prefrontal cortex (dmPFC)-ventral tegmental area (VTA) correlated activity for punished (footshock) trials after saline (green) or diazepam (magenta) pretreatment.
Data are presented as mean (trace) ± SEM (shaded region).
Tables
Table 1
Statistical results for behavior and correlation/cross-correlation analyses.
| RelevantFigure(s) | Test | Factor(s): F(dfn,dfd) | p-value | Post-hoc tests (Bonferroni corrected) |
|---|---|---|---|---|
| 1C-right and S1-2A | Two-way RM ANOVA (greenhouse-geisser corrected) | Risk: F(1,7)=13.6 Session F(1.5,10.2)=5.12 Risk*Session: F(1,5,10.2)=5.12 | 0.008 0.037 0.038 | No risk trial completion not compared; all subjects completed 100% Wilcoxon(1 vs 2): W=-28,P=.032,two-tailed paired t(2 vs 3): t(8)=0.41,P>.69, two-tailed |
| 1D-right and S1-2B | Two-way RM ANOVA (greenhouse-geisser corrected) | Risk: F(1,7)=20.3 Session: F(1.5,10.2)=3.5 Risk*Session: F(1,5,10.2)=2.8 | 0.003 0.07 0.11 | None, significant effect had only 2 levels- Risk blocks >No Risk |
| 1E-right and S1-2C | Two-way RM ANOVA (greenhouse-geisser corrected) | Risk: F(1,7)=1.35 Session: F(1.97,13.8)=2.85 Risk*Session: F(1.1,7.7)=4.31 | 0.28 0.09 0.07 | None |
| 3A | One-way mixed effects | Training day: F(3,23)=15.4 | <0.001 | Bonferroni test (1 vs 2): t=3.7, P=.0038, two-tailed Wilcoxon (1 vs 3): W=36, P=.024, two-tailed Wilcoxon (1 vs 4): W=36, P=.024, two-tailed |
| 3B | One-way mixed effects | Training day: F(3,23)=10.0 | 0.0002 | Bonferroni test (1 vs 2): t=3.8, P=.003, two-tailed Bonferroni test (1 vs 3): t=4.7, P=.0003, two-tailed Bonferroni test (1 vs 4): t=4.6, P=.0004, two-tailed |
| 3C | One-way mixed effects | Training day: F(3,23)=6.58 | 0.002 | Wilcoxon (1 vs 2): W=-31, P=.21, two-tailed Wilcoxon (1 vs 3): W=-45, P=.012, two-tailed Wilcoxon (1 vs 4): W=-36, P=.024, two-tailed |
| 3E | One-way mixed effects | Training day: F(3,22)=3.2 | 0.044 | Bonferroni test (1 vs 2): t=2.2, P=.11, two-tailed Bonferroni test (1 vs 3): t=2.2, P=.12, two-tailed Bonferroni test (1 vs 4): t=2.9, P=.03, two-tailed |
| 3F | One-way mixed effects | Training day: F(3,22)=3.2 | 0.045 | Bonferroni test (1 vs 2): t=0.3, P=.99, two-tailed Bonferroni test (1 vs 3): t=2.1, P=.16, two-tailed Bonferroni test (1 vs 4): t=2.55, P=.05, two-tailed |
| 3H | One-way mixed effects | Training day: F(3,7)=.12 | 0.94 | |
| 3I | One-way mixed effects | Training day: F(3,7)=4.74 | 0.041 | Bonferroni test (1 vs 2): t=1.24, P=.76, two-tailed Bonferroni test (1 vs 3): t=2.89, P=.07, two-tailed Bonferroni test (1 vs 4): t=3.25, P=.042, two-tailed |
| 3-S1A | RM one-way ANOVA (greenhouse-geisser corrected) | Trial number: F(1.9,15.1)=2.24 | 0.14 | |
| 3-S1D | RM one-way ANOVA (greenhouse-geisser corrected) | Trial number: F(1.4,3.4)=1.4 | 0.31 | |
| 5A-right, S5-1A | Two-way RM ANOVA (greenhouse-geisser corrected) | Risk: F(1,6)=1 Session: F(1,6)=1 Risk*Session: F(1,6)=1 | 0.36 0.36 0.36 | None |
| 5B-right, S5-1B | Two-way RM ANOVA (greenhouse-geisser corrected) | Risk: F(1,6)=1.4 Session: F(1,6)=1.3 Risk*Session: F(1,6)=6.65 | 0.28 0.29 0.041 | Wilcoxon (no risk saline vs. no risk diazepam): W=22, p=0.08 (one-tailed) Wilcoxon (risk saline vs. risk diazepam): W=–24, p=0.047 (one-tailed) |
| 5C-right, S5-1C | Two-way RM ANOVA (greenhouse-geisser corrected) | Risk: F(1,6)=19.15 Session: F(1,6)=6.5 Risk*Session: F(1,6)=4.8 | 0.004 0.04 0.07 | For risk: Only two levels – no risk>risk For session: Only two levels – diazepam>saline |
| 7-S2/3A | Two-way ordinary ANOVA (dmPFC cue) | Risk: F(2,94)=2.4 Session: F(4,94)=0.65 Risk*Session: F(8,94)=0.98 | 0.10 0.65 0.46 | |
| 7-S2/3B | Two-way ordinary ANOVA (dmPFC action) | Risk F(2,94)=7.4 Session F(4,94)=0.91 Risk*Session F(8,94)=0.51 | 0.001 0.46 0.85 | Bonferroni test (0% vs. 6%): t=2.2, p=0.03, one-tailed Bonferroni test (0% vs. 10%): t=3.8, p=0.00025, one-tailed |
| 7-S2/3C | Two-way ordinary ANOVA (dmPFC reward) | Risk: F(2,93)=9.18 Session: F(4,93)=1.77 Risk*Session: F(8,93)=0.54 | <0.001 0.14 0.83 | Bonferroni test (0% vs. 6%): t=0.32, p=0.99, two-tailed Bonferroni test (0% vs. 10%): t=3.9, p≤0.001, two-tailed |
| 7-S2/3D | Two-way ordinary ANOVA (dmPFC footshock) | Shock: F(1,68)=78.7 Session: F(4,68)=1.46 Shock*Session: F(4,68)=0.81 | <0.001 0.23 0.52 | None required: Shock >No shock |
| 7-S2/3E | Two-way ordinary ANOVA (VTA cue) | Risk: F(2,42)=14.8 Session: F(4,42)=1.52 Risk*Session: F(8,42)=2.06 | <0.001 0.21 0.06 | Bonferroni test (0% vs. 6%): t=.32, p=0.99, two-tailed Bonferroni test (0% vs. 10%): t=4.9, p≤0.001, two-tailed |
| 7-S2F | Two-way ordinary ANOVA (VTA action change) | Risk: F(2,42)=10.5 Session: F(4,42)=6.1 Risk*Session: F(8,42)=2.43 | <0.001 <0.001 0.03 | Risk: Bonferroni test (0% vs. 6%): t=0.32, p=0.99, two-tailed Bonferroni test (0% vs. 10%): t=4.2, p=0.0003, two-tailed Session (via Bonferroni tests): All sessions greater than Session 1 (p-values <0.007), except for diazepam (p=0.11) Interaction (via Bonferroni tests): No differences between sessions at 0% or 6% risk (p-values >0.10). At 10% risk Sessions 2 and 3 greater than Session 1 (p-values <0.023). Saline and diazepam not different from Session 1 (p-values >0.13). |
| 7-S3F | Two-way ordinary ANOVA (VTA action sum) | Risk: F(2,40)=1.67 Session: F(4,40)=5.87 Risk*Session: F(8,40)=2.40 | 0.20 <0.001 0.03 | Session (via Bonferroni tests): Diazepam greater than Session 1 (p=0.0003), all other session not significantly different (p-values >0.07) Interaction (via Bonferroni tests): 0% risk Diazepam greater than Session 1 (p=0.004), other sessions not significant (p-values = 0.99). 6% risk Diazepam greater than Session 1 (p=0.002), other sessions not significant (p-values >0.22). 10% risk all sessions same as session 1 (p-values >0.18). |
| 7-S2/3G | Two-way ordinary ANOVA (VTA reward) | Risk: F(2,42)=3.47 Session: F(4,42)=3.12 Risk*Session: F(8,42)=0.69 | 0.04 0.025 0.69 | Risk: Bonferroni test (0% vs. 6%): t=1.4, p=0.34, two-tailed Bonferroni test (0% vs. 10%): t=2.63, p=0.024, two-tailed Session (via Bonferroni tests – two tail): Session 3 greater than session 1 (p=0.049), all other sessions not significant (p-values >0.68). |
| 7-S2/3H | Two-way ordinary ANOVA (VTA footshock) | Shock: F(1,30)=36.9 Session: F(4,30)=1.55 Shock*Session: F(4,30)=0.28 | <0.001 0.21 0.89 | None required: Shock > No shock |
| 8D | Two-way ordinary ANOVA | Session: F(1,596)=27.66 Risk block: F(2,596)=21.85 Risk*Session: F(2,596)=7.902 | <0.0001 <0.0001 0.0004 | Saline vs. diazepam (Bonferroni test – two tail): 0% risk: p≤0.001 6% risk: p≤0.001 10% risk: p=0.99 |
| 8G | Two-way ordinary ANOVA | Session: F(1,596)=82.63 Risk block: F(2,596)=14.55 Risk*Session: F(2,596)=9.124 | <0.0001 <0.0001 0.0001 | Saline vs. diazepam (Bonferroni test – two tail): 0% risk: p≤0.001 6% risk: p≤0.001 10% risk: p=0.238 |
| Relevant Figure(s) | Test | Pearson r | p-value (cue) | p-value (action/reward) |
| S2-4C | Pearson correlation | Cue-absolute r values <0.26 Action/reward- absolute r values >0.56 | p-values >0.09 | Action/reward – p-values <0.001 |
| S2-4D | Pearson correlation | Cue-absolute r values <0.08 Action/reward- absolute r values >0.72 | p-values >0.63 | Action/reward – p-values <0.001 |
Appendix 1—key resources table
| Reagent type (species) or resource | Designation | Source or reference | Identifiers | Additional information |
|---|---|---|---|---|
| Recombinant DNA reagent | AAV8 GCaMP6s-P2a-tdTomato | OHSU Vector Core | ||
| Chemical compound, drug | Diazepam | Hospira | Product number: 00409-1273-32 | |
| Other | Photometry Recording system | Neurophotometrics | Model FP3001 | Recording system for fiber photometry |
| Other | Optical fibers and patchcords | Doric | Diameter: 400 µm; NA: 0.37; fiber length: 4–8.5 mm | Fibers used for implantation in brain and patchcords for light delivery/detection |
| Other | Arduino | Arduino | Arduino Uno | Microcomputer to interface TTL signals with bonsai |
| Antibody | Anti-GFP (rabbit polyclonal) | Abcam | Catalogue# 6556 | Dilution: 1:500 |
| Antibody | Alexa488 (goat anti rabbit) | Abcam | Catalogue# 150081 | Dilution 1:2000 |
| Software, algorithm | Coulbourn Instruments | Harvard Apparatus | ||
| Software, algorithm | Bonsai | Lopes et al., 2015 | ||
| Software, algorithm | GraphPad Prism | GraphPad | ||
| Software, algorithm | Zeiss Zen Blue | Carl Zeiss | ||
| Software, algorithm | R, Rstudio | R Project for statistical computing | ||
| Software, algorithm | Python | Anaconda | Version 3.7 |
Additional files
Download links
A two-part list of links to download the article, or parts of the article, in various formats.
Downloads (link to download the article as PDF)
Open citations (links to open the citations from this article in various online reference manager services)
Cite this article (links to download the citations from this article in formats compatible with various reference manager tools)
Learning of probabilistic punishment as a model of anxiety produces changes in action but not punisher encoding in the dmPFC and VTA
eLife 11:e78912.
https://doi.org/10.7554/eLife.78912


