Tissue-specific mitochondrial HIGD1C promotes oxygen sensitivity in carotid body chemoreceptors
- Department of Neurology, University of Miami, United States
- Department of Physiology and Cardiovascular Research Institute, University of California, San Francisco, United States
- Department of Physiology and Pharmacology, University of Calgary, Canada
- Hotchkiss Brain Institute, University of Calgary, Canada
- Alberta Children's Hospital Research Institute, University of Calgary, Canada
- Department of Surgery, University of California, San Francisco, United States
- Diabetes Center, University of California, San Francisco, United States
Figures
Figure 1 with 5 supplements
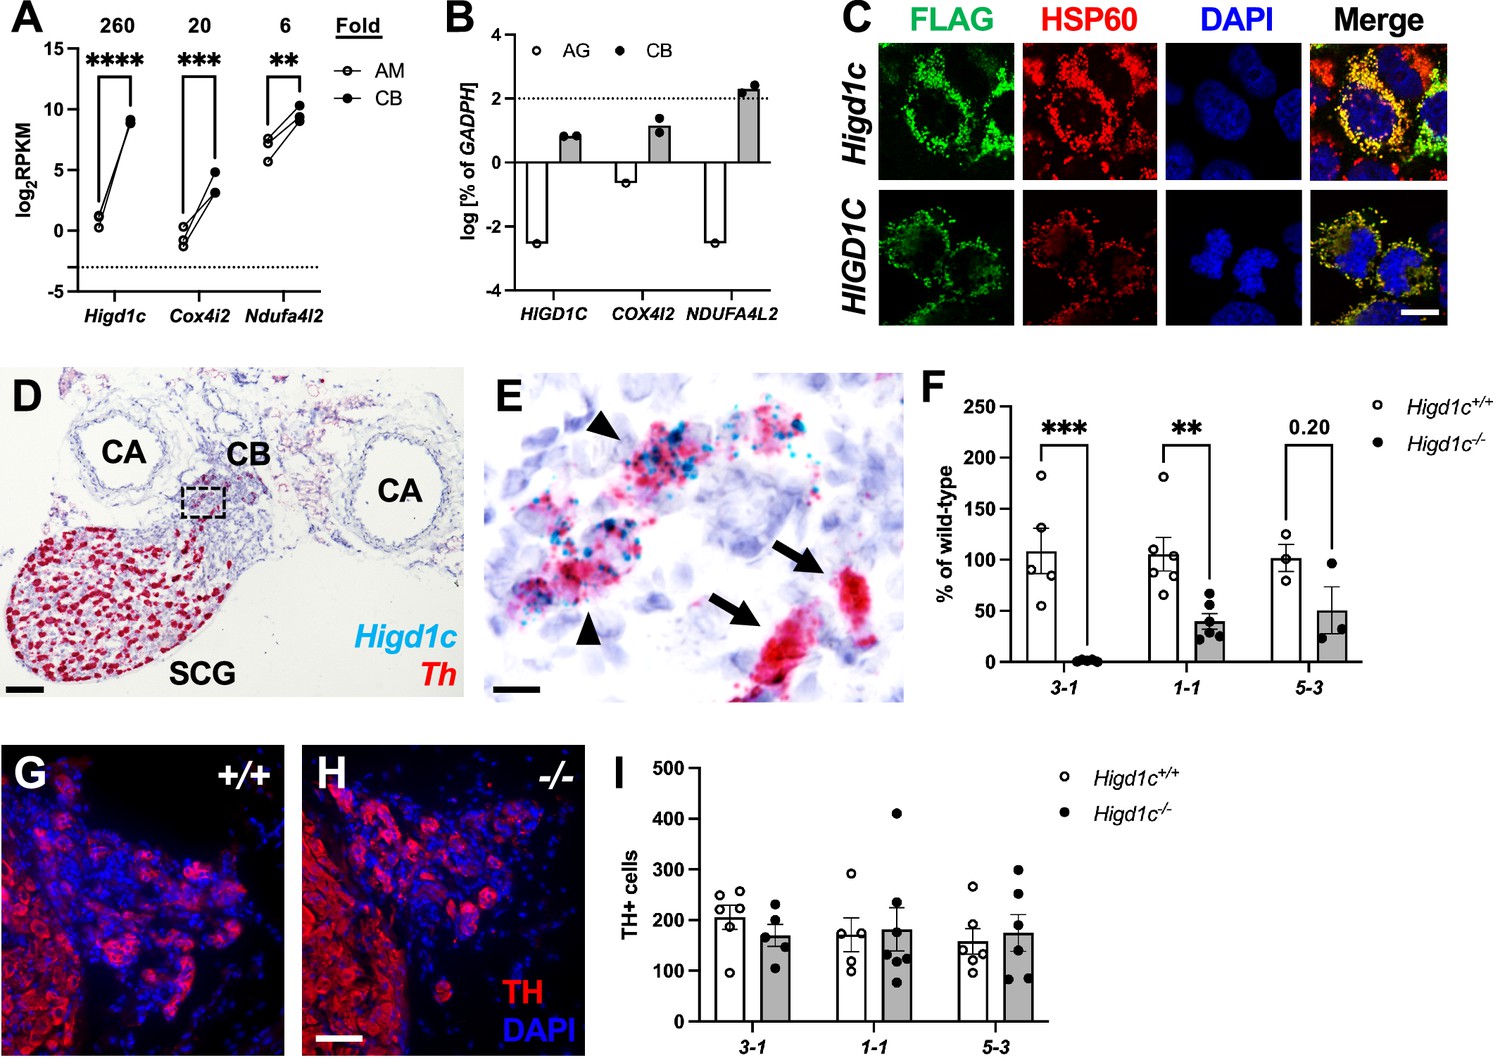
Higd1c expression in carotid body glomus cells is reduced in Higd1c CRISPR mutants.
(A) Expression of genes encoding atypical mitochondrial electron transport chain (ETC) subunits in mouse carotid body (CB) versus adrenal medulla (AM) (Chang et al., 2015). RPKM, reads per kilobase of transcript, per million reads mapped. n = 3 cohorts of 10 animals each. Data as mean ± SEM. **p<0.01, ***p<0.001, ****p<0.0001 by two-way ANOVA with Sidak correction. (B) Expression of atypical ETC proteins in human CB and adrenal gland (AG). AG, one RNA sample of adrenal glands pooled from 62 individuals. CB, two RNA samples of CBs from two adults. Dotted line, 100% of GAPDH expression. Data as mean. (C) FLAG-tagged mouse and human HIGD1C (green) overexpressed in HEK293T cells co-localized with the mitochondrial marker HSP60 (red) by immunostaining. DAPI, nuclear marker. Scale bar, 10 µm. (D, E) BaseScope in situ hybridization of a wild-type C57BL/6J carotid bifurcation. (E) Boxed region from (D). SCG, superior cervical ganglion; CA, carotid arteries. Arrowheads, glomus cells. Arrows, SCG neurons. Scale bar, 100 µm (D), 10 µm (E). (F) Expression of Higd1c mRNA is reduced in CBs from Higd1c mutants measured by RT-qPCR. n = 3–6 samples. Each sample was prepared from 4 CBs/2 animals. Data as mean ± SEM. **p<0.01 by two-way ANOVA with Sidak correction. (G, H) Immunostaining of CB glomus cells. TH, tyrosine hydroxylase. DAPI, nuclear marker. Scale bar, 50 µm. (I) Quantitation of TH+ cells found no significant differences between CBs from Higd1c+/+ and Higd1c-/- animals of each allele or between alleles by two-way ANOVA with Sidak correction (p>0.05). n = 5–7 CBs from 3-7 animals. Data as mean ± SEM.
-
Figure 1—source data 1
Source data for Figure 1A, B, F, and I.
- https://cdn.elifesciences.org/articles/78915/elife-78915-fig1-data1-v3.zip
Figure 1—figure supplement 1
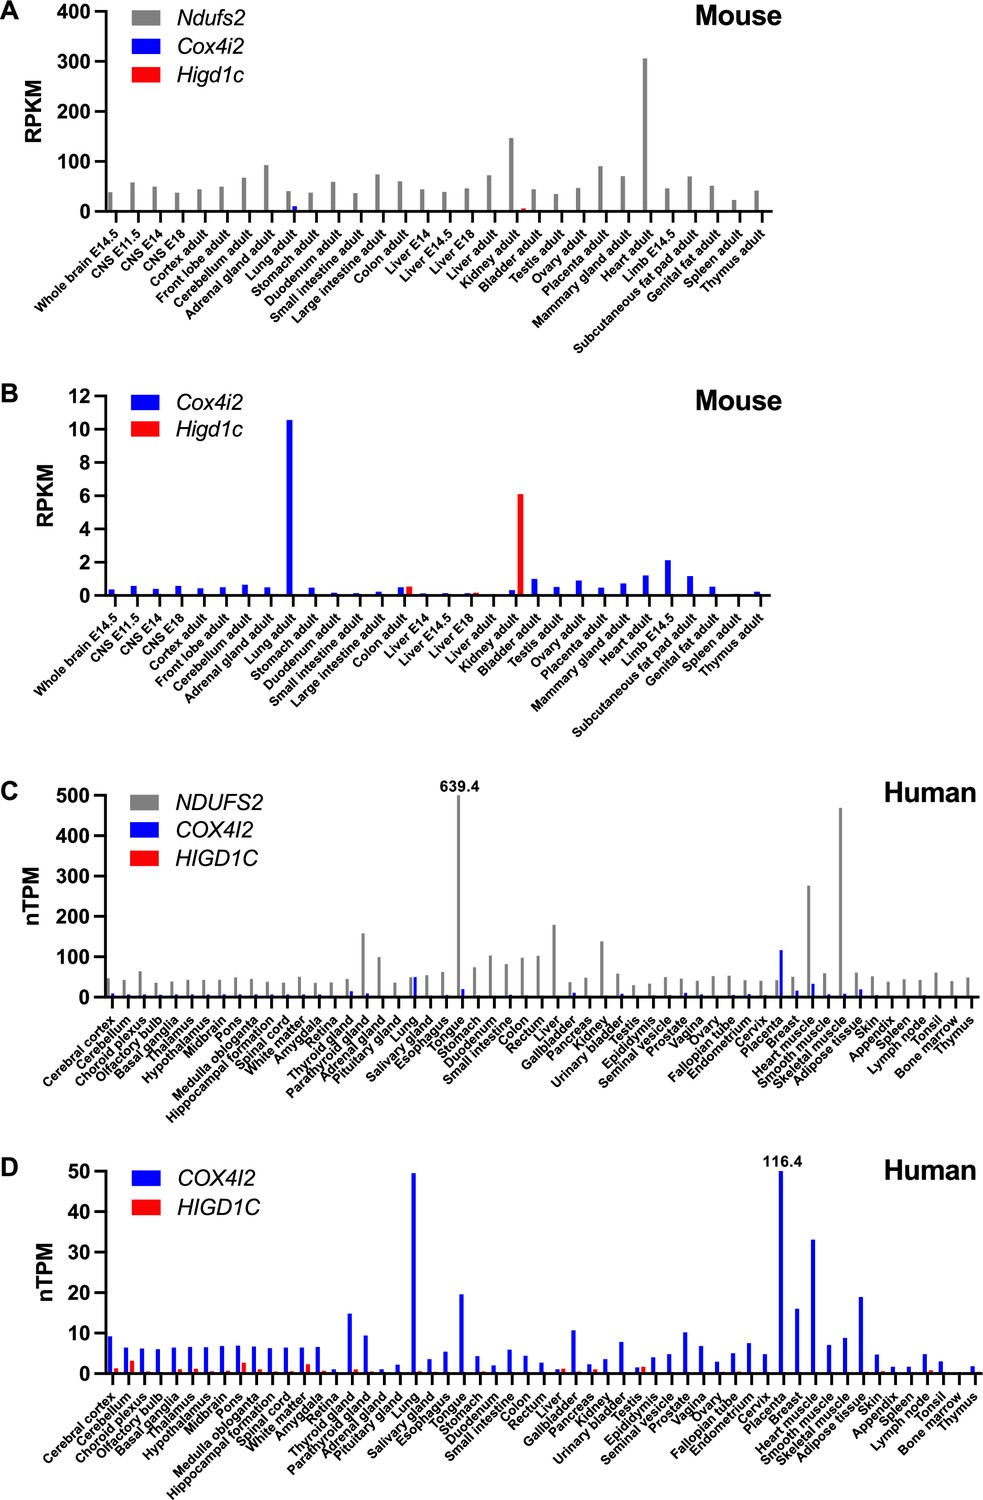
Tissue expression of genes encoding select mitochondrial proteins implicated in carotid body oxygen sensing.
(A, B) Expression of Ndufs2, Cox4i2, and Higd1c in mouse tissues at different developmental stages by RNAseq from the Mouse ENCODE project (Shen et al., 2012). RPKM, reads per kilobase of transcript, per million reads mapped. E, embryonic day. (C, D) Expression of NDUFS2, COX4I2, and HIGD1C in human tissues by RNAseq from the Human Protein Atlas (Uhlén et al., 2015). nTPM, normalized protein-coding transcripts per million. nTPM values that exceed the maximum on the y-axis are denoted above the bars.
-
Figure 1—figure supplement 1—source data 1
Source data for Figure 1—figure supplement 1.
- https://cdn.elifesciences.org/articles/78915/elife-78915-fig1-figsupp1-data1-v3.zip
Figure 1—figure supplement 2
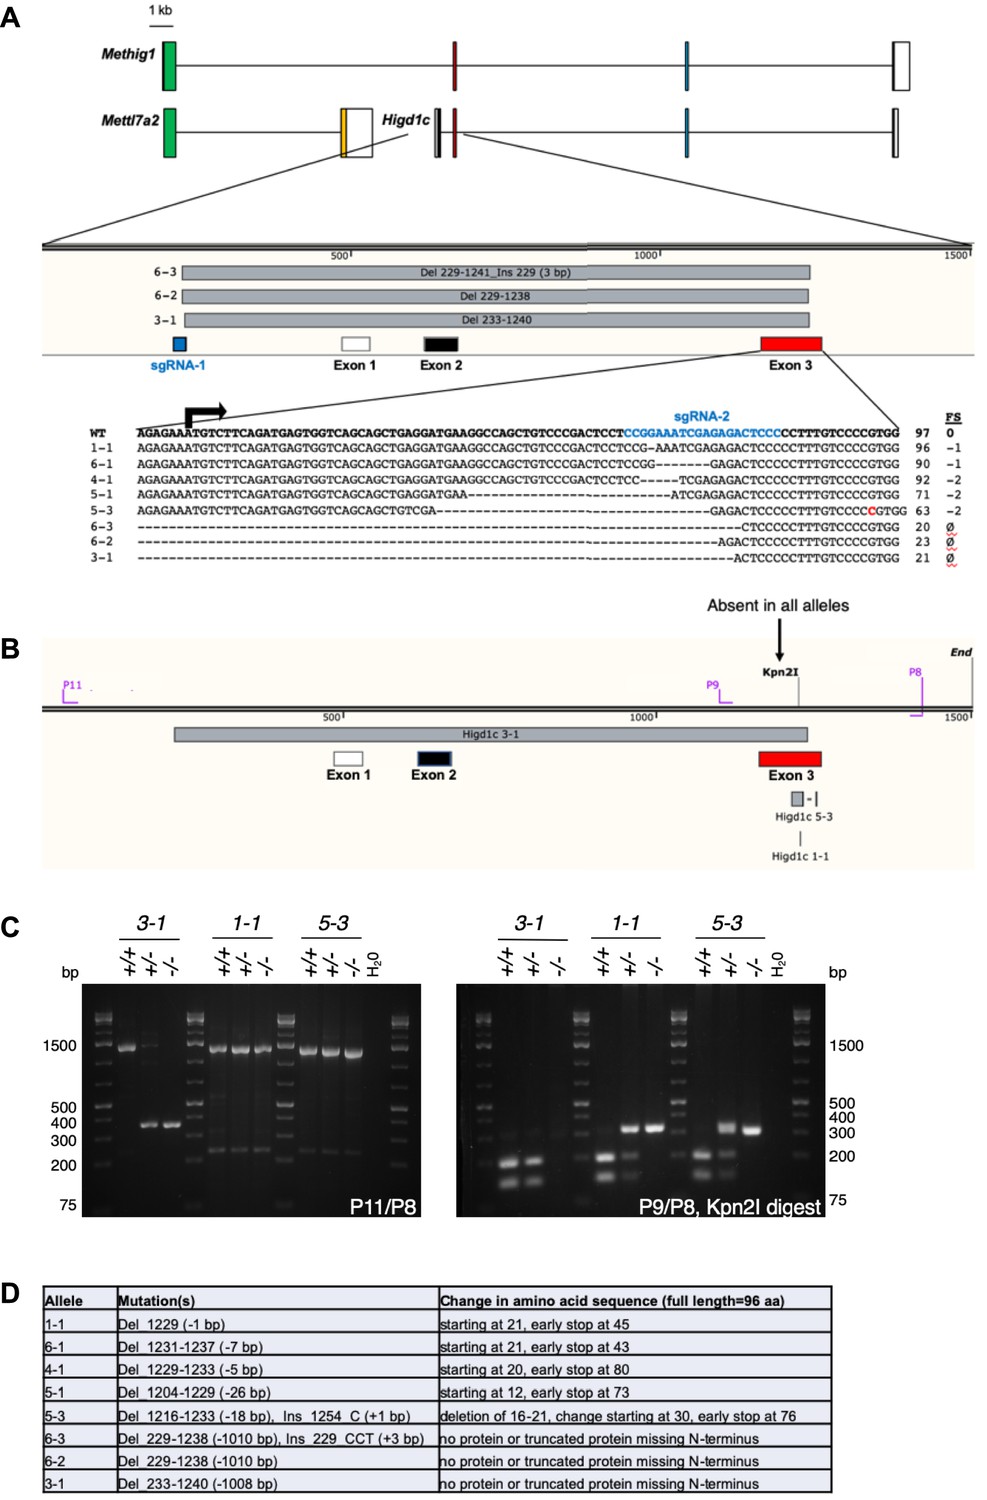
Generation of Higd1c CRISPR/Cas9 mutants.
(A) Schematic representation of mRNA transcripts of Higd1c and Mettl7a2 and a fusion transcript spanning both genes named Methig1. Boxes denote exons. Arrow, Higd1c translational start site. Two sgRNAs targeting sequences upstream of exon 1 and within exon 3 (first coding exon) of Higd1c were injected together with Cas9 mRNA into C57BL/6J embryos. Six founders were generated, from which eight alleles were identified by sequencing around the sgRNA target sites. Mutant alleles isolated included short indels around the sgRNA target sequence in exon 3 and deletions that spanned the regions between the two guides. FS, frameshift mutation. ø, no transcript or truncated transcript starting in exon 4. (B) Genotyping primers for large deletion and small indel Higd1c alleles. All mapped mutations abolish a restriction site for Kpn2I in exon 3. (C) PCR with P11/P8 primer pair used to genotype the large deletion Higd1c 3-1 allele. PCR with P9/P8 primer pair followed by restriction digest with Kpn2I used to genotype small indels in exon 3. (D) Expected changes to the amino acid sequence of HIGD1C in mutant alleles.
-
Figure 1—figure supplement 2—source data 1
Source gels for Figure 1—figure supplement 2C.
- https://cdn.elifesciences.org/articles/78915/elife-78915-fig1-figsupp2-data1-v3.zip
Figure 1—figure supplement 3
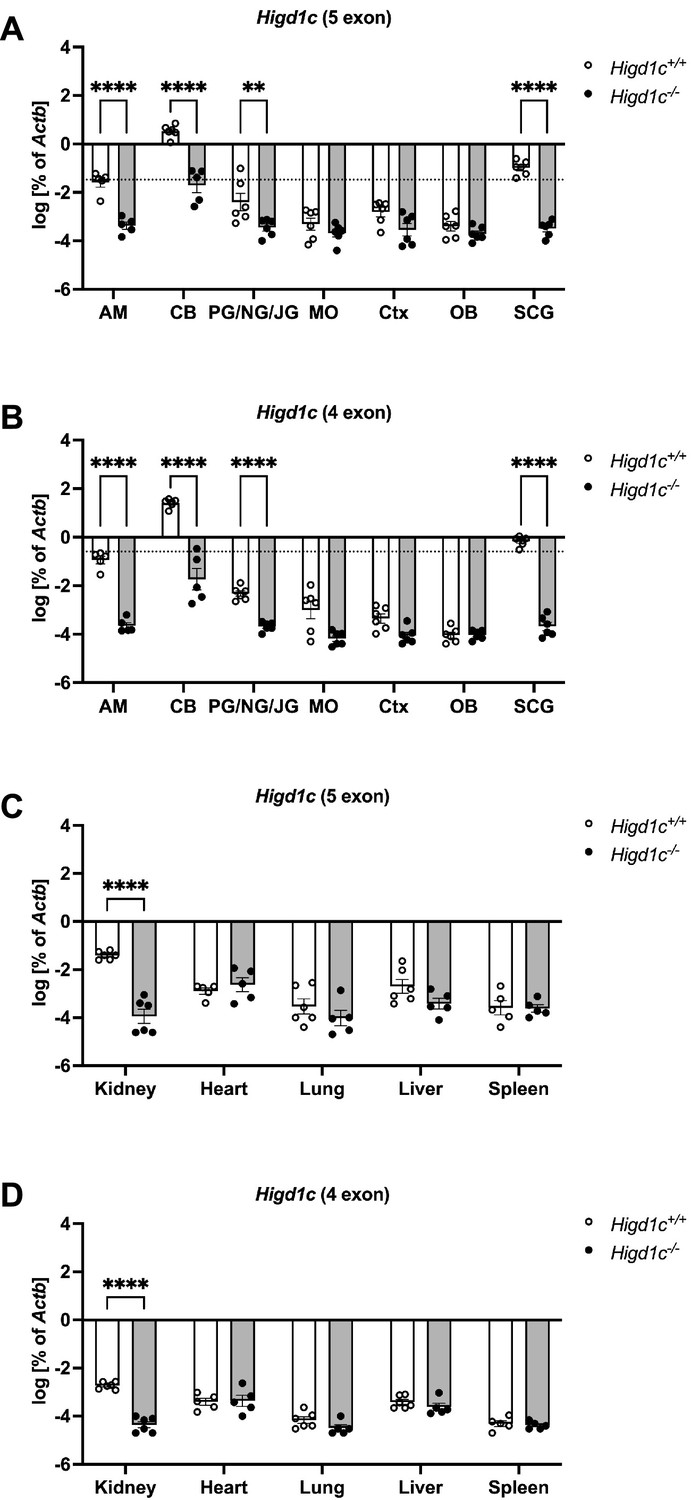
Expression of Higd1c in mouse tissues.
(A–D) RT-qPCR targeting Higd1c mRNA transcripts containing five exons (A, C) or four exons (B, D) in tissues from Higd1c 3-1+/+ and Higd1c 3-1-/- animals. These mRNA isoforms differ from each other only in the first two exons that encode 5′ UTR; the four-exon isoform does not contain exon 2 (Figure 1—figure supplement 2A). Higd1c expression normalized to Actb encoding -actin by template and day of the experiment. Dotted line, 1% of the carotid body (CB) expression level. AM, adrenal medulla; PG/NG/JG, petrosal ganglion/nodose ganglion/jugular ganglion; MO, medulla oblongata; Ctx, cerebral cortex; OB, olfactory bulb; SCG, superior cervical ganglion. For CB, n = 6/12 (Higd1c 3-1+/+) and 5/10 (Higd1c 3-1-/-) samples/animals with four CBs from two animals pooled per sample (A, B). For all others, n = 5/5 or 6/6 samples/animals (A–D). Data as mean and SEM. ****p<0.0001 by two-way ANOVA with Sidak correction. Because Actb expression can vary between tissues, we used Higd1c 3-1-/- tissues carrying a deletion that abolishes one primer target site as a negative control for Higd1c expression.
-
Figure 1—figure supplement 3—source data 1
Source data for Figure 1—figure supplement 3.
- https://cdn.elifesciences.org/articles/78915/elife-78915-fig1-figsupp3-data1-v3.zip
Figure 1—figure supplement 4
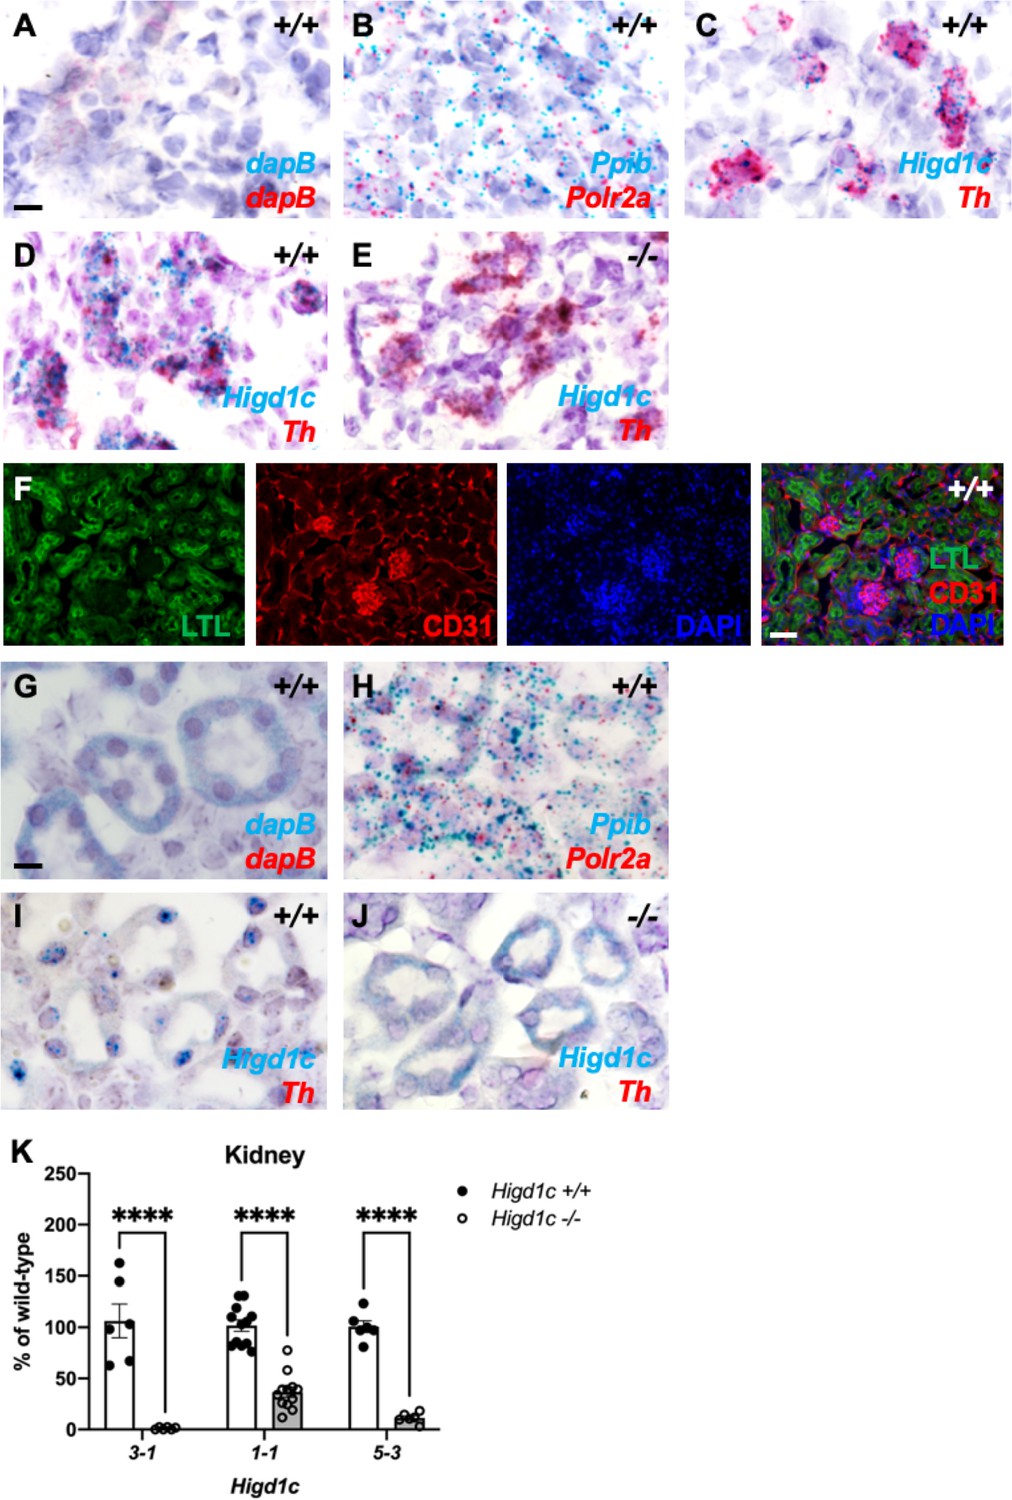
Higd1c is expressed in carotid body glomus cells and kidney proximal tubules.
(A–E) BaseScope in situ hybridization to detect mRNA transcripts in adjacent sections of the carotid bifurcation from a Higd1c 5-3+/+ animal (A–C) and from Higd1c 3-1+/+ (D) and Higd1c 3-1-/- (E) animals. dapB probes are negative controls that target bacterial genes (A). Ppib and Polr2a are positive control probes for mouse transcripts expressed ubiquitously (B). Probes that target transcripts for Higd1c and tyrosine hydroxylase (Th), a marker of glomus cells (C–E). The large deletion in the Higd1c 3-1 allele removes the target sequence of BaseScope probes for Higd1c (E). Scale bar, 10 µm. (F) Staining of the kidney from a wild-type C57BL/6J (B6) animal with fluorescein-conjugated Lotus tetragonolobus lectin (LTL) that binds to the apical surface of proximal tubules and an antibody for CD31, a marker of endothelial cells. DAPI, nuclear marker. Scale bar, 50 µm. (G–J) BaseScope in situ hybridization to detect mRNA transcripts in sections of the kidney from a wild-type C57BL/6J (B6) animal (G–I) and from a Higd1c 3-1-/- mutant (J). dapB probes are negative controls that target bacterial genes (G). Ppib and Polr2a are positive control probes for mouse transcripts expressed ubiquitously (H). Probes that target transcripts for Higd1c and tyrosine hydroxylase (Th), a marker of glomus cells (I, J). The large deletion in the Higd1c 301 allele removes the target sequence of BaseScope probes for Higd1c (J). Scale bar, 10 µm. (K) Expression of Higd1c mRNA is reduced in kidneys from Higd1c mutants as measured by qRT-PCR. The target region of one primer of the primer pair is deleted in the Higd1c 3-1 allele. n = 6 (3-1, 5-3), 12 (1-1) kidneys from 6 and 12 animals, respectively. Data as mean ± SEM. ****p<0.0001 by two-way ANOVA with Sidak correction.
-
Figure 1—figure supplement 4—source data 1
Source data for Figure 1—figure supplement 4K.
- https://cdn.elifesciences.org/articles/78915/elife-78915-fig1-figsupp4-data1-v3.zip
Figure 1—figure supplement 5
Cellular and tissue expression of Higd1c in rodents and human.
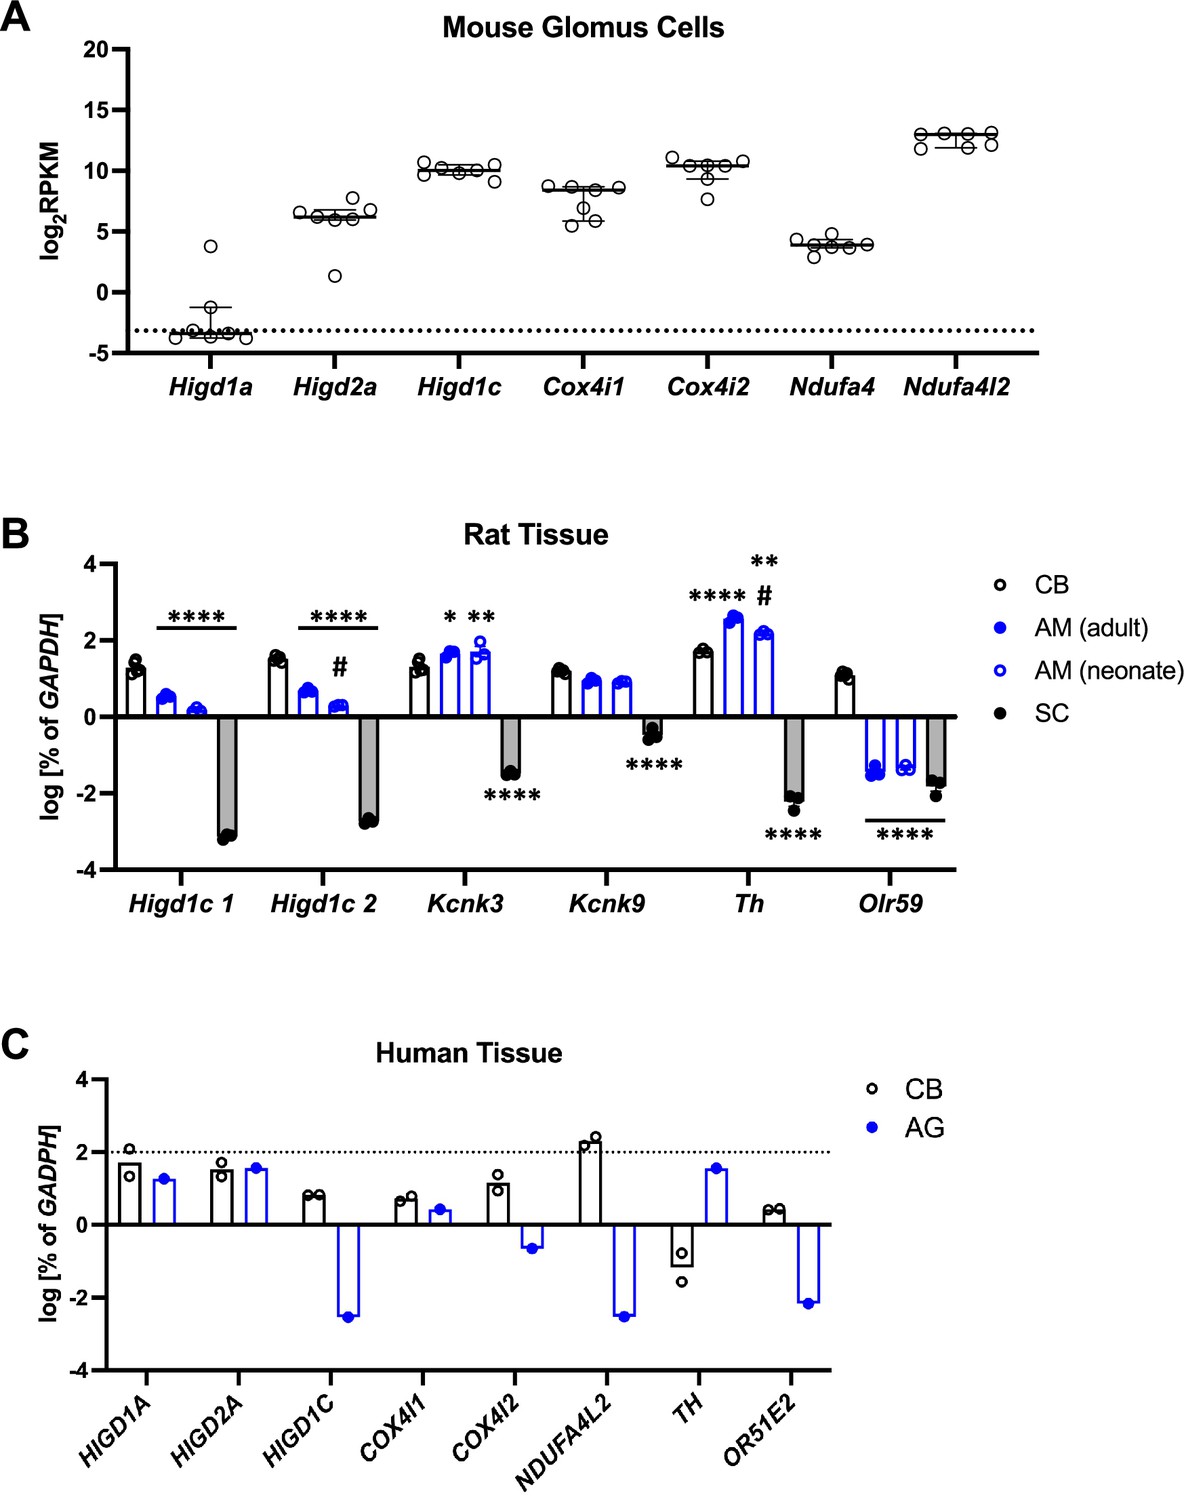
(A) Expression of select mitochondrial electron transport chain (ETC) subunits by single-cell RNAseq of seven mouse glomus cells from a previously published dataset (Zhou et al., 2016). Glomus cell 4 from this study was excluded from analysis because it had little to no expression of genes known to be expressed at high levels in mouse glomus cells, such as Olfr78, Epas1, Cox4i2, and Ndufa4l2 (Chang et al., 2015; Moreno-Domínguez et al., 2020). RPKM, reads per kilobase of transcript, per million reads mapped. Data as median and interquartile interval. Dotted line, RPKM level corresponding to no reads. (B) Expression in total RNA from rat tissues by RT-qPCR of genes known to be expressed in the carotid body (CB). Two primer sets were used to detect Higd1c mRNA (1 = F1/R1, 2 = F1/R2). Kcnk3 and Kcnk9 encode TASK-1 and TASK-3 K+ channels expressed in the CB and adrenal medulla. Olfr59 is the rat ortholog of mouse Olfr78. n = 3 (CB-Th), 5 (CB-all other genes), 3 (all other tissues). Data as mean ± SEM. *p<0.05, **p<0.01, ***p<0.001, ****p<0.0001 vs. CB and #p<0.05 between adult and neonatal adrenal medulla by two-way ANOVA with Tukey’s test. (C) Expression in total RNA from human tissues by RT-qPCR of select mitochondrial ETC subunits and other genes known to be expressed in the CB. Unlike its expression in mice, the tyrosine hydroxylase gene TH is expressed in only a subset of glomus cells in the adult human CB (Fagerlund et al., 2010; Otlyga et al., 2021). The olfactory receptor gene OR51E2 is the ortholog of mouse Olfr78, one of the most highly upregulated genes in the CB versus adrenal medulla in mice (Chang et al., 2015). AG, one RNA sample of adrenal glands pooled from 62 males and females, 15–61 years old. CB, two RNA samples of carotid bodies from two transplant donors: a 55-year-old man and a 35-year-old woman. Dotted line, 100% of GAPDH expression. Data as the mean.
-
Figure 1—figure supplement 5—source data 1
Source data for Figure 1—figure supplement 5.
- https://cdn.elifesciences.org/articles/78915/elife-78915-fig1-figsupp5-data1-v3.zip
Figure 2 with 2 supplements

Ventilatory responses of Higd1c mutants to hypoxia and hypercapnia.
(A–H) Respiratory rate (RR), tidal volume (TV), and minute ventilation (MV) (minute ventilation = respiratory rate × tidal volume) by whole-body plethysmography of unrestrained, unanesthetized Higd1c 1-1+/+ and Higd1c 1-1-/- animals exposed to hypoxia (A–D) or hypercapnia (E–H). (D) Hypoxic response as the percentage change in hypoxia (10% O2) versus control (21% O2). (H) Hypercapnic response as the percentage change in hypercapnia (5% CO2) versus control (0% CO2). n = 11 (+/+), 11 (-/-) animals. Data as mean ± SEM. *p<0.05, **p<0.01, ***p<0.001, ****p<0.0001 by two-way repeated-measures ANOVA with Sidak correction (A–C, E-G) or unpaired t-tests (D, H) with Holm–Sidak correction. Ventilatory parameters of Higd1c+/+ and Higd1c-/- animals in normal air conditions (21% O2 or 0% CO2) were not significantly different (p>0.05). For the hypoxic response (D), Cohen’s d = 1.24 (RR), 1.20 (TV), 2.13 (MV).
-
Figure 2—source data 1
Source data for Figure 2.
- https://cdn.elifesciences.org/articles/78915/elife-78915-fig2-data1-v3.zip
Figure 2—figure supplement 1
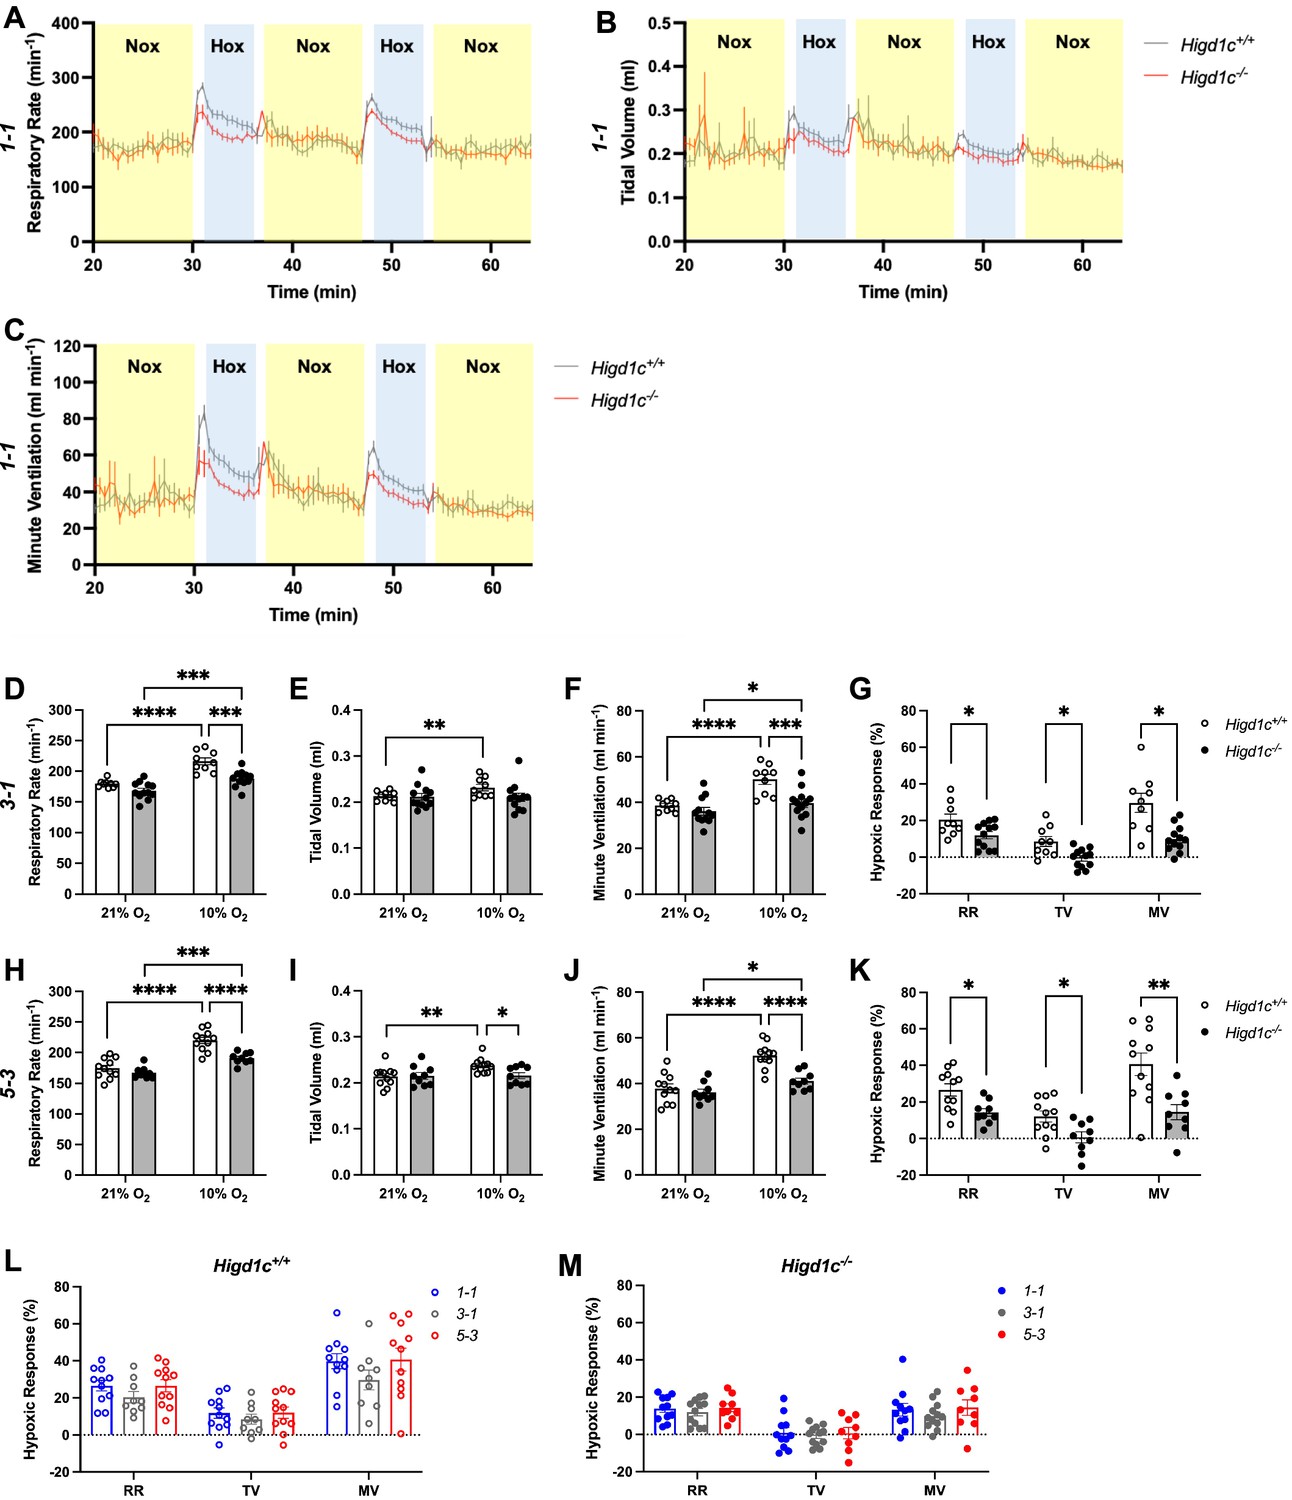
Ventilatory responses of Higd1c mutants to hypoxia.
Respiratory rate (RR), tidal volume (TV), and minute ventilation (MV) (minute ventilation = respiratory rate × tidal volume) by whole-body plethysmography of unrestrained, unanesthetized Higd1c+/+ and Higd1c-/- animals. (A–C) Time course of experiments on Higd1c 1-1 allele showing periods of normoxia (Nox, yellow) and hypoxia (Hox, blue). (D–K) Ventilation of Higd1c+/+ and Higd1c-/- animals of 3-1 (D–G) and 5-3 alleles (H–K) exposed to hypoxia. Hypoxic response as the percentage change in hypoxia (10% O2) versus control (21% O2) (G, K). Ventilatory parameters of Higd1c+/+ and Higd1c-/- animals in normal air conditions (21% O2) are not significantly different (p>0.05). *p<0.05, **p<0.01, ***p<0.001, ****p<0.0001 by two-way repeated-measures ANOVA with Sidak correction (D–F, H–J) or unpaired t-tests (G, K) with Holm–Sidak correction. (G) Cohen’s d = 1.06 (RR), 1.39 (TV), 1.70 (MV). (K) Cohen’s d = 1.47 (RR), 1.47 (TV), 1.68 (MV). (L, M) Comparison of the hypoxic response of all three alleles of Higd1c+/+ (L) and Higd1c-/- (M) animals. No significant differences were found for any parameter between the alleles by one-way ANOVA with Tukey’s test (p>0.05). (A–M) n = 11 (1-1+/+), 11 (1-1-/-), 9 (3-1+/+), 12 (3-1-/-), 11 (5-3+/+), 9 (5-3-/-) animals. Data as mean ± SEM.
-
Figure 2—figure supplement 1—source data 1
Source data for Figure 1—figure supplement 1.
- https://cdn.elifesciences.org/articles/78915/elife-78915-fig2-figsupp1-data1-v3.zip
Figure 2—figure supplement 2
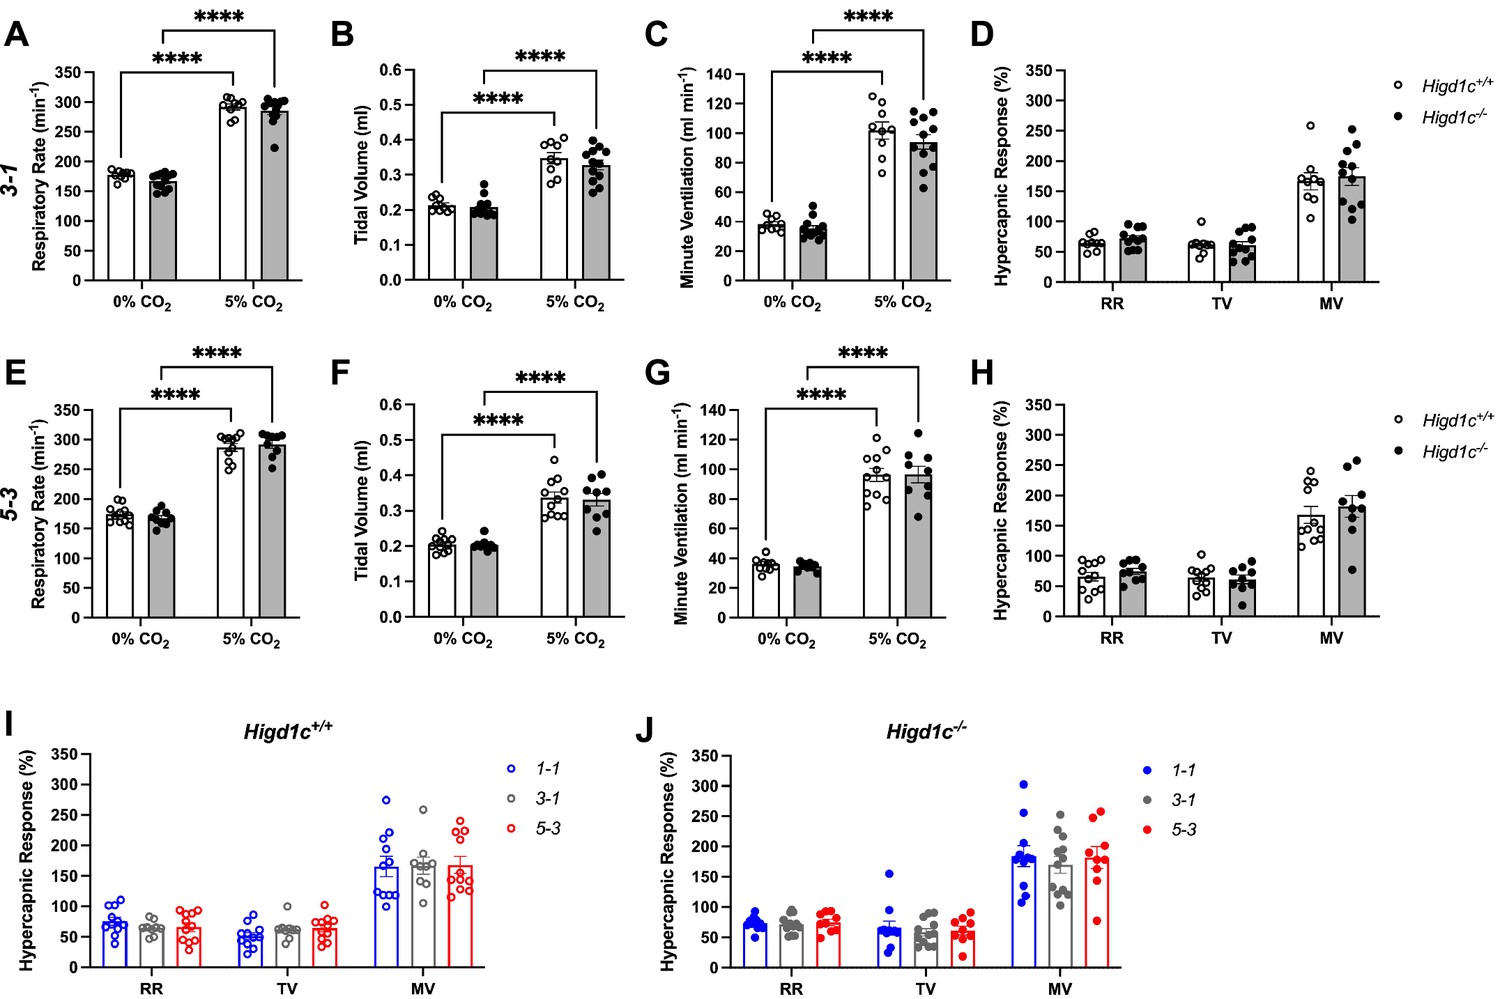
Ventilatory responses of Higd1c mutants to hypercapnia.
Respiratory rate (RR), tidal volume (TV), and minute ventilation (MV) (minute ventilation = respiratory rate × tidal volume) by whole-body plethysmography of unrestrained, unanesthetized Higd1c+/+ and Higd1c-/- animals. (A–H) Ventilation of Higd1c+/+ and Higd1c-/- animals of 3-1 (A–D) and 5-3 alleles (E–H) exposed to hypercapnia. Hypercapnic response as the percentage change in hypercapnia (5% CO2) versus control (0% CO2) (D, H). Ventilatory parameters in control and hypercapnia and hypercapnic responses of Higd1c+/+ and Higd1c-/- animals were not significantly different (p>0.05). ****p<0.0001 by two-way repeated-measures ANOVA with Sidak correction (A–C, E–G) or unpaired t-tests (D, H) with Holm–Sidak correction. (I, J) Comparison of the hypercapnic response of all three alleles of Higd1c+/+ (I) and Higd1c-/- (J) animals. No significant differences were found for any parameter between the alleles by one-way ANOVA with Tukey’s test (p>0.05). (A–J) n = 11 (1-1+/+), 11 (1-1-/-), 9 (3-1+/+), 12 (3-1-/-), 11 (5-3+/+), 9 (5-3-/-) animals. Data as mean ± SEM.
-
Figure 2—figure supplement 2—source data 1
Source data for Figure 1—figure supplement 2.
- https://cdn.elifesciences.org/articles/78915/elife-78915-fig2-figsupp2-data1-v3.zip
Figure 3 with 1 supplement
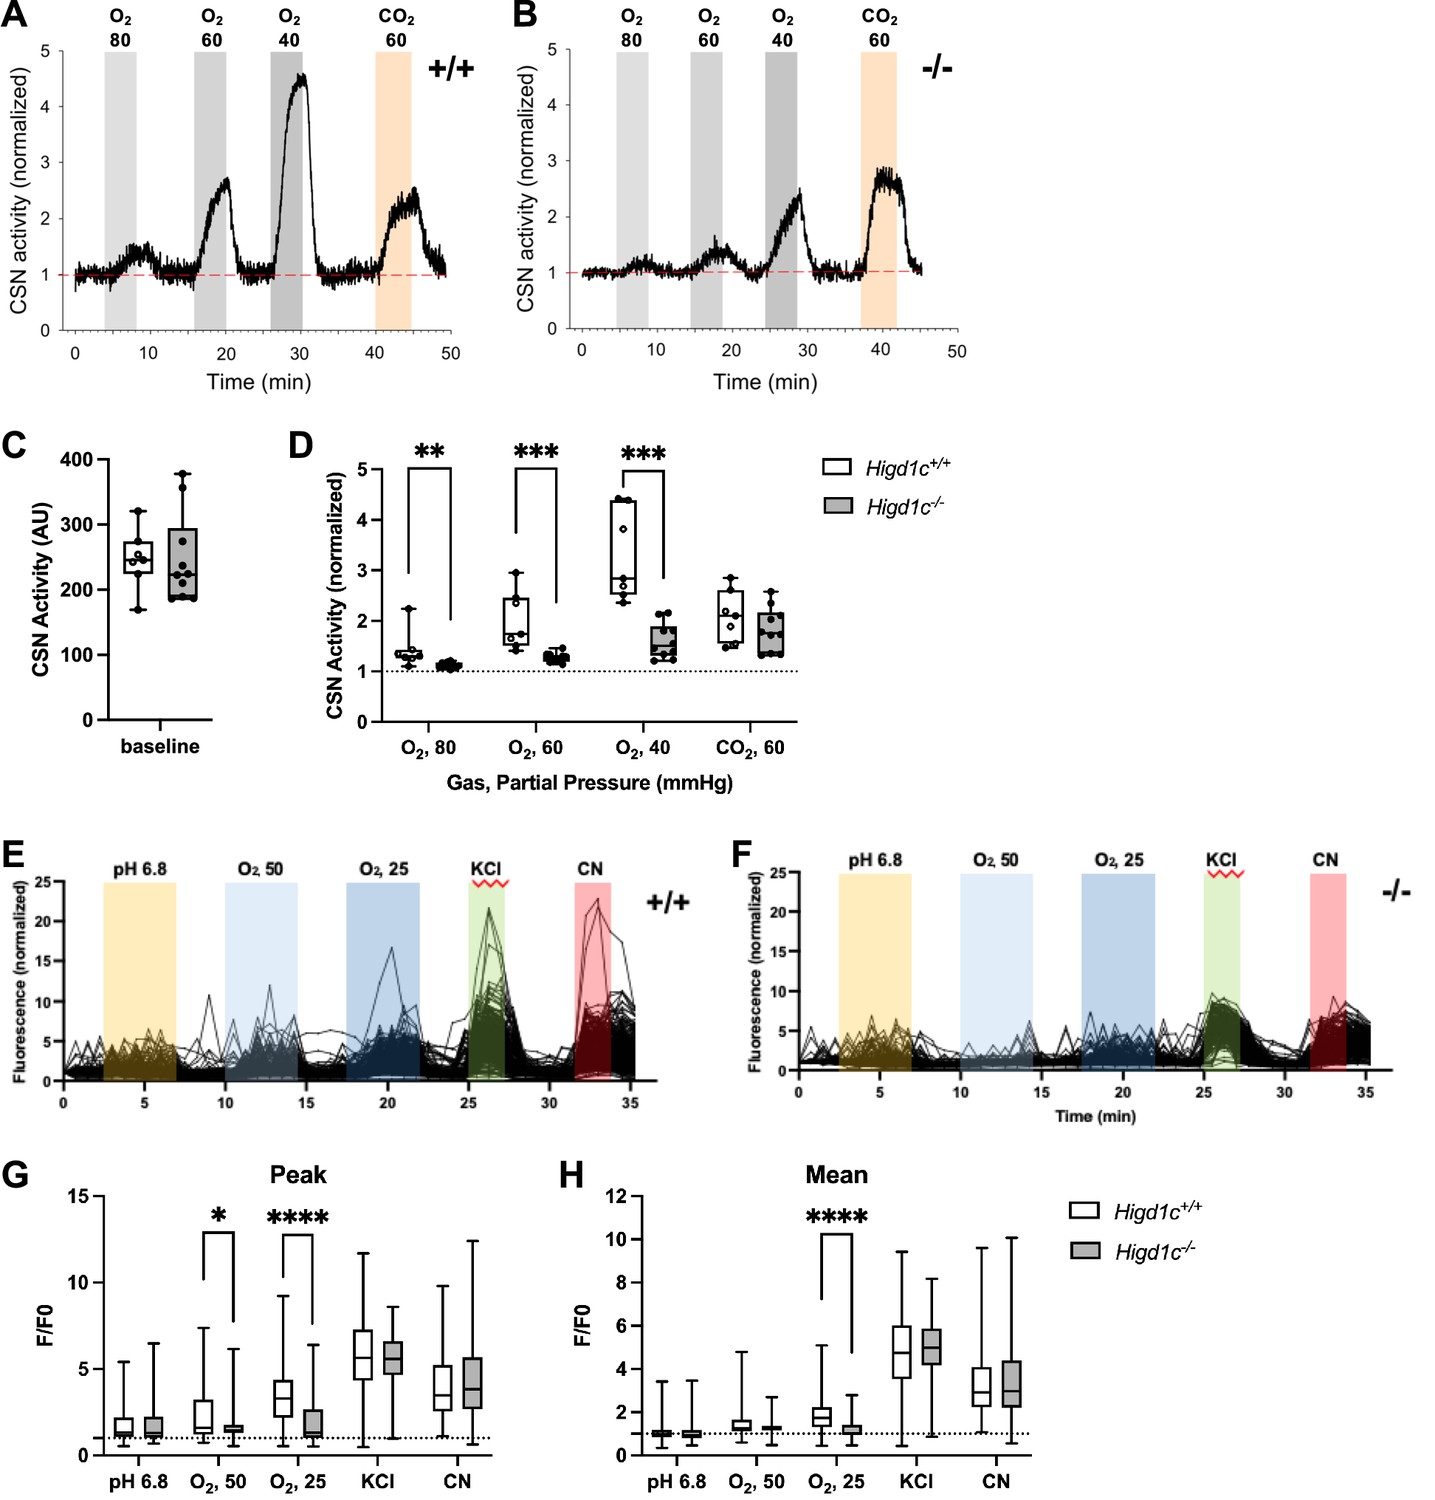
Higd1c mutants have defects in carotid body sensory responses to hypoxia.
(A, B) Representative traces of carotid sinus nerve (CSN) activity from Higd1c 1-1+/+ and Higd1c 1-1-/- tissue preparations exposed to hypoxia (PO2 ~ 80, 60, and 40 mmHg) or hypercapnia (PCO2 ~ 60 mmHg) normalized to activity at t = 0. (C, D) CSN activity in Higd1c 1-1+/+ and Higd1c 1-1-/- tissues at baseline (C) and in hypoxia and hypercapnia (D). Activity in hypoxia and hypercapnia normalized to baseline (D). n = 7/5 (+/+), 10/6 (-/-) preparations/animals. AU, arbitrary units. Data as box plots showing median and interquartile interval. **p<0.01, ***o<0.001 by Mann–Whitney U-test with Holm–Sidak correction. (E, F) Individual traces of GCaMP fluorescence of glomus cells from Higd1c 1-1+/+ and Higd1c 1-1-/- animals, in response to low pH (6.8), hypoxia (PO2 ~ 50 and 25 mmHg), high KCl (40 mM), and cyanide (CN, 1 mM). Data normalized to fluorescence at t = 0 s. Z stacks were collected every 45 s. (G, H) Peak (G) and mean (H) GCaMP calcium responses (F/F0) of glomus cells from Higd1c 1-1+/+ and Higd1c 1-1-/- animals. n = 296/4/3 (+/+), 201/4/3 (-/-) for pH 6.8, 312/5/4 (+/+), 214/5/4 (-/-) for all other stimuli. n as glomus cells/CBs/animals. Data as box plots showing median and interquartile interval. *p<0.05, ****p<0.0001 by Mann–Whitney U-test with Holm–Sidak correction.
-
Figure 3—source data 1
Source data for Figure 3C, D, G and H.
- https://cdn.elifesciences.org/articles/78915/elife-78915-fig3-data1-v3.zip
Figure 3—figure supplement 1
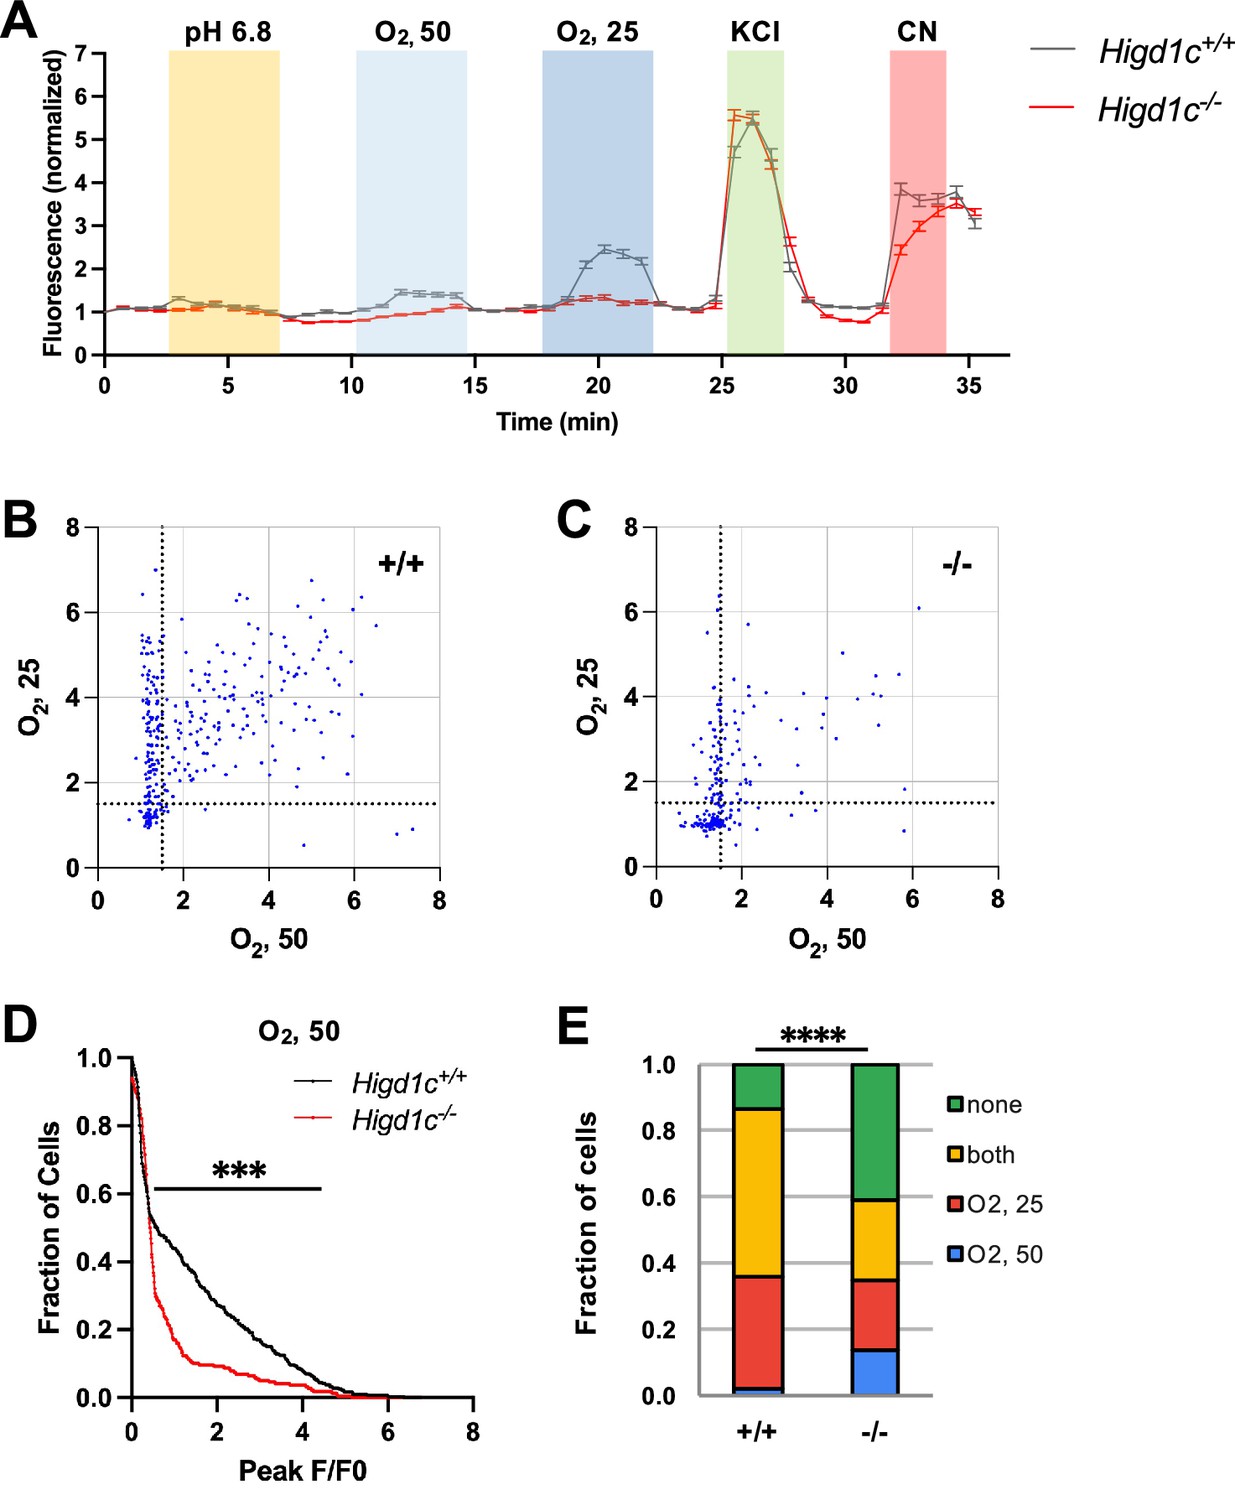
Calcium responses of Higd1c 1-1 glomus cells to hypoxia.
(A) Time course of GCaMP fluorescence of glomus cells from Higd1c+/+ and Higd1c-/- animals, in response to low pH (6.8), hypoxia (PO2 ~ 50 and 25 mmHg), high KCl (40 mM), and cyanide (CN, 1 mM). Data normalized to fluorescence at t = 0 s. Z stacks were collected every 45 s. Data as median and interquartile interval. (B, C) Scatter plot of peak responses individual glomus cells to two levels of hypoxia (PO2 ~ 50 and 25 mmHg) in carotid bodies (CBs) from Higd1c+/+ (A) and Higd1c-/- (B) animals. Strong responders with F/F0 > 1.5 gated by dashed lines. (D) Fraction of cells responding to mild hypoxia (PO2 ~ 50 mmHg) with peak F/F0 above the threshold on the x-axis. ***p<0.001 by Z-test of proportions. (E) Fraction of cells that respond to hypoxia (PO2 ~ 50 and/or 25 mmHg) as subdivided in (A) and (B). ****p<0.0001 by Chi-square test. n = 296/4/3 (+/+), 201/4/3 (-/-) cells/CBs/animals.
-
Figure 3—figure supplement 1—source data 1
Source data for Figure 3—figure supplement 1.
- https://cdn.elifesciences.org/articles/78915/elife-78915-fig3-figsupp1-data1-v3.zip
Figure 4 with 1 supplement
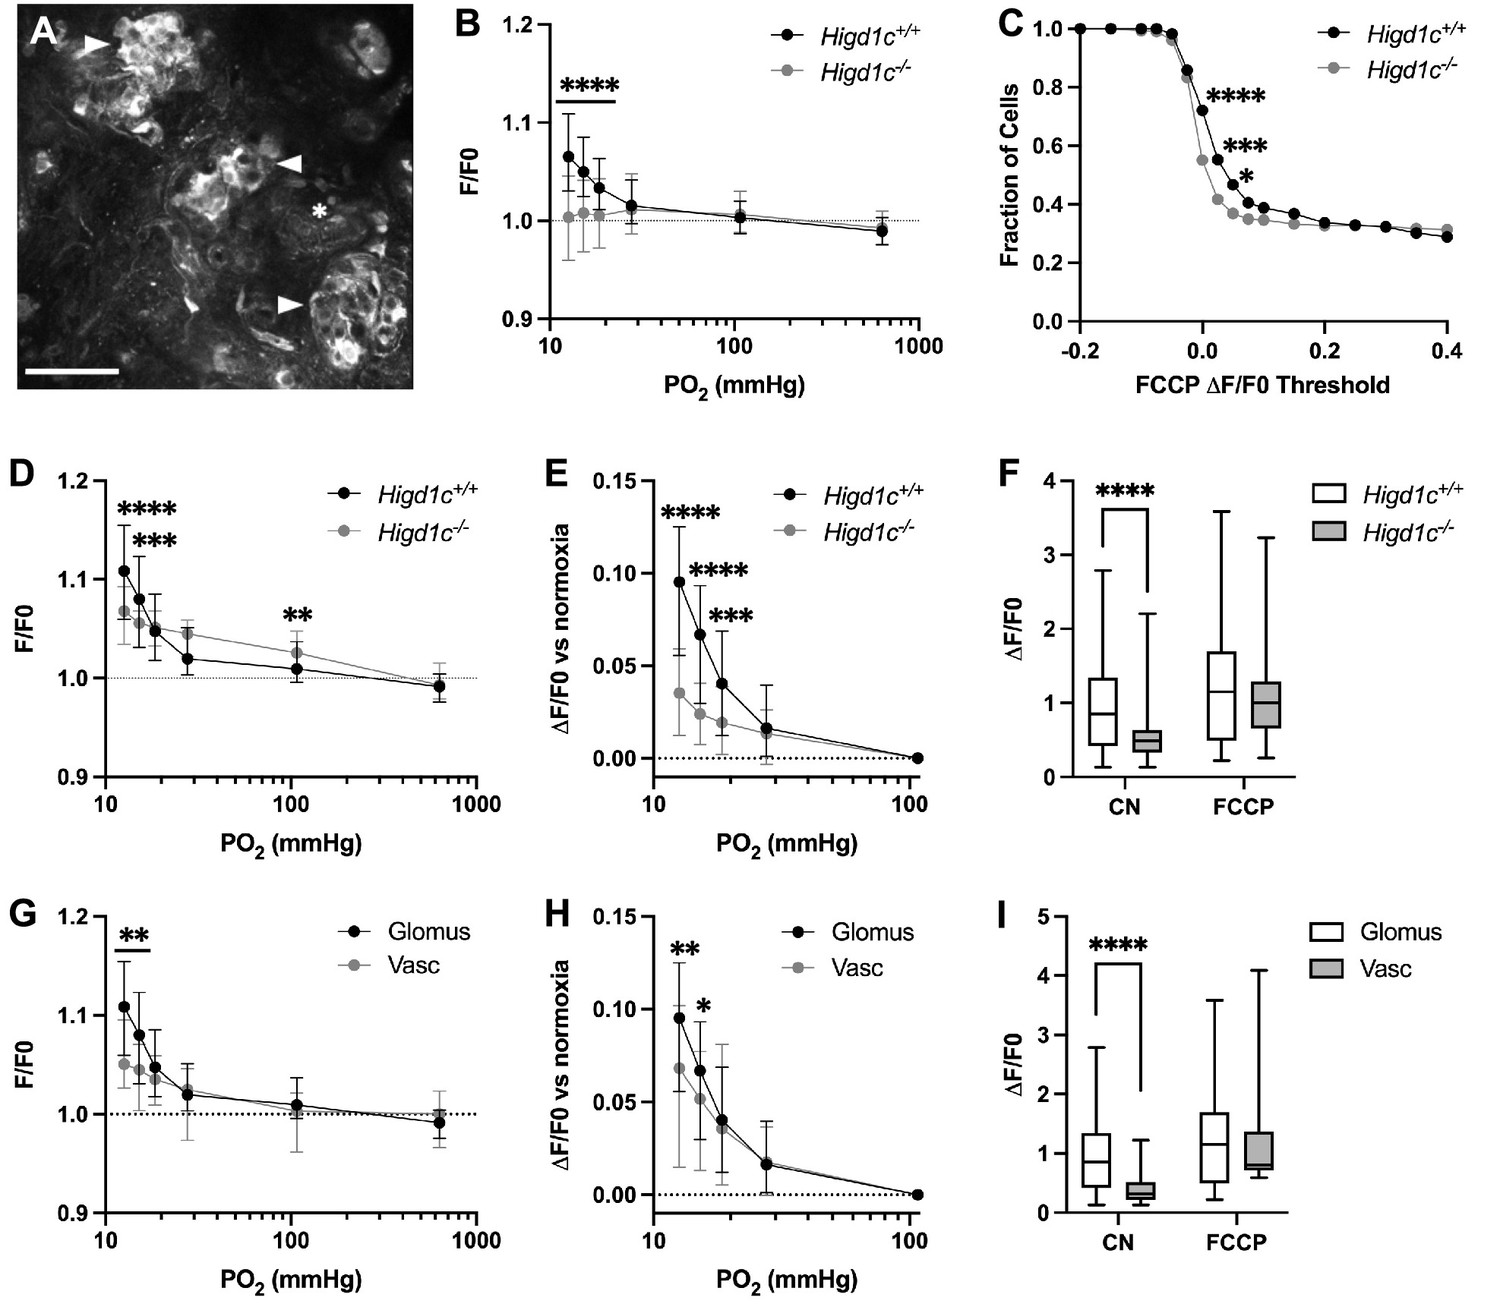
HIGD1C regulates the hypoxic response of the electron transport chain in carotid body glomus cells.
(A) Fluorescence of a whole-mount carotid body (CB) loaded with rhodamine 123 (Rh123), a dye sensitive to changes in mitochondrial inner membrane potential, under quenching conditions. Arrowheads, glomus cell clusters; asterisk, vasculature. Scale bar, 50 µm. Rh123 fluorescence of glomus cells in Higd1c 1-1+/+ and Higd1c 1-1-/- CBs measured in response to hypoxia (PO2 < 80 mmHg), cyanide (1 mM), and FCCP (2 μM). (B) Rh123 response to hypoxia for all glomus cells quantified. Dashed line, fluorescence at the start of stimulus. n = 291/3/3 (+/+), 312/3/3 (-/-) glomus cells/CBs/animals. Data presented as the median and interquartile interval. ****p<0.0001 by Mann–Whitney U-test with Holm–Sidak correction. (C) Fraction of glomus cells that responded to FCCP at different ΔF/F. n = 291/3/3 (+/+), 312/3/3 (-/-) glomus cells/CBs/animals. *p<0.01, ***p<0.001, ****p<0.0001 by Z-test of proportions. (D–F) Rh123 response to hypoxia for glomus cells with FFCP responses of ΔF/F > 0.2. Dashed line, fluorescence at the start of stimulus. n = 98/3/3 (+/+), 102/3/3 (-/-) glomus cells/CBs/animals. Data presented as the median and interquartile interval or box plots. **p<0.01, ***p<0.001, ****p<0.0001 by Mann–Whitney U-test with Holm–Sidak correction. (G–I) Rh123 fluorescence of vascular cells in the CB compared to glomus cells with FCCP responses of ΔF/F > 0.2. n = 98/3/3 (+/+) glomus cells/CBs/animals, 49/3/3 (+/+) vascular cells/CBs/animals. Data presented as the median and interquartile interval or box plots. *p<0.05, **p<0.01, ****p<0.0001 by Mann–Whitney U-test with Holm–Sidak correction.
-
Figure 4—source code 1
Source code for R analysis for Figure 4.
- https://cdn.elifesciences.org/articles/78915/elife-78915-fig4-code1-v3.zip
-
Figure 4—source data 1
Source data for Figure 4B–I.
- https://cdn.elifesciences.org/articles/78915/elife-78915-fig4-data1-v3.zip
Figure 4—figure supplement 1
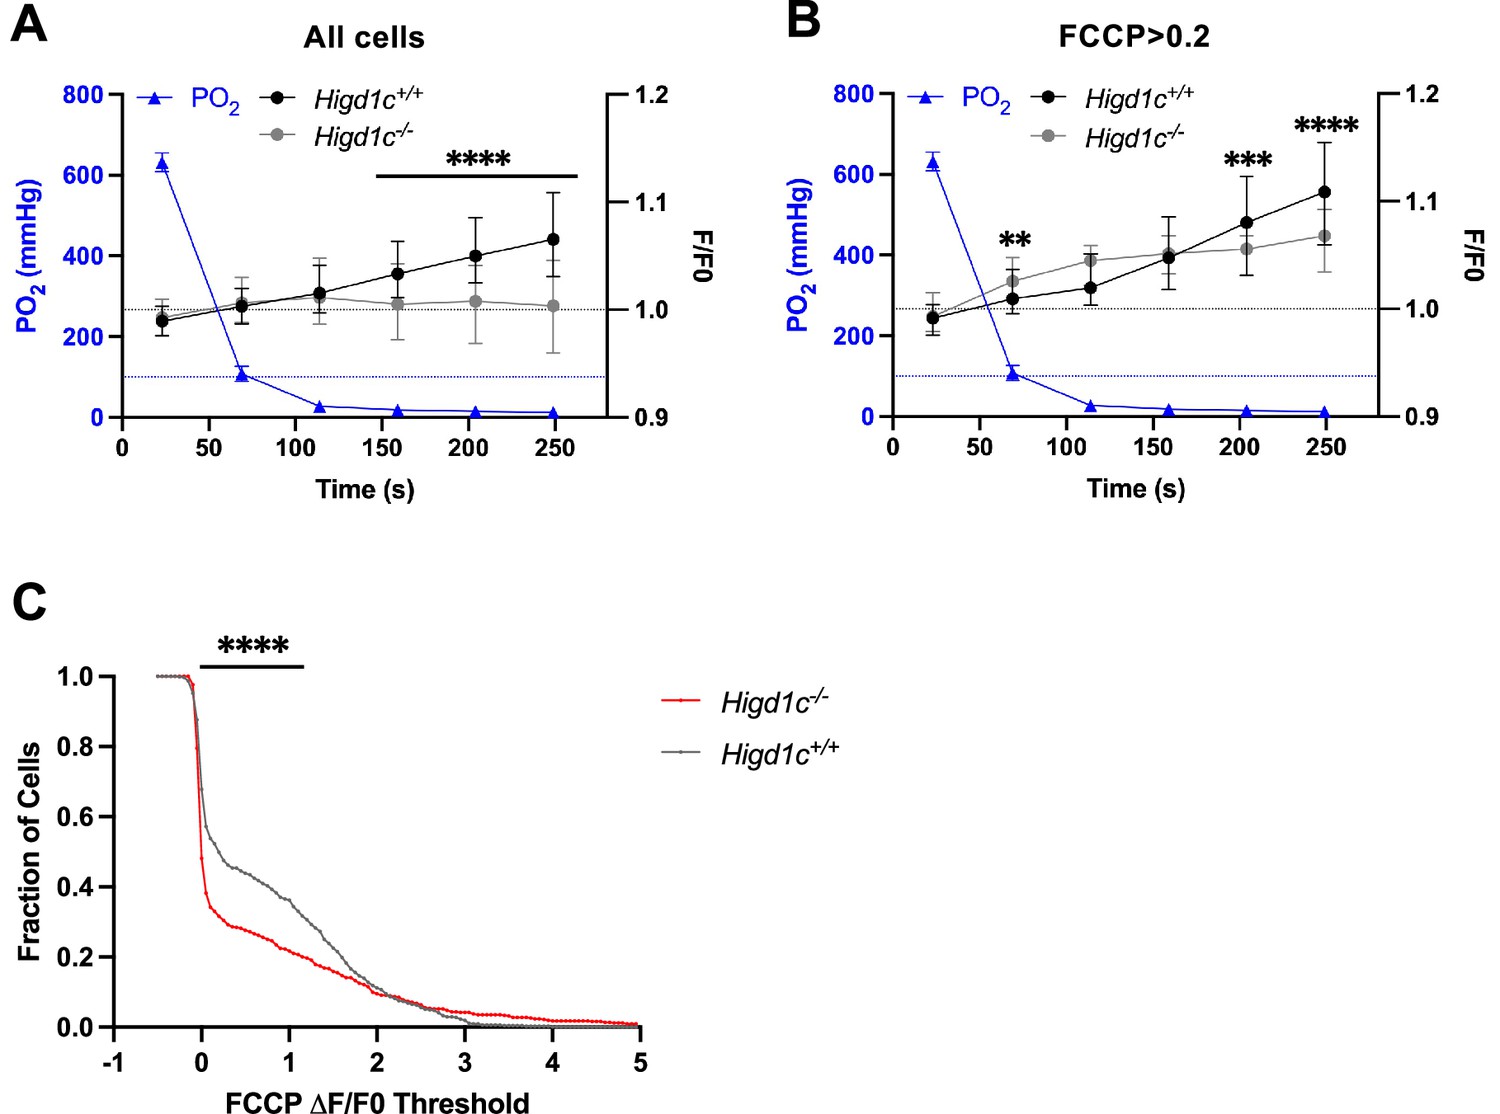
Metabolic responses of Higd1c 1-1 glomus cells to hypoxia.
(A, B) Time course of recording chamber PO2 (blue line) and glomus cell Rh123 fluorescence of cells in Higd1c 1-1+/+ (black line) and Higd1c 1-1-/- (gray line) carotid bodies (CBs) in response to hypoxia (PO2 < 80 mmHg). Data from all glomus cells (A) or only glomus cells with responses to FFCP (2 μM) at ΔF/F > 0.2 (B). Dashed black line, fluorescence at the start of stimulus; dashed blue line, normoxic PO2 = 100 mmHg comparable to well-oxygenated arterial blood. n = 291/3/3 (+/+), 312/3/3 (-/-) glomus cells/CBs/animals (A) and 98/3/3 (+/+), 102/3/3 (-/-) glomus cells/CBs/animals (B). Data presented as the median and interquartile interval. ***p<0.001, ****p<0.0001 between Higd1c 1-1+/+ and Higd1c 1-1-/- by Mann–Whitney U-test with Holm–Sidak correction. (C) Fraction of glomus cells that responded to FCCP at different ΔF/F thresholds when FCCP (2 μM) is presented as the first stimulus. n = 608/6/6 (+/+), 503/5/5 (-/-) glomus cells/CBs/animals. ****p<0.0001 by Z-test of proportions.
-
Figure 4—figure supplement 1—source data 1
Source data for Figure 4—figure supplement 1.
- https://cdn.elifesciences.org/articles/78915/elife-78915-fig4-figsupp1-data1-v3.zip
Figure 5 with 3 supplements

HIGD1C is a mitochondrial protein that associates with the electron transport chain complex IV and regulates cellular respiration.
HIGD1A-KO HEK293T cells overexpressing FLAG-tagged human or mouse HIGD1C and/or COX4 isoforms. EV, empty vector; HIGD1C, human HIGD1C; Higd1c, mouse HIGD1C. (A) BN-PAGE and immunoblots using antibodies for FLAG and the complex IV subunit COX5B. SDHA is used as a loading control. (B) Co-immunoprecipitation using a FLAG antibody followed by SDS-PAGE and immunoblot using antibodies for FLAG and subunits of complex I (NDUFA9), complex II (SDHA), complex III (CORE2, UQCRB), complex IV (COX1, COX4I1, COX5B), and cytochrome c. (C) Electron transport chain (ETC) complexes and supercomplexes extracted with DDM and digitonin, respectively, detected by BN-PAGE and immunoblotting. (A–C) All gels and blots were repeated three times. (D) Complex IV enzymatic activity assay. n = 3. *p<0.05, ***p<0.001, ****p<0.0001 vs. WT by one-way ANOVA with Dunnett’s test. +p<0.05, ++p<0.01, +++p<0.001, ++++p<0.0001 vs. HIGD1A-KO+EV by one-way ANOVA with Dunnett’s test. Gray symbol indicates p=0.06. (E, F) Polarographic assessment in digitonin-permeabilized cells of KCN-sensitive oxygen consumption driven by succinate and glycerol-3-phosphate, in the presence or absence of ADP (basal respiration and phosphorylating), oligomycin (resting), and the uncoupler CCCP (uncoupled). Respiratory control ratio (F) of measurements performed in (E). n = 3. Data as mean ± SEM. *p<0.05, **p<0.01, ***p<0.001 vs. HIGD1A-KO+EV by two-way ANOVA with Dunnett’s test.
-
Figure 5—source data 1
Source blots for Figure 5A–C.
- https://cdn.elifesciences.org/articles/78915/elife-78915-fig5-data1-v3.zip
-
Figure 5—source data 2
Source data for Figure 5D–F.
- https://cdn.elifesciences.org/articles/78915/elife-78915-fig5-data2-v3.zip
Figure 5—figure supplement 1
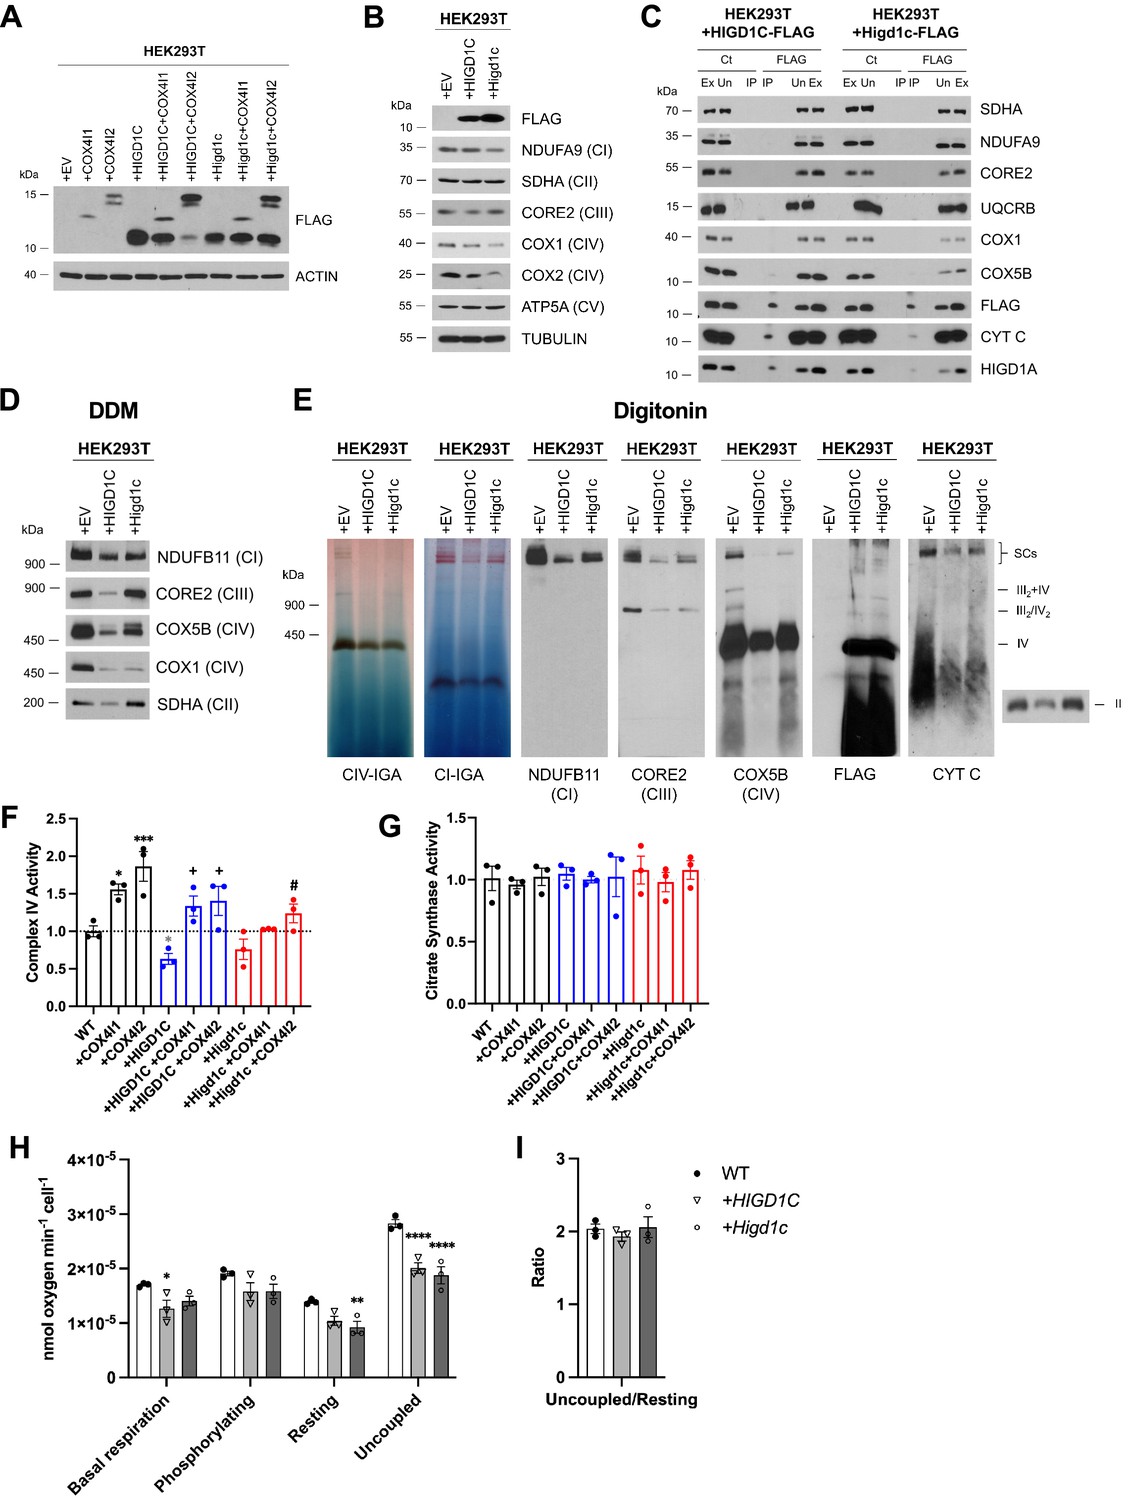
HIGD1C overexpression in wild-type HEK293T cells inhibits complex IV (CIV) activity.
HEK293T cells overexpressing FLAG-tagged human or mouse HIGD1C or/and COX4I1/I2 isoforms. EV, empty vector; HIGD1C, human HIGD1C; Higd1c, mouse HIGD1C. (A) SDS-PAGE and immunoblot using FLAG antibody to detect overexpression of different proteins. (B) SDS-PAGE and immunoblots using antibodies for FLAG and ETC subunits. (C) Co-immunoprecipitation using a FLAG antibody followed by SDS-PAGE and immunoblotting. (D) BN-PAGE and immunoblotting from purified mitochondria extracted with DDM to analyze electron transport chain (ETC) complexes. (E) Mitochondrial extracts solubilized with digitonin and analyzed by immunoblotting against antibodies for ETC complexes I, II, III, and IV or by in-gel activity assays. (A–D) All gels and blots were repeated three times. (E) In-gel experiments were performed twice. (F, G) Spectrophotometric measurement of CIV (F) or citrate synthase (G) activities in whole-cell extracts. Enzyme activities are expressed as a fraction of WT values. n = 3. Data as mean ± SEM. *p<0.05, ***p<0.001 by one-way ANOVA with Dunnett’s test. *p-value vs. WT, +p-value vs. WT + HIGD1C, #p-value vs. WT + Higd1c. (H, I) Polarographic assessment in digitonin-permeabilized cells of KCN-sensitive oxygen consumption driven by succinate and glycerol-3-phosphate, in the presence or absence of ADP, oligomycin, and the uncoupler CCCP. n = 3. Respiratory control ratio of the measurements performed in (H) (I). Data as mean ± SEM. *p<0.05, *p<0.01, ****p<0.0001 by one-way ANOVA with Dunnett’s test compared to WT.
-
Figure 5—figure supplement 1—source data 1
Source gels and blots for Figure 5—figure supplement 1A–E.
- https://cdn.elifesciences.org/articles/78915/elife-78915-fig5-figsupp1-data1-v3.zip
-
Figure 5—figure supplement 1—source data 2
Source data for Figure 5—figure supplement 1F–I.
- https://cdn.elifesciences.org/articles/78915/elife-78915-fig5-figsupp1-data2-v3.zip
Figure 5—figure supplement 2

HIGD1C regulates complex IV (CIV) activity in HIGD1A-KO HEK293T cells.
HIGD1A-KO cells overexpressing FLAG-tagged human or mouse HIGD1C or/and COX4I1/I2 isoforms. EV, empty vector; HIGD1C, human HIGD1C; Higd1c, mouse HIGD1C. (A) SDS-PAGE and immunoblots detecting FLAG and electron transport chain (ETC) subunits. (B) SDS-PAGE and immunoblot using FLAG antibody to detect overexpression of the different proteins. (C) SDS-PAGE and immunoblot using COX4I1 and COX4I2 antibodies to detect gene knockdown and overexpression, respectively. (D) Co-immunoprecipitation using anti-FLAG antibody conjugated agarose beads followed by SDS-PAGE and immunoblotting. (E) BN-PAGE and immunoblotting using purified mitochondria solubilized with DDM or digitonin to analyze ETC complexes and supercomplexes, respectively. ** indicates the accumulation of cytochrome c in an unidentified subcomplex. (A–E) All gels and blots were repeated three times. (F) Citrate synthase activity measured by polarography in whole-cell extracts and expressed as a fraction of WT values. n = 3. Data as mean ± SEM.
-
Figure 5—figure supplement 2—source data 1
Source blots for Figure 5—figure supplement 2A–E.
- https://cdn.elifesciences.org/articles/78915/elife-78915-fig5-figsupp2-data1-v3.zip
-
Figure 5—figure supplement 2—source data 2
Source data for Figure 5—figure supplement 2F.
- https://cdn.elifesciences.org/articles/78915/elife-78915-fig5-figsupp2-data2-v3.zip
Figure 5—figure supplement 3
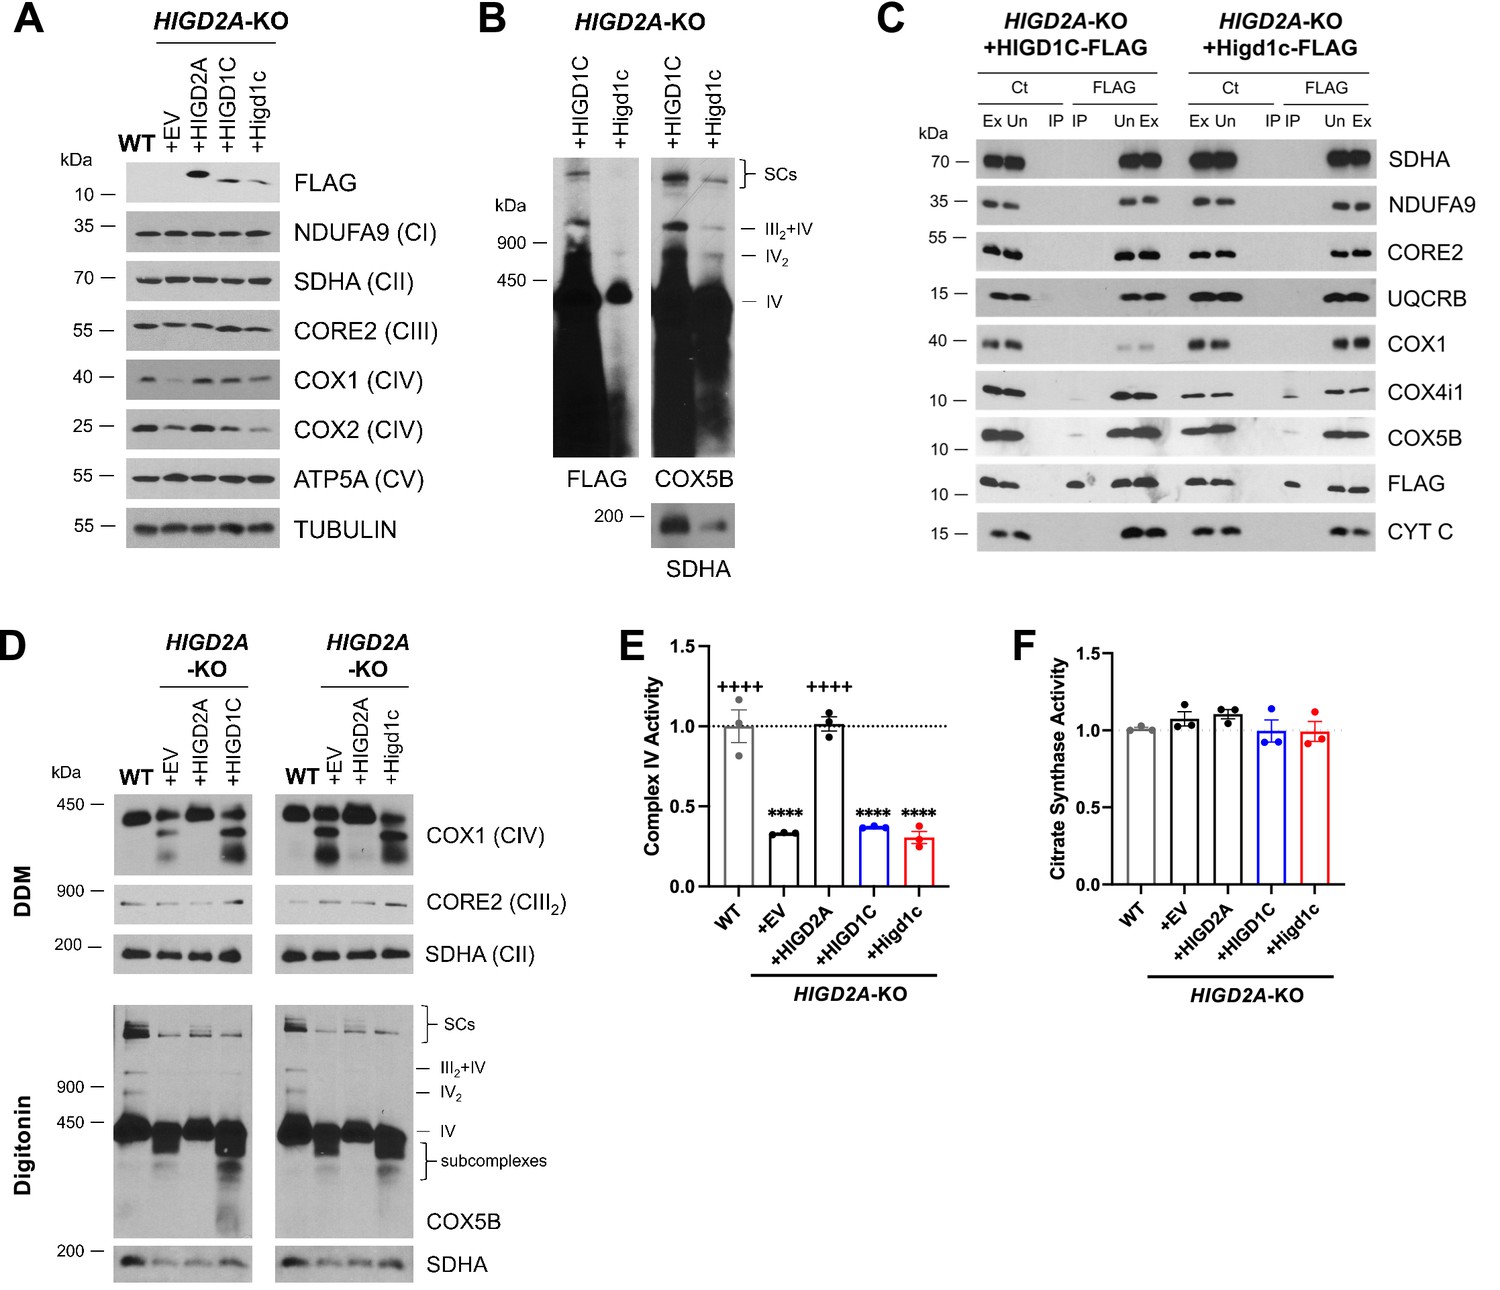
HIGD1C overexpression in HIGD2A-KO HEK293T cells does not rescue electron transport chain (ETC) defects.
HIGD2A-KO cells overexpressing FLAG-tagged human or mouse HIGD1C. EV, empty vector; HIGD1C, human HIGD1C; Higd1c, mouse HIGD1C. (A) SDS-PAGE and immunoblots using FLAG and ETC subunits. (B) BN-PAGE of digitonin-permeabilized purified mitochondria and immunoblot using anti-FLAG and anti-COX5B antibodies, and anti-SDHA as a loading control. (C) Co-immunoprecipitation using anti-FLAG antibody-conjugated agarose beads followed by SDS-PAGE and immunoblotting. (D) BN-PAGE and immunoblotting using purified mitochondria solubilized with DDM or digitonin to analyze ETC complexes and supercomplexes, respectively. (A–D) All gels and blots were repeated three times. (E, F) Complex IV (CIV) and citrate synthase activities analyzed by polarography in whole-cell extracts. Enzyme activities are expressed as a fraction of WT values. n = 3. Data as mean ± SEM. ****p<0.0001 by one-way ANOVA with Dunnett’s test. ****p<0.0001 vs. WT, ++++p<0.0001 vs. HIGD2A-KO+EV by one-way ANOVA with Dunnett’s test.
-
Figure 5—figure supplement 3—source data 1
Source blots for Figure 5—figure supplement 3A–D.
- https://cdn.elifesciences.org/articles/78915/elife-78915-fig5-figsupp3-data1-v3.zip
-
Figure 5—figure supplement 3—source data 2
Source data for Figure 5—figure supplement 3E and F.
- https://cdn.elifesciences.org/articles/78915/elife-78915-fig5-figsupp3-data2-v3.zip
Figure 6 with 1 supplement
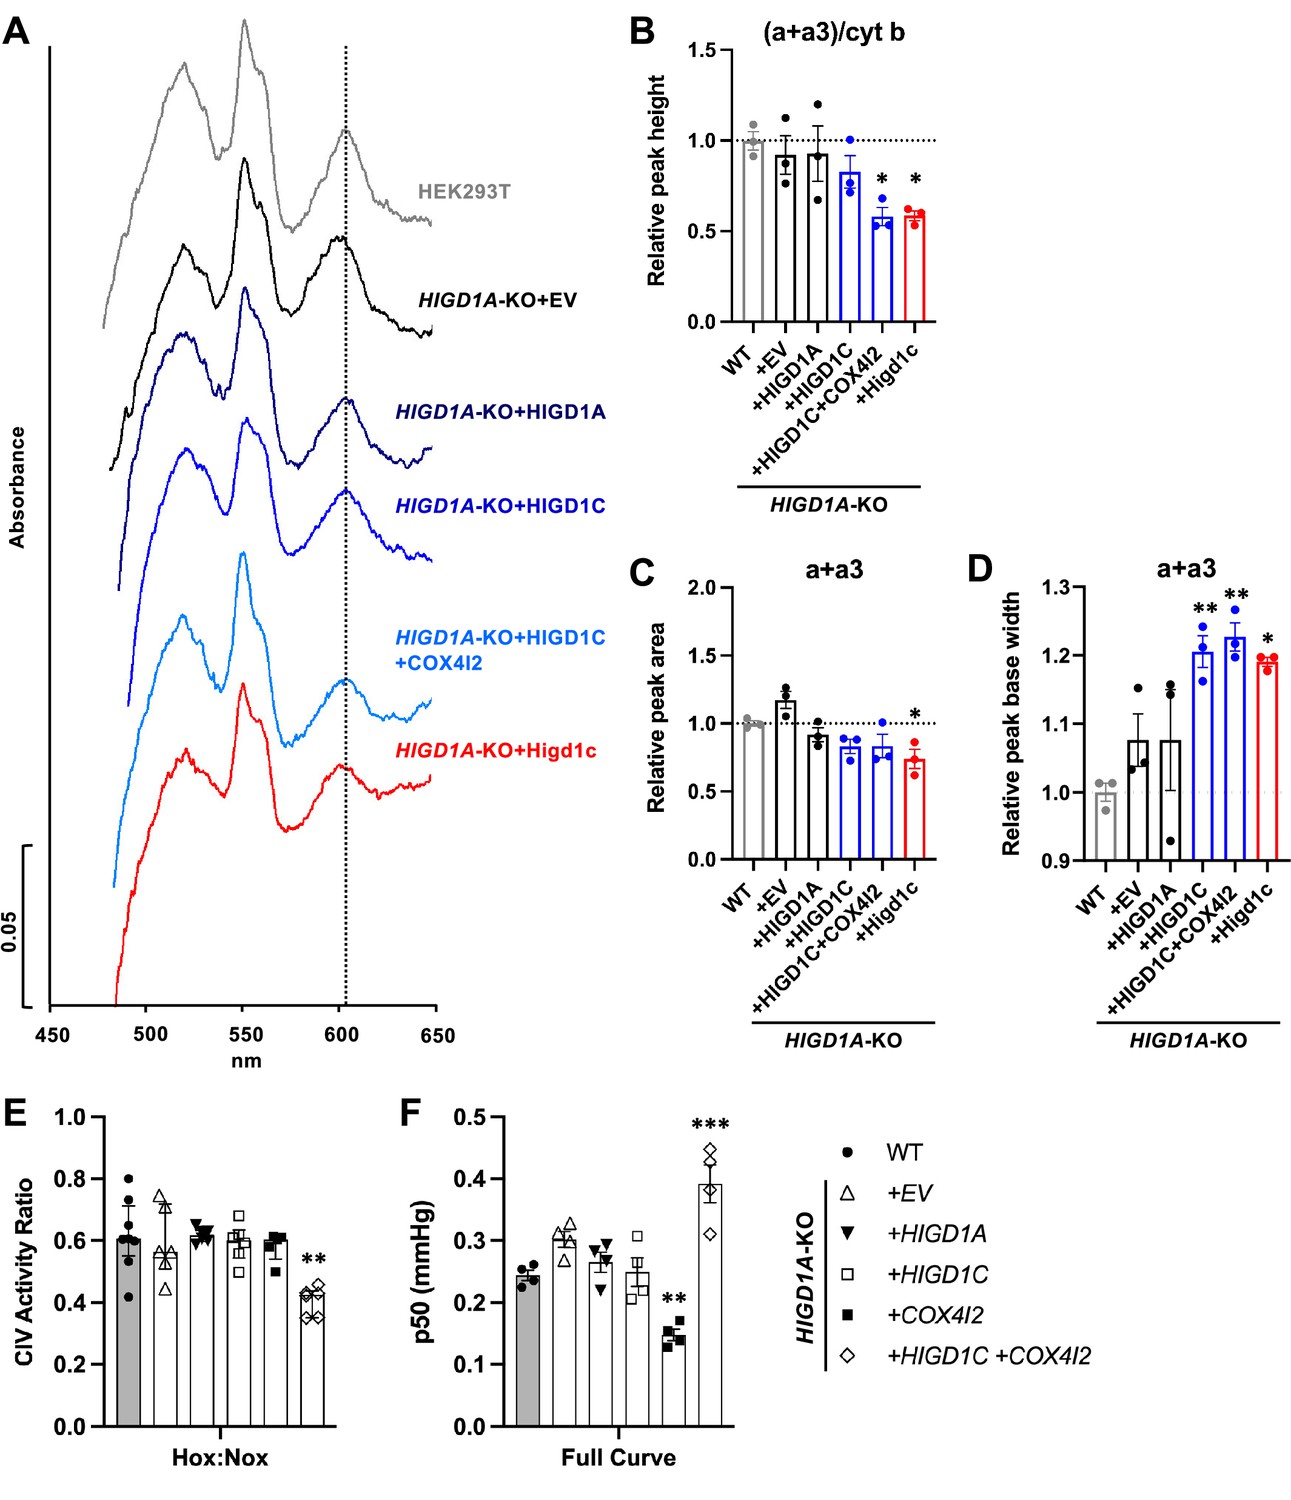
HIGD1C alters complex IV (CIV) conformation and increases CIV sensitivity to hypoxia.
(A) Differential spectra (reduced minus oxidized) of total mitochondrial cytochromes measured by spectrophotometry. The absorbance of cytochromes extracted from purified mitochondria was measured from 450 to 650 nm. (B) Relative peak height of heme a + a3 normalized by cytochrome b peak as the ratio of wild-type (WT). n = 3. Data as mean ± SEM. **p<0.01 vs. WT by one-way ANOVA with Dunnett’s test. (C, D) Relative peak area (C) and peak base width (D) of a + a3 as the ratio of WT. n = 3. Data as mean ± SEM. *p<0.05, **p<0.01 vs. WT by one-way ANOVA with Dunnett’s test. (E) Ascorbate/TMPD-dependent oxygen consumption in normoxia (Nox, PO2 ~ 150 mmHg) and hypoxia (Hox, PO2 ~ 25 mmHg) by high-resolution respirometry. Ratio of hypoxic/normoxic oxygen consumption. n = 5–8. Data as the median and interquartile interval. **p<0.01 vs. WT by Kruskal–Wallis test with Dunn’s test. (F) Mitochondrial oxygen affinity (p50mito) values derived from full oxygen consumption curve in intact cells from normoxia (PO2 ~ 150 mmHg) to anoxia (PO2 = 0 mmHg) by high-resolution respirometry. n = 4. Data as mean ± SEM. **p<0.01, ***p<0.001 vs. WT by one-way ANOVA with Dunnett’s test.
-
Figure 6—source data 1
Source data for Figure 6B–F.
- https://cdn.elifesciences.org/articles/78915/elife-78915-fig6-data1-v3.zip
Figure 6—figure supplement 1
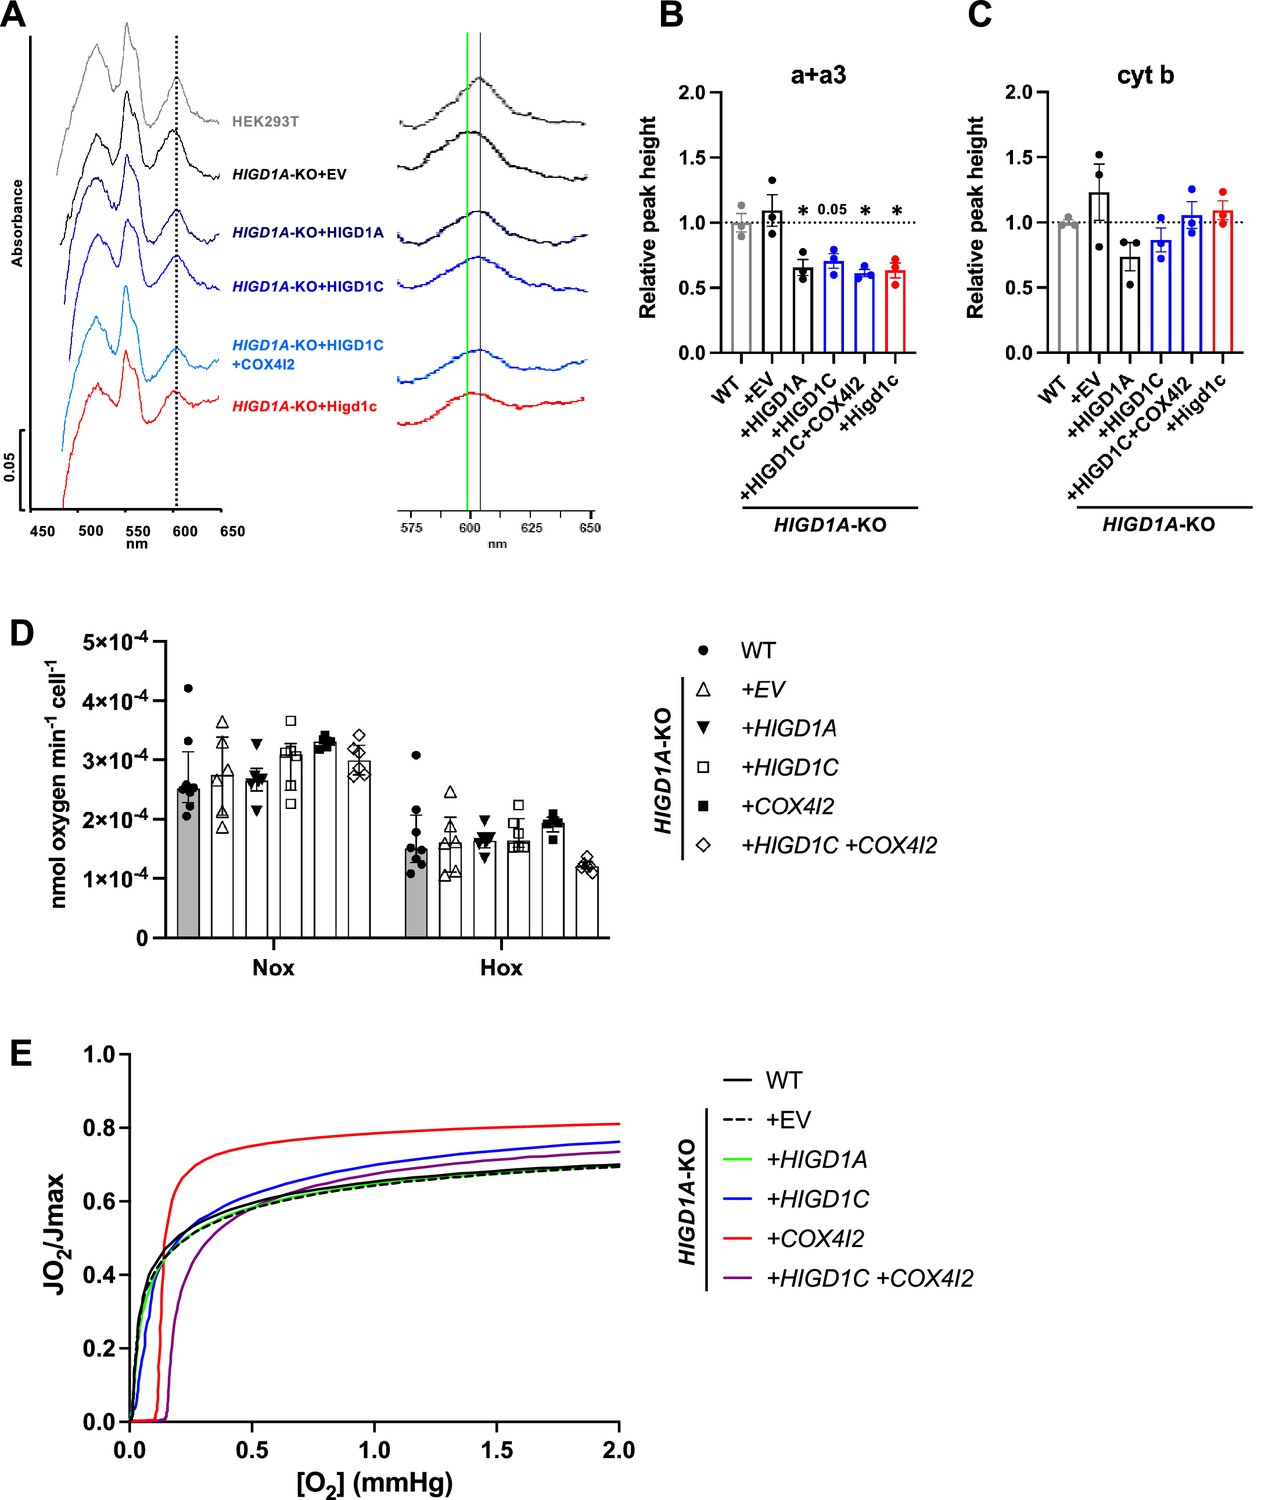
HIGD1C regulates complex IV (CIV) conformation and oxygen sensitivity in HIGD1A-KO HEK293T cells.
(A) Differential spectra (reduced minus oxidized) of total mitochondrial cytochromes measured by spectrophotometry. The absorbance of cytochromes extracted from purified mitochondria was measured from 450 to 650 nm. The panel on the left is a ×2.5 magnification on the x-axis of the indicated portion of the graph. The gray vertical line indicates the wild-type heme a + a3 peak at 603 nm. The green vertical line marks the 599 nm wavelength, towards which some of the heme a + a3 peaks are shifted. (B, C) Relative peak height of heme a + a3 (B) or cytochrome b (C) shown as the ratio of WT. n = 3. Data as mean ± SEM. *p<0.05 vs, WT by one-way ANOVA with Dunnett’s test. (D) Ascorbate/TMPD-dependent oxygen consumption in normoxia (Nox, PO2 ~ 150 mmHg) and hypoxia (Hox, PO2 ~ 25 mmHg) by high-resolution respirometry. n = 5–8. Data as median and interquartile interval. No HIGD1A-KO cell lines were significantly different from WT by Kruskal–Wallis test with Dunn’s test (p>0.05). (E) Representative traces of oxygen kinetics (JO2/Jmax) as a function of oxygen concentration in the low oxygen range by high-resolution respirometry.
-
Figure 6—figure supplement 1—source data 1
Source data for Figure 6—figure supplement 1B–D.
- https://cdn.elifesciences.org/articles/78915/elife-78915-fig6-figsupp1-data1-v3.zip
Figure 7
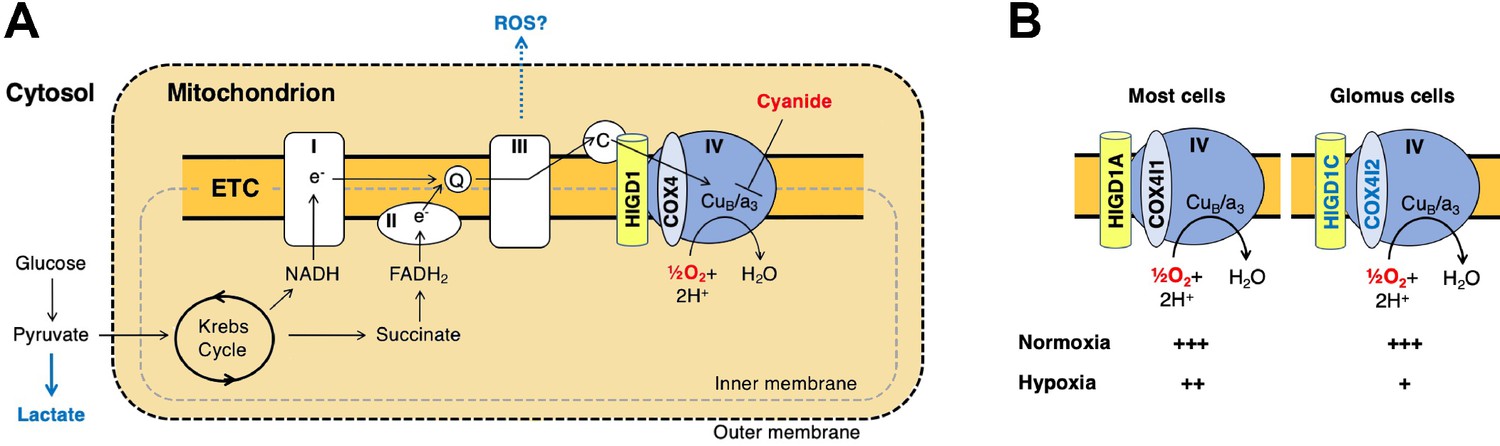
A model for oxygen sensing by mitochondria of carotid body glomus cells.
(A) In this simplified scheme, NADH produced by the Krebs cycle transfers electrons to CI to initiate the electron transport chain (ETC). FADH2 produced by succinate metabolism can also initiate the ETC by donating electrons to CII. In the terminal step of the ETC, complex IV (CIV) transfers electrons to oxygen. Cyanide inhibits the transfer of electrons to oxygen by binding to heme a3 in CIV to mimic the effect of hypoxia on the ETC. Hypoxia and cyanide reduce flux through the ETC, increasing the production of reactive oxygen species (ROS) and lactate that are proposed to signal to downstream targets for neurotransmission in glomus cells (Chang, 2017; Holmes et al., 2018; Ortega-Sáenz and López-Barneo, 2020). HIGD1 and COX4 are ETC proteins that associate with CIV. Q, coenzyme Q; C, cytochrome c. (B) In most cells, CIV contains HIGD1A and COX4I1 proteins that form an early-assembly module during CIV biogenesis (Timón-Gómez et al., 2020b). Glomus cells express alternative isoforms of HIGD1A and COX4I2 called HIGD1C and COX4I2, respectively (Figure 1—figure supplement 5A). The combination of HIGD1C and COX4I2 increases the sensitivity of CIV to hypoxia at the level of oxygen consumption (relative activity levels denoted). Because mouse knockouts in Higd1c and Cox4i2 are defective in carotid body oxygen sensing (Figures 2—4 Moreno-Domínguez et al., 2020) and HIGD1C and COX4I2 overexpression in HEK293T cells enhances oxygen sensitivity of the ETC to hypoxia (Figure 6E and F), we propose that these CIV-associated proteins are necessary and sufficient for oxygen sensing by carotid body glomus cells.
Author response image 1
Author response image 2
Tables
Table 1
Genotype distribution of progeny from Higd1c+/- × Higd1c+/-crosses.
| Higd1c allele | N | Frequency of genotype | Chi-square p-value | ||
|---|---|---|---|---|---|
| +/+ | +/- | -/- | |||
| 3-1 | 125 | 0.22 | 0.48 | 0.30 | 0.344 |
| 1-1 | 233 | 0.32 | 0.43 | 0.25 | 0.028 |
| 5-3 | 78 | 0.24 | 0.53 | 0.23 | 0.891 |
Table 2
Reagents and resources.
| Reagent or resource | Source | Identifier |
|---|---|---|
| Mouse strains | ||
| C57BL/6J (wild-type) | JAX | 000664 |
| B6.FVB(Cg)-Tg(Th-cre)FI172Gsat/Mmucd | MMRRC | 031029-UCD |
| B6;129S-Gt(ROSA)26Sortm38(CAG-GCaMP3)Hze/J | JAX | 014538 |
| B6.Higd1c 3-1 | This paper | |
| B6.Higd1c 1-1 | This paper | |
| B6.Higd1c 5-3 | This paper | |
| sgRNA primers (target sequence in bold) | ||
| sgRNA-1 (forward): TAATACGACTCACTATAGGGAGTCTCTCGATTTCCGGGTTTTAGAGCTAGAA | This paper | |
| sgRNA-2 (forward): TAATACGACTCACTATAGGCTGATTTAAGGAGTGAGTGCGTTTTAGAGCTAGAA | This paper | |
| sgRNA (reverse, common): AAAAAAAGCACCGACTCGGTGCCACTTTTTCAAGTTGATAACGGACTA GCCTTATTTTAACTTGCTATTTCTAGCTCTAAAAC | This paper | |
| Genotyping primers | ||
| Higd1c-P8: GTCAGGTGGCCCCTGATGAAA | This paper | |
| Higd1c-P9: GTGCACGAGCAGACTGGTTCT | This paper | |
| Higd1c-P11: GGATATCACAGCCACAGAGGACG | This paper | |
| Mouse qPCR primers | ||
| Actb-F: AGCCATGTACGTAGCCATCC | This paper | |
| Actb-R: GCCATCTCTTGCTCGAAGTC | This paper | |
| Higd1c (5 exon)-F: CACGTACAAGGGCTGCATGG | This paper | |
| Higd1c (5 exon)-R: ACCTAGAGTCACGGCTCCC | This paper | |
| Higd1c (4 exon)-F: CCAGCACGTACAAGAGAGAAA | This paper | |
| Higd1c (4 exon)-R: ACGTGGATGAGATGAAGGGAC | This paper | |
| Rat qPCR primers | ||
| GADPH-F: CAAGTTCAACGGCACAGTCAAG | Kim et al., 2011 | |
| GADPH-R: ACATACTCAGCACCAGCATCAC | Kim et al., 2011 | |
| Higd1c-F1: CCTGTGCTGATCAAAGAGCA | This paper | |
| Higd1c-R1: CTGACCACTCATCTGAAGAC | This paper | |
| Higd1c-R2: CTGCTGACCACTCATCTGAA | This paper | |
| Kcnk3-F: GCAGAAGCCGCAGGAGTTC | Kim et al., 2011 | |
| Kcnk3-R: GCCCGCACAGTTGGAGATTTAG | Kim et al., 2011 | |
| Kcnk9-F: CGGTGCCTTCCTCAATCTTGTG | Kim et al., 2011 | |
| Kcnk9-R: TGGTGCCTCTTGCGACTCTG | Kim et al., 2011 | |
| Th-F: TCGGAAGCTGATTGCAGAGA | Feng et al., 2020 | |
| Th-R: TTCCGCTGTGTATTCCACATG | Feng et al., 2020 | |
| Olr59-F: TCATTCACGCTCTCTCAGCA | von der Weid et al., 2015 | |
| Olr59-R: CCATGCCGATTTGGACTGTT | von der Weid et al., 2015 | |
| Human qPCR primers | ||
| GADPH-F: ACCACAGTCCATGCCATCAC | Maßberg et al., 2016 | |
| GADPH-R: TCCCACCACCCTGTTGCTGTA | Maßberg et al., 2016 | |
| HIGD1A-F1: CAACAGACACAGGTGTTTCC | This paper | |
| HIGD1A-R1: CAATTGCTGCAAAACCCGCT | This paper | |
| HIGD2A-F: GCCCCACTGTTTACAGGAAT | This paper | |
| HIGD2A-R: GCGCATCATGAGCTGAGAG | This paper | |
| HIGD1C-F: GAAGGCCAATTATCCCGACT | This paper | |
| HIGD1C-R: GCTTGTAAAGACCACAGGAC | This paper | |
| COX4I1-F: CAAGCGAGCAATTTCCACCT | This paper | |
| COX4I1-R: CCTTCTCCTTCAATGCCTTC | This paper | |
| COX4I2-F: GAGGGATGCACAGCTCAGAA | This paper | |
| COX4I2-R: CTTCTCCTTCTCCTTCAGGG | This paper | |
| NDUFA4L2-F: GATGATCGGCTTAATCTGCC | This paper | |
| NDUFA4L2-R: GTATTGGTCATTGGGGCTCA | This paper | |
| TH-F: GCTGGACAAGTGTCATCACCTG | OriGene | HP234519 |
| TH-R: CCTGTACTGGAAGGCGATCTCA | OriGene | HP234519 |
| OR51E2-F2: TCATCCCATTGTGCGTGTTG | This paper | |
| OR51E2-R2: CACCCGTGTTCTGATCTGTTTG | This paper | |
| BaseScope in situ hybridization probes | ||
| BA-Mm-Higd1c-2zz-st | ACD | 862241 |
| BA-Mm-Th-3EJ-C2 | ACD | 854771-C2 |
| dapB-1ZZ-C1/dapB-1ZZ-C2 | ACD | 700141 |
| Mm-Ppib-1ZZ | ACD | 701081 |
| Mm-Polr2a-1ZZ-C2 | ACD | 701101-C2 |
| Plasmids | ||
| HIGD1C-Myc-FLAG in pCMV6-Entry (human) | OriGene | RC225015 |
| Higd1c-Myc-FLAG in pCMV6-Entry (mouse) | OriGene | MR220387 |
| COX4I1-Myc-FLAG in pCMV6-Entry | OriGene | RC209374 |
| COX4I2-Myc-FLAG in pCMV6-Entry | OriGene | RC209204 |
| pCMV6-A-Entry-Hygro | OriGene | PS100024 |
| pCMV6-A-Entry-BSD | OriGene | PS100022 |
| HIGD1A-Myc-FLAG in pCMV6-A-Entry-Hygro | Timón-Gómez et al., 2020b | |
| HIGD2A-Myc-FLAG in pCMV6-A-Entry-Hygro | Timón-Gómez et al., 2020b | |
| HIGD1C-Myc-FLAG in pCMV6-A-Entry-Hygro (human) | This paper | |
| Higd1c-Myc-FLAG in pCMV6-A-Entry-Hygro (mouse) | This paper | |
| COX4I1-Myc-FLAG in pCMV6-A-Entry-BSD | This paper | |
| COX4I2-Myc-FLAG in pCMV6-A-Entry-BSD | This paper | |
| Primary antibodies/stains | ||
| Mouse anti-DDK/FLAG | OriGene | TA50011 |
| Mouse anti-HSP60 | ECM Biosciences | HM-4381 |
| Rabbit anti-TH | Abcam | ab112 |
| Rat anti-CD31 | BD Pharmingen | 553370 |
| Lotus tetragonolobus lectin-Fluorescein | Vector Labs | FL-1321 |
| Mouse anti-ATP5A | Abcam | ab14748 |
| Mouse anti-β-ACTIN | Abcam | ab8227 |
| Mouse anti-CORE2 | Abcam | ab8227 |
| Mouse anti-COX1 | Abcam | ab14705 |
| Mouse anti-COX4I1 | Abcam | ab14744 |
| Rabbit anti-COX4I2 | Abnova | H00084701-M01 |
| Mouse anti-COX5B | Santa Cruz | sc-374417 |
| Mouse anti-β-TUBULIN | Sigma-Aldrich | C4585 |
| Rabbit anti-UQCRB | Abcam | ab122837 |
| Mouse anti-NDUFA9 | Abcam | ab14713 |
| Rabbit anti-NDUFB11 | Abcam | ab183716 |
| Rabbit anti-SDHA | Abcam | ab14715 |
| Mouse anti-cytochrome c | Santa Cruz | sc-13156 |
Additional files
Download links
A two-part list of links to download the article, or parts of the article, in various formats.
Downloads (link to download the article as PDF)
Open citations (links to open the citations from this article in various online reference manager services)
Cite this article (links to download the citations from this article in formats compatible with various reference manager tools)
Tissue-specific mitochondrial HIGD1C promotes oxygen sensitivity in carotid body chemoreceptors
eLife 11:e78915.
https://doi.org/10.7554/eLife.78915


