Neutrophil-mediated fibroblast-tumor cell il-6/stat-3 signaling underlies the association between neutrophil-to-lymphocyte ratio dynamics and chemotherapy response in localized pancreatic cancer: A hybrid clinical-preclinical study
- Department of Surgery, University of Miami Miller School of Medicine, United States
- Department of Surgery, University of Nebraska Medical Center, United States
- Sylvester Comprehensive Cancer Center, United States
- Department of Pathology, University of Miami, United States
- Department of Medicine, University of Miami, United States
- Department of Public Health Sciences, The University of Texas Health Science Center at Houston, United States
Figures
Figure 1
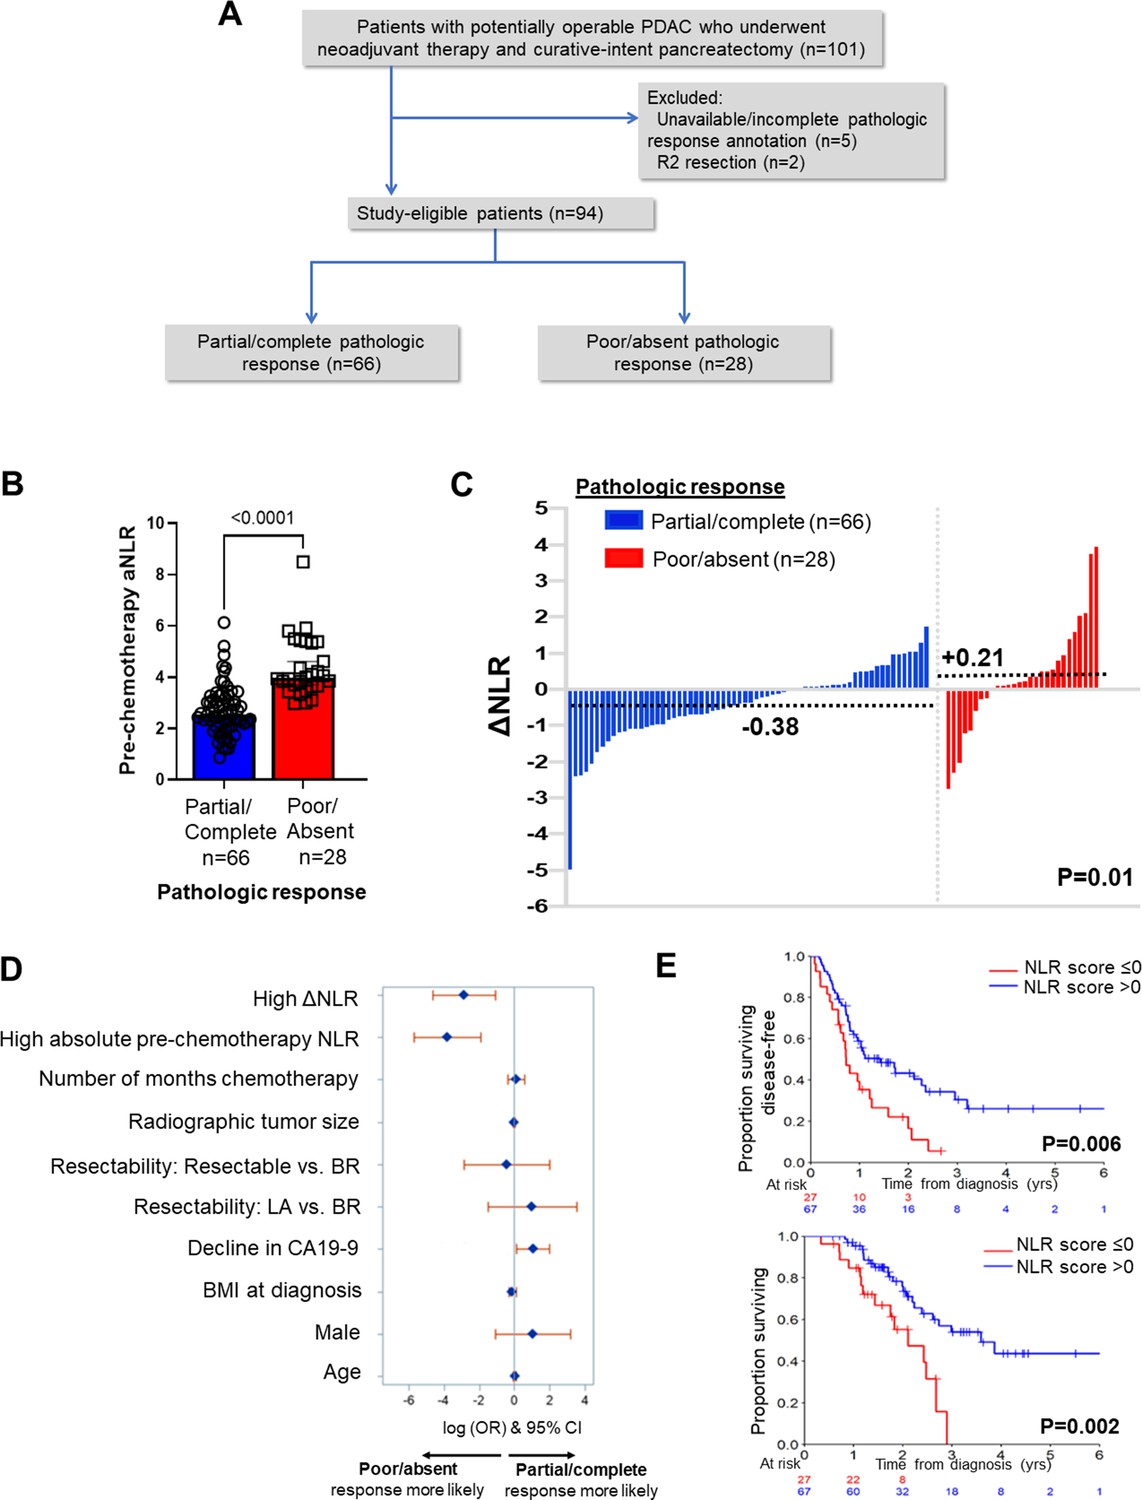
Neutrophil-to-lymphocyte ratio (NLR) dynamics are associated with pathologic response and survival following neoadjuvant chemotherapy in pancreatic cancer.
(A) STROBE diagram for selection of study-eligible patients with potentially operable pancreatic ductal adenocarcinoma undergoing neoadjuvant chemotherapy and curative-intent pancreatectomy, stratified by pathologic response; (B) Comparison of pre-chemotherapy absolute NLR (aNLR) between resected PDAC patients who demonstrated partial/complete pathologic response (n=66) and poor/absent pathologic response (n=28) following neoadjuvant chemotherapy. Median (IQR) values are plotted; (C) Waterfall plot depicting the delta-NLR (ΔNLR = pre-surgery NLR—pre-chemotherapy NLR) of all study-eligible patients, stratified by partial/complete (blue) or poor/absent (red) pathologic response. Dotted lines indicate median ΔNLR in each cohort, and adjoining p-value represents the comparison of these median values; (D) Forest plot showing predictors of pathologic response following NAC in a multivariable logistic regression model. Adjusted log odds ratios (ORs) and corresponding 95% confidence intervals are plotted on the x-axis; (E) Stratification of disease-free survival (top) and overall survival (bottom) by ‘NLR score’, calculated as the product of regression coefficients and aNLR/ΔNLR. The NLR score was dichotomized at ≤0 or>0 based on its efficiency at prognosticating DFS and OS. Number of patients at risk at each time point shown in adjoining tables.
Figure 2
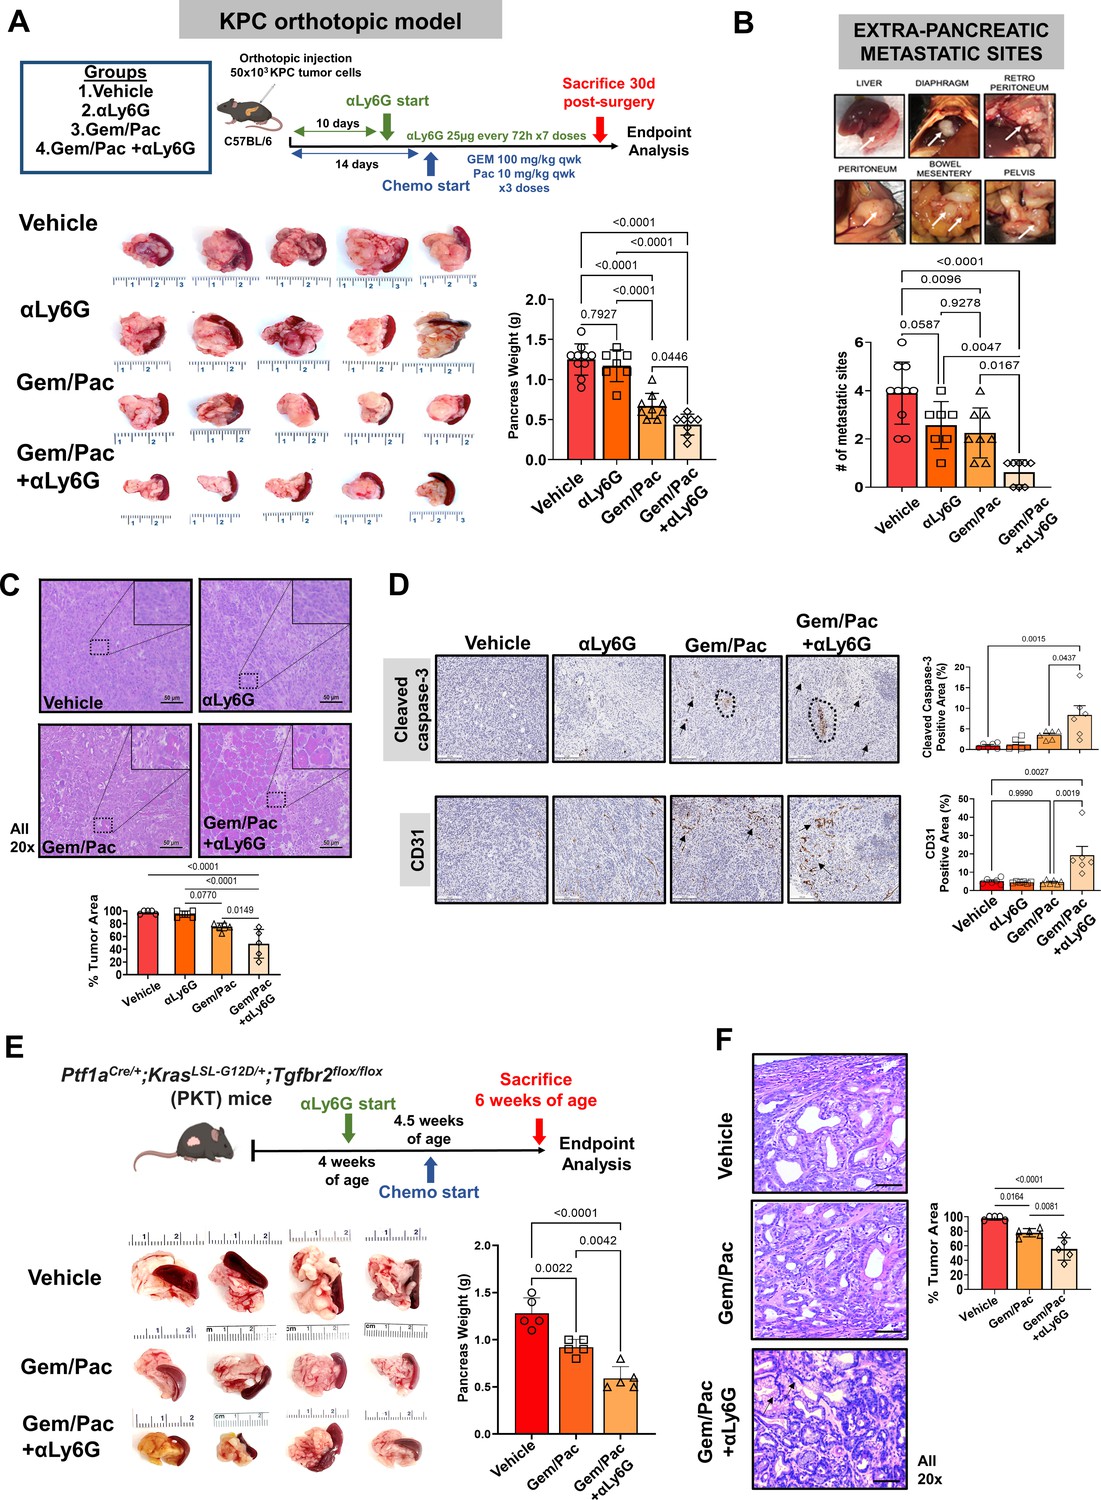
Attenuating neutrophil-to-lymphocyte ratio (NLR) improves sensitivity to chemotherapy in preclinical models of pancreatic cancer.
(A) Schematic of in vivo experimental design, illustrating treatment groups utilized (vehicle, anti-Ly6G [αLy6G] alone, gemcitabine/paclitaxel alone, and gemcitabine/paclitaxel+αLy6G), treatment timing, and schedules/regimens in KPC orthotopic model (top). Representative images (n=5 biologic replicates) from primary pancreatic tumors at endpoint analysis in each treatment group and adjoining histogram demonstrating differences in whole pancreas weights between treatment groups (n=8–10 mice/arm) at sacrifice are depicted (bottom); (B) Metastatic outgrowth in KPC orthotopic models of PDAC is graded by presence of tumor deposits at six extra-pancreatic sites; a representative example from a vehicle-treated mouse in these experiments is shown. Adjoining histogram depicts comparison of the frequency of extra-pancreatic metastatic involvement (values 1 through 6 for each mouse) across treatment groups (n=8–10 mice/group); (C) Representative images of tumor sections from each treatment group stained by H&E to demonstrate tumor area (all 20 x; scale bar = 50 μm), with high-magnification insets (40 x) indicating relevant areas on these representative sections. Slides from each treatment group were blinded, and %tumor area quantified by a board-certified pathologist (n=5 from each treatment group). This comparison is depicted in adjoining histogram; (D) Representative images of tumor sections stained for cleaved caspase-3 (CC-3) and CD31 from each treatment group (n=5; all 20 x; scale bar = 200 μm). Dotted circles and arrows represent areas of positive staining. Adjoining histograms show quantification of cleaved caspase-3 and CD31 staining across treatment groups (n=5 mice/group); (E) Representative images from primary pancreatic tumors at endpoint analysis in indicated treatment groups in the Ptf1aCre/+;KrasLS-L-G12D/+;Tgfbr2flox/flox (PKT) genetically engineered mouse (GEM) model. Adjoining histogram shows differences in whole pancreas weights between treatment groups (n=5 mice/arm) at sacrifice; (F) Representative images of tumor sections from indicated treatment groups in PKT GEM experiments stained by H&E to demonstrate tumor area (all 20 x, error bar = 20 μm), with comparisons between groups depicted in adjoining histogram. Arrows in the Gem/Pac+αLy6G group show non-malignant epithelial structures. All in vivo experiments were repeated once for reproducibility, and all data points represent biologic replicates. All between-group statistics represent multiple comparison testing using Tukey’s post-hoc instrument in one-way ANOVA.
Figure 3
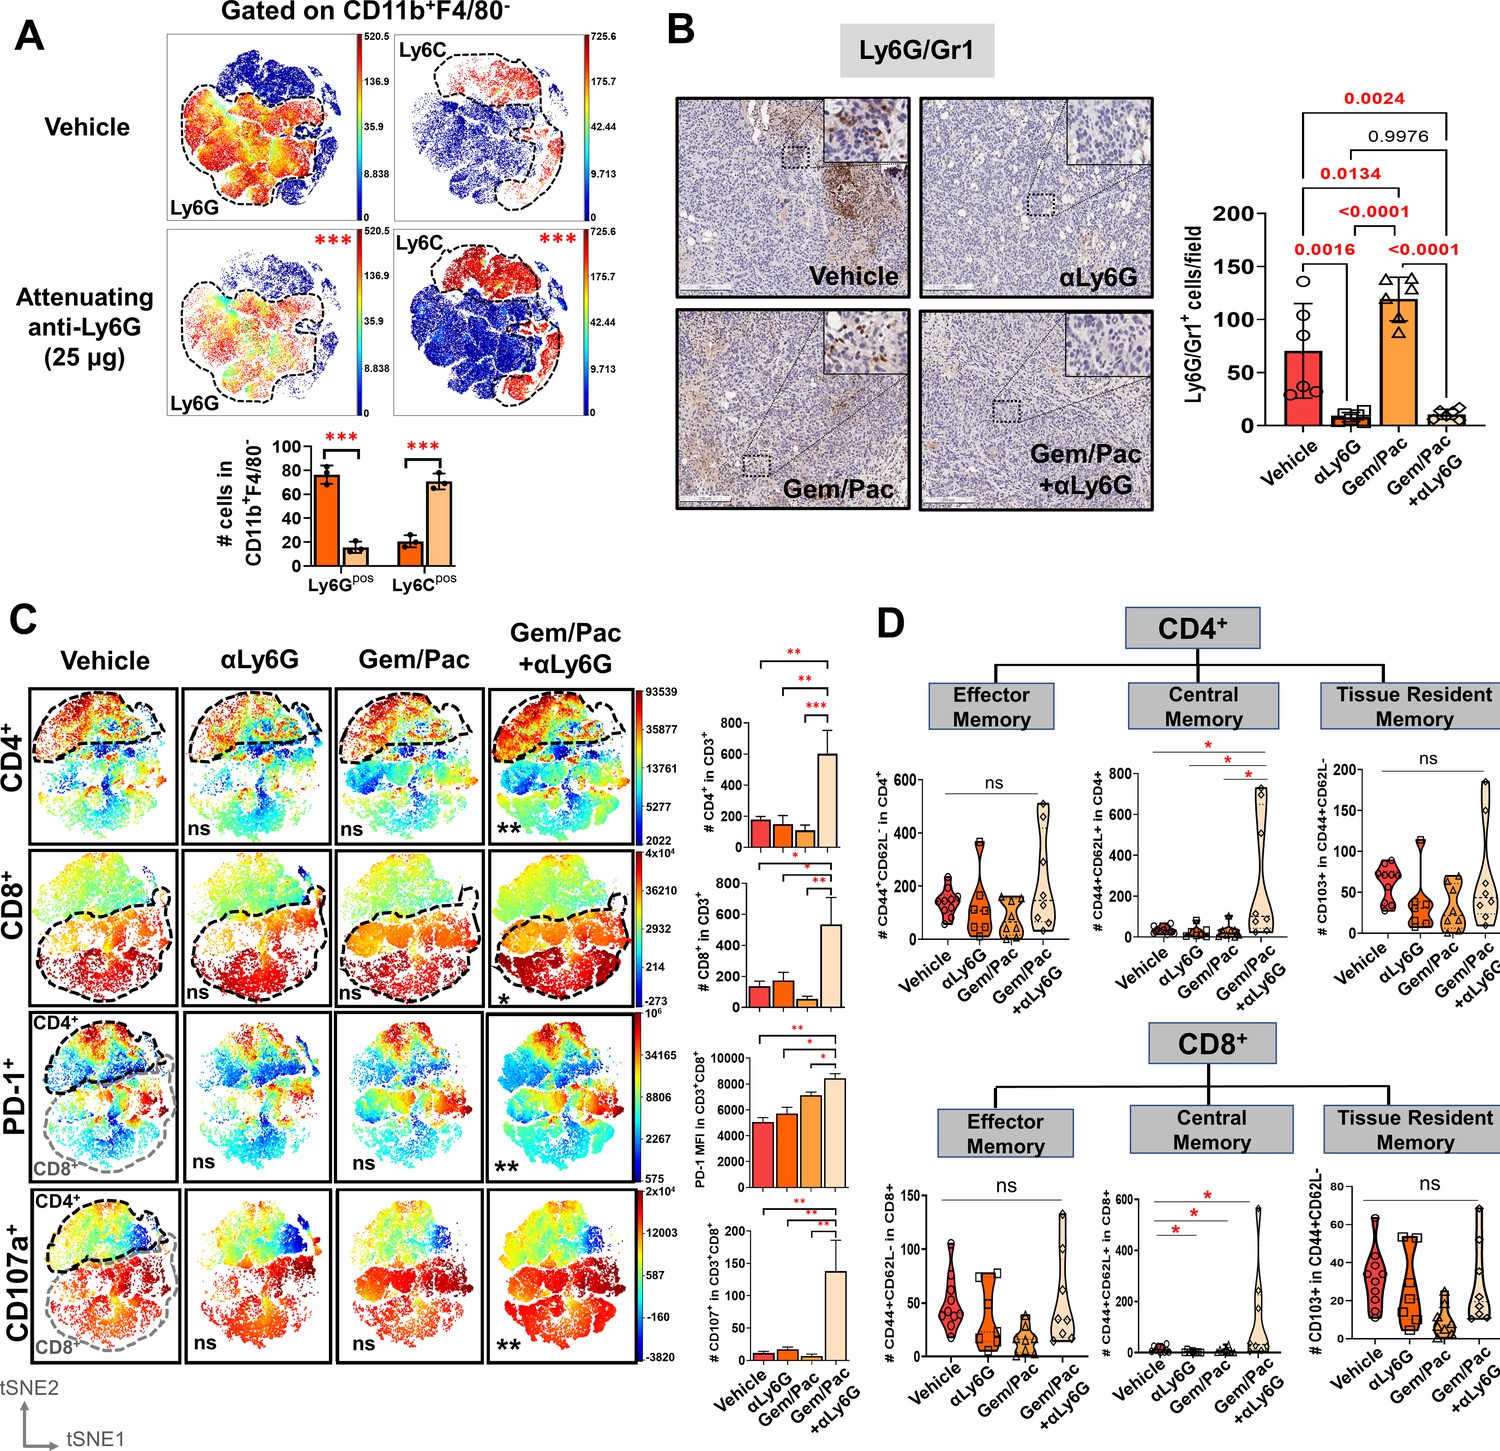
Improved chemosensitivity following neutrophil attenuation in pancreatic cancer is associated with anti-tumor adaptive immunity.
(A) viSNE maps depicting comparison of splenocyte-derived circulating Ly6G+ (left) and Ly6C+ (right) MDSCs gated within Cd11b+F4/80 cells in NLR-attenuating anti-Ly6G (25 μg) vs. vehicle-treated KPC orthotopic tumor-bearing mice (n=3 mice/arm). Asterisks representing p-values denoting comparisons between anti-Ly6G and vehicle treatment are indicated in the top right left of graph, and quantified in the adjacent histogram; (B) Representative images from orthotopic KPC tumor sections in each treatment group stained for Ly6G/Gr1 (all 20 x; scale bar = 200 μm). Ly6G/Gr1+ cells per field are quantified and depicted in the adjacent histogram. High-magnification insets (40 x) indicate relevant areas on these representative sections; (C) viSNE maps of total intratumoral CD4+ and CD8+ T-cells gated within CD45+/CD11b-/CD3+ T cells across treatment groups (top), and viSNE maps of PD-1+ and CD107a+ in total CD45+/CD11b-/CD3+ T-cells, stratified by CD4+ (black dotted outline) and CD8+ (grey dotted outline) T-cells by flow cytometry across treatment groups (bottom; n=8–10 mice/group). Asterisks representing p-values denoting comparisons between each treatment group and vehicle treatment are indicated in the bottom left of graph. Post-hoc Tukey analysis from one-way ANOVA comparisons between treatment groups for each cell subset are shown in adjoining histograms; (D) Violin plots depicting the number of intratumoral effector memory (CD44+CD62L-), central memory (CD44+CD62L+CD103-), and tissue-resident memory (CD44+CD62L-CD103+) cells in CD4+ (left) and CD8+ (right) T-cell compartments across the four treatment arms (n=8–10 mice/group). All experiments were repeated once for reproducibility, and all data points represent biologic replicates; *, p<0.05; **, p<0.01; ***, p<0.001.
Figure 4
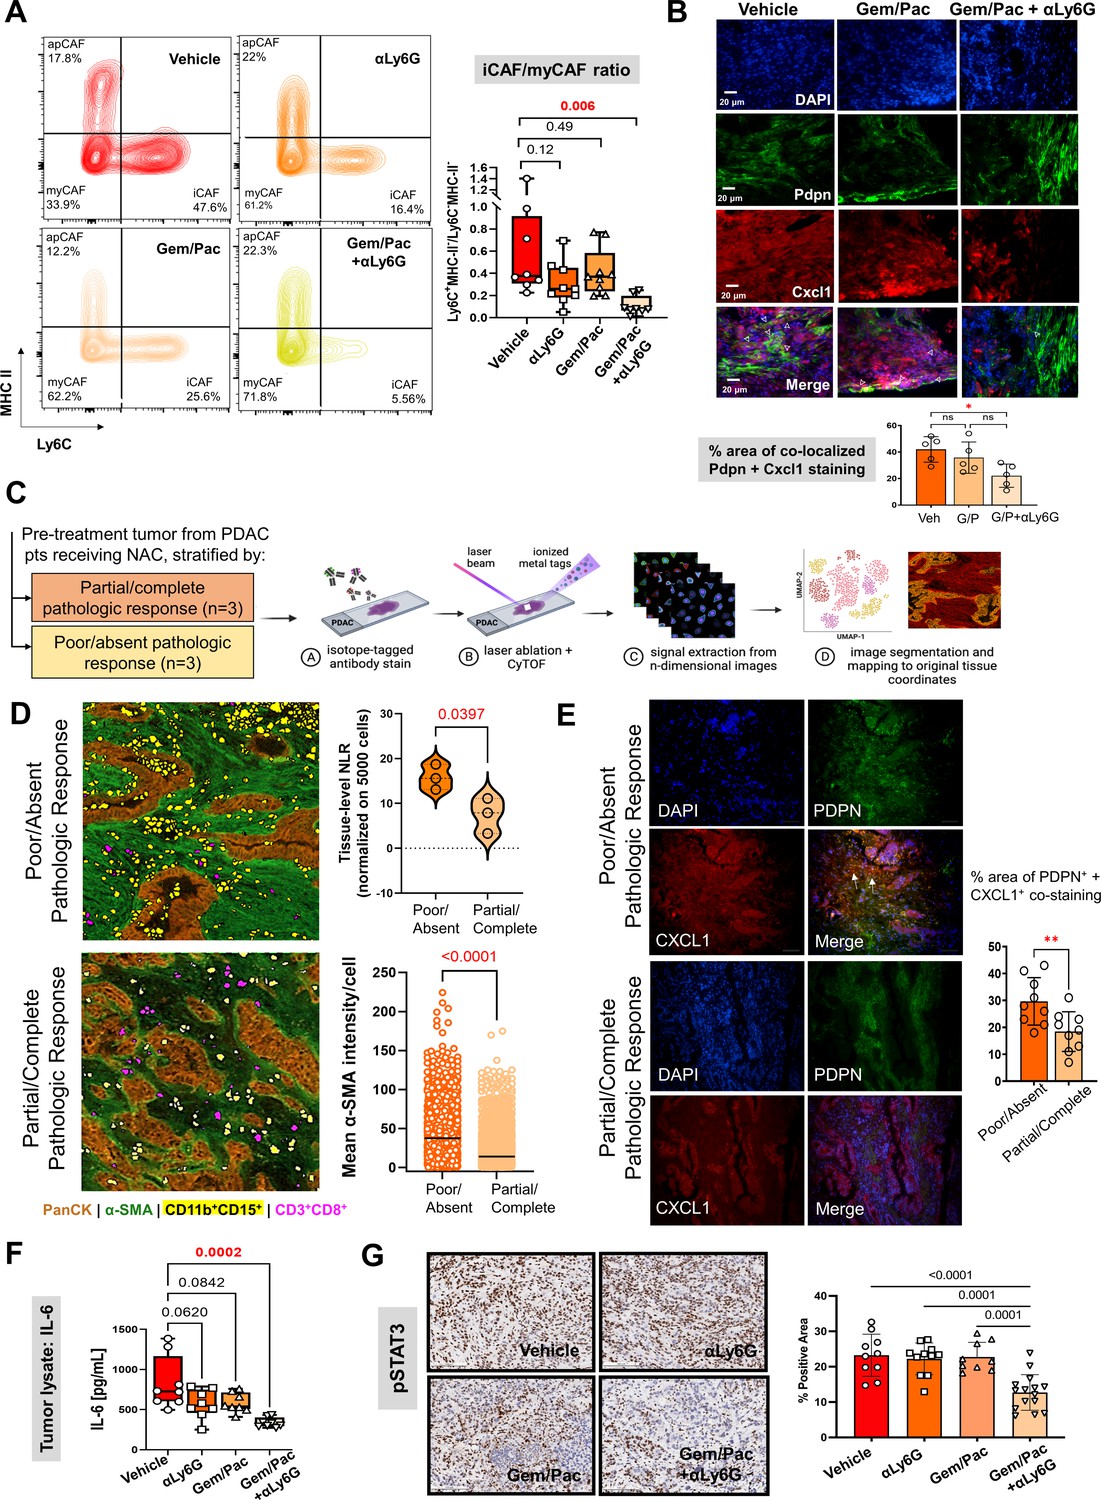
Improved chemosensitivity with attenuated NLR is associated with reduction in inflammatory CAF abundance and IL-6/STAT-3 signaling in the tumor microenvironment.
(A) Representative contour plots of CD45-CD31-PDPN+ cancer-associated fibroblasts (CAF) gated on Ly6C and MHC-II across vehicle, NLR-attenuating αLy6G, gemcitabine plus paclitaxel (Gem/Pac) alone, and Gem/Pac+ αLy6G treatment groups in orthotopic KPC tumor-bearing mice (n=8–10 mice/group) based on percentages of parental cell populations. Inflammatory (iCAF: Ly6C+MHC-II-), myofibroblastic (myCAF: Ly6C-MHC-II-) and antigen-presenting (apCAF: Ly6C-MHC-II+) sub-populations are indicated in their respective quadrants. Relative ratios of iCAF/myCAF subsets are quantified in adjacent box-and-whisker plots across treatment groups; (B) Immunofluorescent staining for Pdpn (marking CAF), Cxcl1, and merged images (all 20 x; scale bar = 20 μm) from representative tumor sections in PKT mice treated with vehicle, Gem/Pac and Gem/Pac + αLy6G (n=5 mice/arm). Arrows indicate regions with co-localized stromal Pdpn and Cxcl1 staining, with adjacent histogram quantifying % area per section from each biologic replicate with co-localized stromal Pdpn and Cxcl1 staining; (C) Schematic representation of imaging mass cytometry (IMC) workflow to provide spatially resolved single-cell phenotypes of human PDAC tumors derived from pre-treatment specimens which underwent neoadjuvant chemotherapy and ultimately demonstrated partial/complete or poor/absent pathologic response (n=3 each); (D) Single-cell segmentation of CD11b+CD15+ neutrophils and CD3+CD8+ T-cells mapped onto representative tissue section from tumors showing poor/absent and partial/complete response, with epithelial (PanCK) and stromal (α-SMA) territories also shown. Adjacent violin plot (top) quantifies tissue-level neutrophil-to-lymphocyte (NLR) across three tumors in each group, calculated as #CD11b+CD15+÷ #CD3+CD8+ cells (normalized to 5000 total single cells), while histogram (bottom) tabulates mean pixel intensity of α-SMA expression in stromal cells across three tumors each in partial/complete vs. poor/absent responder cohorts; (E) Immunofluorescent staining for PDPN (marking CAF), CXCL1, and merged images (all 20 x) in representative sections from the same tumors shown in (D) stratified by poor/absent vs. partial/complete response. White arrows indicate regions with co-localized stromal PDPN and CXCL1 staining, with adjacent histogram quantifying % area with co-localized stromal PDPN and CXCL1 staining. For the latter comparison, three separate sections from each biologic replicate (n=9 total sections) were used for latter comparison; (F) Quantification of IL-6 ELISA (pg/ml) from whole tumor protein lysates across vehicle, αLy6G-treated, gemcitabine +paclitaxel (Gem/Pac) alone-treated, and Gem/Pac+αLy6G-treated orthotopic KPC tumor-bearing mice (n=8–10 mice/group); (G) Representative images from tumor sections in each treatment group (n=5 mice/group) stained for phospoSTAT3 (all 20 x; scale bar = 200 μm), and adjacent bar graph showing quantification of % positive area of pSTAT3 in the epithelial compartment per field. All between-group statistics represent multiple comparison testing using Tukey’s post-hoc instrument in one-way ANOVA. When absolute p-values not provided: *, p<0.05; **, p<0.01.
Figure 5

Neutrophil-derived IL-1β induces pancreatic fibroblast-tumor cell IL-6/STAT-3 signaling.
(A) Bubble plot representing multiplex cytokine array performed on condition media from column-sorted Ly6G+F4/80- neutrophils (24-hr culture) derived from whole pancreata of KPC orthotopic mice. The chemiluminescent intensity of the six most robustly expressed cytokines is quantified as mean pixel density; (B) Quantification of IL-1β ELISA (pg/ml) from whole tumor protein lysates from vehicle, NLR-attenuating αLy6G, gemcitabine plus paclitaxel (Gem/Pac) alone, and Gem/Pac+ αLy6G treatment groups in orthotopic KPC tumor-bearing mice (n=9 mice/group); (C–D) Schematic of experimental design illustrating ex vivo co-culture of KPC CAFs with intratumoral column-sorted Ly6G+F4/80 cells from whole pancreata of KPC orthotopic mice, with or without pre-treatment of CAFs with anakinra (α-IL1R1 antibody) or pre-treatment of neutrophils with α-IL-1β neutralizing antibody (left); (C) qPCR analysis representing relative fold change in Il6 gene expression, and (D) quantification of IL-6 ELISA (pg/ml) from conditioned media collected from co-culture conditions comparing CAFs alone with CAFs co-cultured with intra-tumoral neutrophils with or without anakinra or α-IL-1β antibody pre-treatment. Results show mean ± SEM of three biologic replicates; (E) Western blot analysis of pSTAT3Y705 and total STAT3 (tSTAT3) levels from KPC tumor cell lysates following incubation with conditioned media (CM) from ex vivo intratumoral neutrophil (NP)-CAF co-cultures, either alone or treated with anti-IL-1β or IL-6 neutralizing antibodies. All experiments were repeated once for reproducibility, and all data points represent biologic replicates. All between-group statistics represent multiple comparison testing using Tukey’s post-hoc instrument in one-way ANOVA; (F) Graphical summary of proposed neutrophil-CAF-tumor cell IL-1β/IL-6/STAT-3 signaling axis that underlies the associated between NLR dynamics and chemotherapy response in PDAC. When absolute p-values not provided: *, p≤0.05; **, p≤0.01; ***, p≤0.001.
Appendix 1—figure 1
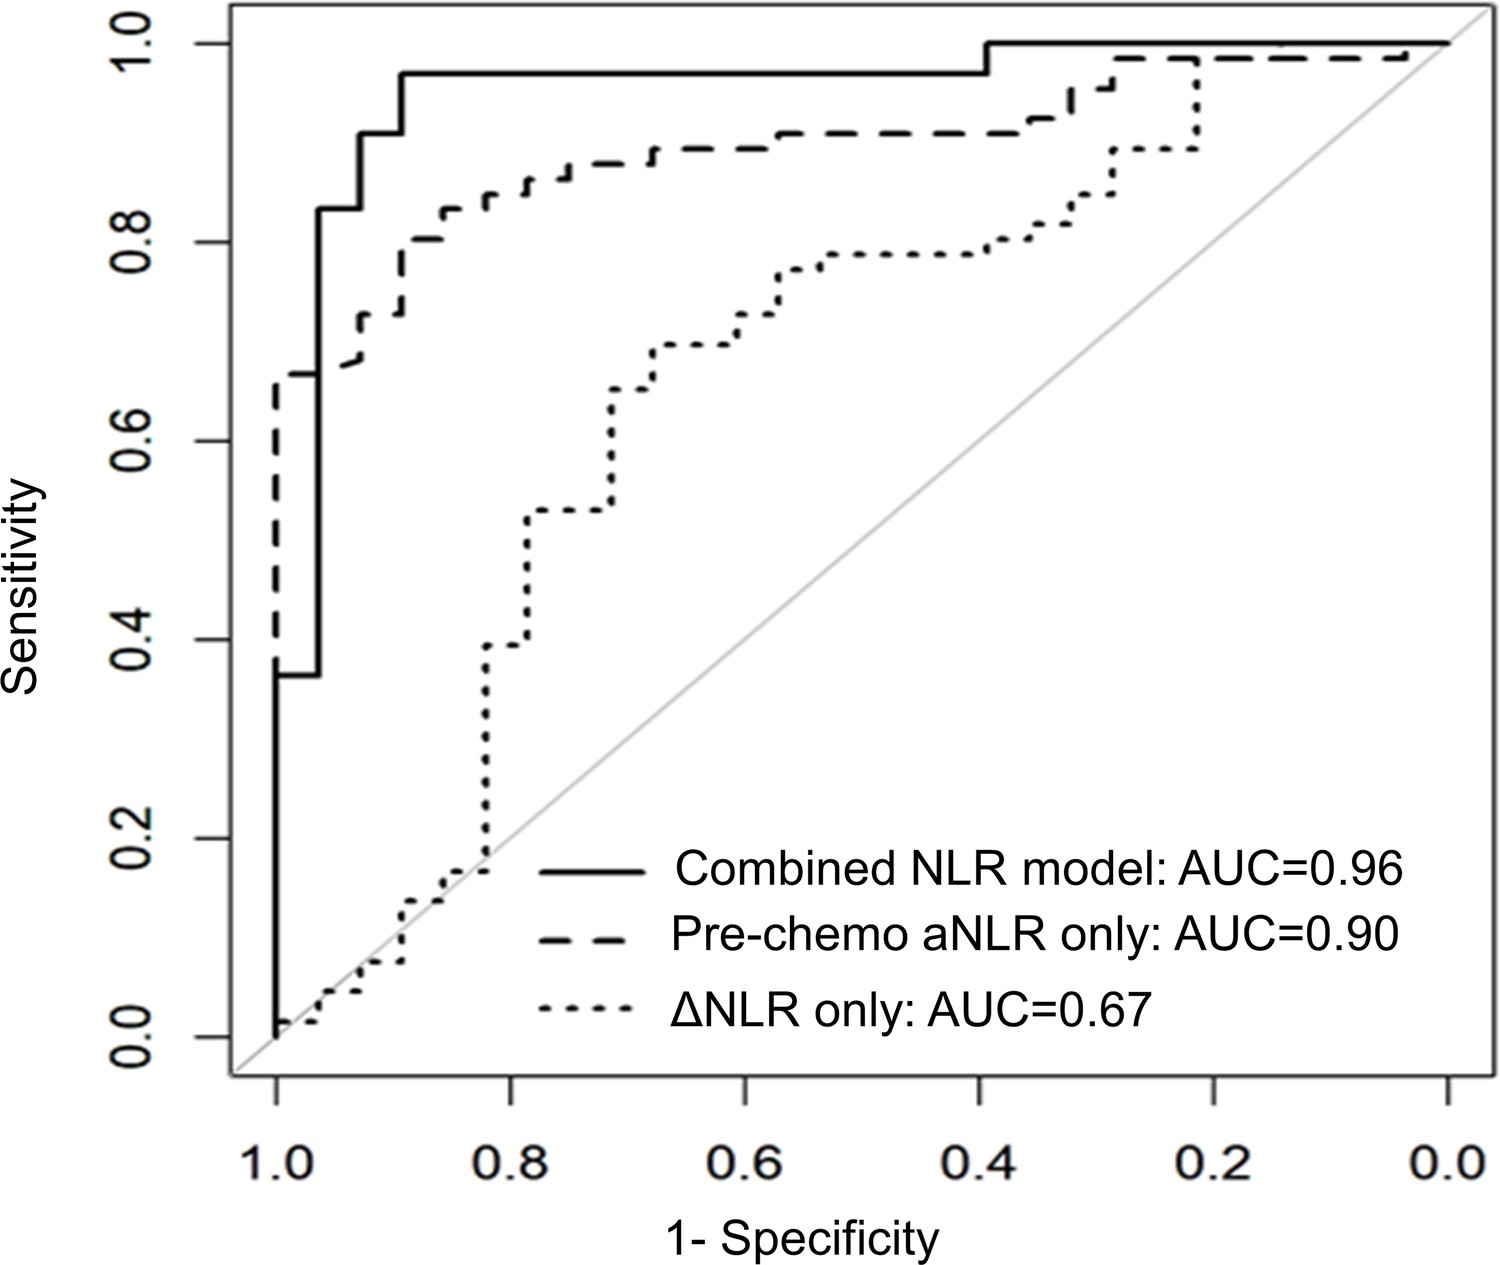
NLR dynamics during neoadjuvant chemotherapy (NAC) are associated with pathologic response in patients undergoing resection for pancreatic cancer.
Area under the receiver operating characteristic curve (AUC) statistics estimating the predictive capacity of three biomarker models (pre-chemotherapy aNLR only, ΔNLR only, combined model aNLR + ΔNLR) for pathologic response, internally validated with bootstrap logistic regression.
Appendix 1—figure 2
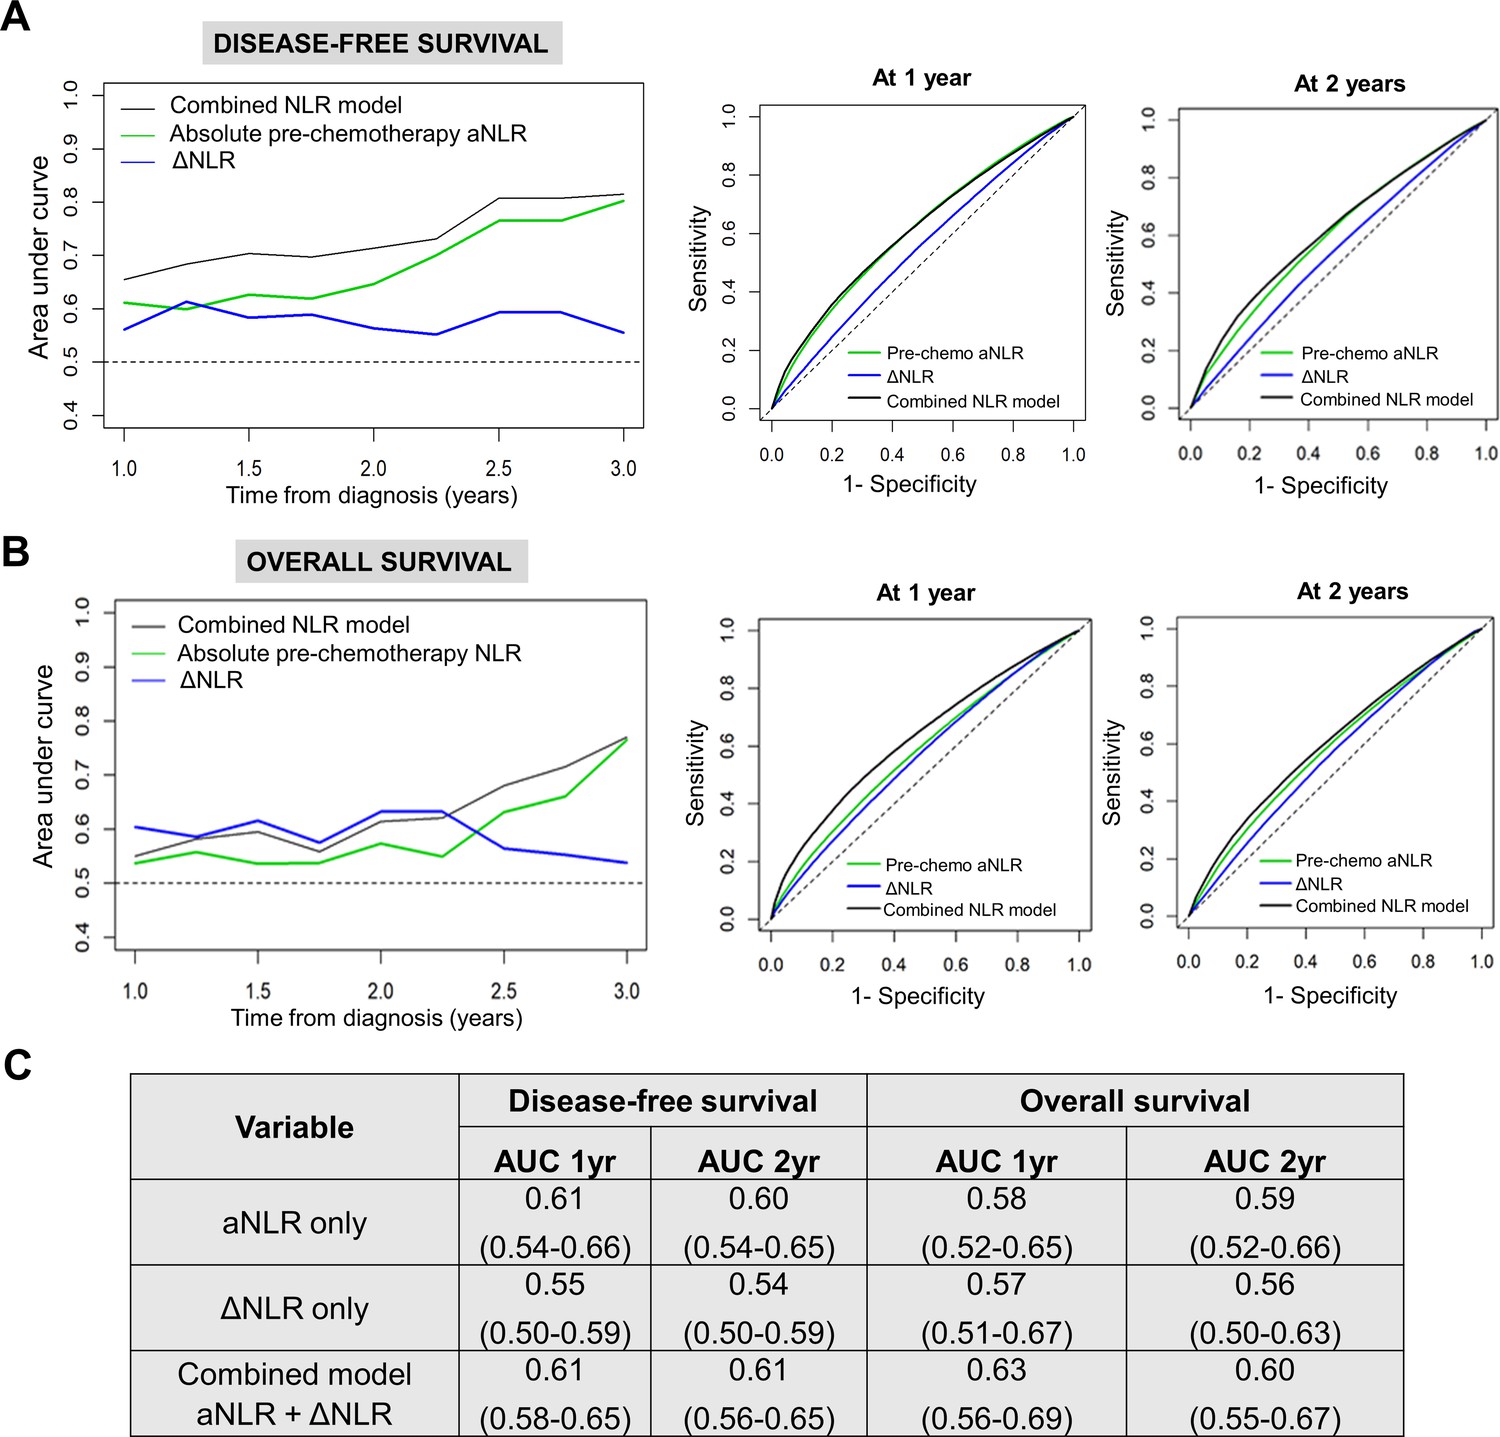
NLR dynamics during neoadjuvant chemotherapy (NAC) are associated with survival in patients undergoing resection for pancreatic cancer.
Time-dependent AUC analysis with internal bootstrap validation examining the three biomarker models for (A) disease-free survival (DFS; left) and (B) overall survival (OS; left) for years 1–3. Corresponding time-specific receiver operating characteristic curves for 1 year and 2 years for both DFS and OS are shown (right); (C) Table showing reported mean AUC along with 95% confidence intervals for the three predictive biomarker models at 1 year and 2 years for DFS and OS.
Appendix 1—figure 3

Titration of non-depleting NLR attenuating anti-Ly6G antibody dosing in a preclinical model of PDAC.
(A) Representative flow cytometry contour plots depicting circulating splenocyte-derived Ly6G+ (top) and CD3+ (bottom) cell populations 2 weeks following anti-Ly6G dose titration experiment to identify NLR attenuating—but not depleting—dose. Histograms represent ratio of Ly6G+:CD3+ cells across different treatment arms (n=3 mice each). Based on these studies, we selected 25 µg dose because it reduced NLR by 50%; (B) Histogram representing Ly6G+:CD3+ ratio in vehicle treatment vs. gemcitabine/paclitaxel treatment to demonstrate the effect on circulating NLR with chemotherapy treatment in our murine model (n=8–10 mice per group).
Appendix 1—figure 4
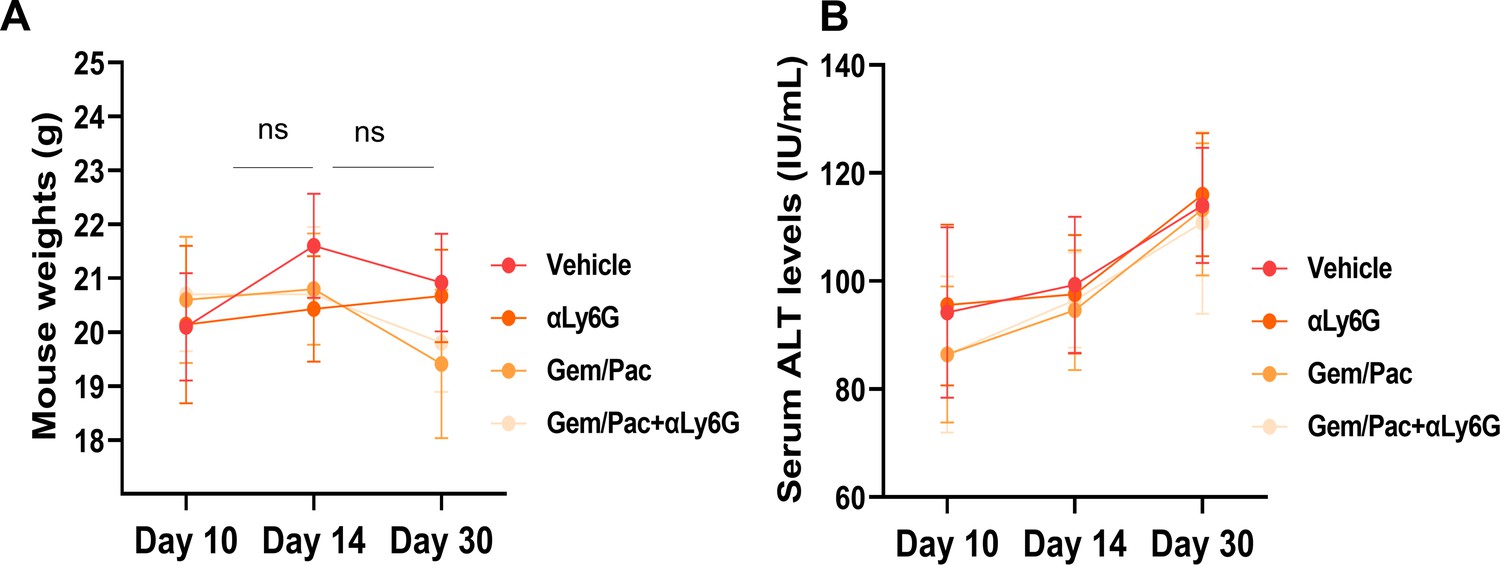
NLR attenuation with or without systemic chemotherapy in preclinical models of PDAC does not increase treatment-related toxicity.
(A) Mean (± standard deviation) body weights, and (B) mean ± SD of alanine transferase (ALT) levels from blood of mice in each cohort (n=8–10/group) graphed at 3 time points based on treatment initiation and sacrifice, to assess treatment-related toxicity; ns: not significant.
Appendix 1—figure 5
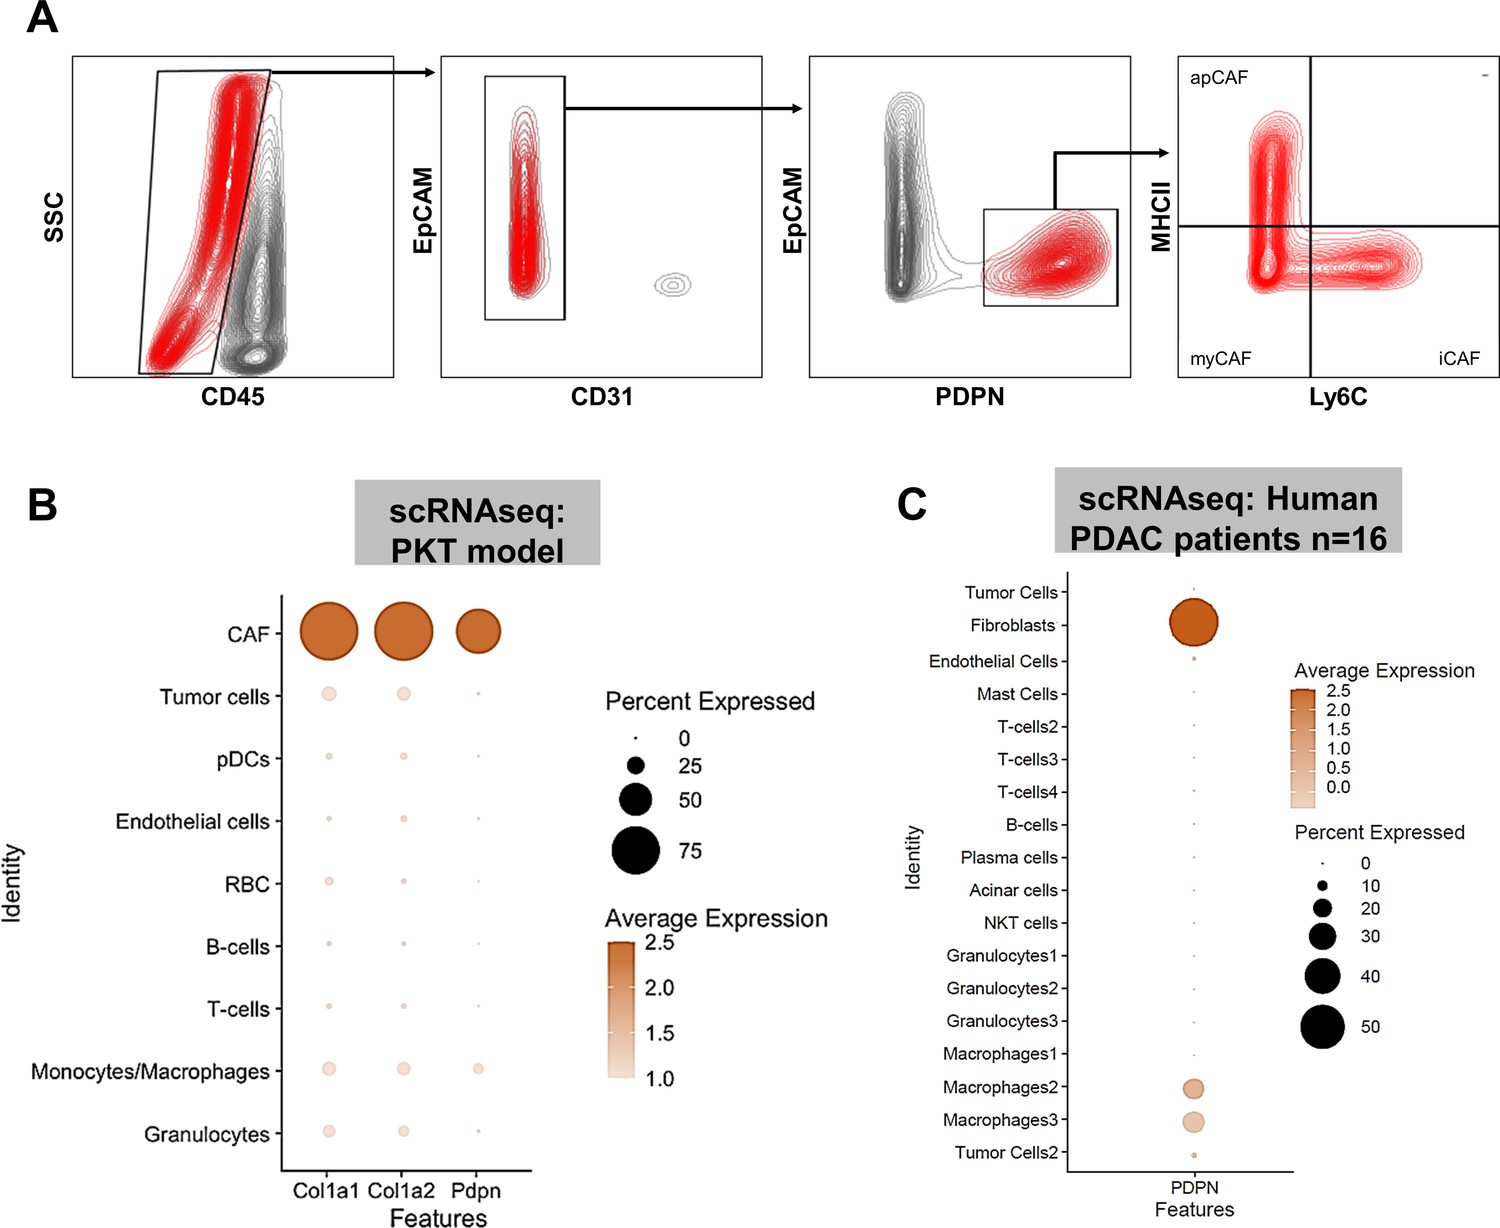
PDPN is a marker of pancreatic tumor-associated cancer associated fibroblasts (CAF).
(A) Gating strategy for flow cytometric analysis of PDPN+ CAF populations after exclusion of CD45+, EpCAM+, and CD31+ cells; (B) Dot plot from single cell RNA sequencing (scRNAseq) dataset [reference 13] showing near-exclusive expression of Pdpn in CAF subcluster nominated by Col1a1 and Col1a2 expression; (C) scRNAseq data from human PDAC patients [reference 14] showing near-exclusive expression of PDPN in tumor-associated fibroblast clusters. In (B) and (C), expression density and percent expression in respective sub-cluster is indicated in adjoining legends.
Appendix 1—figure 6
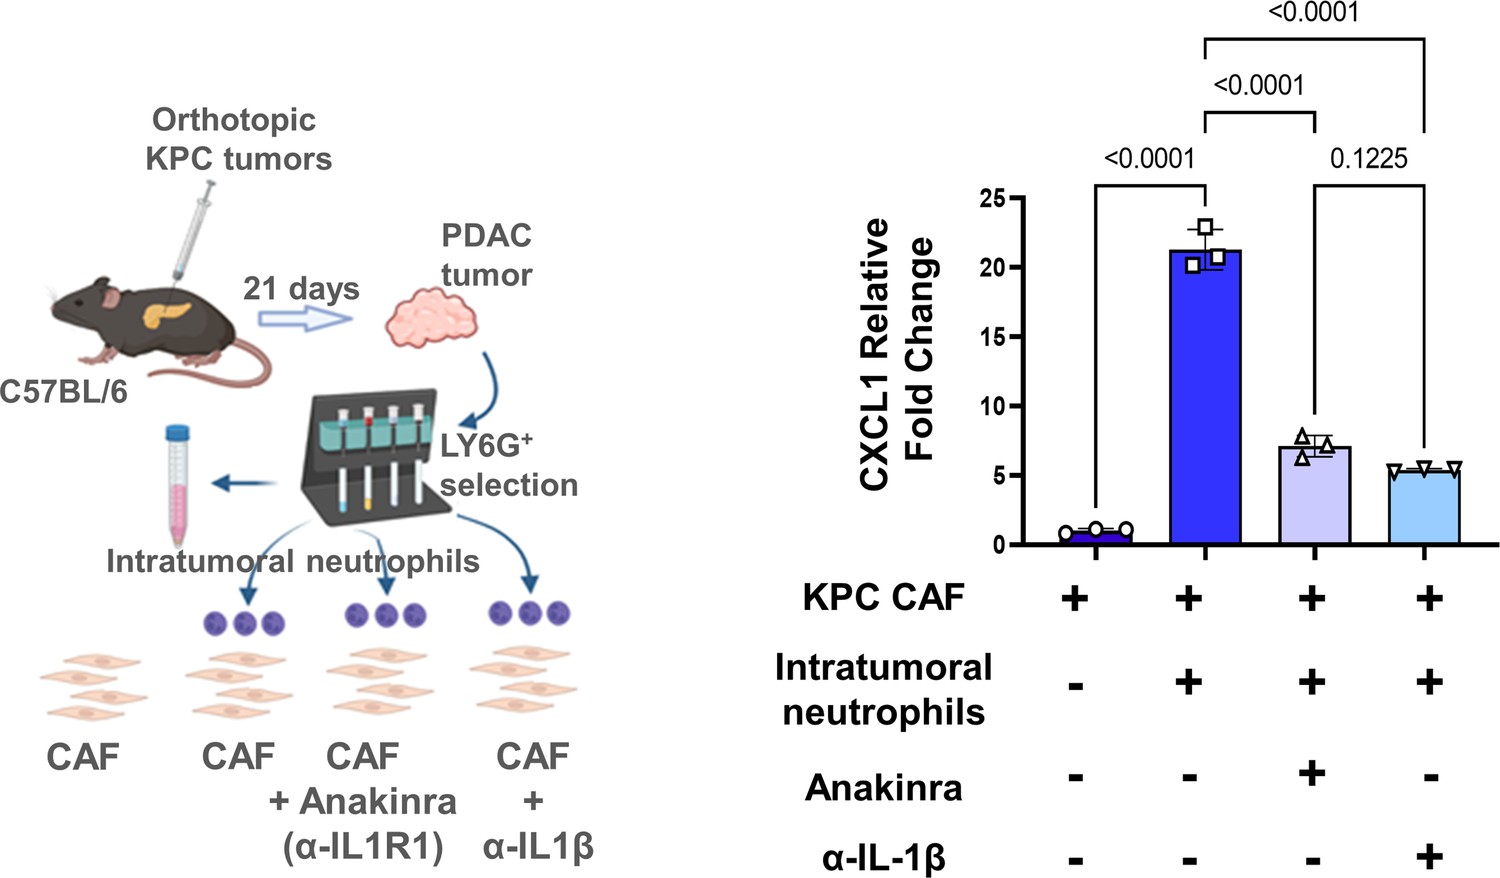
Neutrophil-derived IL-1β is a novel mediator of inflammatory CAF polarization in pancreatic cancer.
Schematic of experimental design illustrating ex vivo co-culture of KPC CAFs with intratumoral column-sorted Ly6G+F4/80 cells from whole pancreata of KPC orthotopic mice, with or without pre-treatment of CAFs anakinra (α-IL1R1 antibody) or pre-treatment of neutrophils with α-IL-1β neutralizing antibody (left). qPCR analysis representing relative fold change in Cxcl1 gene expression comparing CAFs alone with CAFs co-cultured with intra-tumoral neutrophils with or without anakinra or α-IL-1β antibody pre-treatment (right). Results show mean ± SEM of three biologic replicates; *, p<0.05; **, p<0.01; ***, p<0.001
Appendix 1—figure 7
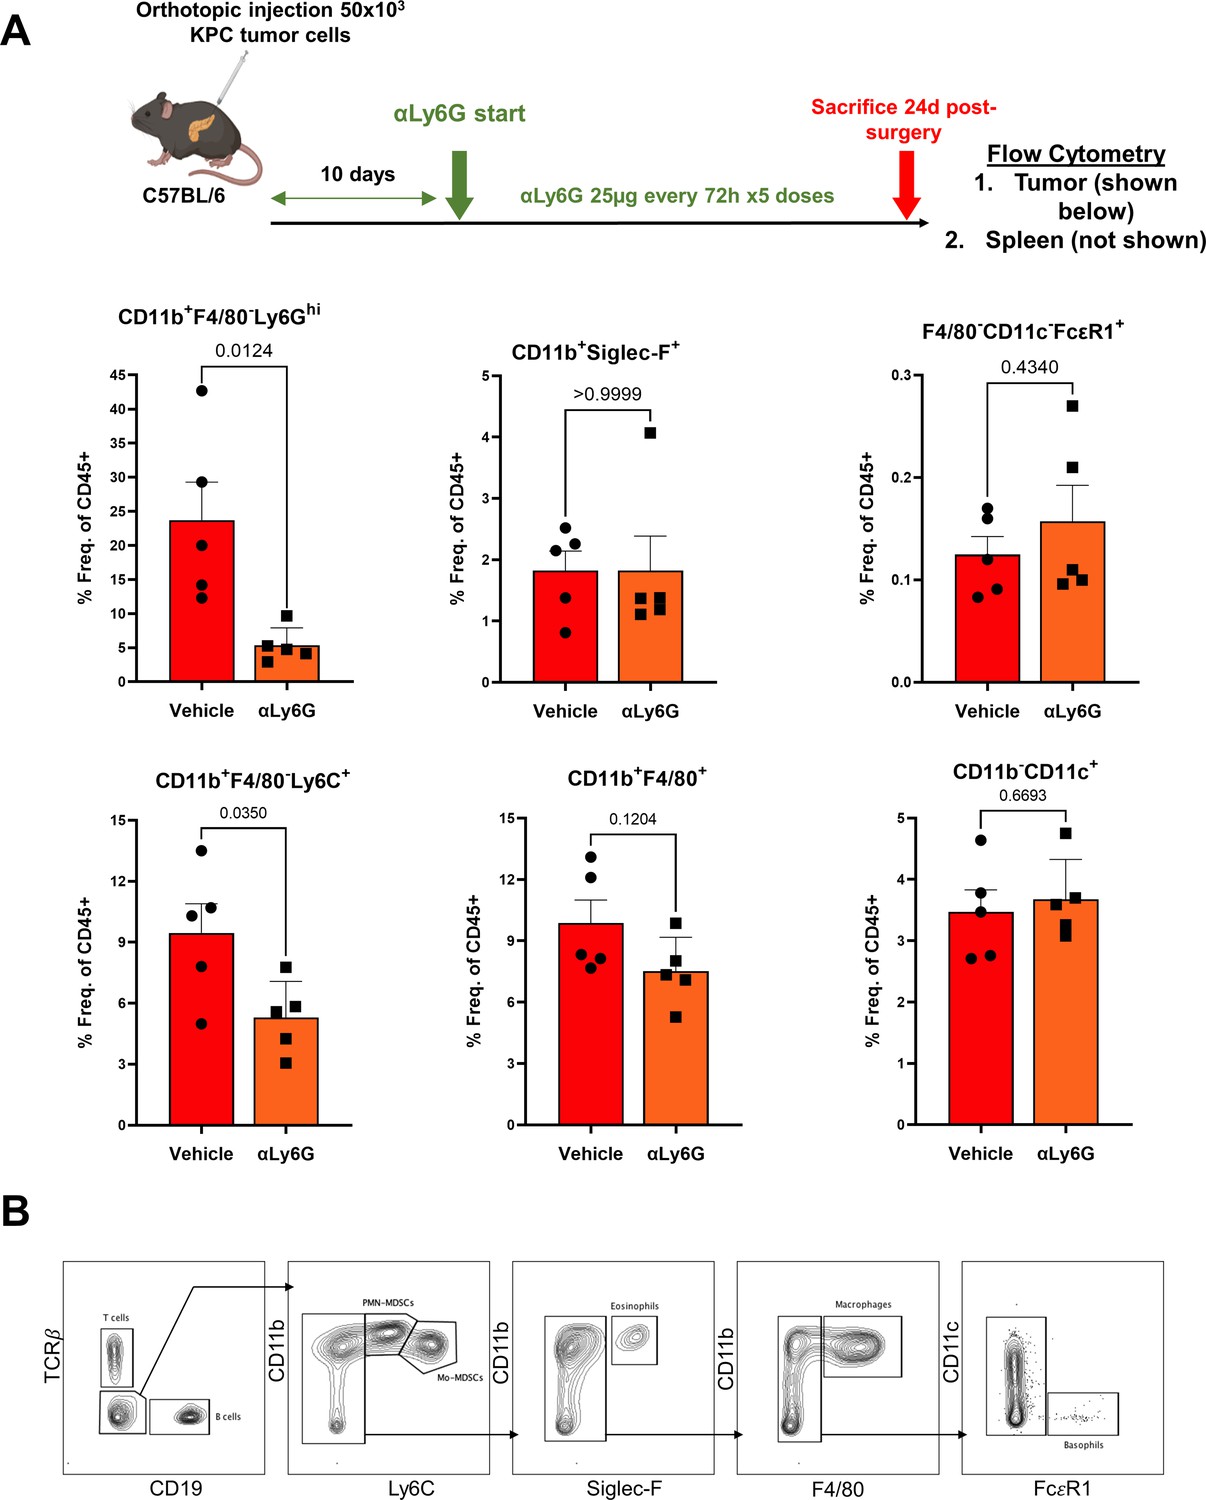
Anti-Ly6G antibody specifically targets PDAC-associated neutrophils, but not other granulocytic populations.
(A) Schematic of experimental design showing timing/dosing of anti-Ly6G treatment in orthotopic KPC tumor-bearing mice (top), with adjacent histograms showing (% of parent CD45+ cells) relative proportions of intratumoral neutrophils/PMN-MDSCs (CD11+F4/80-Ly6Ghi), eosinophils (CD11b+F4/80-Siglec-F+), basophils (F4/80-CD11c-FcεR1+), monocytic-MDSCs (CD11b+F/480-Ly6C+), macrophages (CD11b+F4/80+), and dendritic cells (CD11b-CD11c+); (B) Gating strategy for flow cytometric analysis shown in (A).
Tables
Key resources table
| Reagent type (species) or resource | Designation | Source or reference | Identifiers | Additional information |
|---|---|---|---|---|
| Cell line (Mus musculus) | Pancreatic Tumor Cells from KrasLSL-12D/+;Trp53R172H/+;Pdx1Cre (KPC) mouse | Ben Stanger/UPenn | KPC6694c2 | |
| Cell line (Mus musculus) | Tumor associated fibroblasts from KPC mouse | Nagathihalli et al., 2016 | KPC CAFs | |
| Other | Ptf1aCre/+;KrasLSL-G12D/+;Tgfbr2flox/flox | Datta et al., 2022 | PKT | Genetically engineered mouse |
| Antibody | Anti-Ly6G (Rat monoclonal) reactive to mouse | BioXcell | Clone 1A8 Catalog# BE0075-1 | 25 μg/dose |
| Antibody | Anti-IL-1β neutralizing antibody (E. coli, polyclonal) | R&D Systems | Catalog# AF-401-NA | 1:80 |
| Antibody | Cxcl1 (Rabbit, monoclonal) Reactive to human and mouse | Abcam | Catalog# ab86436 | 1:500 |
| Antibody | Podoplanin (Mouse, monoclonal) Reactive to human | Cell Signalling | Catalog# 26981 | 1:200 |
| Antibody | Podoplanin (Syrian hamster, monoclonal) Reactive to mouse | Abcam | Catalog# ab92319 | 1:200 |
| Antibody | CD3 (170Er, Human, monoclonal) 3170019D | Fluidigm | 3170019D | 1:1000 |
| Antibody | CD11B (149Sm, Human, monoclonal) | Fluidigm | 3149028D | 1:1000 |
| Antibody | α-SMA (141Pr, Human, monoclonal) | Fluidigm | 314017D | 1:1000 |
| Antibody | Pan-Cytokeratin (148Nd, Human, monoclonal) | Fluidigm | 3148022D | 1:1000 |
| Antibody | CD15 (164Dy, Human, monoclonal) | Fluidigm | 3164001B | 1:1000 |
| Antibody | CD8 (146Nd, Human, monoclonal) | Fluidigm | 3146001B | 1:1000 |
| Chemical compound, drug | Anakinra | SOBI Pharmaceuticals | α-IL-1R1 inhibitor | |
| Sequence-based reagent | Cxcl1 Primer - Mouse | Qiagen | Gene ID - QT00115647 | |
| Sequence-based reagent | Il6 Primer - Mouse | Qiagen | Gene ID - QT00098875 | |
| Commercial assay or kit | Cytokine array - Mouse | R&D Systems | ARY006 |
Appendix 1—table 1
Clinicopathological characteristics of study-eligible patients with localized pancreatic ductal adenocarcinoma who received neoadjuvant chemotherapy (NAC) and underwent curative-intent pancreatectomy (BMI: body mass index; HRD: Homologous Recombination Deficiency; ECOG: Easter Cooperative Oncology Group; CAP: College of American Pathology; G-CSF: Granulocyte-colony stimulating factor).
| Variable | All patients (n=94) | Complete/ partial response to NAC (n=66) | Absent/poor response to NAC(n=28) | P-value |
|---|---|---|---|---|
| Age (mean ± SD) | 67.3±10.3 | 67.5±10.9 | 66.9±8.9 | 0.78 |
| Female gender, n (%) | 58 (61.7 %) | 41 (62.1%) | 17 (60.7%) | 0.89 |
| Diagnosis BMI, (mean ± SD) | 26.7±4.9 | 26.8±5 | 26.4±4.6 | 0.68 |
| Hispanic Ethnicity, n (%) | 43 (45.8%) | 30 (45.5%) | 13 (46.4%) | 0.64 |
| Germline HRD mutation, n (%) Germline HRD mutation No germline HRD mutation | 6 (6.3%) 88 (93.7%) | 6 (9.1%) 60 (91.9%) | 0 (0%) 28 (100%) | 0.17 |
| Pre-chemotherapy Absolute Blood Counts Total Leukocyte count (103 /μl) Neutrophil count (%) Lymphocyte count (%) Platelet count (103 /μl) | 7.2±1.6 65.3±7.3 22.3±7.0 243±71.5 | 7.2±1.8 63.7±6.9 24.8±6.7 246±69.5 | 7.25±1.5 69.7±4.1 17.6±3.5 234±77.3 | 0.92 <0.001 <0.001 0.59 |
| Pre-chemotherapy Neutrophil/Lymphocyte Ratio (median ± SD) | 3.0±1.3 | 2.5±1.0 | 3.9±1.2 | <0.001 |
| Diagnosis CA 19–9 levels (median ± SD) | 181±1,823 | 147±923 | 202±2,944 | 0.50 |
| Pre-Surgery Absolute Blood Counts Total Leukocyte count (103 /ul) Neutrophil count (%) Lymphocyte count (%) Platelet count (* 103 /ul) | 7±1.92 63.2±9.5 23.6±7.7 198±74.1 | 6.1±1.72 60±7.8 26.5±6.4 203±57.8 | 8.5±1.95 71±6.25 16.7±4.7 181±104 | 0.01 <0.001 <0.001 0.03 |
| Pre-Surgery Neutrophil/ Lymphocyte Ratio (median ± SD) | 2.6±1.57 | 2.3±0.78 | 4.2±1.68 | <0.001 |
| ΔNLR (=Pre-Surgery-Pre-Chemo NLR) (median ± SD) | - 0.1±1.25 | - 0.38±1.1 | 0.21±1.5 | 0.01 |
| ECOG Status, n (%) 0 1 2 | 36 (38.3%) 49 (52.1%) 9 (9.6%) | 27 (40.9%) 34 (51.5%) 5 (7.6%) | 9 (32.1%) 15 (53.6%) 4 (14.3%) | 0.51 |
| Tumor location Head Body Tail | 76 (80.8%) 9 (9.6%) 9 (9.6%) | 53 (80.3%) 6 (9.1%) 7 (10.6%) | 23 (82.1%) 3 (10.7%) 2 (7.2%) | 0.96 |
| Resectability status Resectable Borderline resectable Locally advanced | 21 (22.3%) 50 (53.2%) 23 (24.5%) | 15 (22.7%) 36 (54.6%) 15 (22.7%) | 6 (21.4%) 14 (50.0%) 8 (28.6%) | 0.83 |
| Radiographic tumor size (median ± SD) | 30±14.2 | 30±10.7 | 28.5±20.2 | 0.19 |
| Neoadjuvant Chemotherapy Gemcitabine/Abraxane FOLFIRINOX Both | 35 (37.2%) 49 (52.2%) 10 (10.6%) | 26 (39.4%) 33 (50.0%) 7 (10.6%) | 9 (32.1%) 16 (57.1%) 3 (10.8%) | 0.79 |
| Duration of NAC (months)* | 4±2.3 | 4±2.2 | 4±2.6 | 0.22 |
| Use of G-CSF during NAC | 91 (96.8%) | 64 (97.0%) | 27 (96.4%) | 1.00 |
| Neoadjuvant radiation | 6 (6.4%) | 4 (6.1%) | 2 (7.1%) | 1.00 |
| Histology grade† Well Differentiated Moderately differentiated Poorly differentiated | 2 (2.1%) 59 (62.8%) 27 (28.7%) | 2 (3%) 49 (74.2%) 11 (16.7%) | 0 (0%) 10 (35.7%) 16 (57.1%) | 0.002 |
| pT classification T1 T2 T3 T4 | 27 (28.7%) 33 (35.1%) 28 (29.8%) 6 (6.4%) | 27 (40.9%) 22 (33.3%) 14 (21.3%) 3 (4.5%) | 0 (0%) 11 (39.3%) 14 (50.0%) 3 (10.7%) | <0.001 |
| pN classification Positive Negative | 52 (55.3%) 42 (44.7%) | 32 (48.5%) 34 (51.5%) | 20 (71.4%) 8 (28.6%) | 0.04 |
| Pathological Stage IA IB IIA IIB III IV | 17 (18.1%) 12 (12.8%) 10 (10.6%) 47 (50%) 7 (7.4%) 1 (1.1%) | 17 (25.7%) 9 (13.6%) 6 (9.1%) 30 (45.5%) 4 (6.1%) 0 (0%) | 0 (0%) 3 (10.7%) 4 (14.3%) 17 (60.7%) 3 (10.7%) 1 (3.6%) | 0.04 |
| Neoadjuvant therapy response (CAP grading)‡ Grade 0 Grade 1 Grade 2 Grade 3 | 0 (0%) 12 (12.8%) 54 (57.4%) 28 (29.8%) | - 12 (18.2%) 54 (81.8%) - | 28 (100%) | N/A |
| R0 resection margin Yes No (R1 resection) | 78 (83%) 16 (17%) | 61 (92.4%) 5 (7.6%) | 17 (60.7%) 11 (39.3%) | <0.001 |
| Adjuvant therapy, n (%) | 58 (61.7%) | 43 (65.2%) | 15 (53.6%) | 0.29 |
| Local Recurrence Yes No | 19 (20.2%) 75 (79.8 %) | 10 (15.2%) 56 (84.8%) | 9 (32.1%) 19 (67.8%) | 0.06 |
| Distant Recurrence Yes No | 55 (58.5%) 39 (41.5%) | 34 (51.5%) 32 (48.5%) | 21 (75%) 7 (25%) | 0.03 |
-
*
Due to variation in dose scheduling between FOLFIRINOX and gemcitabine/abraxane, duration of NAC is reported in months (vs. number of cycles)
-
†
Grade information missing in 6 patients
-
‡
College of American Pathologist (CAP) grading: Grade 0, no viable residual tumor (pathologic complete response); Grade 1, marked response (minimal residual cancer with single cells or small groups of cancer cells); Grade 2, partial response (residual cancer with evident tumor regression, but more than single cells or rare small groups of cancer cells); and Grade 3, poor or no response (extensive residual cancer with no evident tumor regression)
Appendix 1—table 2
Salient clinical characteristics and single-cell image segmentation details from imaging mass cytometry experiments comparing tissue-level neutrophil-to-lymphocyte ratio (NLR) and stromal α-SMA pixel intensity in pre-chemotherapy tissue sections from localized pancreatic ductal adenocarcinoma (PDAC) patients who demonstrated either partial/complete or poor/absent pathologic response to neoadjuvant chemotherapy.
| Pt # | Primary tumor | NAC regimen | Duration of NAC (mo) | Neoadjuvant radiation | Pathologic response | # total single cells in IMC slide | #CD11b+CD15+ neutrophils | #CD3+CD8+ T cells | NLR (norm. to 5000 cells) |
|---|---|---|---|---|---|---|---|---|---|
| 1 | Borderline Resectable | FFX | 4 | No | Partial (CAP 2) | 4326 | 325 | 29 | 11.2 |
| 2 | Borderline Resectable | FFX | 4.5 | No | Partial (CAP 2) | 3256 | 256 | 32 | 7.9 |
| 3 | Locally Advanced* | GNP | 6 | No | Near-complete (CAP 1) | 9421 | 472 | 142 | 3.3 |
| 4 | Borderline Resectable | GNP | 5 | No | Poor/Absent (CAP 3) | 8621 | 951 | 61 | 15.6 |
| 5 | Locally Advanced* | FFX | 6 | No | Poor/Absent (CAP 3) | 6011 | 1105 | 59 | 18.7 |
| 6 | Resectable | FFX +GNP | 6 | No | Poor/Absent (CAP 3) | 4712 | 523 | 40 | 13.1 |
-
*
Representative tissue and image segmentation maps depicted in Figure 4
Appendix 1—table 3
Predictors of partial/complete pathologic response following neoadjuvant chemotherapy in resected patients with localized pancreatic ductal adenocarcinoma using multivariable logistic regression.
| Variable | OR (95% CI) | P-value |
|---|---|---|
| Age | 1.02 (0.92, 1.09) | 0.68 |
| Gender Female Male | Ref 2.86 (0.45, 26.2) | - 0.34 |
| Diagnosis BMI | 0.88 (0.74, 1.08) | 0.21 |
| CA 19–9 dynamics Any increase Any decrease | Ref 1.82 (0.001, 3.74) | - 0.05 |
| Resectability Status Borderline Locally advanced Resectable | Ref 2.72 (0.22, 33.2) 0.64 (0.06, 7.44) | - 0.43 0.72 |
| Radiographic tumor size | 0.98 (0.91, 1.05) | 0.54 |
| NAC duration (months) | 1.09 (0.68, 1.75) | 0.73 |
| Absolute pre-chemotherapy aNLR Low High | Ref 0.02 (0.003, 0.15) | <0.001 |
| ΔNLR Low High | Ref 0.06 (0.01, 0.33) | 0.002 |
Additional files
-
MDAR checklist
- https://cdn.elifesciences.org/articles/78921/elife-78921-mdarchecklist1-v2.docx
-
Source data 1
Clinical Cohort and Western Blotting Source Data.
- https://cdn.elifesciences.org/articles/78921/elife-78921-data1-v2.zip
Download links
A two-part list of links to download the article, or parts of the article, in various formats.
Downloads (link to download the article as PDF)
Open citations (links to open the citations from this article in various online reference manager services)
Cite this article (links to download the citations from this article in formats compatible with various reference manager tools)
Neutrophil-mediated fibroblast-tumor cell il-6/stat-3 signaling underlies the association between neutrophil-to-lymphocyte ratio dynamics and chemotherapy response in localized pancreatic cancer: A hybrid clinical-preclinical study
eLife 11:e78921.
https://doi.org/10.7554/eLife.78921


