A pulse-chasable reporter processing assay for mammalian autophagic flux with HaloTag
- Department of Biochemistry and Molecular Biology, Graduate School of Medicine, The University of Tokyo, Japan
- Department of Molecular Oncology, Institute for Advanced Medical Sciences, Nippon Medical School, Japan
Figures
Figure 1 with 1 supplement

Processed ligand-bound HaloTag from HaloTag-LC3 is a quantifiable readout reflecting autophagic flux.
(a) Immunoblotting of total cell lysates from wild-type and FIP200 knockout (KO) HeLa cells stably expressing monomeric GFP (mGFP)-LC3B or monomeric RFP (mRFP)-LC3B that was in nutrient-rich medium (0 hr) or incubated for 6 hr in starvation medium. (b) Immunoblotting and in-gel fluorescence detection of total cell lysates from wild-type and FIP200 KO HeLa cells stably expressing Halo-LC3B that was pulse-labeled for 20 min with 100 nM of tetramethylrhodamine (TMR)-conjugated ligand in nutrient-rich medium. The cells were immediately collected (0 hr) or incubated in starvation medium for 6 hr. (c) Same cells and labeling procedure as in (b) except that the cells were collected or incubated in starvation medium with or without 100 nM bafilomycin A1 (BafA) for 2 hr. (d) Same labeling procedure as in (b) except with HeLa cells stably expressing SNAP-tag (SNAP)-LC3B and TMR-conjugated ligand targeting SNAP. (e) Illustration of the fate of ligand-free and ligand-bound Halo-LC3B in autolysosomes. Halo-LC3B is processed by lysosomal hydrolases, releasing Halo from LC3B. When free from ligand, Halo is unstable and quickly degraded in lysosomes like LC3B. In contrast, ligand-bound Halo is stable against degradation and accumulates in lysosomes. Released Haloligand is detectable by immunoblot and, if a fluorescent ligand was used, in-gel fluorescence detection. The amount of free Haloligand separated from LC3B reflects the level of autophagic flux. (f) Immunoblotting and in-gel fluorescence detection of total cell lysates from wild-type HeLa cells stably expressing Halo-LC3B, pulse-labeled with 100 nM TMR-conjugated ligand in nutrient-rich medium for 20 min, and starved for the indicated durations. (g) Quantification of results shown in (f). HaloTMR band intensity was normalized by the sum of the band intensities HaloTMR-LC3B and HaloTMR. Mean values of data from three experiments are shown with red points that are traced by a line.
-
Figure 1—source data 1
Uncropped blot images of Figure 1a, b, c, d and f, and Figure 1—figure supplement 1.
- https://cdn.elifesciences.org/articles/78923/elife-78923-fig1-data1-v2.zip
Figure 1—figure supplement 1
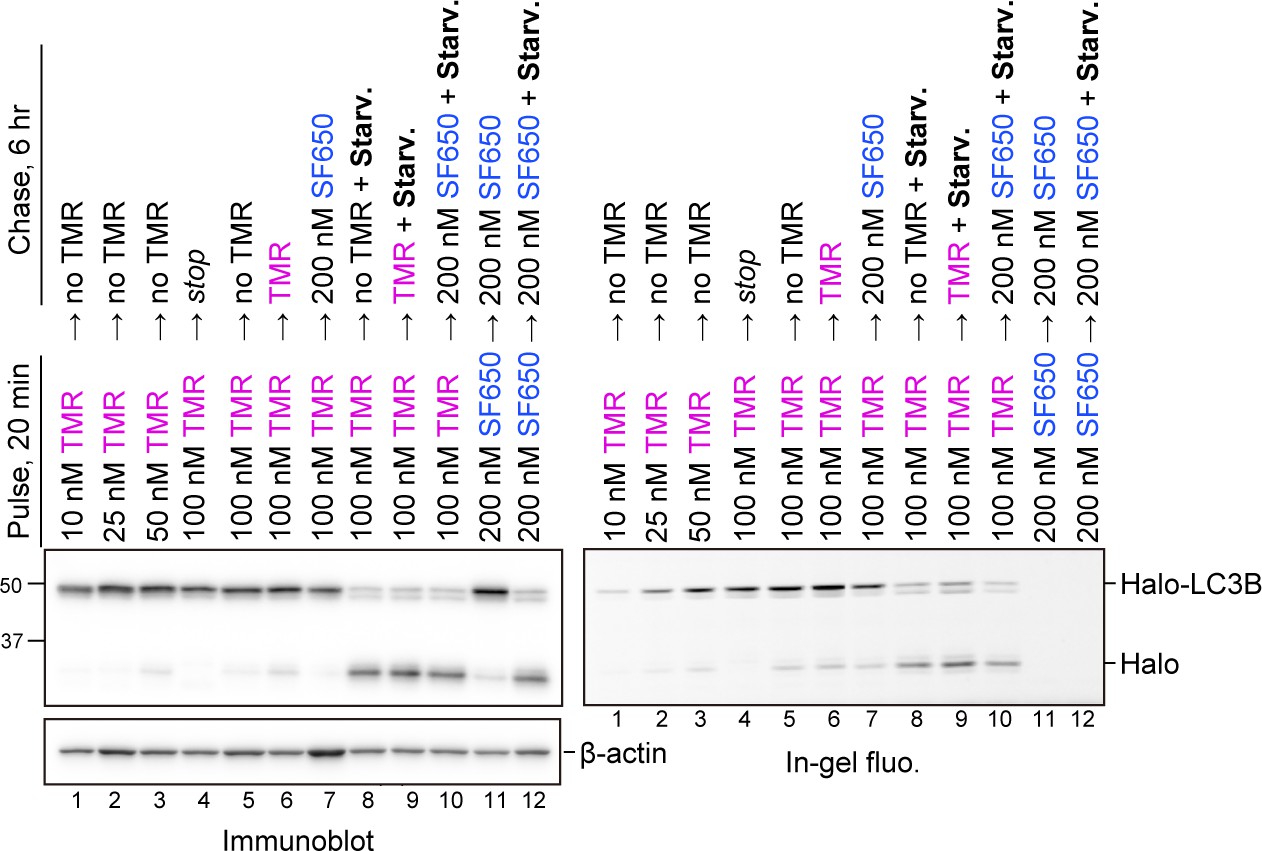
HaloTag-based processing assay can be conducted without a blocking agent.
Wild-type HeLa cells stably expressing HaloTag (Halo)-LC3B, labeled with tetramethylrhodamine (TMR)-conjugated ligand or SF650-conjugated ligand at the indicated concentrations and in the indicated medium with or without SF650-conjugated ligand as a blocking agent. ‘Stop’ means that the samples were collected immediately after the pulse treatment.
Figure 2 with 1 supplement
HaloTag-based reporters can be used to examine autophagic flux by fluorescence imaging.
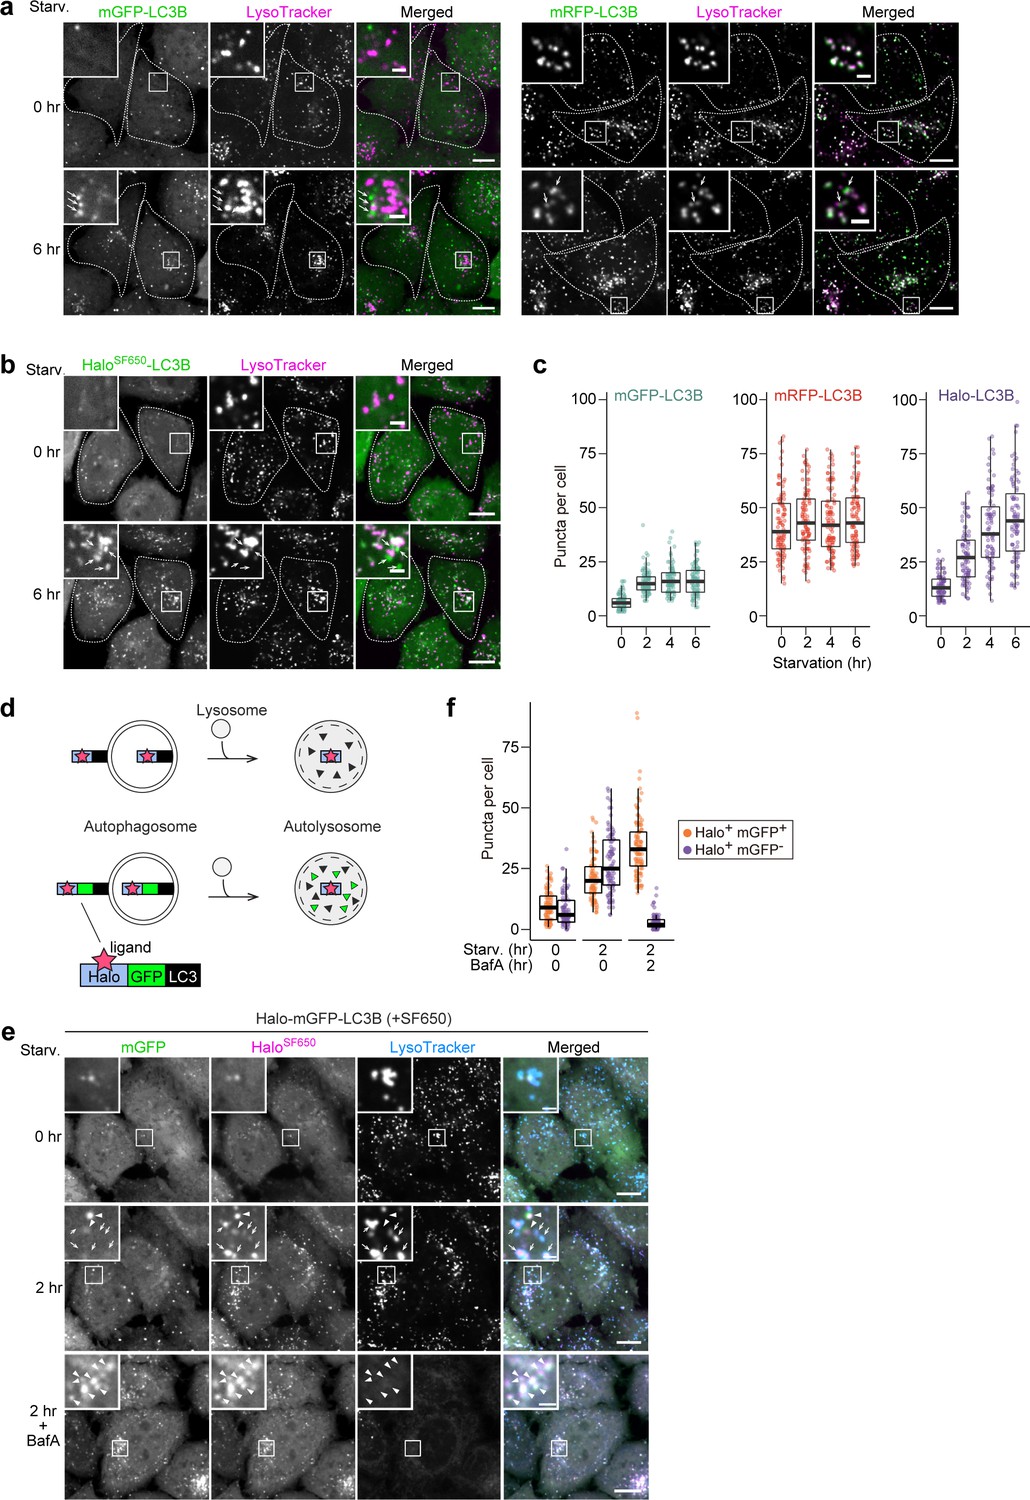
(a) Fluorescence images of wild-type HeLa cells stably expressing mGFP-LC3B or mRFP-LC3B in nutrient-rich medium or after 2 hr in starvation medium containing 75 nM LysoTracker Deep Red. (b) Fluorescence images of wild-type HeLa cells stably expressing HaloTag (Halo)-LC3B labeled with SF650-conjugated ligand. The cells were in nutrient-rich medium or incubated for 2 hr in starvation medium containing 200 nM of SF650-conjugated ligand and 75 nM LysoTracker Red. Arrows point to Halo puncta without LysoTracker signal that represent autophagosomes. (c) Quantification of mGFP, mRFP, or HaloSF650 puncta in the cells of (a) and (b). n=87–99 cells. (d) Schematic of fluorescence changes of fluorescent ligand-bound Halo-LC3B and Halo-mGFP-LC3B in autophagosomes and autolysosomes. Haloligand stays fluorescent and stable, whereas mGFP is quenched and degraded in autolysosomes. With Halo-mGFP-LC3B, autophagosomes appear as double-positive (Haloligand and mGFP) puncta while autolysosomes appear as single-positive (Haloligand only) puncta. (e) Fluorescence images of wild-type HeLa cells stably expressing Halo-mGFP-LC3B labeled with SF650-conjugated ligand. The cells were growing, starved, or starved with 100 nM bafilomycin A1 (BafA) for 2 hr in medium containing 200 nM of SF650-conjugated ligand and 75 nM LysoTracker Red. Arrowheads point to Halo+mGFP+ puncta that represent autophagosomes; arrows point to Halo+mGFP– puncta that represent autolysosomes. (f) Quantification of HaloSF650+mGFP+ puncta representing autophagosomes and HaloSF650+mGFP– puncta representing autolysosomes in cells shown in (e). n=86–101 cells. Scale bar = 10 µm (main), 2 µm (magnified images) (a, b, e). In box plots, solid bars indicate medians, boxes indicate the interquartile range (25th–75th percentile), and whiskers indicate the largest and smallest values within 1.5 times the interquartile range (c, f).
Figure 2—figure supplement 1
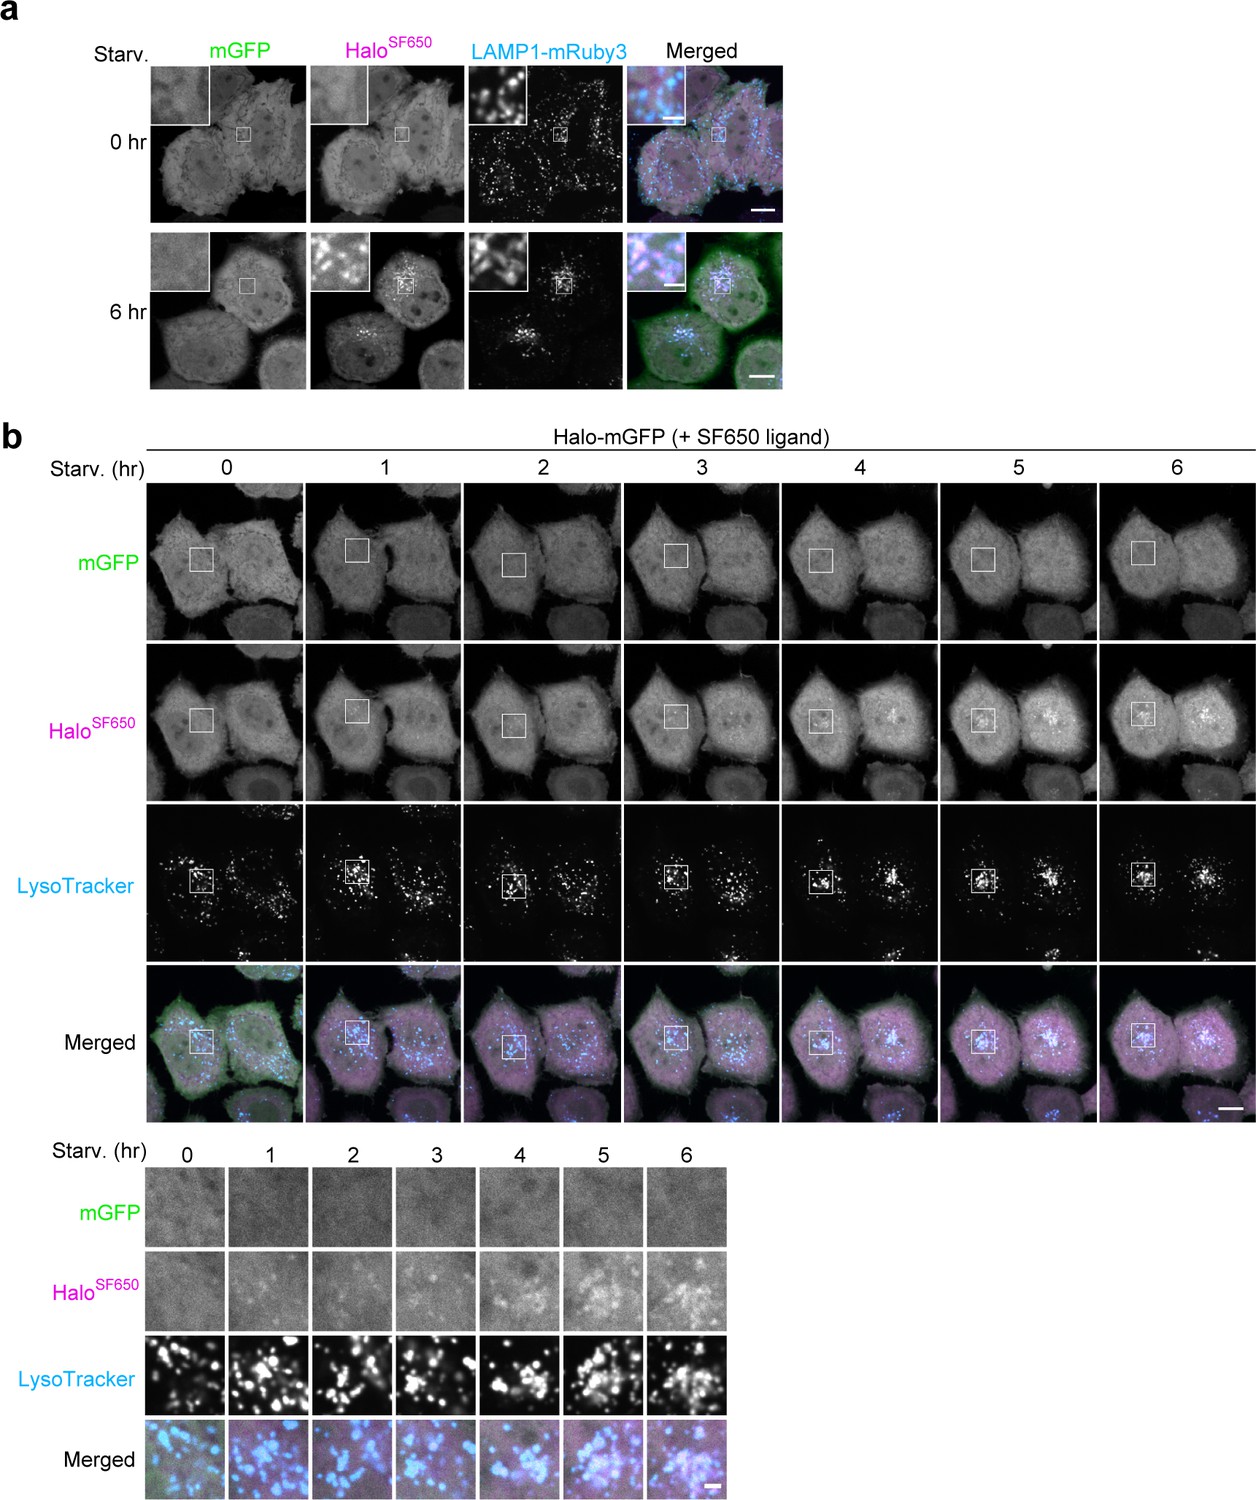
HaloTag can be combined with GFP- and/or RFP-based autophagy reporters.
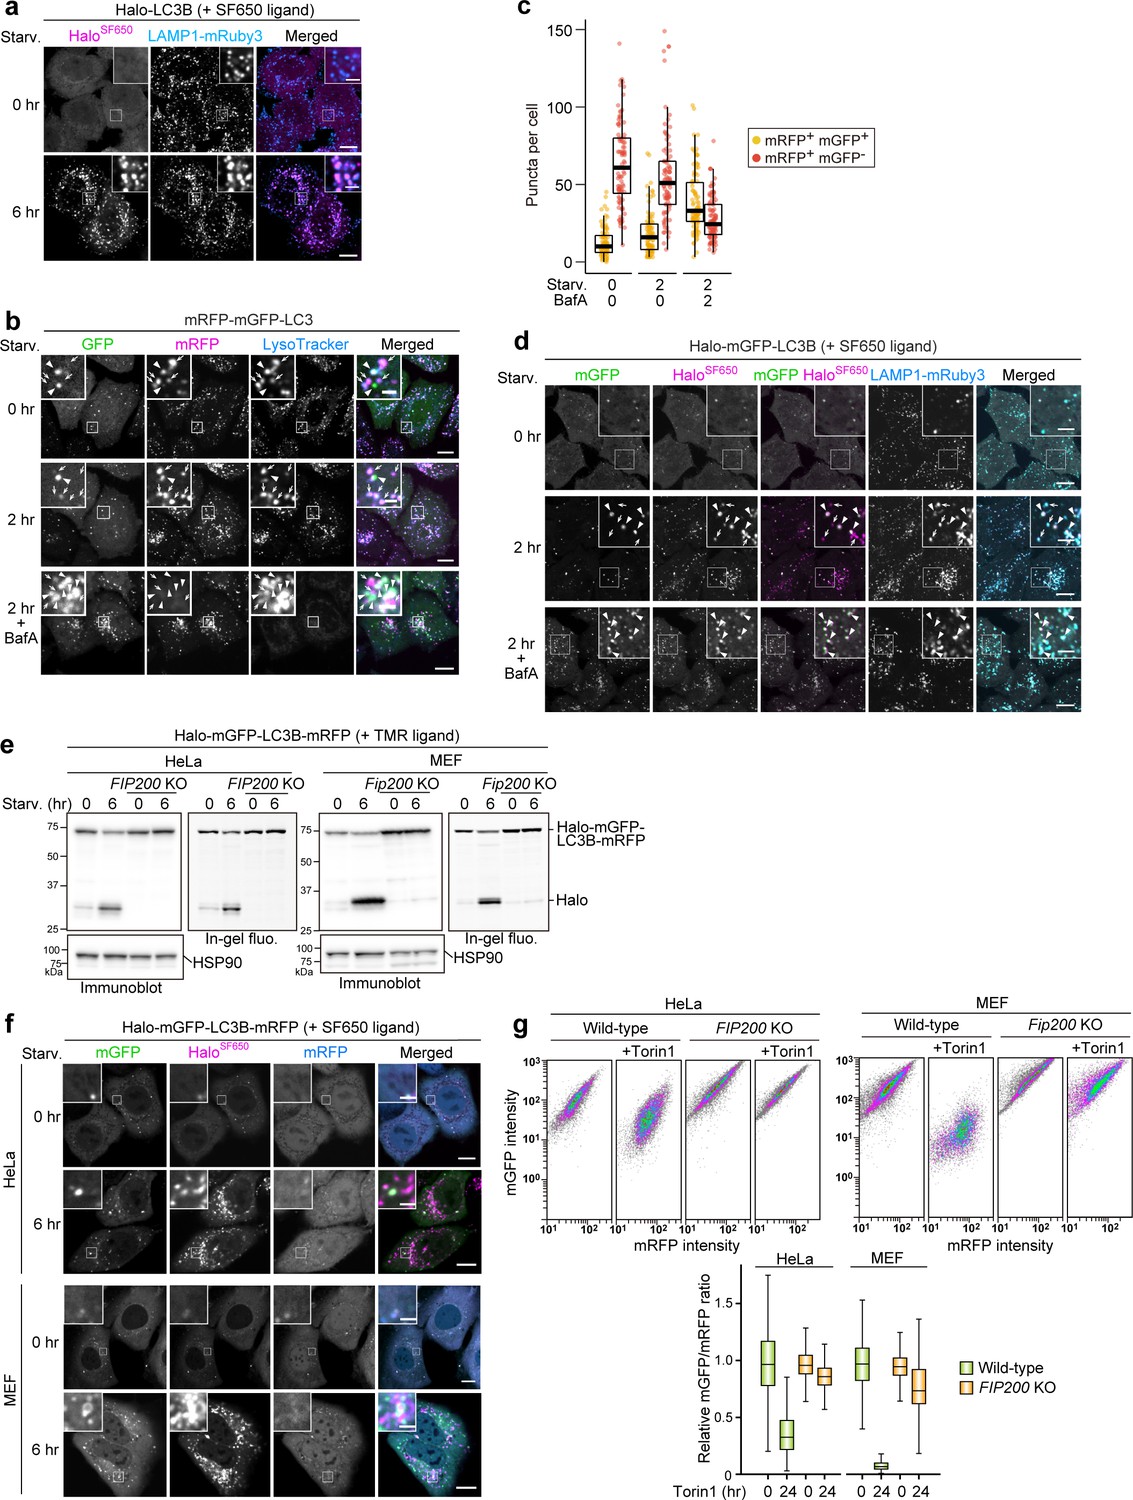
(a) Fluorescence images of wild-type HeLa cells stably expressing lysosomal marker LAMP1-mRuby3 and HaloTag (Halo)-LC3B in nutrient-rich medium or after 6 hr in starvation medium containing 200 nM SF650-conjugated ligand. (b) Fluorescence images of wild-type HeLa cells stably expressing mRFP-mGFP-LC3B in nutrient-rich medium or after 2 hr in starvation medium containing 75 nM LysoTracker Deep Red, with or without 100 nm of bafilomycin A1 (BafA). Arrowheads point to mRFP+mGFP+ puncta that represent autophagosomes; arrows point to mRFP+mGFP– puncta that should represent autolysosomes. (c) Quantification of mRFP+mGFP+ puncta and mRFP+mGFP– puncta in cells shown in (b). n=91–100 cells. (d) Fluorescence images of wild-type HeLa cells stably expressing the lysosomal marker LAMP1-mRuby3 and Halo-mGFP-LC3B in nutrient-rich medium or after 2 hr in starvation medium with and withoutBafA. The media contained 200 nM of SF650-conjugated ligand. Arrowheads point to Halo+mGFP+ puncta that represent autophagosomes; arrows point to Halo+mGFP– puncta that represent autolysosomes. (e) Immunoblotting and in-gel fluorescence detection of total cell lysates from wild-type and FIP200 knockout (KO) HeLa cells and mouse embryonic fibroblasts (MEFs) stably expressing Halo-mGFP-LC3B-mRFP, pulse-labeled for 20 min with 100 nM TMR-conjugated ligand in nutrient-rich medium. The cells were then collected or incubated for 6 hr in starvation medium. (f) Fluorescence images of cells described in (e) in nutrient-rich medium or after 6 hr incubation in starvation medium. The media contained 200 μM of SF650-conjugated ligand. (g) mGFP and mRFP intensities of cells described in (e) were determined with flow cytometry under nutrient-rich conditions with or without 250 nM Torin1 for 24 hr. A reduction in the mRFP:mGFP fluorescence ratio indicates autophagic flux. n=5000 cells. In box plots, solid bars indicate medians, boxes indicate the interquartile range (25th–75th percentile), and whiskers indicate the largest and smallest values within 1.5 times the interquartile range (c, g). Scale bar = 10 µm (main), 2 µm (inset) (a, b, d, f).
-
Figure 2—figure supplement 1—source data 1
Uncropped blot images of Figure 2—figure supplement 1e.
- https://cdn.elifesciences.org/articles/78923/elife-78923-fig2-figsupp1-data1-v2.zip
Figure 3 with 1 supplement

HaloTag-based reporters can be adapted to monitor selective autophagy.
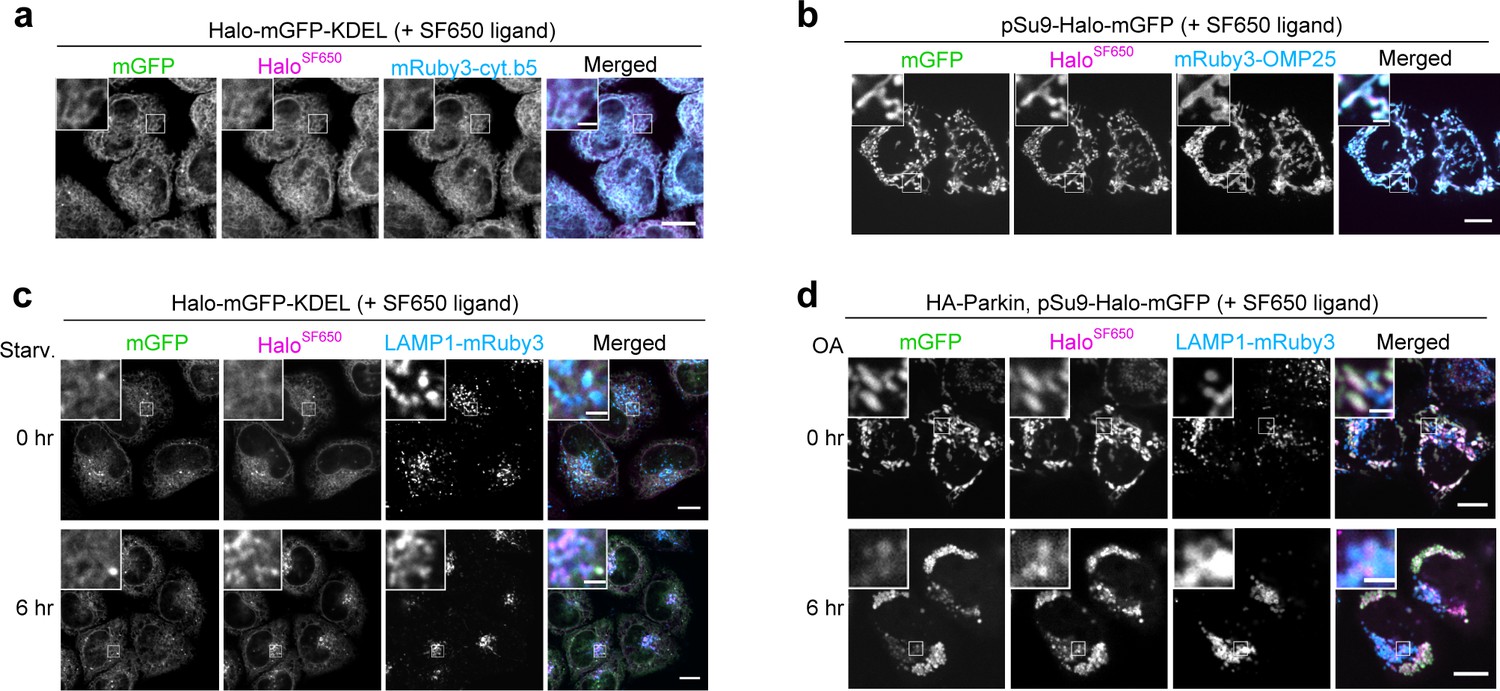
(a) Immunoblotting and in-gel fluorescence detection of wild-type and FIP200 knockout (KO) HeLa cells stably expressing HaloTag (Halo)-mGFP-KDEL pulse-labeled for 20 min with 100 nM tetramethylrhodamine (TMR)-conjugated ligand in nutrient-rich medium. The cells were collected or incubated for 6 hr in starvation medium. (b) Quantification of Halo band intensities in (a). n=3. (c) Immunoblotting of total cell lysates from wild-type HeLa cells in nutrient-rich medium or after 6 hr in starvation medium. (d) Quantification of band intensities for the indicated proteins in (c). n=3. (e) Fluorescence images of the cells described in (a) under nutrient-rich conditions or for 6 hr under starvation conditions. The media contained 200 nM SF650-conjugated ligand and 75 nM LysoTracker Red. Arrows point to HaloSF650+mGFP– puncta representing autolysosomes. (f) Quantification of HaloSF650+mGFP– puncta that represent autolysosomes in cells shown in (e). n=111–115 cells. (g) Immunoblotting and in-gel fluorescence detection of total cell lysates from wild-type or FIP200 KO HeLa cells stably expressing pSu9-Halo-mGFP only or together with HA-Parkin. After pulse-labeling with 100 nM TMR ligand in nutrient-rich medium, the cells were collected or incubated for 6 hr in nutrient-rich medium containing 1 μM oligomycin and 2 μM antimycin (OA collectively). (h) Quantification of Halo band intensities in (g). (i) Fluorescence images of wild-type and FIP200 KO HeLa cells stably expressing pSu9-Halo-mGFP and HA-Parkin. The cells were in nutrient-rich medium containing 200 nM SF650 ligand, 75 nM LysoTracker Red, with or without OA. Arrows point to HaloSF650+mGFP– puncta that represent autolysosomes. (j) Quantification of HaloSF650+mGFP– puncta in cells shown in (i). n=99 cells. Scale bar = 10 µm (main), 2 µm (magnified images) (e, i). In box plots, solid bars indicate medians, boxes indicate the interquartile range (25th–75th percentile), and whiskers indicate the largest and smallest values within 1.5 times the interquartile range (f, j).
-
Figure 3—source data 1
Uncropped blot images of Figure 3a, c and g.
- https://cdn.elifesciences.org/articles/78923/elife-78923-fig3-data1-v2.zip
Figure 3—figure supplement 1
Halo-GFP-KDEL and pSu9-Halo-GFP localize to endoplasmic reticulum (ER) and mitochondria, respectively.
(a) Fluorescence images of wild-type HeLa cells stably expressing HaloTag (Halo)-mGFP-KDEL and ER marker mRuby3-cytochrome b5 in nutrient-rich medium containing 200 nM SF650-conjugated ligand. (b) Fluorescence images of wild-type HeLa cells stably expressing pSu9-Halo-mGFP and mitochondrial marker mRuby3-OMP25 in nutrient-rich medium containing 200 nM SF650-conjugated ligand. (c) Fluorescence images of wild-type HeLa cells stably expressing lysosomal marker LAMP1-mRuby3 and Halo-mGFP-KDEL in nutrient-rich medium or after 6 hr incubation in starvation medium. The media contained 200 nM SF650-conjugated ligand. (d) Fluorescence images of wild-type HeLa cells stably expressing HA-Parkin, LAMP1-mRuby3, and pSu9-Halo-mGFP in nutrient-rich medium containing 200 nM SF650-conjugated ligand with or without 1 µM oligomycin and 2 µM antimycin (OA, collectively), which were added for 6 hr. Scale bar = 10 µm (main), 2 µm (inset) (a, b, c, d).
Figure 4 with 1 supplement
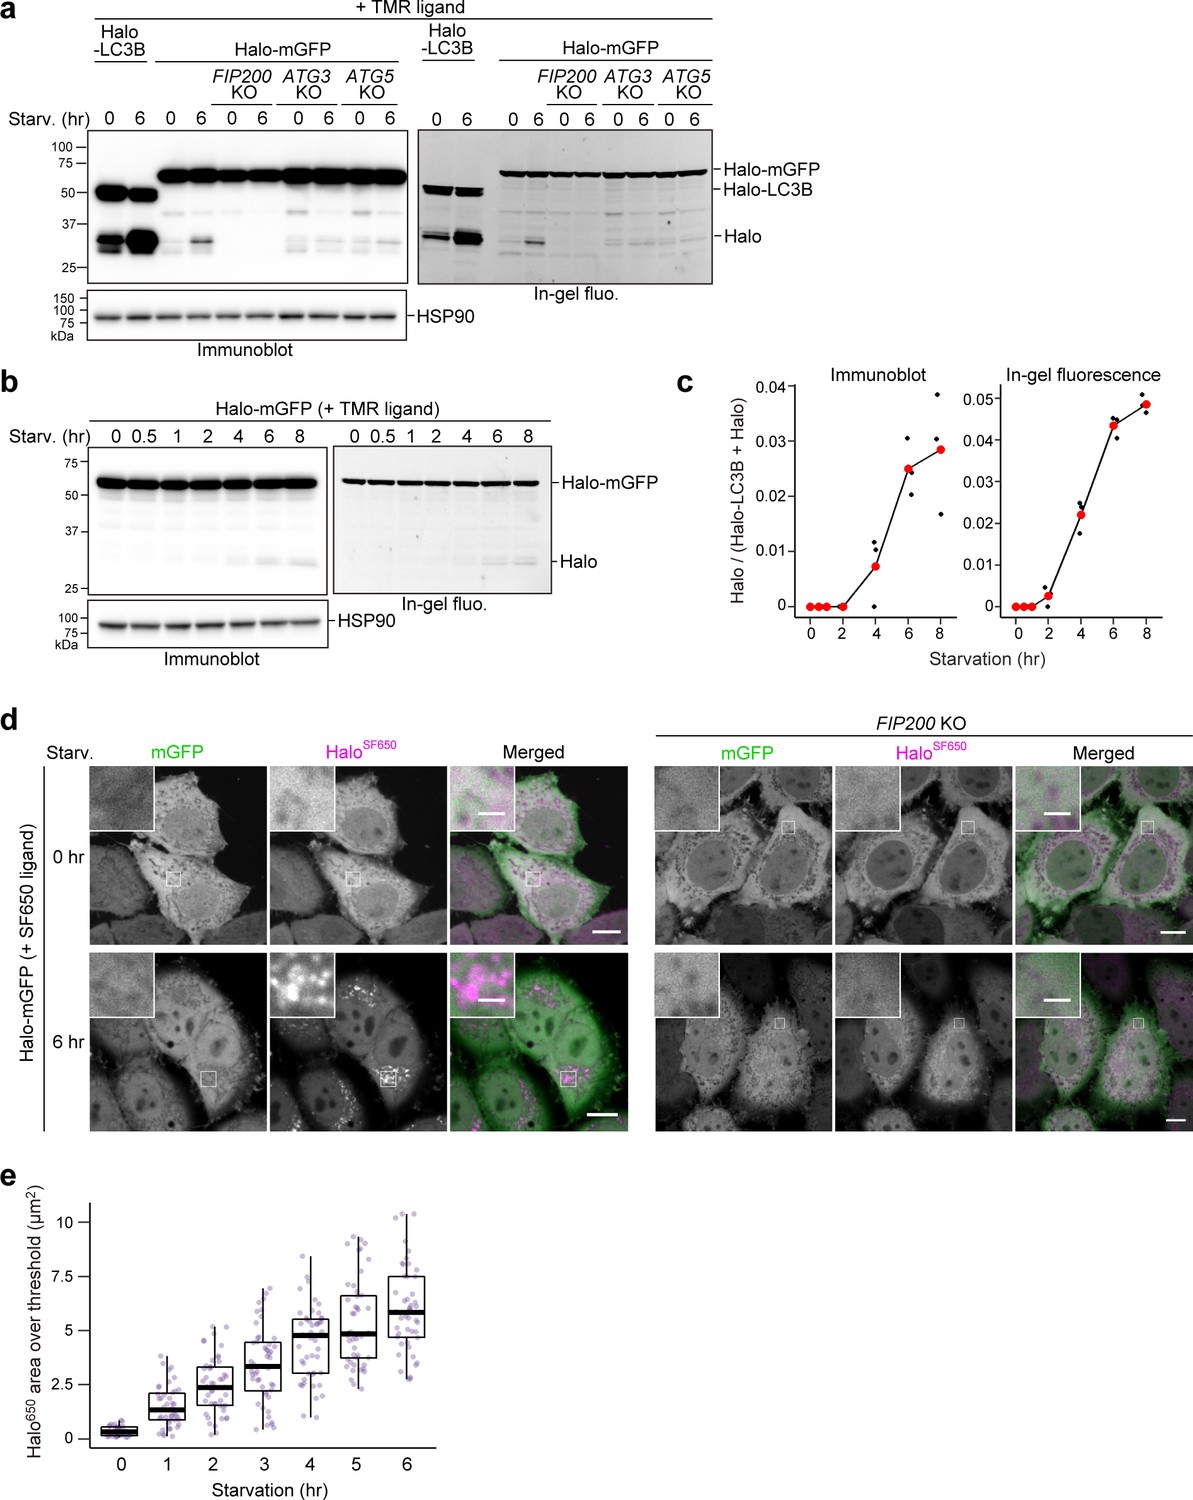
Bulk nonselective autophagic flux can be detected with HaloTag-GFP.
(a,b) Immunoblotting and in-gel fluorescence detection of total cell lysates from wild-type, FIP200 knockout (KO), ATG3 KO, and ATG5 KO HeLa cells stably expressing HaloTag (Halo)-LC3B (a) or Halo-mGFP (a,b). After pulse-labeling for 20 min with 100 nM tetramethylrhodamine (TMR)-conjugated ligand in nutrient-rich medium, the cells were collected or incubated for 6 hr (a) or the indicated times (b) in starvation medium. (c) Quantification of time course results shown in (b). Mean values of three experiments are shown with red points that are traced with a line. (d) Fluorescence images of wild-type and FIP200 KO HeLa cells stably expressing Halo-mGFP in nutrient-rich medium or after 6 hr of starvation. The media contained 200 nM of SF650-conjugated ligand. Scale bar = 10 µm (main), 2 µm (magnified images). (e) Quantification of the area of HaloSF650 signal that exceeded a 98th percentile intensity threshold in cells described in (d) at the indicated durations of starvation. n=42–48 cells. In box plots, solid bars indicate medians, boxes indicate the interquartile range (25th–75th percentile), and whiskers indicate the largest and smallest values within 1.5 times the interquartile range.
-
Figure 4—source data 1
Uncropped blot images of Figure 4a and b.
- https://cdn.elifesciences.org/articles/78923/elife-78923-fig4-data1-v2.zip
Figure 4—figure supplement 1
Bulk nonselective autophagic flux can be detected with Halo-GFP.
(a) Fluorescence images of wild-type HeLa cells stably expressing lysosomal marker LAMP1-mRuby3 and HaloTag (Halo)-mGFP under nutrient-rich conditions or after 6 hr under starvation conditions in the presence of 200 nM SF650-conjugated ligand. (b) Time-lapse montage of wild-type HeLa cells stably expressing Halo-mGFP cells in starvation medium containing 200 nM SF650-conjugated ligand and 75 nM LysoTracker Red. Images were taken after the indicated durations of starvation. Scale bar = 10 µm (main), 2 µm (inset, inset montage) (a, b).
Author response image 1

HeLa cells stably expressing pSu9-Halo-GFP in growing medium with 200 nM SF650 ligand.
Additional files
-
MDAR checklist
- https://cdn.elifesciences.org/articles/78923/elife-78923-mdarchecklist1-v2.docx
-
Supplementary file 1
Sequences of the primers used for plasmid construction.
- https://cdn.elifesciences.org/articles/78923/elife-78923-supp1-v2.xlsx
Download links
A two-part list of links to download the article, or parts of the article, in various formats.
Downloads (link to download the article as PDF)
Open citations (links to open the citations from this article in various online reference manager services)
Cite this article (links to download the citations from this article in formats compatible with various reference manager tools)
A pulse-chasable reporter processing assay for mammalian autophagic flux with HaloTag
eLife 11:e78923.
https://doi.org/10.7554/eLife.78923


