Transcriptional heterogeneity and cell cycle regulation as central determinants of Primitive Endoderm priming
- reNEW UCPH - The Novo Nordisk Foundation Center for Stem Cell Medicine, University of Copenhagen, Denmark
- Niels Bohr Institute, University of Copenhagen, Denmark
Figures
Figure 1 with 2 supplements
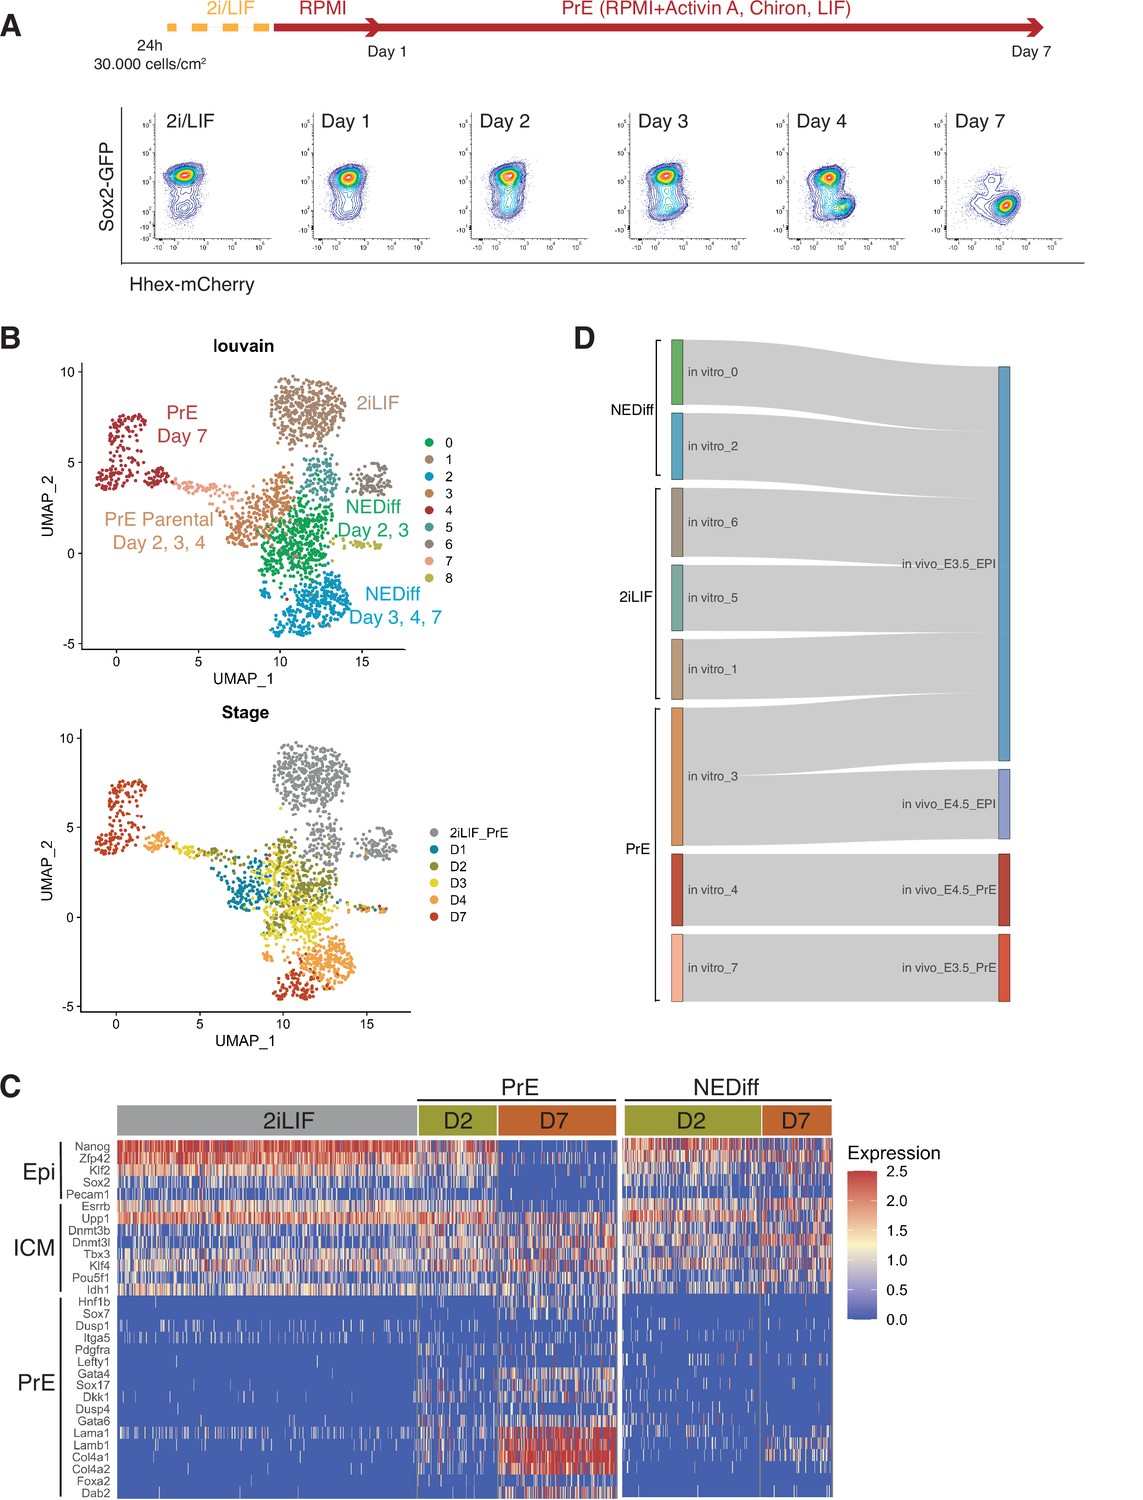
Transcriptome profiling of Primitive Endoderm (PrE) in vitro differentiation.
(A) Schematic of the experiment. Cells were passaged twice in 2i/LIF and then plated in RPMI base media 24 hr before starting the experiment. Bottom panel: Flow cytometry plots showing the time points selected for single-cell RNA-seq. The fluorescent information of Sox2 and Hhex was recorded prior to sequencing. Cells from all the populations shown in the plots were collected for sequencing. (B) UMAP projection of the in vitro experiment showing nine identified clusters using Louvain (upper panel) and stages of differentiation (bottom panel). (C) Heatmap showing expression of selected Epi, Inner Cell Mass (ICM), and PrE markers in 2i/LIF, days 2 and 7 of differentiation. Left panel: PrE Diff branch. Right panel: NEDiff branch. Cells at day 2 in the PrE branch already are upregulating endoderm genes while the NEDiff cells are not. (D) Sankey plot visualizing cluster similarity comparison between identified in vitro clusters and in vivo (Nowotschin et al., 2019) experiment using the Cluster Alignment Tool (CAT).
Figure 1—figure supplement 1
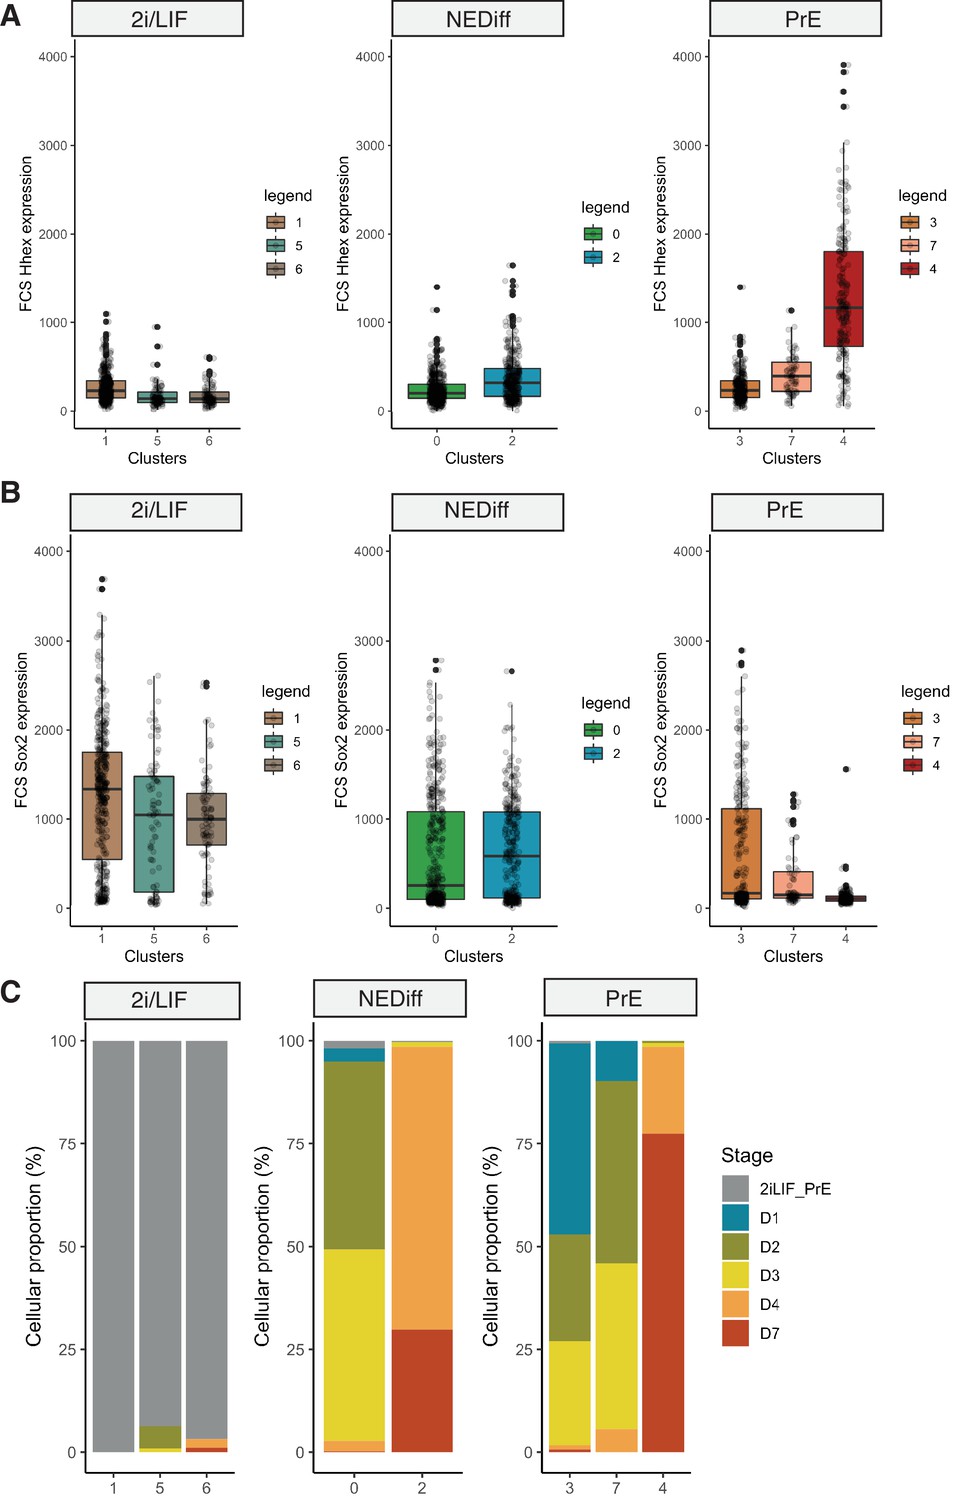
Properties of cells collected for MARS-seq during Primitive Endoderm (PrE) in vitro differentiation.
(A) Fluorescence intensity on the Hhex-mCherry channel recorded by the FACS at the moment of the sample collection for sequencing. Samples were collected from 2i/LIF culture, and days 1, 2, 3, 4, and 7 of PrE differentiation. Cells are labelled PrE or NEDiff according to whether they belong to the PrE branch or the not differentiated branch, respectively. PrE cells show higher Hhex reporter expression than the NEDiff clusters. (B) Fluorescence intensity on the Sox2-GFP channel recorded by FACS at the moment of the sample collection for sequencing. Samples were collected from 2i/LIF culture, and days 1, 2, 3, 4, and 7 of PrE differentiation. Cells are labelled PrE or NEDiff according to whether they belong to the PrE branch or the not differentiated branch, respectively. NEDiff cells show higher Sox2 reporter expression than the PrE clusters. (C) Cellular proportions of cells in 2i/LIF vs. NEDiff vs. PrE branch, showing that clusters 1, 5, and 6 belong to the 2i/LIF cells. Cells from days 2, 3, and 4 are separated between differentiated (PrE, clusters 3, 7, and 4) and non-differentiated (NEDiff, clusters 0 and 2).
Figure 1—figure supplement 2
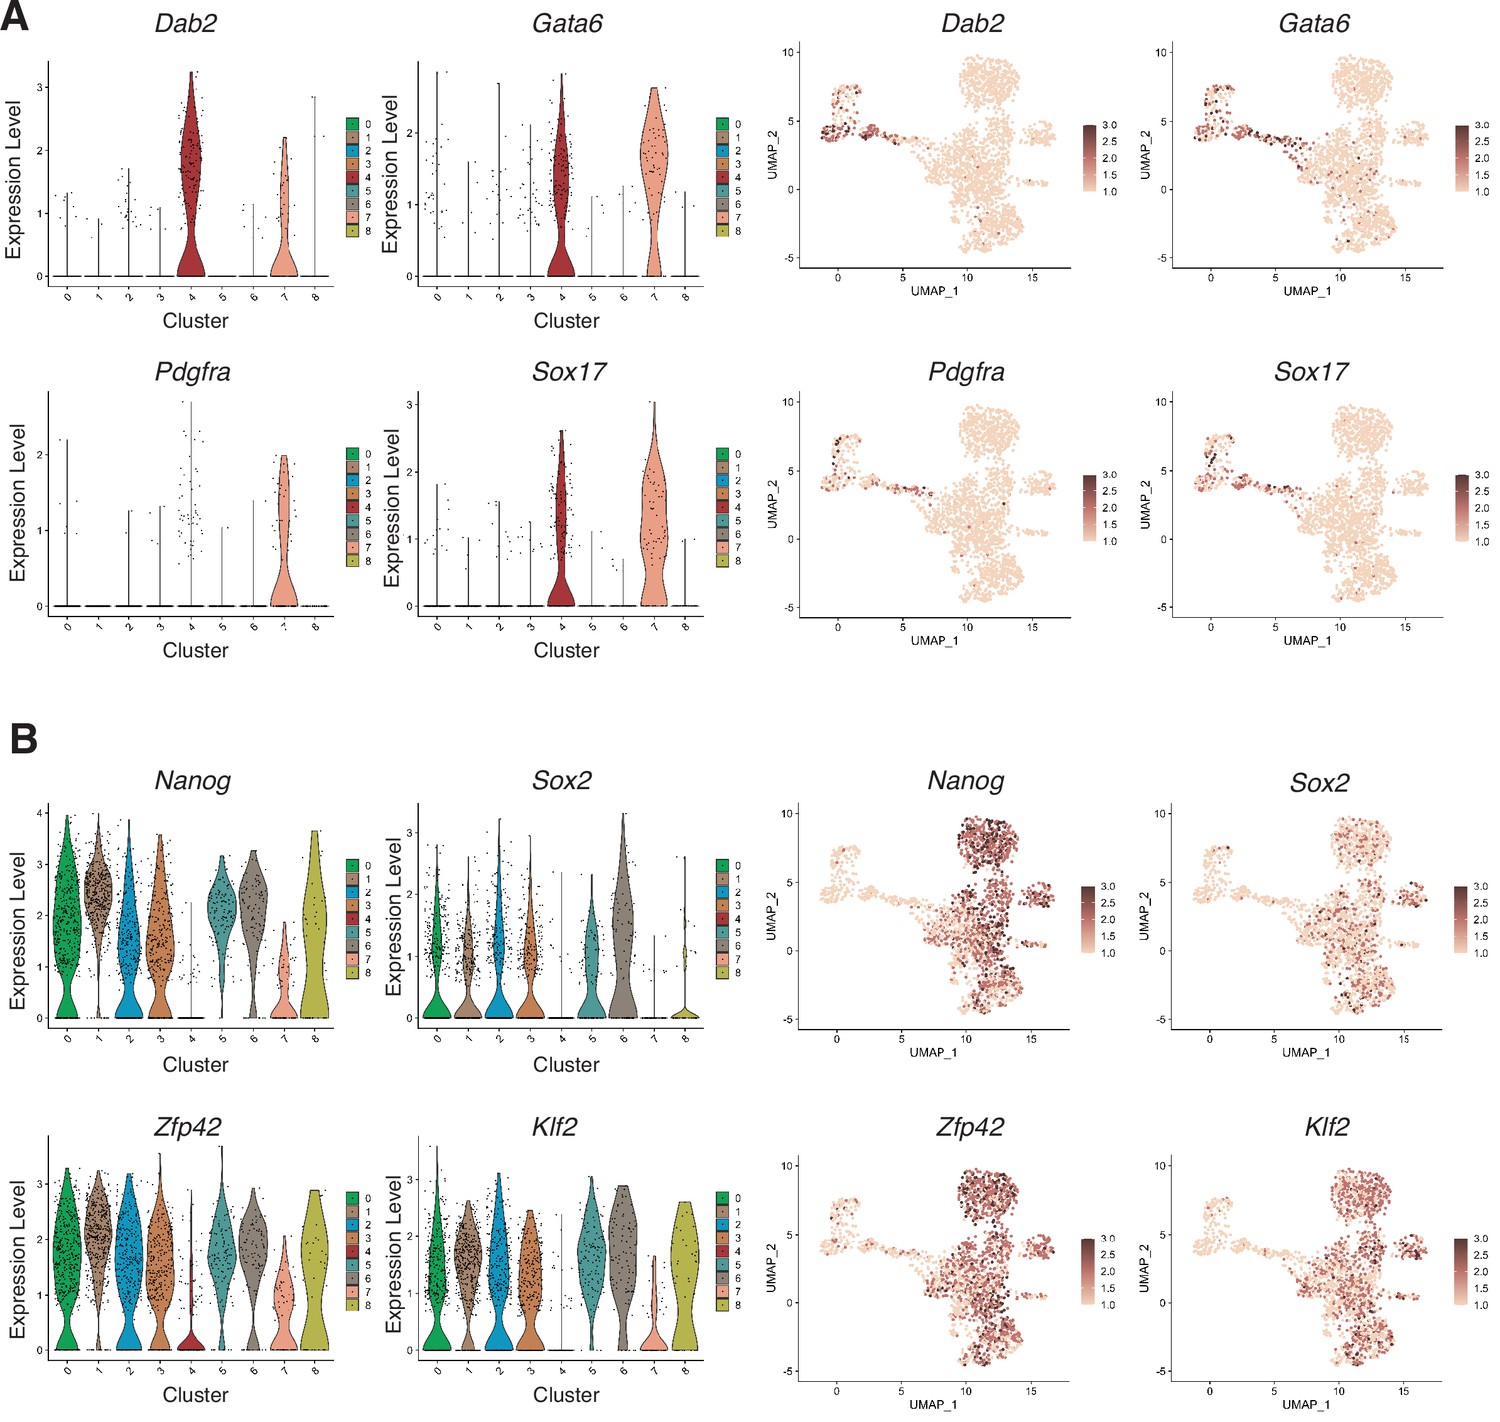
Lineage-specific markers expressed in single-cell RNA-seq clusters.
(A) Interrogation of endodermal genes (Dab2, Gata6, Pdgfra, and Sox17), mostly expressed in the Primitive Endoderm (PrE) branch of the dataset. (B) Interrogation of Epiblast genes (Nanog, Sox2, Zfp42, and Klf2), mostly expressed in the 2i/LIF clusters and the NEDiff branch of the dataset.
Figure 2 with 2 supplements
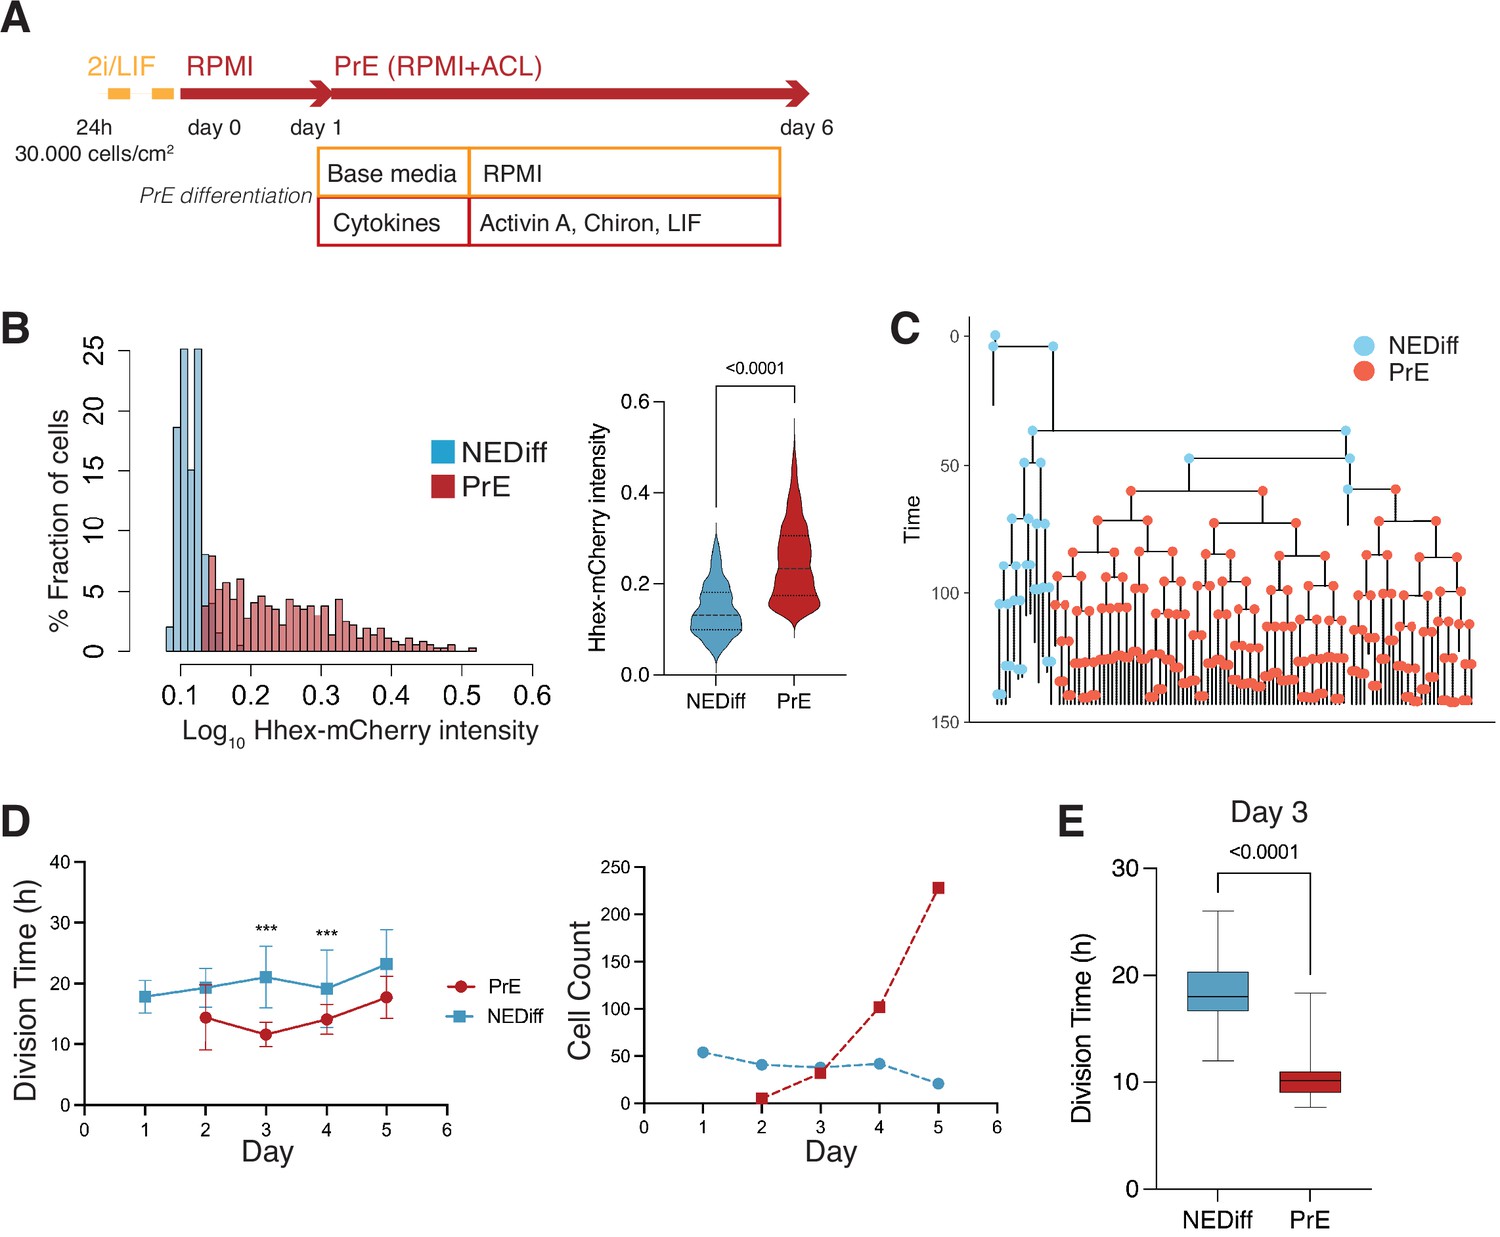
Time lapse of Primitive Endoderm (PrE) differentiation shows rapid proliferation of PrE-primed cells.
(A) Schematic of the experimental setup. Cells were imaged for 6 days acquiring one time frame every 20 min. (B) The Hhex intensity distribution between the populations allowed us to separate PrE differentiated cells (PrE) from the Non-Endodermal/Non-Differentiated cells (NEDiff). p value <0.0001 Mann–Whitney test. (C) Example of a lineage tree showing how the PrE branch of the tree arises. The first and last generation were discarded from further analysis since the cell cycle information is not complete. All lineage trees collected in the PrE condition are shown in Figure 2—figure supplement 1; this example corresponds to Tree 10 in Figure 2—figure supplement 1. (D) Analysis of mouse embryonic stem cells (mESCs) division times and cell counts showed that cells that differentiate into PrE are dividing faster at the beginning of the differentiation process (day 3, left panel) and that selected survival likely takes place later in differentiation (days 4 and 5, right panel). ***p value <0.001. (E) Cell cycle length at day 3 shows a decrease in the PrE cells division time, compared to a slower dividing non-endodermal cluster (p value <0.0001 unpaired t-test).
Figure 2—figure supplement 1
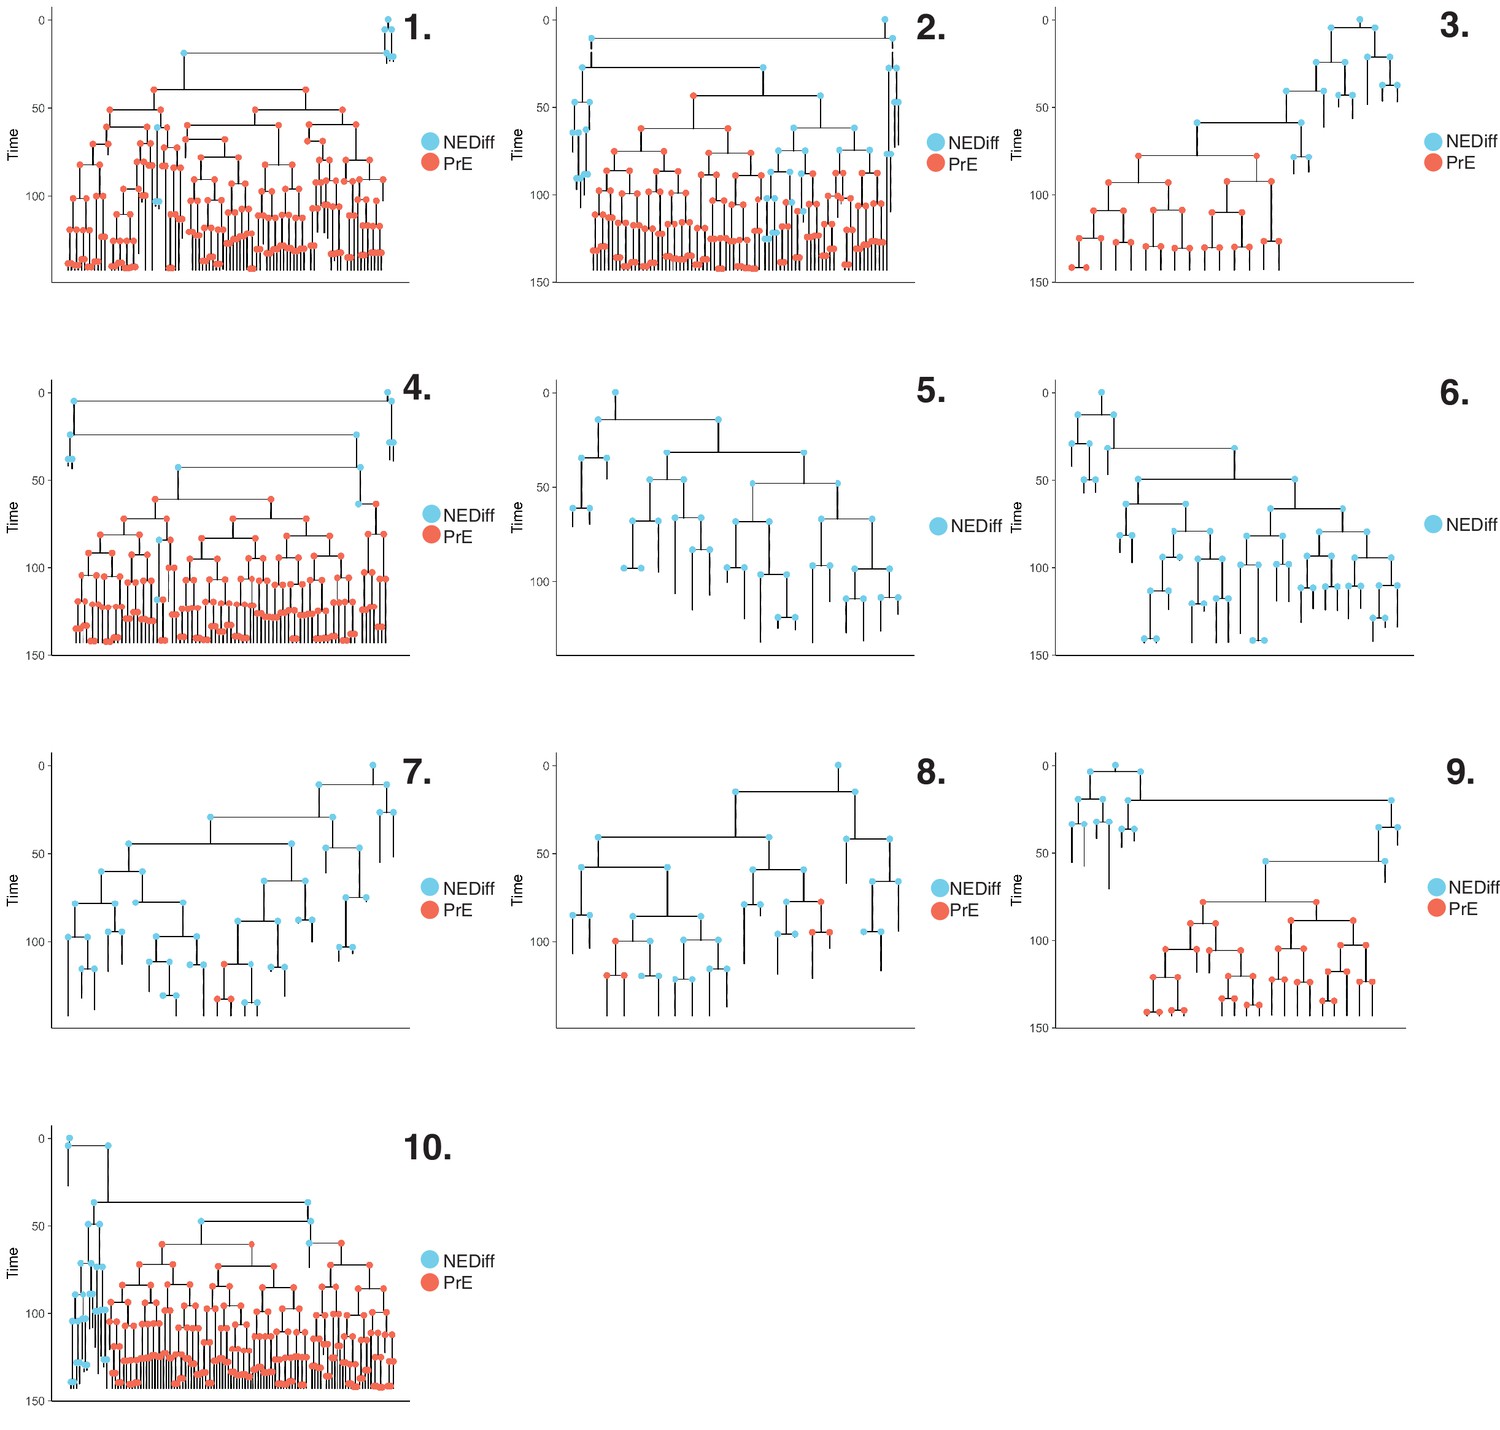
Lineage trees in Primitive Endoderm (PrE) differentiation.
Lineage trees generated in the PrE dataset. We manually tracked 1158 cells. After constructing our lineage trees, cells that died or that had not completed a full division cycle were discarded. The final dataset consisted of 564 cells across 10 lineage trees. Cells are coloured based on clusters described in Figure 2B.
Figure 2—figure supplement 2
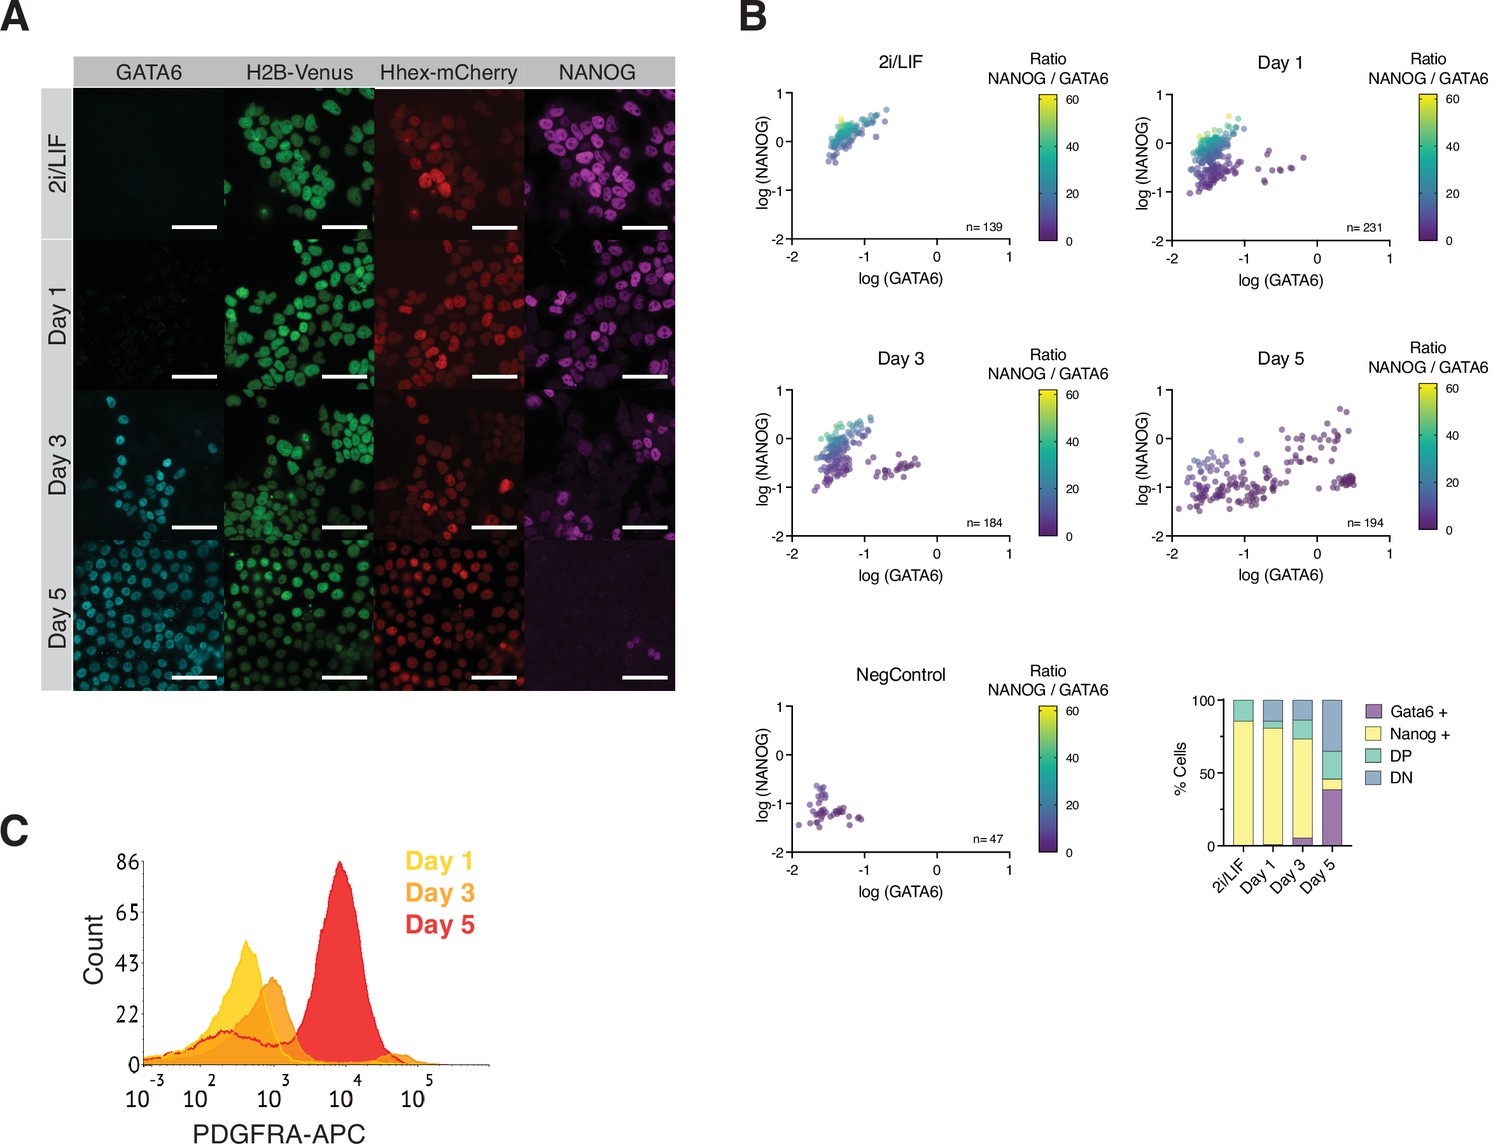
Assessing Primitive Endoderm (PrE) differentiation in vitro and in silico.
(A) HFHCV mouse embryonic stem cells (mESCs) lost pluripotent identity (NANOG) and acquired endodermal identity (GATA6) during PrE differentiation. Scale bar: 50 μm. (B) Quantification of immunofluorescent images obtained at the indicated time points. Cells were segmented based on 4′,6-diamidino-2-phenylindole (DAPI) and GATA6 or NANOG fluorescent was measured in absolute units. Data were converted to log scale for easier visualization. Cells were quantified as NANOG positive, GATA6 positive, Double Positive (DP), and Double Negative (DN) using the thresholds from the Negative Control. (C) Flow cytometry histogram of HFHCV mESCs during PrE differentiation. PDGFRA-APC staining of HFHCV mESCs at days 1, 3, and 5 shows the acquisition of endodermal identity.
Figure 3 with 1 supplement

Analysis of Primitive Endoderm (PrE) progenitor cells demonstrates functional priming of Hhex-high cells.
(A) A mathematical model that considers the difference in cell death rate between the two populations as well as the proliferation rate can recapitulate the PrE dataset collected (see Methods for description of the Mathematical Modelling). Based on the experimental dataset, we found the same survival rates predicted by the model. t = transition rate, s = survival rate, d = division time (hr). (B) The NEDiff cluster at day 2 was separated into cells that will give rise to PrE (PrE Fate), and cells that eventually would not differentiate (NEDiff Fate). Analysis of the Hhex intensity distribution shows that cells that will give rise to PrE (PrE Fate) show higher Hhex intensity. Total cell number and fluorescence quantification shown in Table 3. (C) The High Hhex population from day 2 of PrE differentiation, isolated by FACS, shows improved PrE differentiation (scored as percentage of PDGFRA-positive cells), demonstrating the functional priming of these cells. *p value <0.05, Kruskal–Wallis test.
Figure 3—figure supplement 1
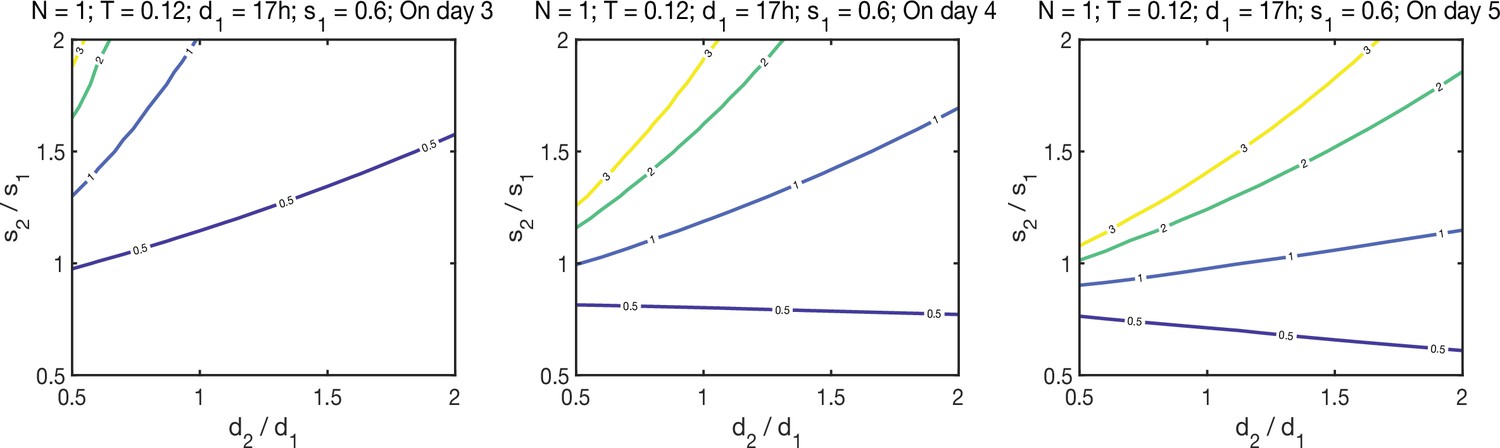
Algebraic model iterations.
Phase diagrams based on the algebraic model (Figure 3A, Methods) illustrating how the differences in cell death and cell division influence the proportions of the Primitive Endoderm (PrE) and the NEDiff populations. Each line represents combinations of relative survival and proliferation rates that result in the same PrE/NEDiff ratio, the ratio is indicated by the numbers on each line. N is the initial cell number, t is the transition rate from NEDiff to PrE, d1 is the division rate of NEDiff population, d2 of the PrE population, s1 is the survival rate of the NEDiff population, s2 of the PrE population. Diagrams illustrate that changes in the survival rates have stronger impact on increasing the PrE/NEDiff ratio at day 5, compared to division times, whereas on day 3 the division time has a greater impact.
Figure 4 with 2 supplements
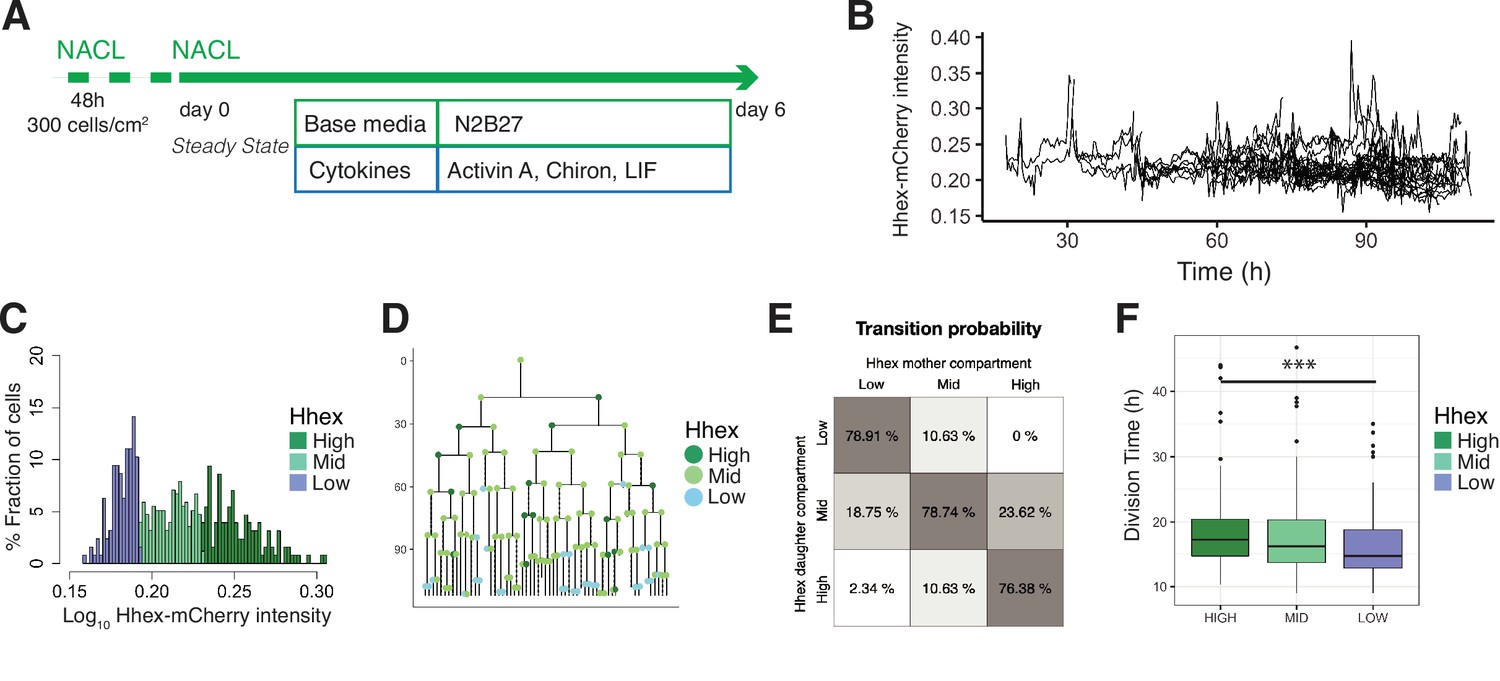
Single-cell quantification of Hhex expression in NACL uncovers a relationship between Hhex levels and cell cycle length.
(A) Schematic of the experimental setup. Cells were plated 48 hr before starting the experiment. Cells were imaged for 6 days acquiring one time frame every 20 min. (B) Example of a cell trace (Time vs. Hhex-mCherry intensity) in the setup analysed. Cells survived and divided over 6 days without any apparent effect of cell death. Cells were entering and exiting higher and lower Hhex states without any apparent bias. (C) Hhex intensity distribution was divided into three compartments: High (includes cells above 75% percentile), Mid (between 25% and 75% percentiles), and Low (cells below 25% percentile). Y-Axis shows the percentage of cells that falls into each bin. See Table 4 for total cell numbers per compartment. (D) Example of a lineage tree with the corresponding compartments of Hhex, by colour. The first and last generation were discarded from further analysis since the cell cycle information is not complete. All lineage trees collected in the NACL condition are shown in Figure 4—figure supplement 2. This example corresponds to Tree 1 in Figure 4—figure supplement 2. (E) Probability of cells to transition compartments between mother and daughter cells, quantified as percentage of cells over one generation. (F) The Low Hhex population divides significantly faster than the High Hhex. ***p value <0.001, Kruskal–Wallis test. The Mid Hhex population shows an in-between division time, suggesting a linear relationship between Hhex expression level and cell cycle length.
Figure 4—figure supplement 1
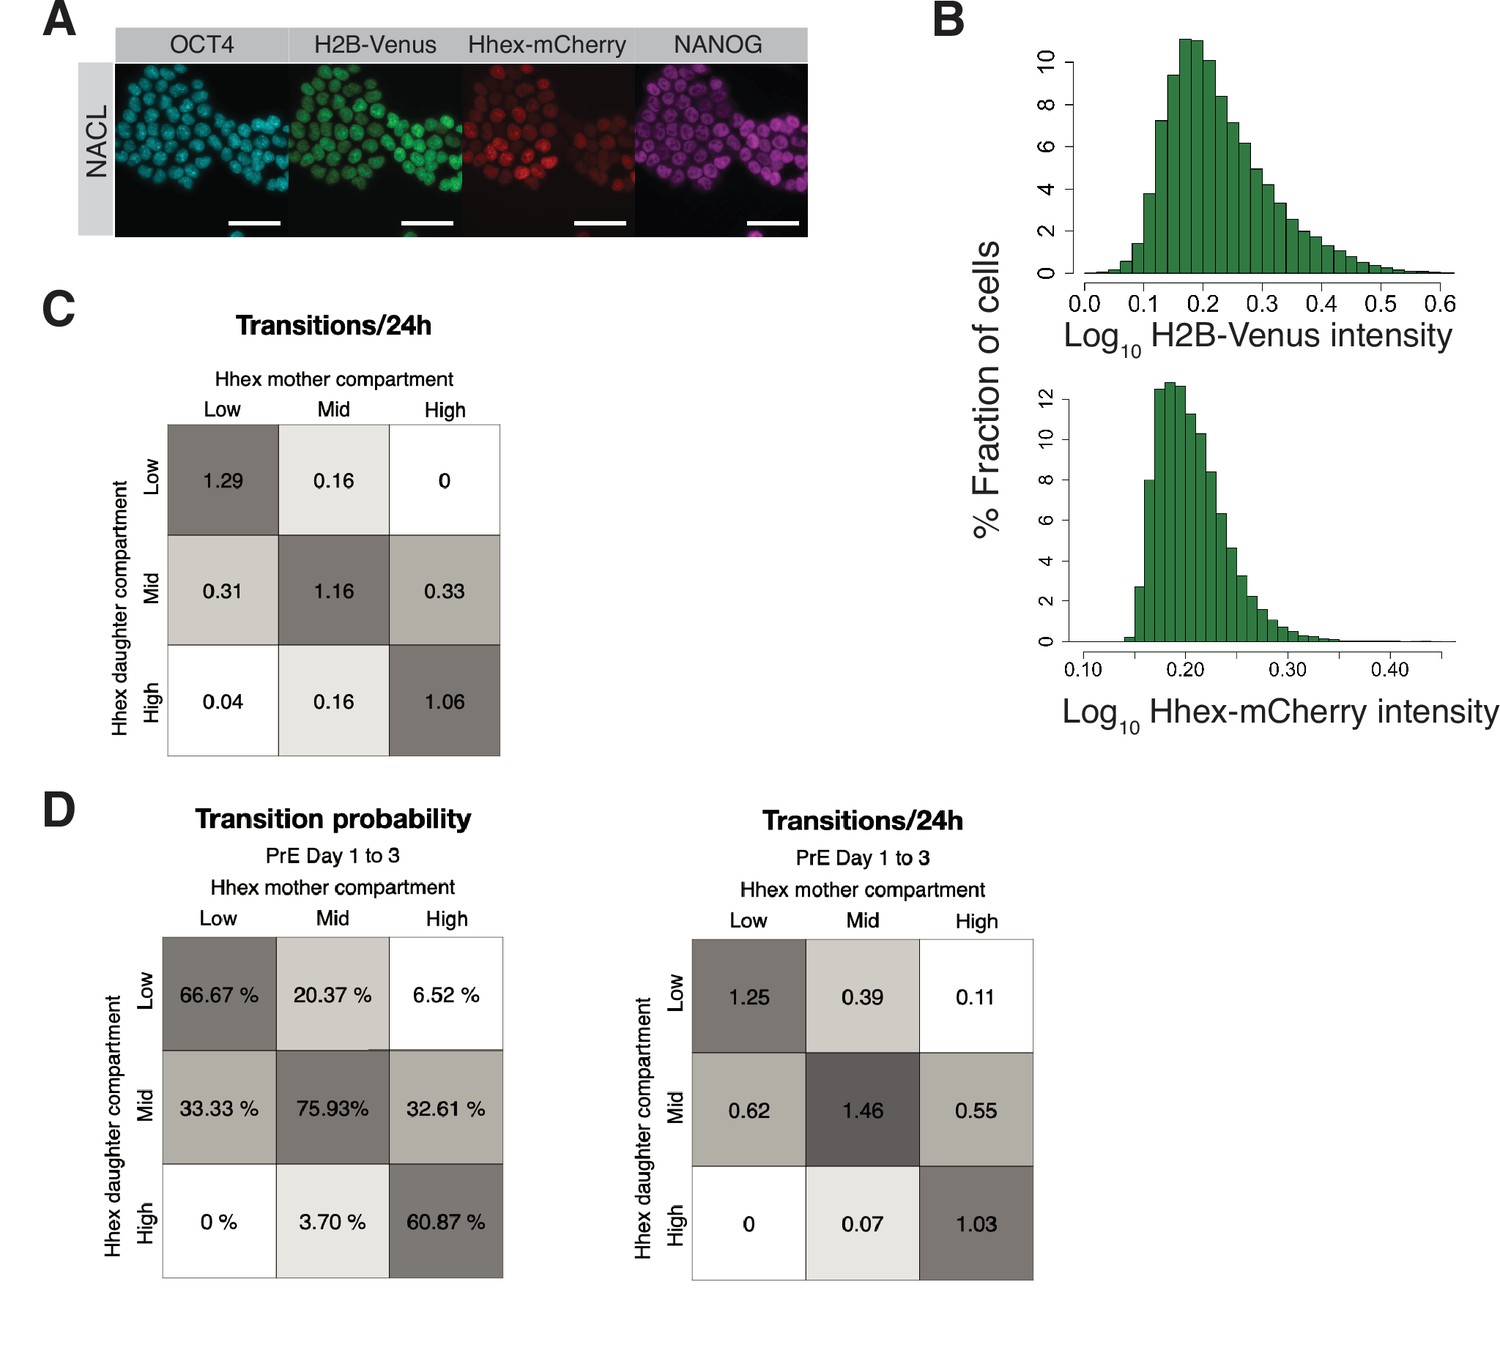
Heterogeneity in defined pluripotent stem cell culture.
(A) HFHCV mouse embryonic stem cells (mESCs) maintained pluripotent identity after 6 days of time lapse, shown by OCT4 and NANOG immunostaining at the end of the experiment. Scale bar: 50 μm. (B) Top: H2B-Venus intensity distribution for all data points collected in NACL. Not normal distribution, p value >0.05 in Shapiro–Wilk’s test. Bottom: Hhex-mCherry intensity distribution for all data points collected in NACL. Not normal distribution, p value >0.05 in Shapiro–Wilk’s test. (C) Number of transitions between Hhex compartments for each 24 hr of time lapse in NACL. (D) Left, transition probability for Hhex compartments during priming in early Primitive Endoderm (PrE) differentiation (days 1–3). Right, number of transitions between Hhex compartments for each 24 hr of time lapse in days 1–3 of PrE differentiation.
Figure 4—figure supplement 2
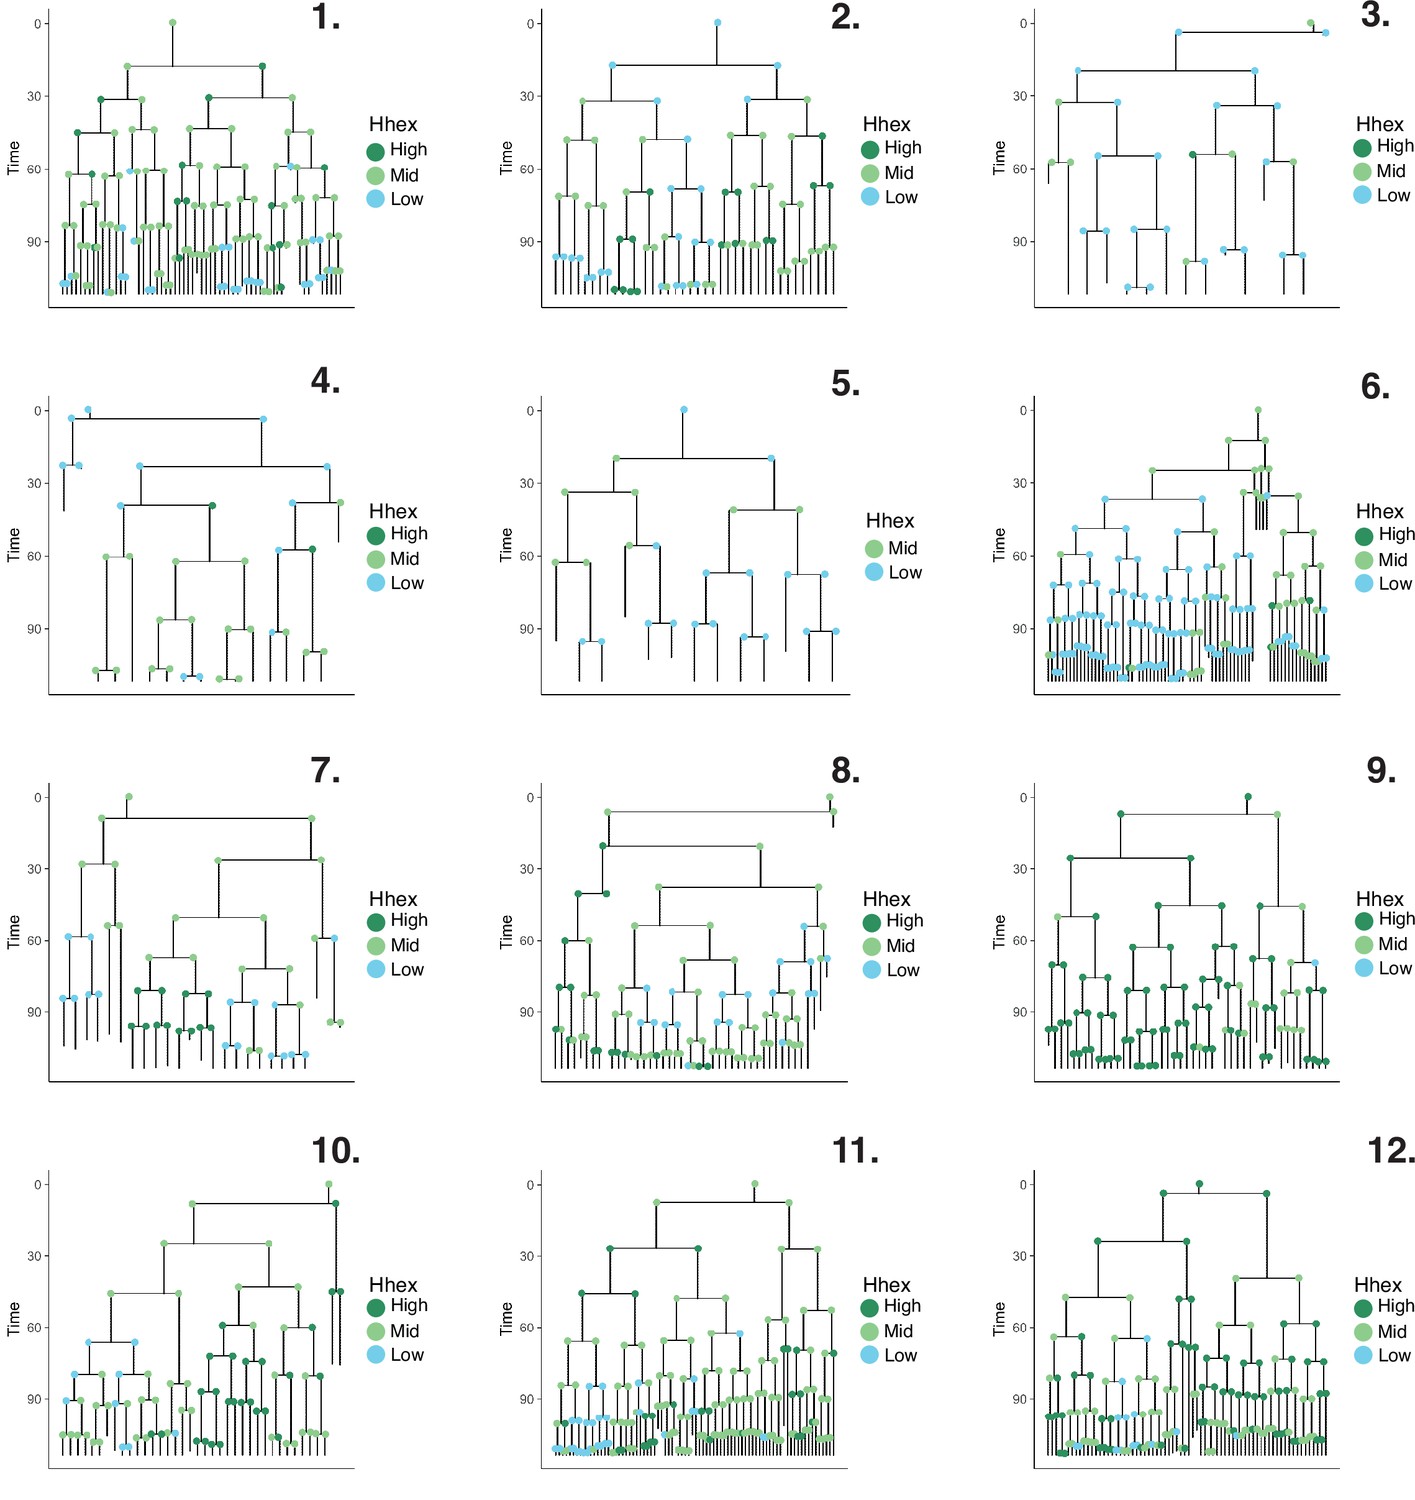
Lineage trees in pluripotent stem cell culture.
Lineage trees generated in the NACL dataset. We manually tracked 1063 cells. After constructing our lineage trees, cells that died or that had not completed a full division cycle were discarded. The final dataset consisted of 509 cells across 12 lineage trees. Cells are coloured based on Hhex compartments described in Figure 4C.
Figure 5 with 2 supplements
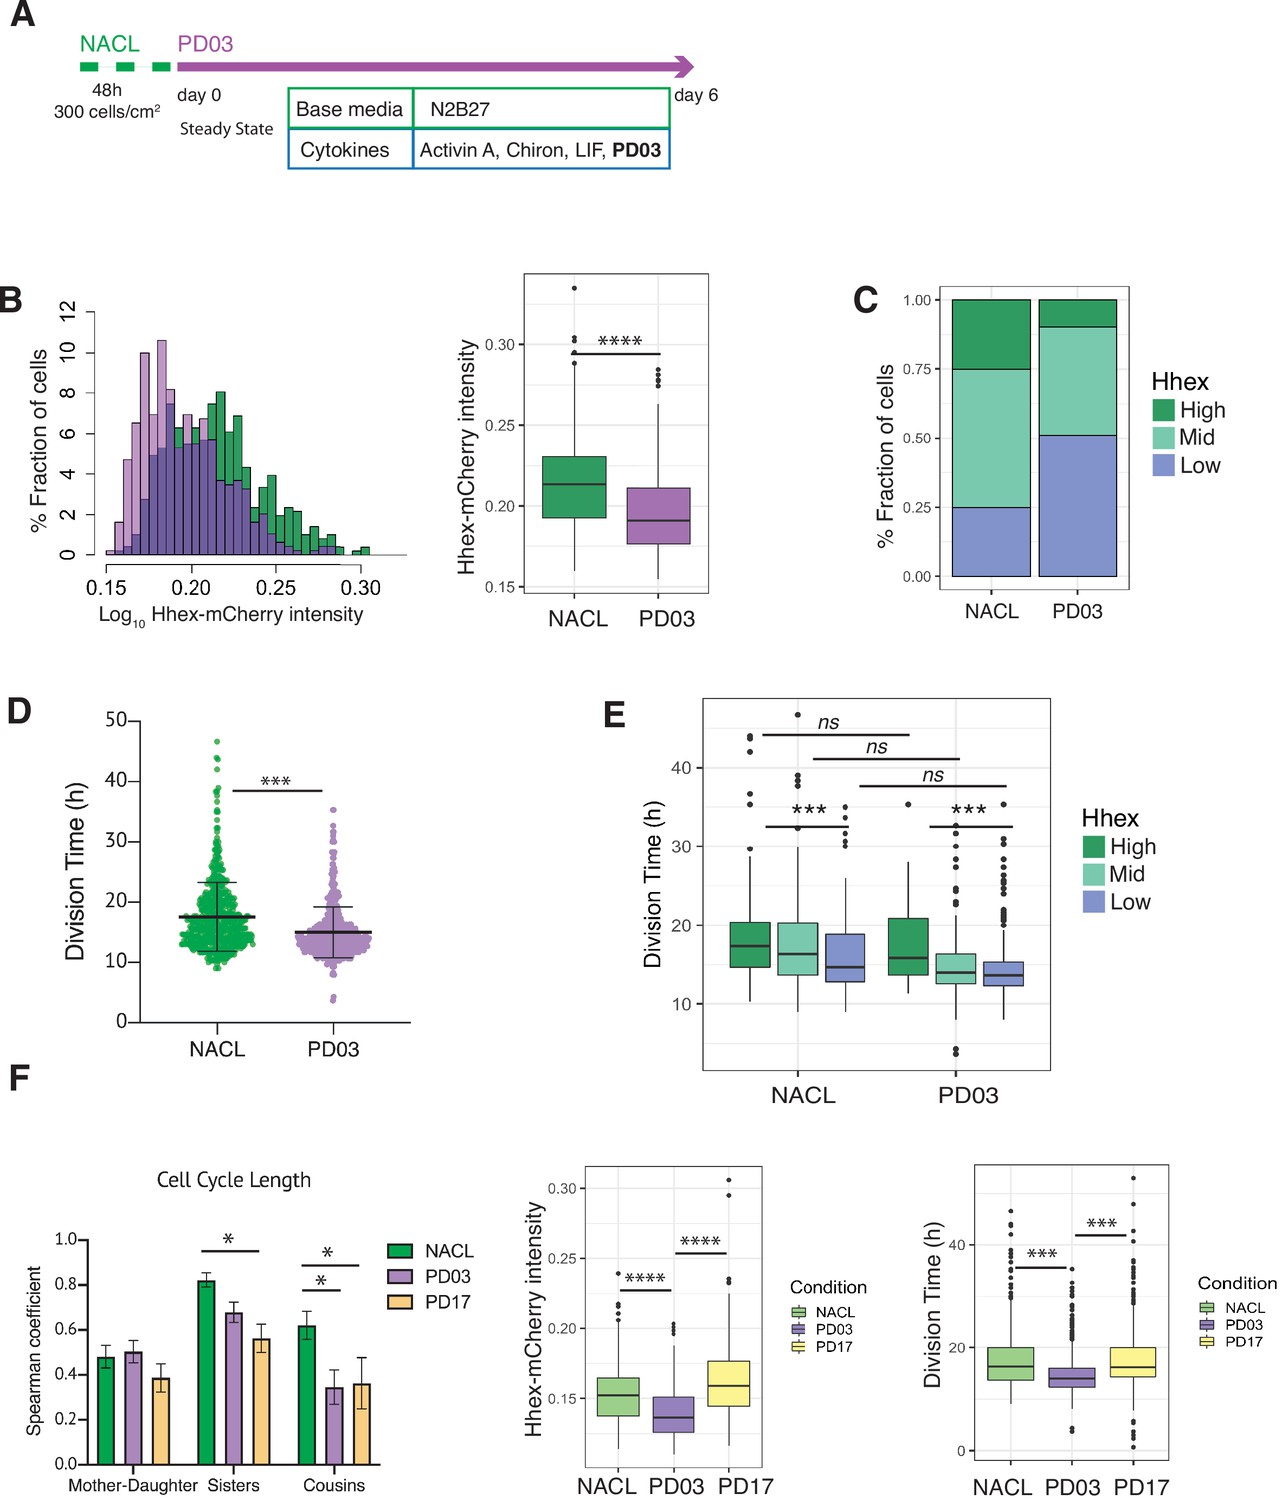
PD03 promotes expansion of the fast proliferating Low Hhex population.
(A) Schematic of experimental setup. Cells were plated 48 hr before starting the experiment in NACL, and PD03 was added at the start of the time lapse. Cells were imaged for 6 days acquiring 1 time frame every 20 min. (B) Hhex intensity is significantly lower in the PD03 treated population. ****p value <0.0001, Wilcoxon test. (C) The lower intensity of Hhex is related to the higher fraction of cells in the Low Hhex population. The Low Hhex population increases from 25% to 50% when PD03 is added. (D) Mouse embryonic stem cells (mESCs) division time is significantly faster in PD03. ***p value <0.001, Mann–Whitney test. (E) Cell cycle in the Low Hhex compartment is faster in PD03 as well as in NACL. ***p value <0.001, Kruskal–Wallis test. (F) Left: Both PD03 and PD17 produce a loss in the cell cycle synchronization between sisters and cousins. All correlation plots are shown in Figure 5—figure supplement 2. *p value <0.05. Right: PD17 does not provide the same alterations in Hhex expression or division time that were generated by PD03. ***p value <0.001, ****p value <0.0001.
Figure 5—figure supplement 1
Lineage trees in pluripotent stem cell culture with PD03.
Lineage trees generated in the PD03 dataset. We manually tracked 1000 cells. After constructing our lineage trees, cells that died or that had not completed a full division cycle were discarded. The final dataset consisted of 490 cells across 9 lineage trees. Cells are coloured based on Hhex compartments described in Figure 4C.
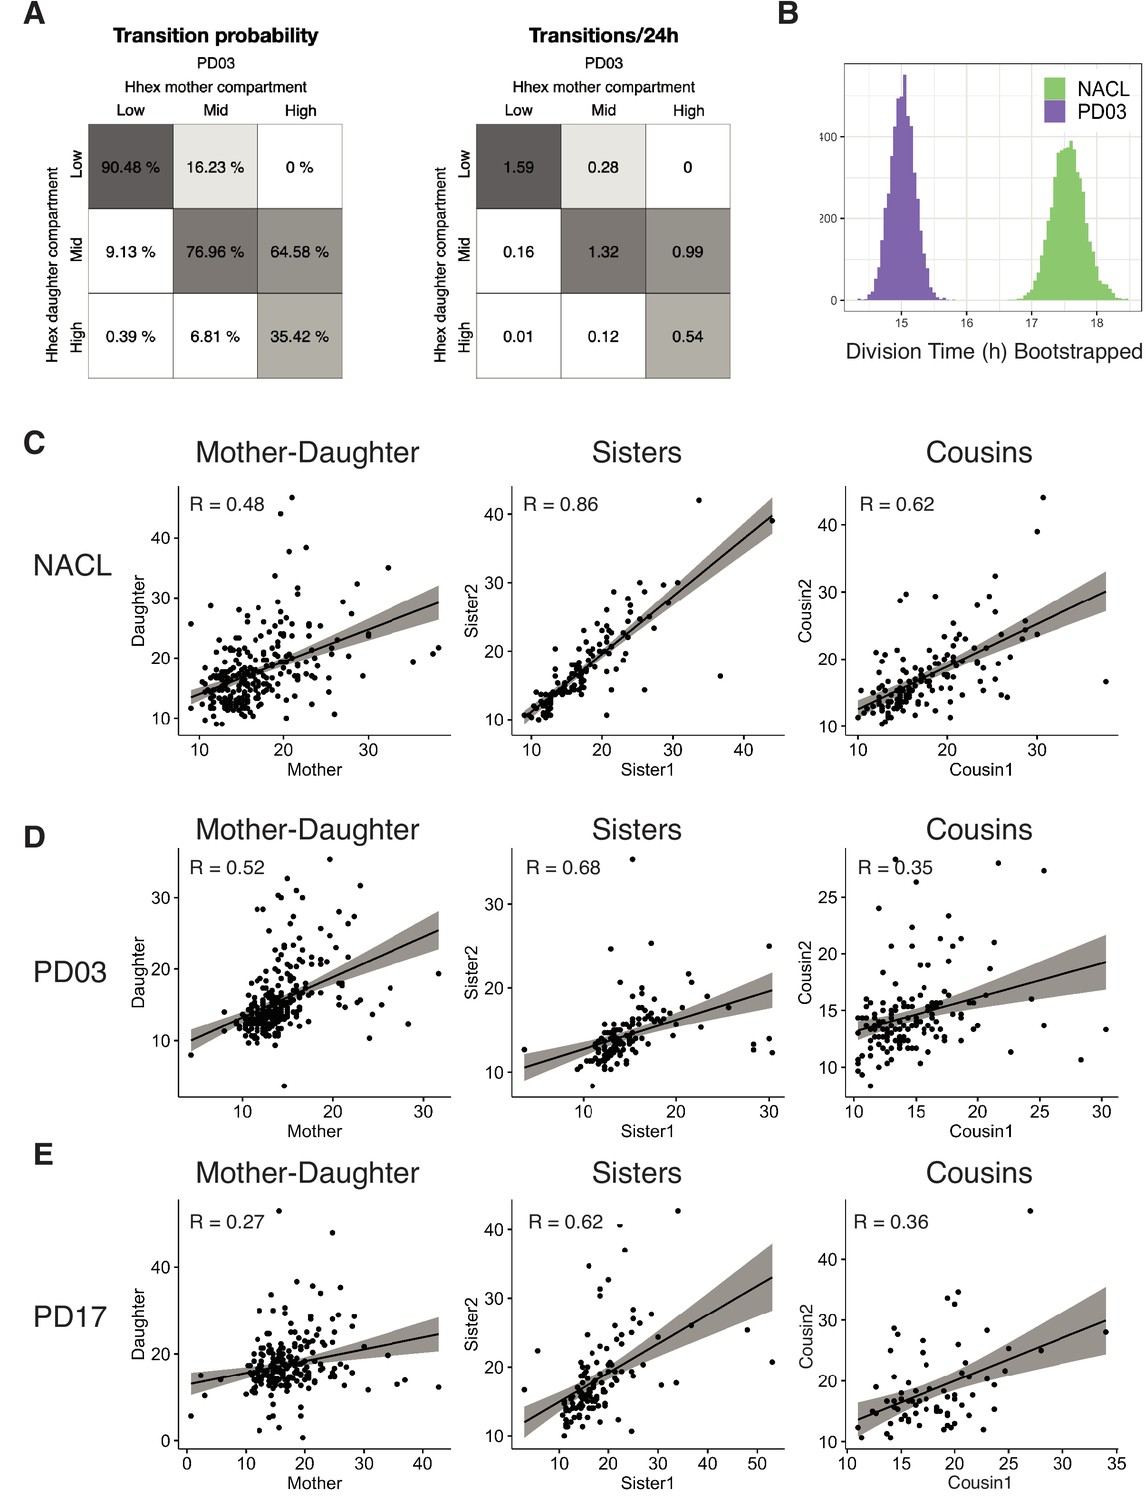
Figure 5—figure supplement 2
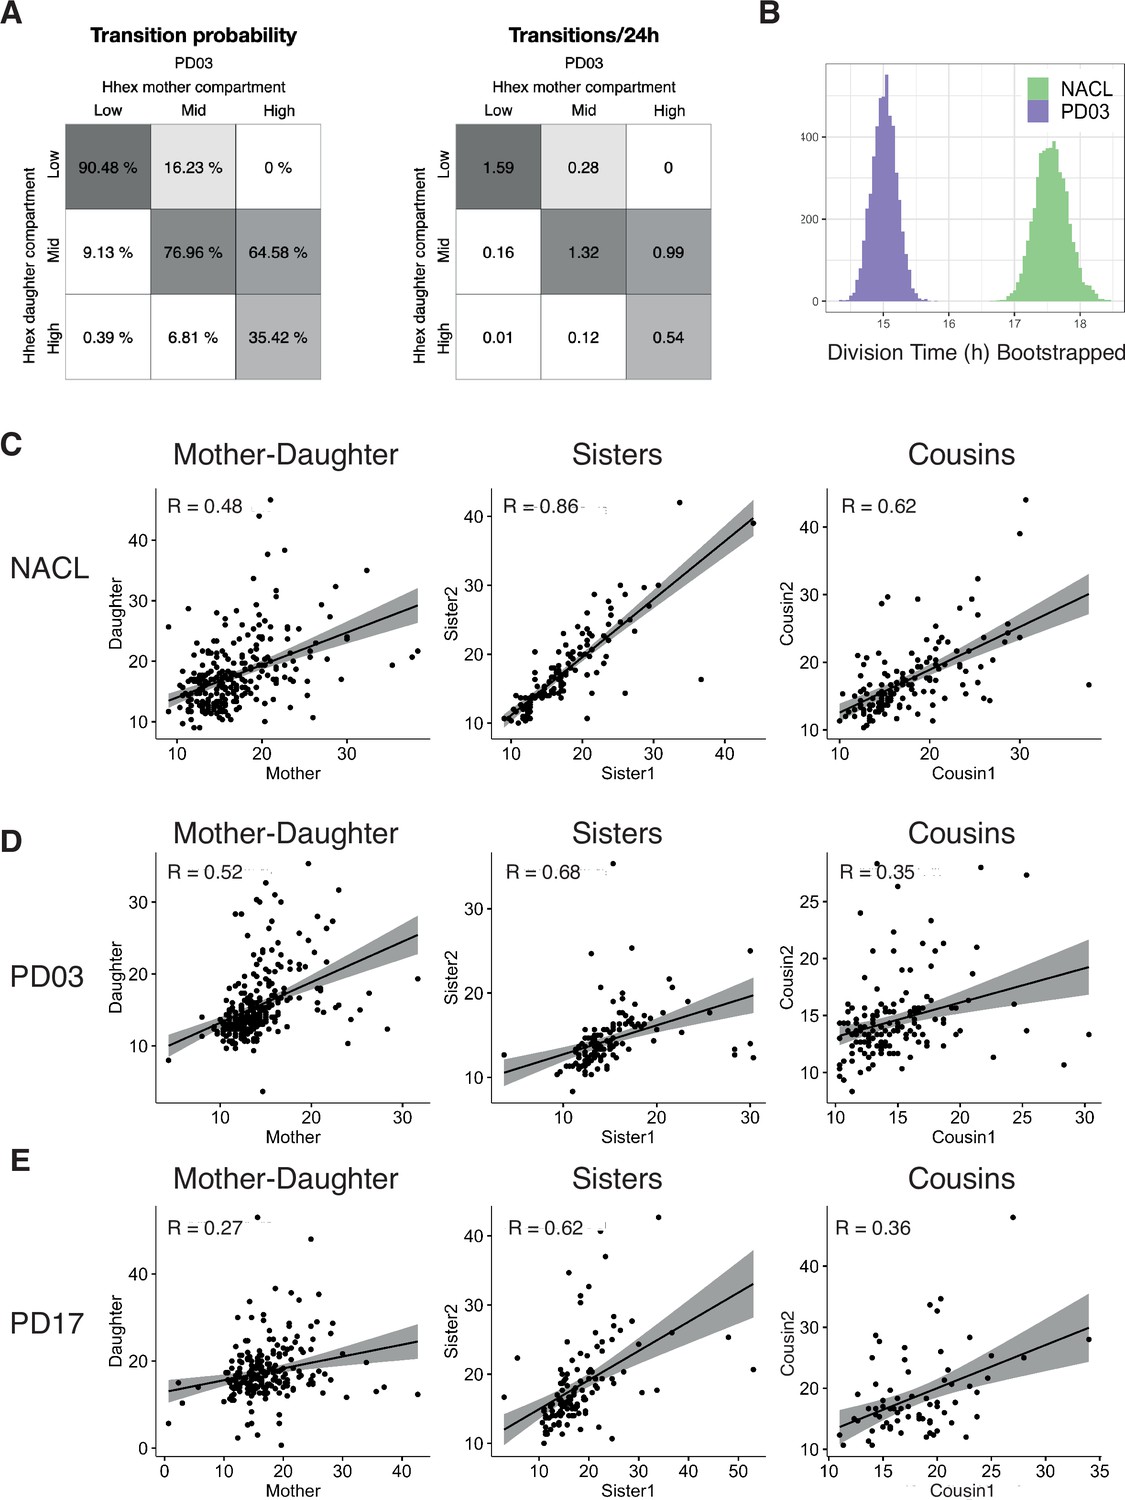
Transitions and cell cycle synchronization in response to FGF/ERK inhibition.
(A) Percentage of cells that transition compartments between mother and daughter cells (left), and number of transitions/24 hr (right), in the PD03 dataset. (B) Bootstrap analysis (100 times) of the division time median, showing a clear difference between the NACL and PD03 dataset. (C) Spearman correlation plots for division times measurements in NACL. From left to right: Mother–daughter correlation, Sister pairs correlation, Cousin pairs correlation. R: Spearman correlation coefficient. (D) Spearman correlation plots for division times measurements in PD03. From left to right: Mother–daughter correlation, Sister pairs correlation, Cousin pairs correlation. R: Spearman correlation coefficient. (E) Spearman correlation plots for division times measurements in PD17. From left to right: Mother–daughter correlation, Sister pairs correlation, Cousin pairs correlation. R: Spearman correlation coefficient.
Figure 6 with 1 supplement
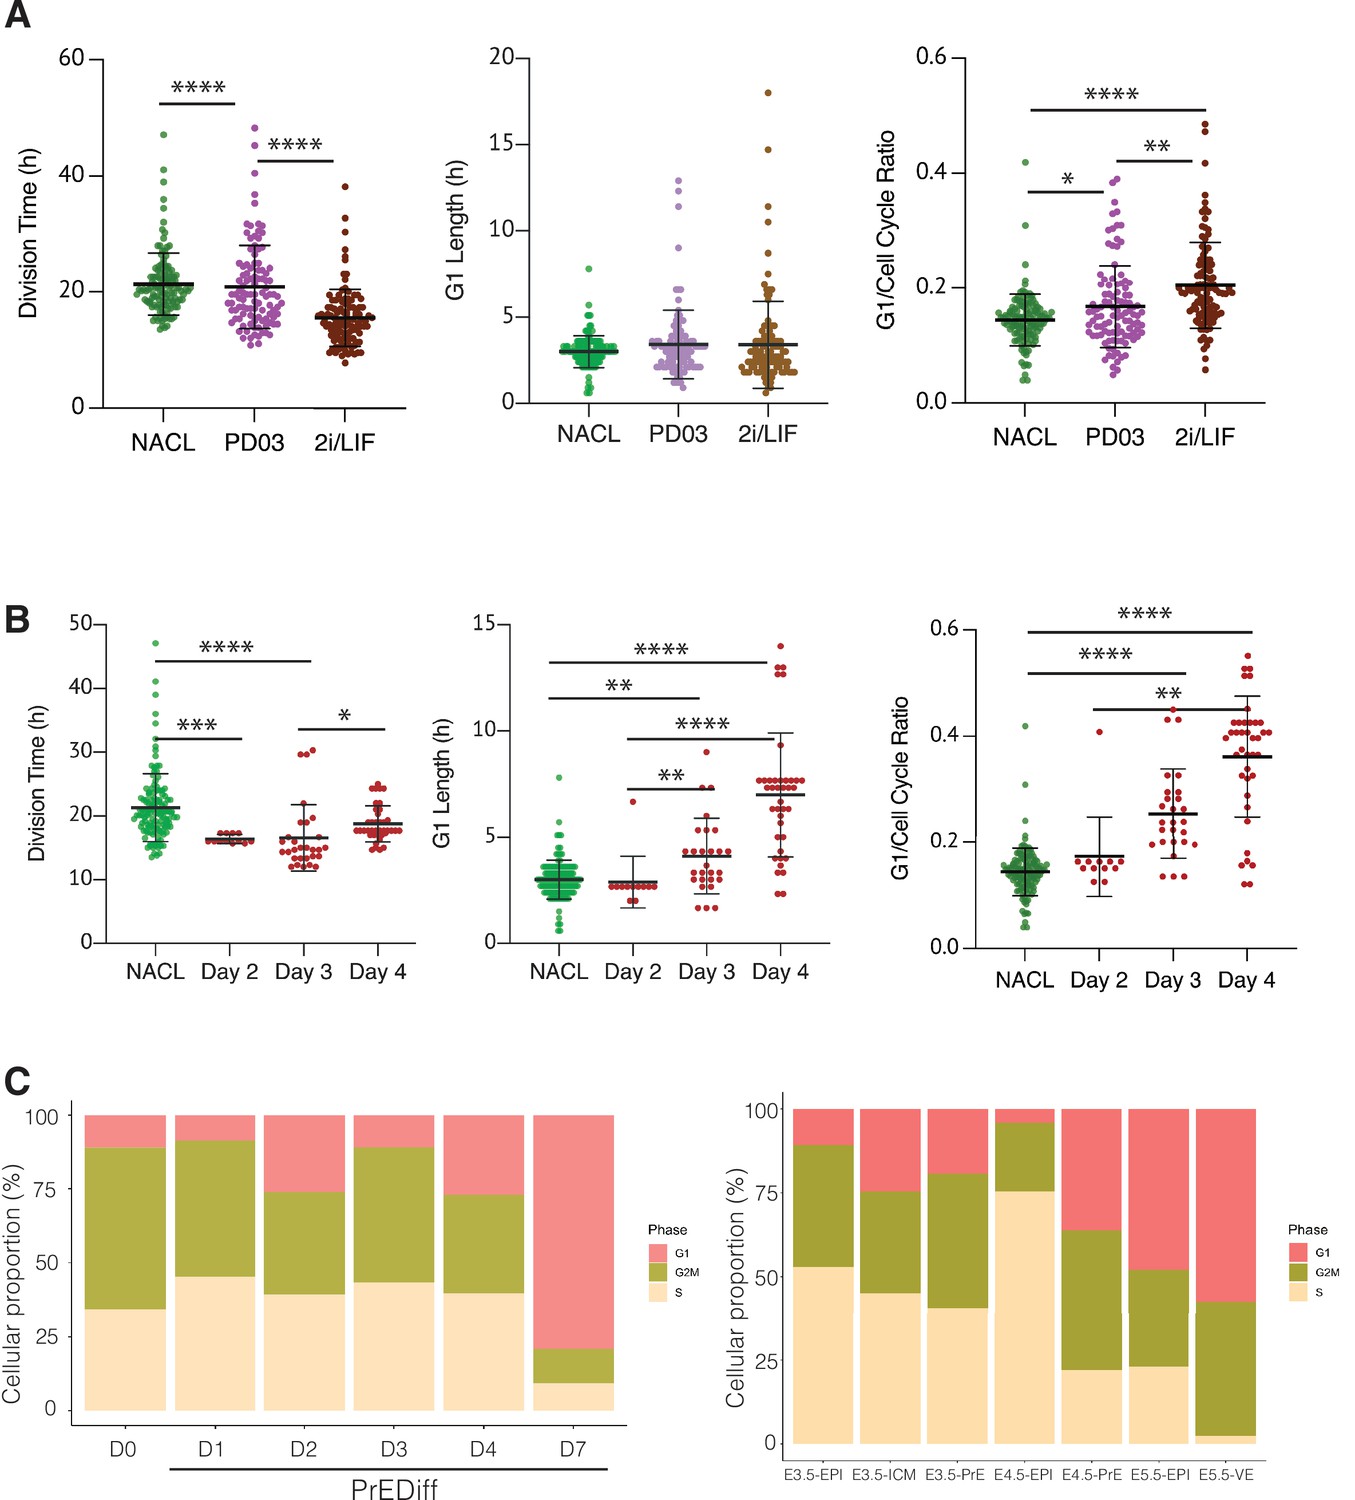
The regulation of cell cycle length during priming and differentiation involves G1 length.
(A) PD03 addition significantly increases the ratio between G1 and division time (*p value <0.05, Kruskal–Wallis test), even though it does not significantly change the G1 length itself in FUCCI cells. Cells cultured in 2i/LIF for two passages show a faster cell cycle than when PD03 was added for a short period (**p value <0.01, ****p value <0.0001, Kruskal–Wallis test). (B) Primitive Endoderm (PrE) differentiated cells show a longer G1 phase and an increase in G1 ratio as they proceed along the differentiation process. Division time is faster at day 3 and then it slows down, consistent with the previous dataset. *p value <0.05, **p value <0.01, ***p value <0.001, ****p value <0.0001, Kruskal–Wallis test. (C) Proportion of cells that express G1, G2/M, or S signature transcriptional profiles. Left: In vitro dataset (this study). Right: In vivo dataset (Nowotschin et al., 2019).
Figure 6—figure supplement 1
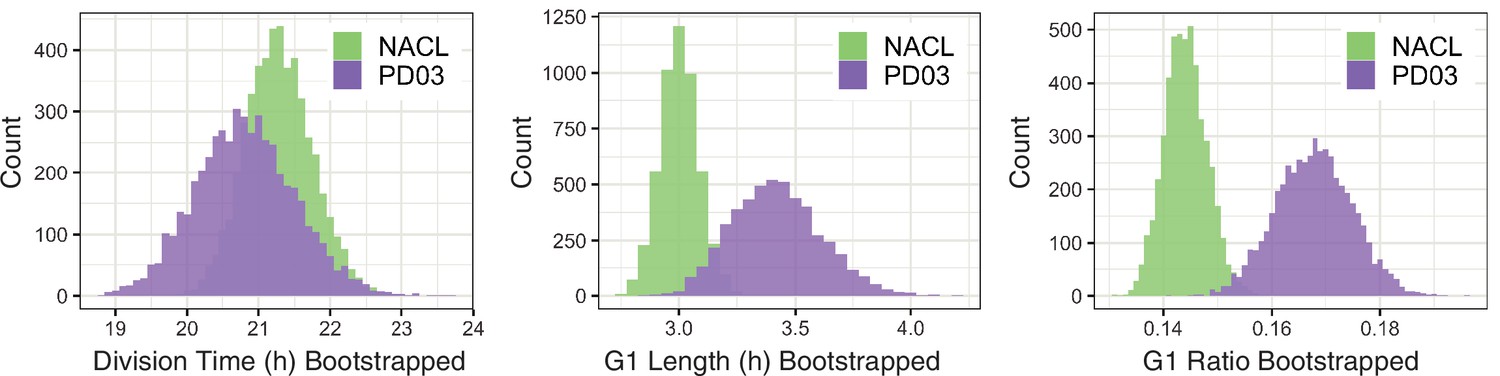
Bootstrap analysis of the FUCCI dataset.
Bootstrap analysis (100 times) of division time, G1 length, and G1 ratio measured in the FUCCI cell line, showing a difference between the NACL and PD03 dataset.
Videos
Video 1
Example of a tracked HFHCV colony during Primitive Endoderm (PrE) differentiation.
Cyan is H2B-Venus, magenta is Hhex-mCherry. Yellow squares show the cell tracking. Scale bar is 300 μm.
Video 2
Example of a tracked HFHCV colony in NACL.
H2B-Venus is shown in cyan, magenta is Hhex-mCherry. Yellow squares show the cell tracking. Scale bar is 200 μm.
Video 3
Example of an imaged FUCCI colony in NACL.
mCherry-Cdt1 is shown in cyan, and H2B-miRF670 is shown in magenta. Scale bar is 20 μm.
Video 4
Example of an imaged FUCCI colony during Primitive Endoderm (PrE) differentiation.
mCherry-Cdt1 is shown in cyan, and H2B-miRF670 is shown in magenta. Scale bar is 300 μm.
Tables
Table 1
Summary of the cell numbers in the different scRNA-seq clusters analysed.
Clusters are annotated as NEDiff, PrE Parental, and PrE according to Figure 1B.
| 2i/LIF | Day 1 | Day 2 | Day 3 | Day 4 | Day 7 | ||
|---|---|---|---|---|---|---|---|
| 2i/LIF | Cluster 1 | 415 | 0 | 0 | 0 | 0 | 0 |
| Cluster 5 | 105 | 0 | 6 | 1 | 0 | 0 | |
| Cluster 6 | 91 | 0 | 0 | 0 | 2 | 1 | |
| NEDiff | Cluster 0 | 8 | 14 | 201 | 205 | 11 | 1 |
| Cluster 2 | 1 | 0 | 0 | 4 | 238 | 103 | |
| PrE Parental | Cluster 3 | 2 | 139 | 78 | 76 | 3 | 2 |
| PrE | Cluster 7 | 0 | 7 | 32 | 29 | 4 | 0 |
| Cluster 4 | 0 | 0 | 1 | 2 | 44 | 162 | |
| Total | 622 | 160 | 318 | 317 | 302 | 269 |
Table 2
Comparison of survival and proliferation during time lapse of Primitive Endoderm (PrE) differentiation.
Survival rate is calculated as a ratio between cells that survived and total cells. Death rate is the ratio between cells that died and total number of cells. As total cells, only cells with complete cell cycle information are considered. Division time (hours) is shown as median ± standard deviation.
| PrE | NEDiff | ||||||||
|---|---|---|---|---|---|---|---|---|---|
| Day 2 | Day 3 | Day 4 | Day 5 | Day 1 | Day 2 | Day 3 | Day 4 | Day 5 | |
| Cells that survive | 5 | 32 | 102 | 228 | 54 | 41 | 38 | 42 | 21 |
| Cells that die | 1 | 4 | 7 | 24 | 20 | 42 | 16 | 40 | 57 |
| Cells total | 6 | 36 | 109 | 252 | 74 | 83 | 54 | 82 | 78 |
| Survival rate | 0.83 | 0.89 | 0.94 | 0.90 | 0.73 | 0.49 | 0.70 | 0.51 | 0.27 |
| Death rate | 0.17 | 0.11 | 0.06 | 0.10 | 0.27 | 0.51 | 0.30 | 0.49 | 0.73 |
| Division time (hr) | 13.3 ± 4 | 11.0 ± 3 | 13.0 ± 4 | 17.3 ± 4 | 16.3 ± 4 | 18.0 ± 7 | 20.0 ± 6 | 17.0 ± 7 | 22.0 ± 7 |
Table 3
Analysis of Primitive Endoderm (PrE) parental cells.
Division time (hr) is shown as median ± standard deviation. Hhex-mCherry fluorescence (absolute units) is shown as median ± standard deviation.
| PrE Fate | NEDiff Fate | |
|---|---|---|
| Cells | 20 | 151 |
| Division time (hr) | 17.67 ± 6 | 17.33 ± 6 |
| Hhex-mCherry (a.u.) | 0.18 ± 0.03 | 0.15 ± 0.02 |
Table 4
Comparison of survival and proliferation between Hhex compartments.
Survival rate is calculated as a ratio of the number of cells that survived to the total number of cells. Death rate is the ratio of the number of cells that died to the total number of cells. As total cells, only cells with complete cell cycle information are considered. Division time (hr) is shown as median ± standard deviation. Residence times is shown as mean ± standard deviation of generations (or hours below) in which a cell stays in the same state.
| NACL | PD03 | |||||
|---|---|---|---|---|---|---|
| High | Mid | Low | High | Mid | Low | |
| Cells that survive | 127 | 254 | 128 | 48 | 191 | 252 |
| Cells that die | 12 | 35 | 34 | 14 | 55 | 55 |
| Cells total | 139 | 289 | 162 | 62 | 246 | 307 |
| Survival rate | 0.91 | 0.88 | 0.79 | 0.77 | 0.78 | 0.82 |
| Death rate | 0.09 | 0.12 | 0.21 | 0.23 | 0.22 | 0.18 |
| Division time (hr) | 17.3 ± 6 | 16.3 ± 6 | 14.7 ± 5 | 15.8 ± 5 | 14.0 ± 4 | 13.7 ± 4 |
| Residence time (generations) | 2.1 ± 1.27 | 2.2 ± 1.26 | 2.1 ± 1.34 | 1.6 ± 0.86 | 2.1 ± 1.22 | 2.9 ± 1.63 |
| Residence time (hr) | 37.9 ± 28.5 | 37.6 ± 28.9 | 29.6 ± 20.5 | 25.7 ± 18.5 | 29.1 ± 19.7 | 39.0 ± 23.9 |
Table 5
Summary of dataset collected with the FUCCI reporter.
Division time (hours) is shown as median ± standard deviation. G1 length (hours) is shown as median ± standard deviation. G1 ratio is produced as the ratio between the G1 length and the total division time, and it is shown as median ± standard deviation.
| NACL | PD03 | 2i/LIF | PrE | |||
|---|---|---|---|---|---|---|
| Day 2 | Day 3 | Day 4 | ||||
| Division time (hr) | 20.4 ± 5 | 19.5 ± 7 | 15.0 ± 5 | 16.33 ± 1 | 15.0 ± 5 | 18.0 ± 3 |
| G1 length (hr) | 2.7 ± 2.5 | 3.1±1.9 | 3.0 ± 0.9 | 2.7 ± 1.2 | 4.3 ± 1.5 | 7.3 ± 2.9 |
| G1 ratio | 0.14 ± 0.1 | 0.15 ± 0.1 | 0.19 ± 0.1 | 0.16 ± 0.1 | 0.24 ± 0.1 | 0.40 ± 0.1 |
| Cells total | 126 | 104 | 110 | 12 | 29 | 39 |
Additional files
Download links
A two-part list of links to download the article, or parts of the article, in various formats.
Downloads (link to download the article as PDF)
Open citations (links to open the citations from this article in various online reference manager services)
Cite this article (links to download the citations from this article in formats compatible with various reference manager tools)
Transcriptional heterogeneity and cell cycle regulation as central determinants of Primitive Endoderm priming
eLife 11:e78967.
https://doi.org/10.7554/eLife.78967


