Endo-lysosomal assembly variations among human leukocyte antigen class I (HLA class I) allotypes
- Department of Microbiology and Immunology, Michigan Medicine, University of Michigan-Ann Arbor, United States
- Graduate Program in Immunology, Michigan Medicine, University of Michigan-Ann Arbor, United States
Figures
Figure 1 with 1 supplement

Varying human leukocyte antigen B (HLA-B) dependencies on endo-lysosomal pH for surface expression on monocyte-derived dendritic cells (moDCs).
(A and B) moDCs from select donors (Supplementary file 1) were treated with bafilomycin A1 over a 4-hr time course and stained with monoclonal anti-Bw6 (A) or anti-Bw4 (B) antibodies to measure surface HLA-B. (C) HLA-B expression, assessed with either anti-Bw6 or anti-Bw4, after 4 hr of bafilomycin treatment was compared across allotypes with a one-way ANOVA. B*08:01+ donors (n=6 experiments): 55 (n=2), 94 (n=1), 166 (n=1), 178 (n=1), and 198 (n=1); B*44:02+ donors (n=7 experiments): 94 (n=1), 128 (n=2), 196 (n=1), and 267 (n=3); B*07:02+ donors (n=6 experiments): 14, 20, 269 (n=3), and 270 (n=1); B*51:01+ donors (n=3 experiments): 14 (n=1) and 232 (n=2); B*15:01+ donors (n=4 experiments): 124 (n=2) and 128 (n=2); B*27:05+ donors (n=3 experiments): 142, 250, and 256; B*57:01+ donors (n=6 experiments): 156 (n=1), 178 (n=1), 210 (n=1), and 269 (n=3); B*35:01+ donors (n=4 experiments): 24 (n=2), 187 (n=1), and 210 (n=1). (D) Relative tapasin dependence of B*08:01, B*35:01, B*44:02, and B*57:01, quantified by the surface expression in M553 cells with or without tapasin. Data are from Rizvi et al., 2014. (E) Relative transporter associated with antigen processing (TAP) dependence of four HLA-B allotypes, quantified by the ratio of surface expression in the presence or absence of TAP. The HLA-B expression was measured with the W6/32 antibody (B*08:01, B*35:01, and B*44:02), anti-HA antibody (B*35:01, B*57:01, and B*44:02) or both (B*44:02 and B*35:01). Data are from Geng et al., 2018. (F) HLA-B peptidome diversity is assessed by calculating the Shannon Entropy values at the P1-P5 and PC-PC-2 amino acid positions of 8–11 mer peptides identified for each allotype from the immunopeptidome analyses of Sarkizova et al., 2020. The Shannon Entropy calculations were performed as described by Yarzabek et al., 2018. For each allotype, the sum of the Shannon Entropy values for the P1-P5 and PC-PC-2 positions is calculated and plotted for 8–9 mer peptides (B*08:01) or 9–11 mer peptides (other allotypes). (G) The cytoplasmic tail regions of four HLA-B allotypes, starting at amino acid 310, were aligned using sequences from the Immuno Polymorphism Database (https://www.ebi.ac.uk/ipd/imgt/hla/). (H) moDCs were pulsed with either B*08:01 or B*35:01 control peptides (mutated canonical peptides with poor binding) in the presence or absence of bafilomycin for 4 hr. Cells were stained with the anti-β2m antibody BBM.1. N=15 experiments, significance ± bafilomycin was assessed using paired t tests. (I) Experiments were performed as in (H) but stained with the antibody HC10. N=12 experiments, significance ± bafilomycin was assessed using paired t tests.
-
Figure 1—source data 1
Monocyte-derived dendritic cell (moDC) human leukocyte antigen B (HLA-B) bafilomycin time course.
Data for Figure 1A–C. Donors were selected to be heterozygous for one Bw6 and one Bw4 allotype with one or less cross-reactive HLA-C allotype per HLA-B allotype of interest. Monocytes were isolated and differentiated into moDCs for 7 d, followed by treatment with bafilomycin A1 for 1, 2, or 4 hr. HLA-B expression was measured with anti-Bw6 or anti-Bw4 and normalized relative to the untreated condition.
- https://cdn.elifesciences.org/articles/79144/elife-79144-fig1-data1-v2.xlsx
-
Figure 1—source data 2
Human leukocyte antigen B (HLA-B) tapasin-dependence, transporter associated with antigen processing-dependence, and Shannon Entropy.
Data for Figure 1D–F. Re-analyzed from previous studies (Rizvi et al., 2014; Geng et al., 2018; Sarkizova et al., 2020) to describe HLA-B assembly modes.
- https://cdn.elifesciences.org/articles/79144/elife-79144-fig1-data2-v2.xlsx
-
Figure 1—source data 3
BBM.1 and HC10 staining with and without bafilomycin.
Data for Figure 1H–I. Monocyte-derived dendritic cells were differentiated and pulsed with control (non-binding) peptide for 4 hr in the presence or absence of bafilomycin. Cells were stained with either BBM.1 (anti-β2m) or HC10 (anti-open human leukocyte antigen class I).
- https://cdn.elifesciences.org/articles/79144/elife-79144-fig1-data3-v2.xlsx
Figure 1—figure supplement 1
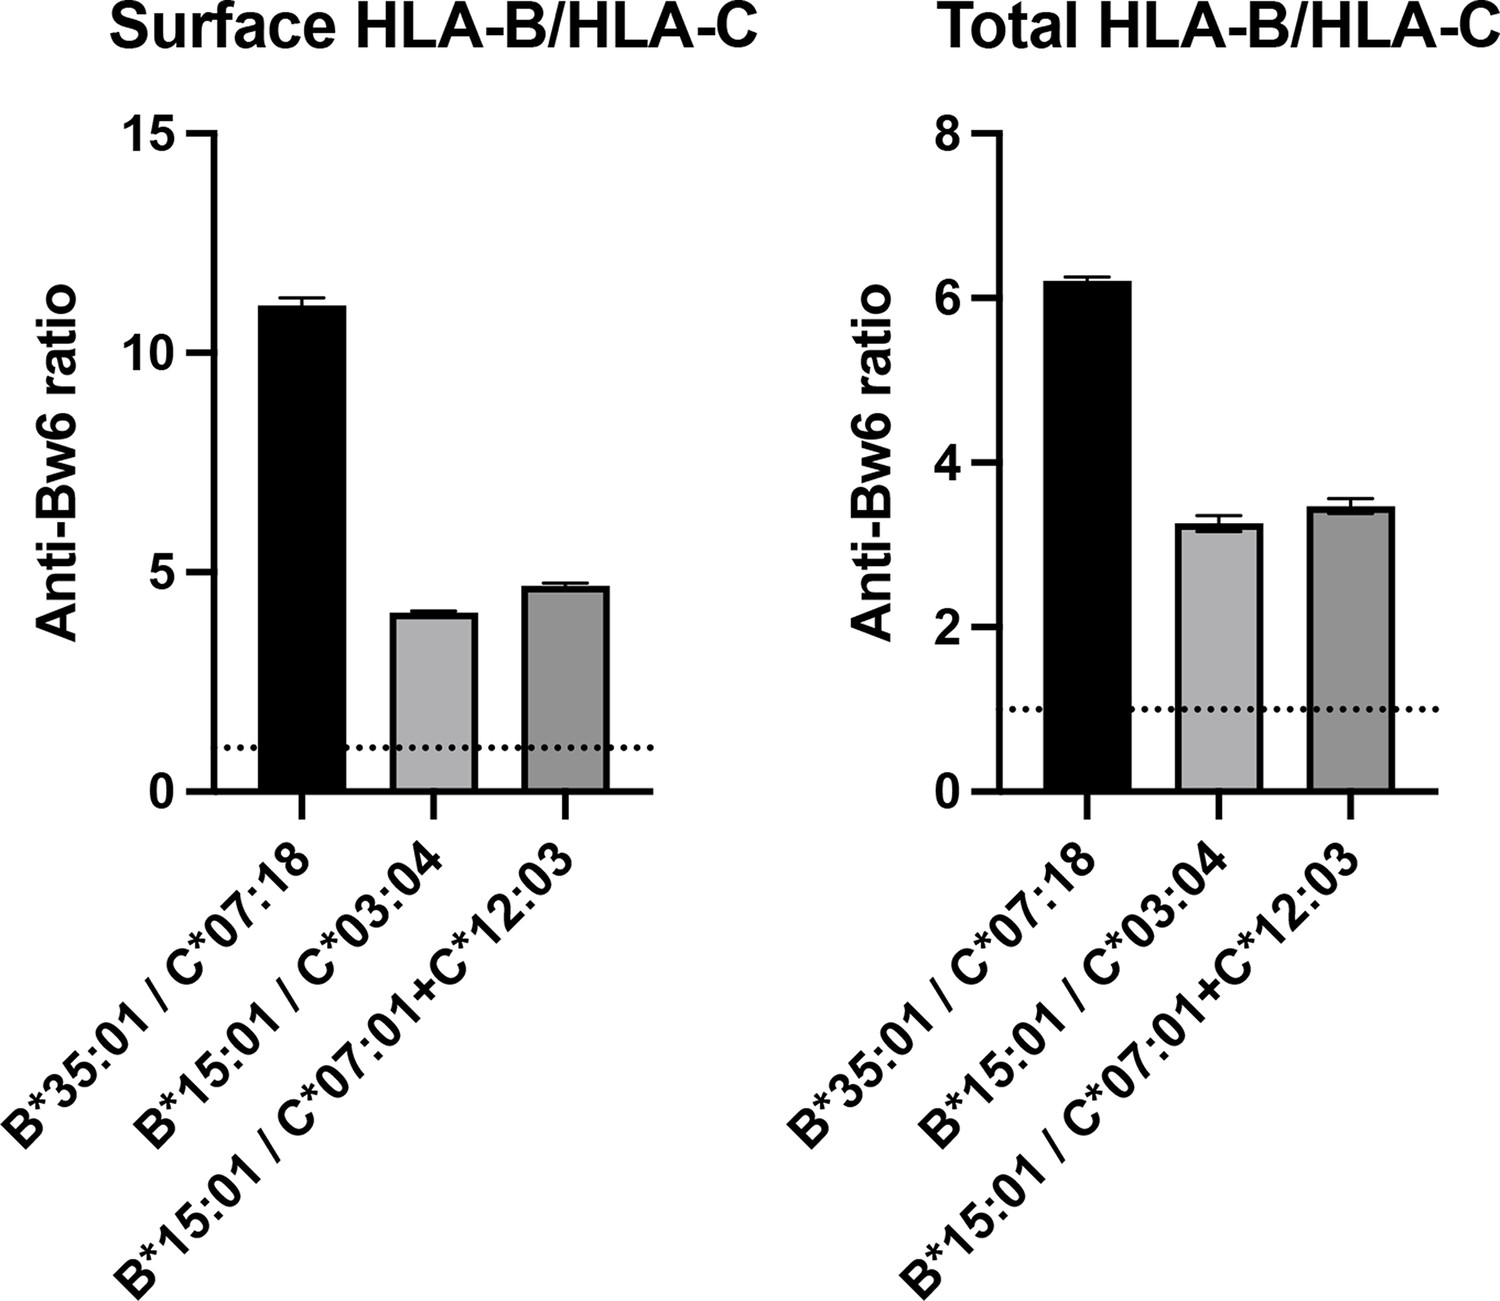
Human monocyte-derived dendritic cells (moDCs) express human leukocyte antigen B (HLA-B) at least four times higher than HLA-C on the cell surface, as detected with anti-Bw6.
Donors were selected expressing either a single HLA-B allotype with a Bw6 epitope and no cross-reactive HLA-C (called HLA-B donor), or those with no anti-Bw6-reactive HLA-B, but with one to two HLA-Cs, containing a Bw6 epitope (called HLA-C donor). For each experiment, an HLA-B donor was recruited with an HLA-C donor for parallel measurements of cell-derived anti-Bw6 mean fluorescence intensity (MFI) values. Monocytes were isolated and differentiated to moDCs, followed by fixation and staining for surface Bw6, or fixation, permeabilization, and staining for total Bw6. The anti Bw6 MFI values from the HLA-B donors were divided by the anti-Bw6 signals from the HLA-C donors to find the fold difference in HLA-B expression relative to HLA-C expression, which ranged from three- to elevenfold. HLA-B donors were: 24 n=1 (A*02:01, A*24:02, B*35:01, B*51:01, C*15:02, C*04:04) and 124 n=2 (A*32:01, A*11:01, B*15:01, B*53:01, C*06:02, C*04:01). HLA-C donors were: 205 n=1 (A*01:01, A*68:01, B*13:02, B*58:01, C*07:18, C*06:02), 38 n=1 (A*02:01, A*02:01, B*13:02, B*13:01, C*03:04, C*06:02), and 76 n=1 (A*24:02, A*01:01, B*15:17, B*38:01, C*07:01, C*12:03).
-
Figure 1—figure supplement 1—source data 1
Relative anti-Bw6 cross-reactivity to human leukocyte antigen C (HLA-C) on monocyte-derived dendritic cells.
Data for Figure 1—figure supplement 1. Donors were selected that had either: (1) one Bw6-reactive HLA-B allotype and no cross-reactive HLA-C allotypes, or (2) no Bw6-reactive HLA-B allotypes and one to two cross-reactive HLA-C allotypes. Surface and total Bw6 was measured, and the ratio of HLA-B to HLA-C signal with anti-Bw6 was measured.
- https://cdn.elifesciences.org/articles/79144/elife-79144-fig1-figsupp1-data1-v2.xlsx
Figure 2
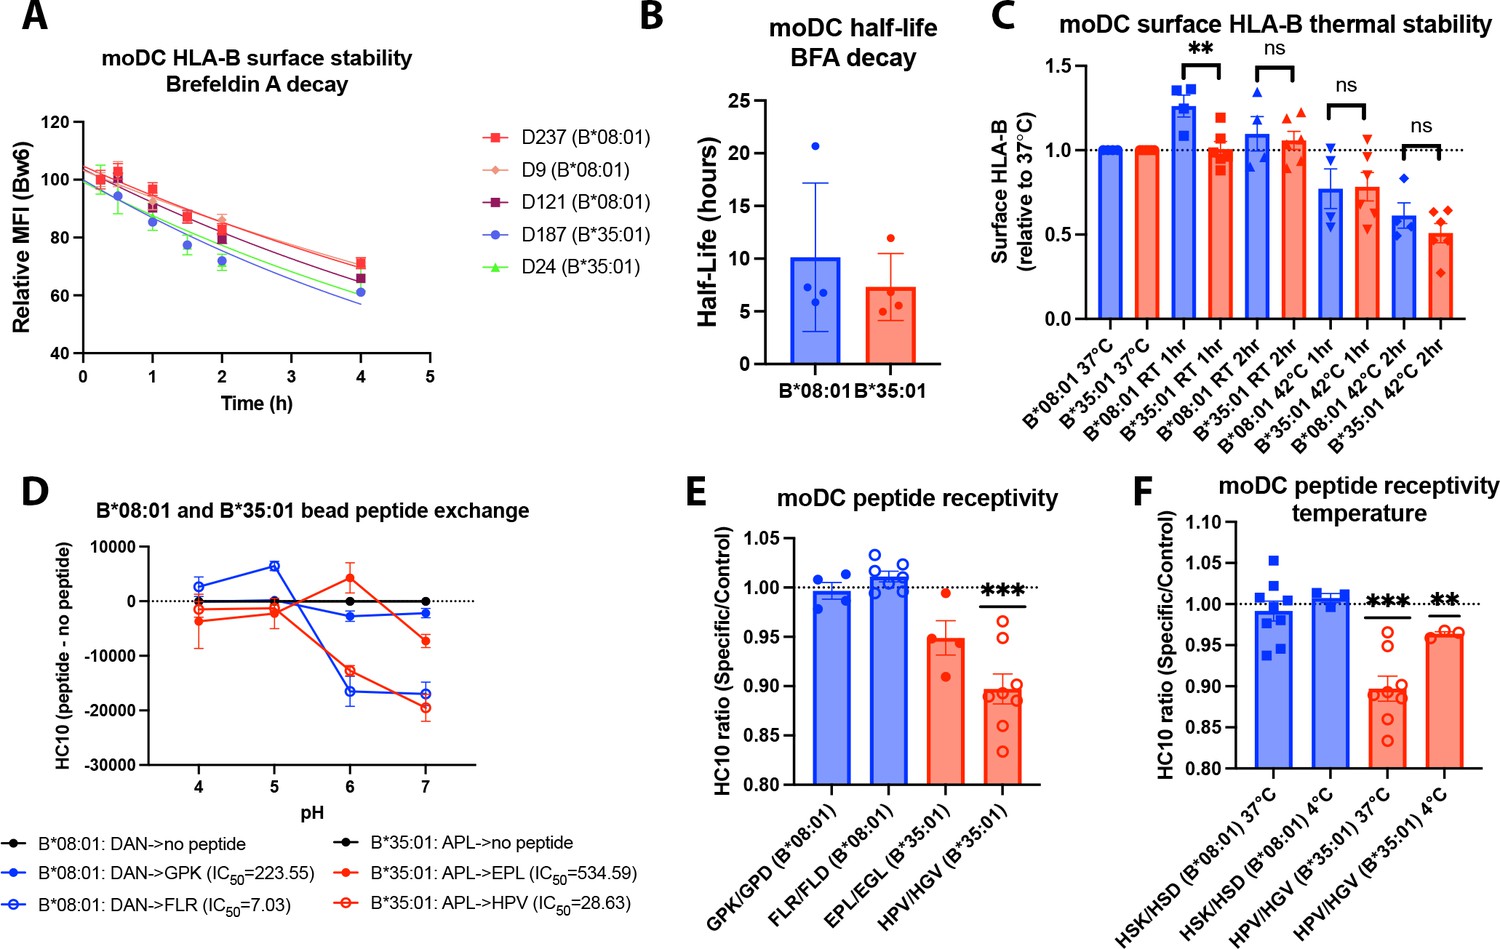
Assessments of allotype-dependent differences in (human leukocyte antigen-Bw6) HLA-Bw6 surface stability and peptide occupancy in monocyte-derived dendritic cells (moDCs).
(A) Representative moDC HLA-Bw6 surface decay plots over a 4-hr time course after treatment with brefeldin A (BFA). (B) Average HLA-Bw6 half-life on moDCs extrapolated from BFA decay-rates. B*35:01+ donors were: 24 (n=1) 187 (n=2), and 210 (n=1). B*08:01+ donors were: 9 (n=1), 121 (n=1), 198 (n=1), and 237 (n=1). B*08:01+ n=4 experiments (four donors), B*35:01+ n=4 experiments (three donors). Data were analyzed with an unpaired t test. (C) HLA-B thermostability assays were performed by incubating B*08:01+ or B*35:01+ moDCs at room temperature (RT), 37°C, or 42°C for 1 or 2 hr, followed by staining with anti-Bw6 antibody. HLA-B expression was normalized to 37°C, and unpaired t tests were used to assess differences between B*08:01 and B*35:01 responses. B*08:01 donors (n=4 experiments): 28 (n=1), 121 (n=1), 178 (n=1), and 198 (n=1). B*35:01 donors (n=6 experiments): 24 (n=2), 187 (n=1), 210 (n=2), and 274 (n=1). (D) Epitope-linked purified and biotinylated B*08:01 and B*35:01 proteins procured from the NIH tetramer core were digested overnight with PreScission protease to release the covalently linked peptides and replace with low-affinity peptides (DAN for B*08:01 and APL for B*35:01). This was followed by binding to streptavidin beads and washing. Exchange with medium- or high-affinity peptides at various pH values was undertaken by incubation for 1.5 hr at 37°C, followed by staining with the HC10 monoclonal antibody. N=2 experiments were undertaken in replicate for each allotype. (E) moDCs pulsed with B*08:01-specific peptides GPK and FLR or B*35:01-specific peptides, EPL and HPV, were stained with the monoclonal antibody HC10 to measure peptide-receptive HLA-B. Staining with specific peptides was plotted as a ratio to the control peptides GPD and FLD (for B*08:01) or EGL and HGV (for B*35:01). Ratios were compared to 1 (no difference between specific and control peptides) using a one sample t test. B*08:01 donors were: 9, 94, 105, 121, 130, 148, 166, 178, 198, and 237. B*35:01 donors were: 24, 168, 187, and 210. B*08:01 GPK/GPD n=4, FLR/FLD n=7. B*35:01 HPV/HGV n=8, EPL/EGL n=4. (F) moDC peptide receptivity experiments as in (E) with HSK/HSD peptide pair for B*08:01 and HPV/HGV peptide pair for B*35:01, including incubation with peptide at 4°C. n=3 experiments were undertaken at 4°C for each allotype.
-
Figure 2—source data 1
Monocyte-derived dendritic cell (moDC) human leukocyte antigen B half-life with brefeldin A treatment.
Data for Figure 2A–B. moDCs were incubated with brefeldin A for various time points, followed by staining with Bw6 antibody. Sample data in (A) normalized to 0.25 hr. Data in (B) analyzed as described in methods to determine half-life.
- https://cdn.elifesciences.org/articles/79144/elife-79144-fig2-data1-v2.xlsx
-
Figure 2—source data 2
Surface human leukocyte antigen B (HLA-B) thermal stability.
Data for Figure 2C. Monocyte-derived dendritic cells were differentiated and plated into 96 well plates. Cells were cultured at 37°C, or for 1 or 2 hr at room temperature and 42°C. Cells were then stained with anti-Bw6 to measure surface HLA-B, and normalized to 37°C.
- https://cdn.elifesciences.org/articles/79144/elife-79144-fig2-data2-v2.xlsx
-
Figure 2—source data 3
Human leukocyte antigen B (HLA-B) bead pH peptide exchange (HC10).
Data for Figure 2D. HLA-B monomers were loaded with low-affinity peptide and washed, then exchanged with either no peptide, medium-affinity peptide, or high-affinity peptide in pH 4, 5, 6, or 7 buffer. Monomers were then bound to streptavidin beads and stained with HC10.
- https://cdn.elifesciences.org/articles/79144/elife-79144-fig2-data3-v2.xlsx
-
Figure 2—source data 4
Human leukocyte antigen B peptide receptivity on monocyte-derived dendritic cells (moDCs).
Data for Figure 2E–F. moDCs were pulsed with B*08:01 or B*35:01 specific or control peptides for 4 hr, followed by washing and staining with the HC10 antibody. Pulses were performed at 37 or 4 °C.
- https://cdn.elifesciences.org/articles/79144/elife-79144-fig2-data4-v2.xlsx
Figure 3 with 2 supplements
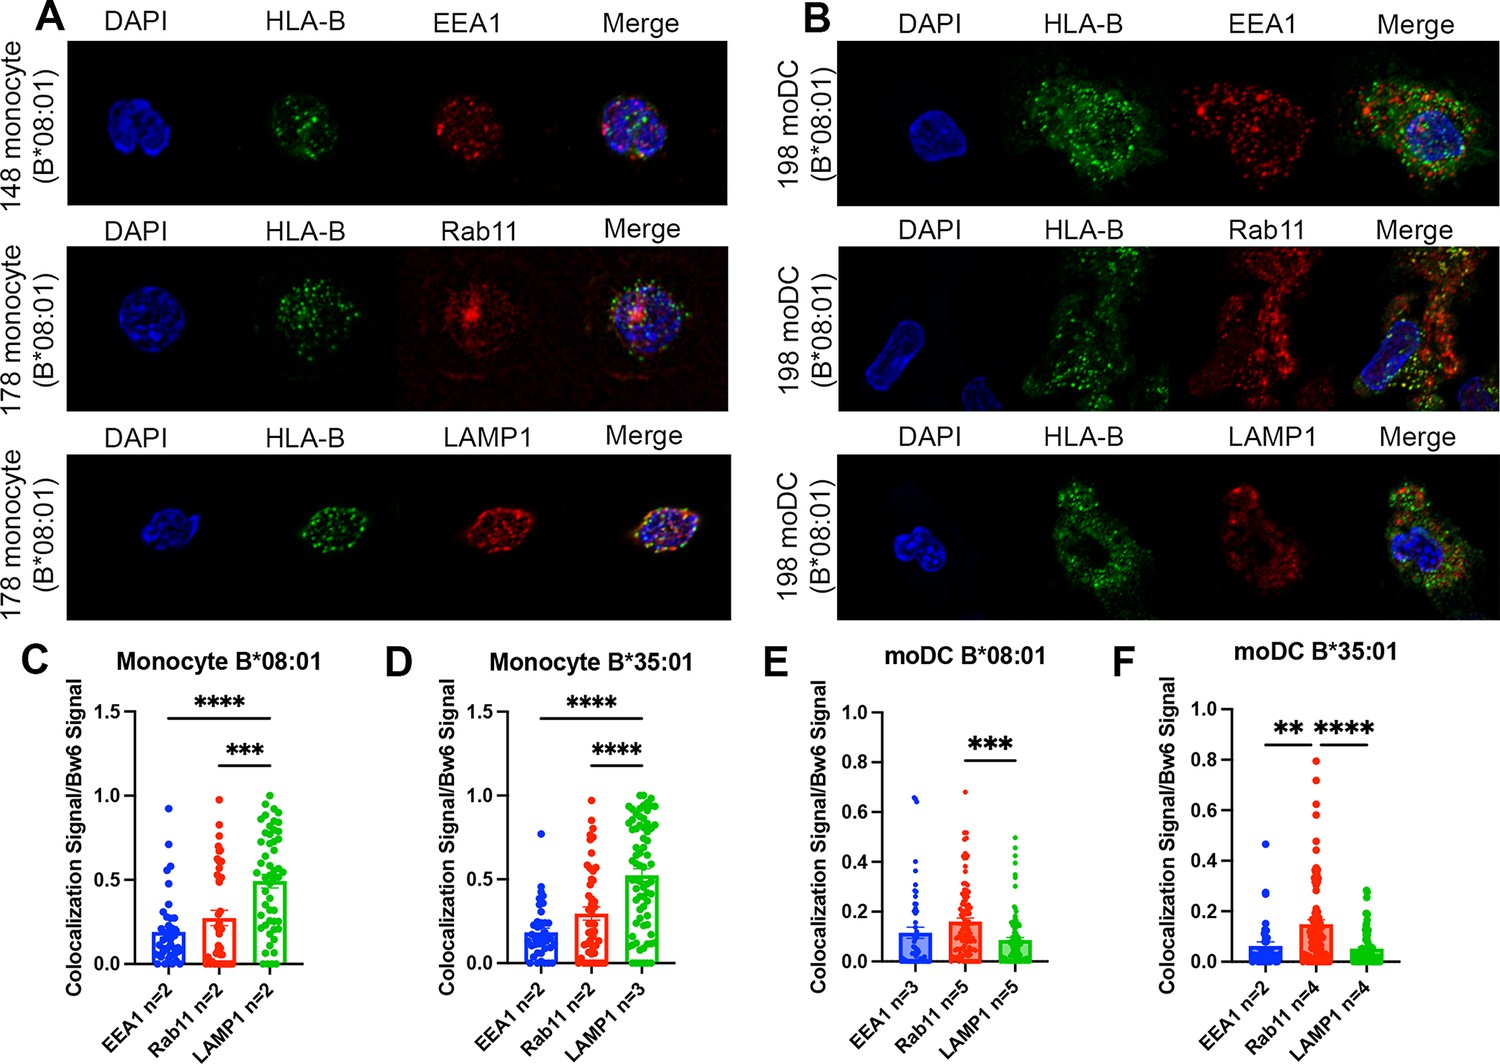
Significant accumulation of human leukocyte antigen-Bw6 (HLA-Bw6) in lysosomal (monocytes) or recycling endosomal (monocyte-derived dendritic cells [moDCs]) compartments.
(A) Representative confocal microscopy images of primary human monocytes stained for HLA-Bw6 co-localization with the early endosome marker EEA1, the recycling endosome marker Rab11, and the lysosomal marker LAMP1. (B) Representative moDC staining for HLA-Bw6 co-localization with the same markers. (C and D) Monocyte Bw6 co-localization with each indicated marker was quantified by object-based co-localization for two to four B*08:01+ or B*35:01+ donors. (E and F) moDC Bw6 co-localization with each of the indicated marker was quantified by object-based co-localization for B*08:01+ or B*35:01+ donors. Each point is a cell, with at least 20 individual cells imaged per donor and two to five donors for each co-localization condition. Co-localization data are represented as the fraction of HLA-Bw6 signal overlapping with the second marker signal. Monocyte B*08:01+ donors: 55, 130, 148, and 178. Monocyte B *35:01+ donors: 24, 136, 187, and 210. moDC B*08:01+ donors: 55, 94, 166, 198, and 237. moDC B*35:01+ donors: 24, 168, and 187. One-way ANOVAs were used for analysis to compare the co-localization of HLA-B with each marker.
-
Figure 3—source data 1
Monocyte and monocyte-derived dendritic cell (moDC) object-based co-localization.
Data for Figure 3C–F. Monocytes or moDCs were plated onto poly-L-lysine-coated coverslips, fixed, and stained for Bw6 co-localization with either EEA1, Rab11, or LAMP1. Co-localization was assessed using object-based methods as described.
- https://cdn.elifesciences.org/articles/79144/elife-79144-fig3-data1-v2.xlsx
-
Figure 3—source data 2
Monocyte and monocyte-derived dendritic cell Pearson’s co-localization.
Data for Figure 3—figure supplement 1. Data from Figure 3 analyzed with the JACOP plugin on FIJI to measure co-localization.
- https://cdn.elifesciences.org/articles/79144/elife-79144-fig3-data2-v2.xlsx
Figure 3—figure supplement 1
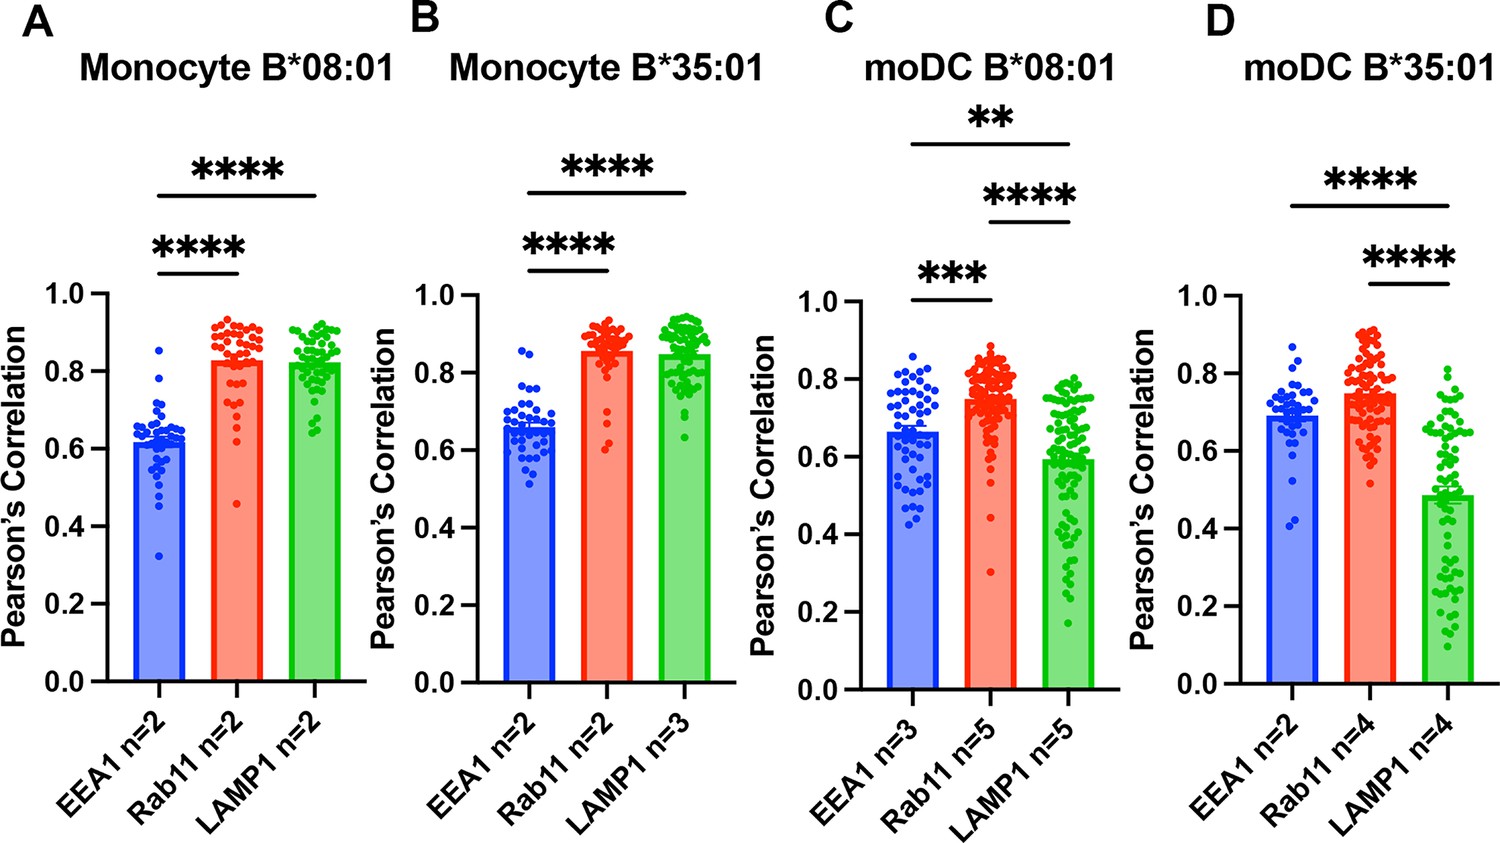
Pearson’s correlation analysis of monocyte and monocyte-derived dendritic cell (moDC) endo-lysosomal co-localization.
Data in Figure 3 were analyzed using the JACOP plugin on FIJI to calculate the Pearson’s correlation between human leukocyte antigen-Bw6 (HLA-Bw6) and each of the three endo-lysosomal markers. Monocytes from B*08:01+ (A) and B*35:01+ (B) donors as indicated were used to measure Bw6 co-localization with EEA1, Rab11, and LAMP1. moDCs from B*08:01+ (C) and B*35:01+ (D) donors as indicated were used to measure Bw6 co-localization with EEA1, Rab11, and LAMP1. One-way ANOVA analyses were used to compare co-localization of HLA-Bw6 with each marker.
Figure 3—figure supplement 2
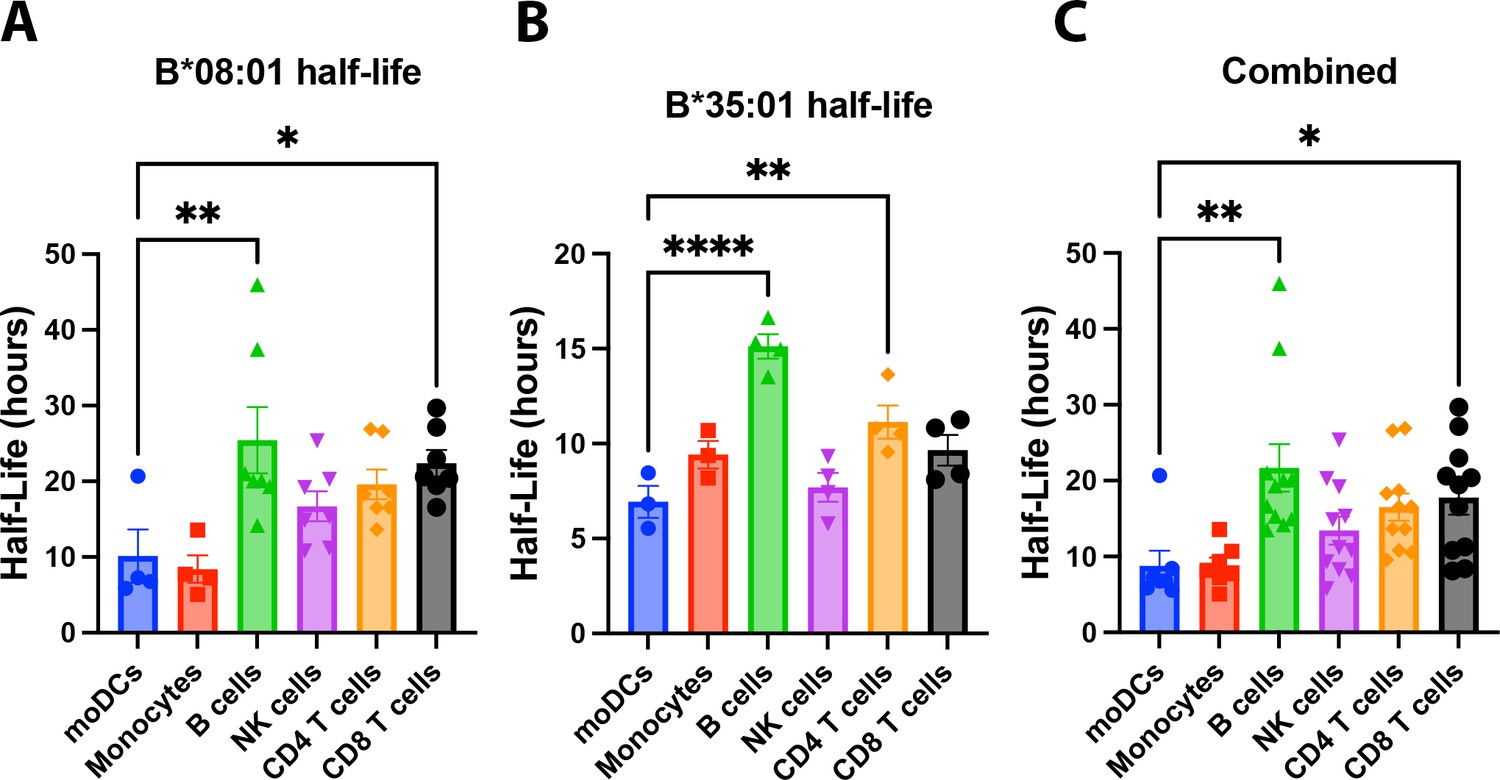
Human monocyte-derived dendritic cells (moDCs) have lower human leukocyte antigen-Bw6 cell surface stability compared to lymphocytes.
moDC Bw6 half-life data from B*08:01+ (A), B*35:01+ (B), or the combined (B*08:01+ and B*35:01+) (C) donors were compared to Bw6 half-life data in monocytes or various lymphocyte populations via a one-way ANOVA analysis. Monocyte and lymphocyte data are from our previously published study (Yarzabek et al., 2018). moDC data are from Figure 2B. Data repeated for donors across different experiments was averaged, so each data point represents an averaged donor half-life.
-
Figure 3—figure supplement 2—source data 1
Cell-type comparison of surface human leukocyte antigen B half-life.
Data for Figure 3—figure supplement 2. Monocyte-derived dendritic cell half-life data is compared to lymphocyte data from Yarzabek et al., 2018.
- https://cdn.elifesciences.org/articles/79144/elife-79144-fig3-figsupp2-data1-v2.xlsx
Figure 4 with 1 supplement
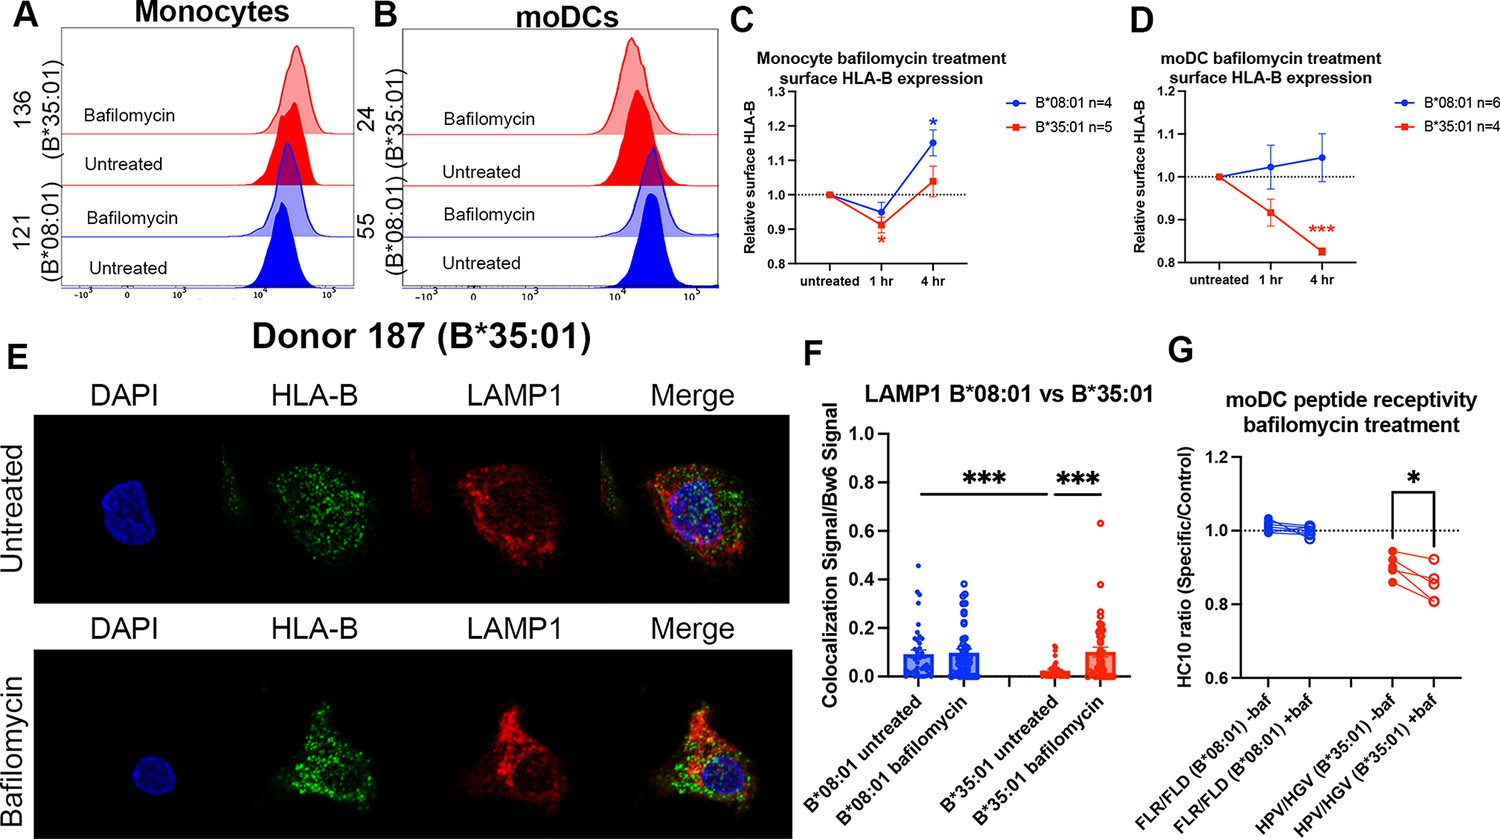
Disruptions to endo-lysosomal pH alter human leukocyte antigen B (HLA-B)*35:01 surface expression and induce lysosomal accumulation in monocyte-derived dendritic cells (moDCs).
Monocytes or moDCs were treated with 200 nM bafilomycin A1 for 1, 2, or 4 hr. Treatment with bafilomycin was followed by staining for surface markers and HLA-Bw6, followed by analysis via flow cytometry. (A and B) Representative HLA-B expression flow cytometry histograms are shown for monocytes (A) and moDCs (B). (C) Relative changes in HLA-Bw6 expression on the surface of HLA-B*08:01+ (n=4) or HLA-B*35:01+ (n=5) monocytes over the 4-hr bafilomycin time course. B*08:01 and B*35:01 expression at each time point was compared to the normalized untreated expression with one sample t tests. B*08:01+ donors for these experiments: 121, 130 (n=2), and 237. B*35:01+ donors for these experiments: 24, 141 (n=2), and 210 (n=2). (D) Relative changes in HLA-Bw6 expression on the surface of B*08:01+ (n=6) and B*35:01+ (n=4) moDCs. B*08:01 and B*35:01 expression at each time point was compared to the normalized untreated expression with one sample t tests. B*08:01+ donors for these experiments: 55 (n=2), 94, 166, 178, and 198. B*35:01+ donors for these experiments: 24 (n=2), 187, and 210. (E) moDC confocal microscopy experiments comparing HLA-Bw6 co-localization with LAMP1 with and without bafilomycin treatment. (F) Object-based co-localization quantification of HLA-Bw6 with LAMP1 with and without bafilomycin treatment. B*08:01+ donors were 94 and 237, and the B*35:01+ donors were 168 and 187 (n=2 for each group). Unpaired t tests were used to compare co-localization with and without bafilomycin. (G) Peptide receptivity of B*08:01 and B*35:01 carried out in the presence or absence of bafilomycin. Receptivity of each allotype was compared ±baf treatment via paired t tests. B*08:01+ donors: 9, 105, 121, 130, 148, 166, and 178; n=7 independent experiments. B*35:01+ donors: 24, 168, 187, and 210 (n=2); n=5 independent experiments.
-
Figure 4—source data 1
Monocyte and monocyte-derived dendritic cell (moDC) bafilomycin time course.
Data for Figure 4A–D. Monocytes or moDCs were treated with bafilomycin for 1 or 4 hr, followed by staining with anti-Bw6 antibody. Expression normalized to untreated cells.
- https://cdn.elifesciences.org/articles/79144/elife-79144-fig4-data1-v2.xlsx
-
Figure 4—source data 2
Monocyte-derived dendritic cell (moDC) bafilomycin confocal microscopy.
- https://cdn.elifesciences.org/articles/79144/elife-79144-fig4-data2-v2.xlsx
-
Figure 4—source data 3
Monocyte-derived dendritic cell (moDC) bafilomycin peptide receptivity.
Data for Figure 4G. moDCs were pulsed with specific or control peptides in the presence or absence of bafilomycin, followed by staining with the HC10 antibody.
- https://cdn.elifesciences.org/articles/79144/elife-79144-fig4-data3-v2.xlsx
Figure 4—figure supplement 1
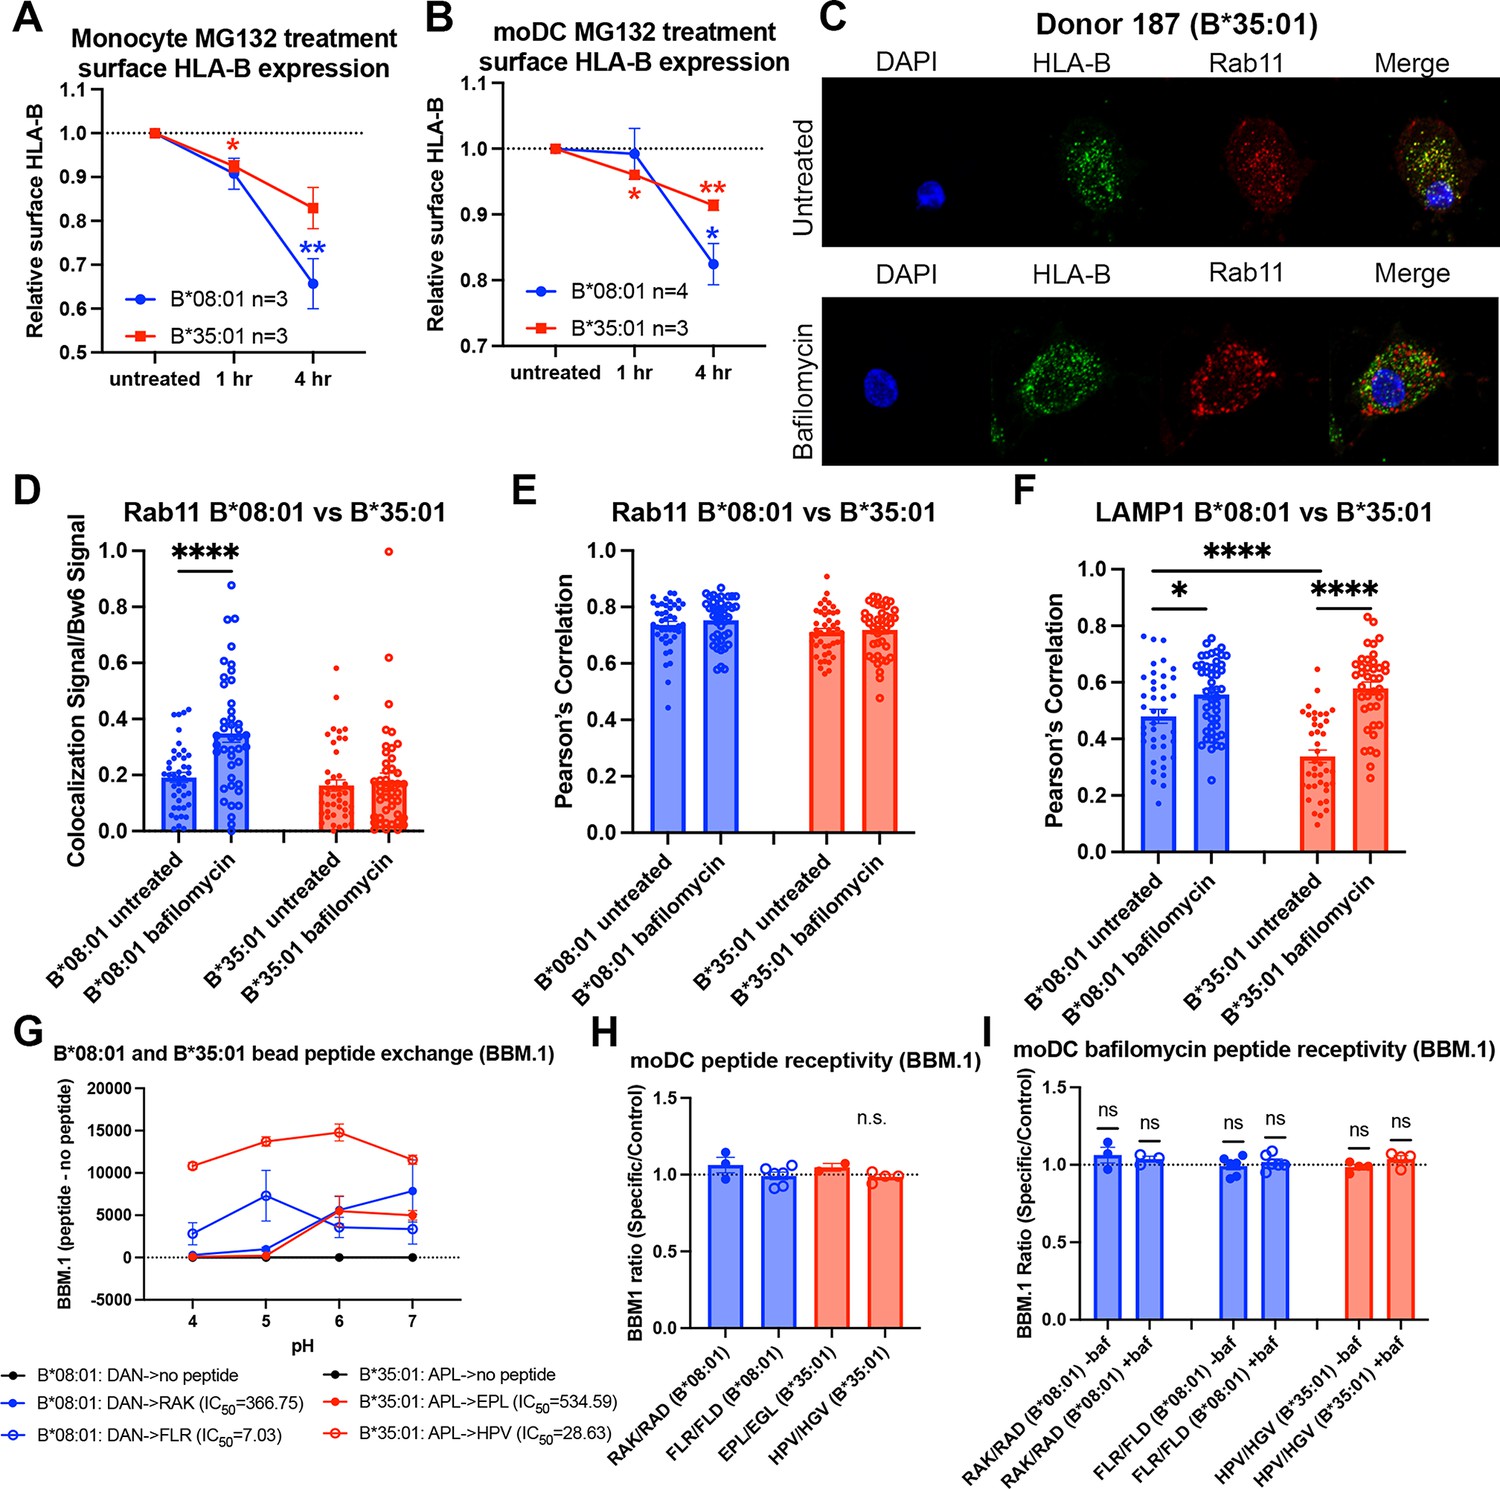
Reduced B*35:01 dependence on proteasomal processing in monocytes and monocyte-derived dendritic cells (moDCs), and additional human leukocyte antigen B (HLA-B) localization/peptide receptivity studies in bafilomycin-treated cells.
(A) Monocytes were treated with MG132 over a 4-hr time course, and surface expression of HLA-Bw6 measured in B*08:01+ and B*35:01+ cells. Change in expression plotted relative to untreated. B*08:01+ donors were: 55 (n=1), 121 (n=1), 137 (n=1); n=3 independent experiments. B*35:01+ donors were: 24 (n=1), 136 (n=1), 210 (n=1); n=3 independent experiments. B*08:01 and B*35:01 surface expression changes relative to untreated were assessed by one sample t tests. (B) moDCs were treated with MG132 over a 4-hr time course, and surface expression of B*08:01 and B*35:01 measured. Change in expression plotted relative to untreated. B*08:01 donors were: 55 (n=2), 166 (n=1), 198 (n=1); n=5 independent experiments. B*35:01 donors were: 24 (n=2) and 187 (n=1); n=3 independent experiments. B*08:01 and B*35:01 surface expression changes relative to untreated were assessed by one sample t tests. (C) Representative images of moDCs with or without bafilomycin treatment stained for HLA-Bw6 and Rab11. (D) Object-based co-localization of HLA-Bw6 B*08:01 (n=2) or B*35:01 (n=2) with Rab11 with and without bafilomycin treatment. B*08:01+ donors were 94 (n=1) and 237 (n=2), and the B*35:01+ donors were 168 (n=1) and 187 (n=2). Unpaired t tests were used to compare co-localization with and without bafilomycin. (E) Pearson’s correlation of B*08:01 (n=2) or B*35:01 (n=2) with Rab11 with and without bafilomycin treatment. B*08:01+ donors were 94 (n=1) and 237 (n=1), and the B*35:01+ donors were 168 (n=1) and 187 (n=1). Unpaired t tests were used to compare co-localization with and without bafilomycin. (F) Pearson’s correlation of B*08:01 (n=2) or B*35:01 (n=2) with LAMP1 with and without bafilomycin treatment. B*08:01+ donors were 94 (n=1) and 237 (n=1), and the B*35:01+ donors were 168 (n=1) and 187 (n=1). Unpaired t tests were used to compare co-localization with and without bafilomycin. (G) B*08:01 or B*35:01 biotinylated monomers were loaded with low-affinity peptide overnight (DAN for B*08:01 and APL for B*35:01), followed by washing and binding to streptavidin beads. Exchange with medium- or high-affinity peptides at various pH values was performed for 1.5 hr at 37°C, followed by staining with the anti-β2m monoclonal antibody BBM.1. N=2 experiments for each allotype. (H) β2m changes upon HLA-B peptide binding were assessed by pulsing either B*08:01+ or B*35:01+ moDCs with specific or control peptides, followed by staining with the anti-β2m antibody BBM.1. Changes in the specific/control peptide ratio from 1 (no change with specific) were assessed by a one sample t test. (I) Experiments were performed as in (H), but with an included bafilomycin treatment during peptide pulse. Changes in specific/control ratios in untreated relative to bafilomycin-treated cells were assessed with paired t tests. RAK/RAD B*08:01 donors: 94 (n=1), 121 (n=1), 148 (n=1). FLR/FLR B*08:01 donors: 105 (n=1), 121 (n=1), 130 (n=1), 148 (n=1), 166 (n=1), 178 (n=1). EPL/EGL B*35:01 donors: 24 (n=1), 210 (n=1). HPV/HGV B*35:01 donors: 24 (n=2) and 210 (n=2).
-
Figure 4—figure supplement 1—source data 1
Monocyte and monocyte-derived dendritic cell (moDC) MG132 time course.
Data for Figure 4—figure supplement 1A–B. Monocytes or moDCs were treated with MG132 for 1 or 4 hr, followed by staining with anti-Bw6 antibody. Expression normalized to untreated cells.
- https://cdn.elifesciences.org/articles/79144/elife-79144-fig4-figsupp1-data1-v2.xlsx
-
Figure 4—figure supplement 1—source data 2
Supplemental confocal co-localization data.
Data for Figure 4—figure supplement 1D–F. Monocyte-derived dendritic cells were treated with bafilomycin for 4 hr, and co-localization of Bw6 with Rab11 or LAMP1 was measured. Object-based co-localization and Pearson’s correlation were both used.
- https://cdn.elifesciences.org/articles/79144/elife-79144-fig4-figsupp1-data2-v2.xlsx
-
Figure 4—figure supplement 1—source data 3
Human leukocyte antigen B (HLA-B) bead pH peptide exchange (BBM.1).
Data for Figure 4—figure supplement 1G. HLA-B monomers were loaded with low-affinity peptide and washed, then exchanged with either no peptide, medium-affinity peptide, or high-affinity peptide in pH 4, 5, 6, or 7 buffer. Monomers were then bound to streptavidin beads and stained with BBM.1.
- https://cdn.elifesciences.org/articles/79144/elife-79144-fig4-figsupp1-data3-v2.xlsx
-
Figure 4—figure supplement 1—source data 4
Monocyte-derived dendritic cell (moDC) peptide receptivity (BBM.1).
Data for Figure 4—figure supplement 1H–I. moDCs were pulsed with specific or control peptides in the presence or absence of bafilomycin. Cells were stained with BBM.1 antibody.
- https://cdn.elifesciences.org/articles/79144/elife-79144-fig4-figsupp1-data4-v2.xlsx
Figure 5
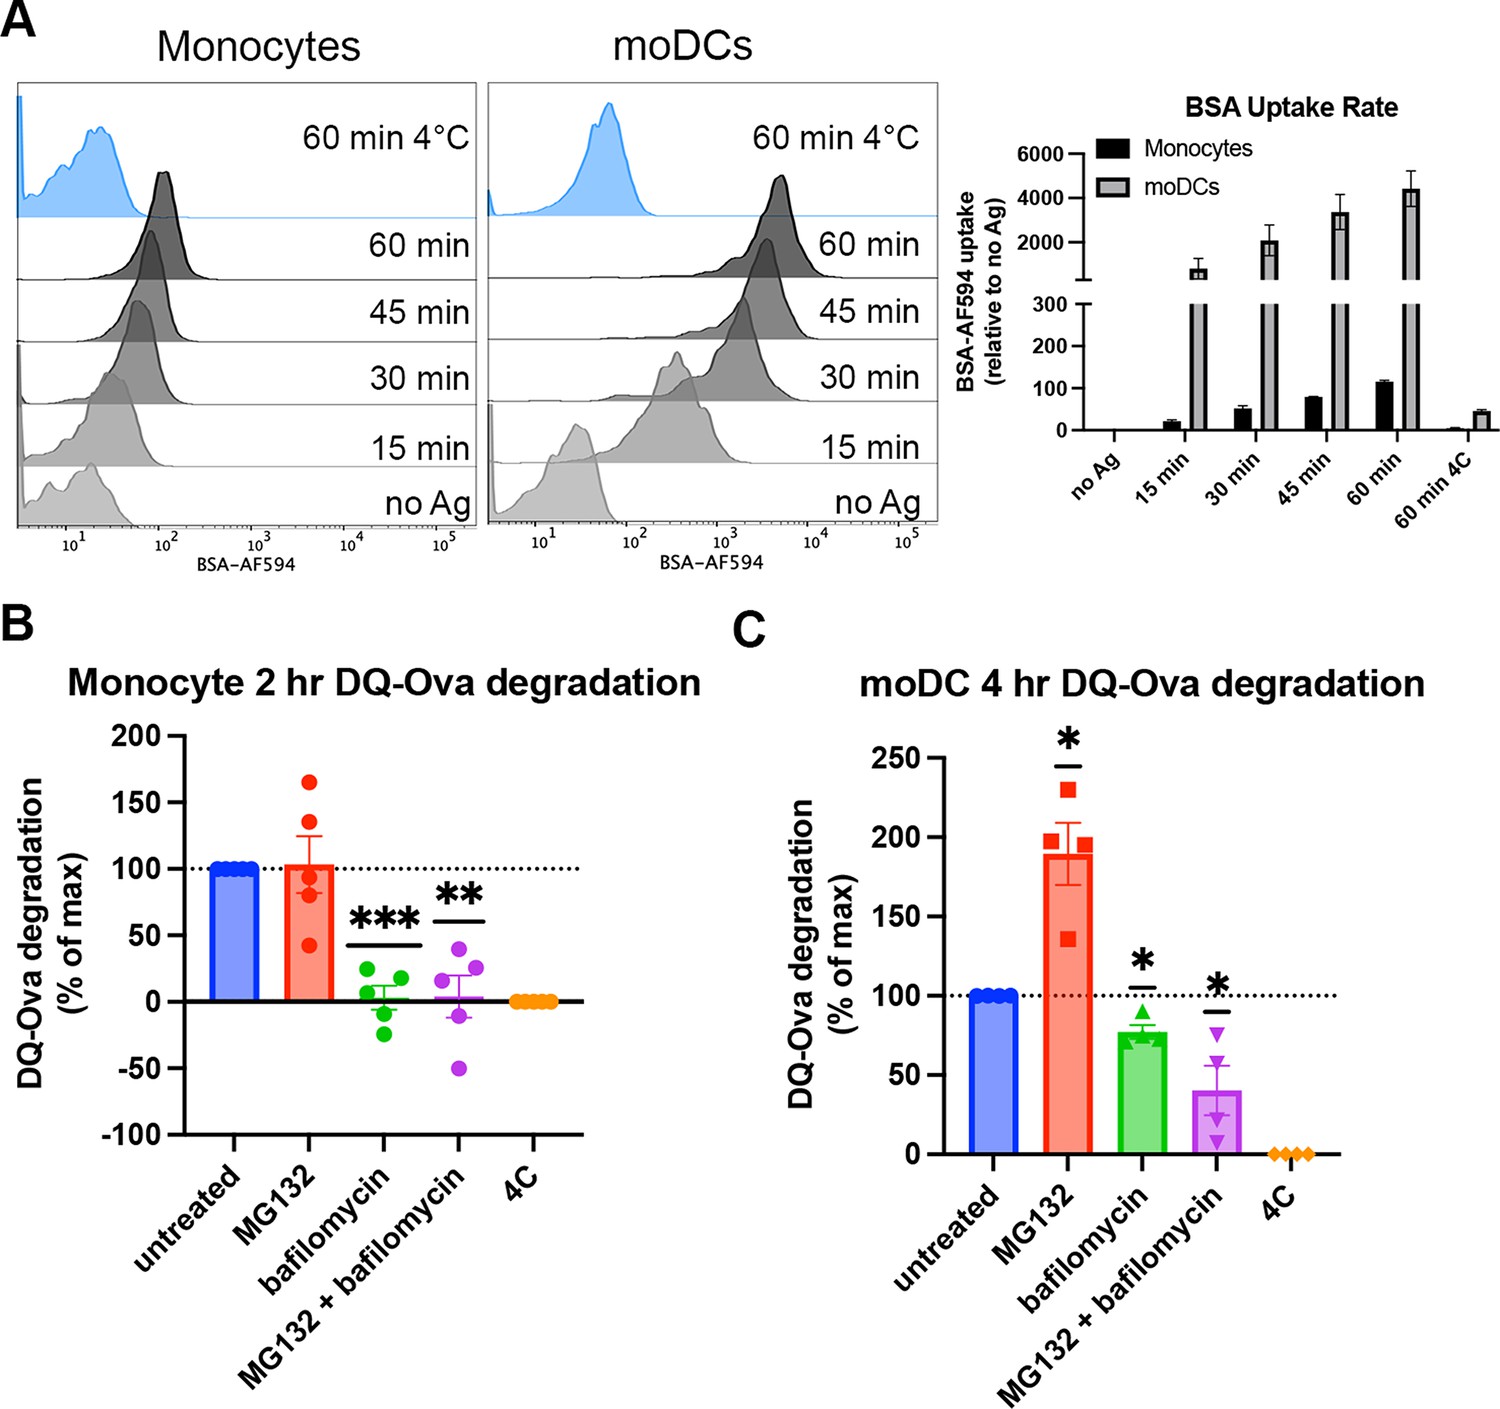
Cell type-dependent differences in antigen uptake and processing pathways.
(A) Monocytes or monocyte-derived dendritic cells (moDCs) were pulsed with BSA labeled with Alexa fluor 594 for 15-min intervals, followed by washing, fixation, and flow cytometric analyses of uptake. Representative histogram plots are shown, as well as averaged uptake rates. N=2 independent experiments for each cell type. Monocyte donors: PCD22F, PCD25F. moDC donors: 255, PCD37M. (B and C) Assessments of antigen degradation pathways in monocytes (B) and moDCs (C) were performed using the soluble antigen DQ-Ova. Monocyte DQ-Ova degradation for 2 hr with inhibitors relative to untreated was quantified in (B), and moDC degradation for 4 hr with inhibitors was quantified in (C). For monocytes, the experiment was repeated n=5 times, and n=4 times for moDCs. Monocyte donors: 248, 250, 255, 270, and 273. moDC donors: 250, 253, 270, and 275. Data was normalized by subtracting degradation at 4°C from all other conditions and setting degradation at 37°C as the maximum. The effect of each inhibitor on degradation compared to untreated at 37°C was assessed with one sample t test.
-
Figure 5—source data 1
Monocyte and monocyte-derived dendritic cell (moDC) antigen uptake.
Data for Figure 5A. Monocytes or moDCs were pulsed in 15 min increments with BSA labeled with Alexa Fluor 594. AF594 signal normalized to no Ag.
- https://cdn.elifesciences.org/articles/79144/elife-79144-fig5-data1-v2.xlsx
-
Figure 5—source data 2
Monocyte and monocyte-derived dendritic cell (moDC) pathways of exogenous antigen processing.
Data for Figure 5B–C. Monocytes or moDCs were pulsed with DQ-Ova antigen alone or in the presence of bafilomycin, MG132, or both. Pulses were also done at 4°C. DQ-Ova fluorescence was measured by flow cytometry and normalized to untreated (100%) and 4°C (0%).
- https://cdn.elifesciences.org/articles/79144/elife-79144-fig5-data2-v2.xlsx
Figure 6 with 2 supplements
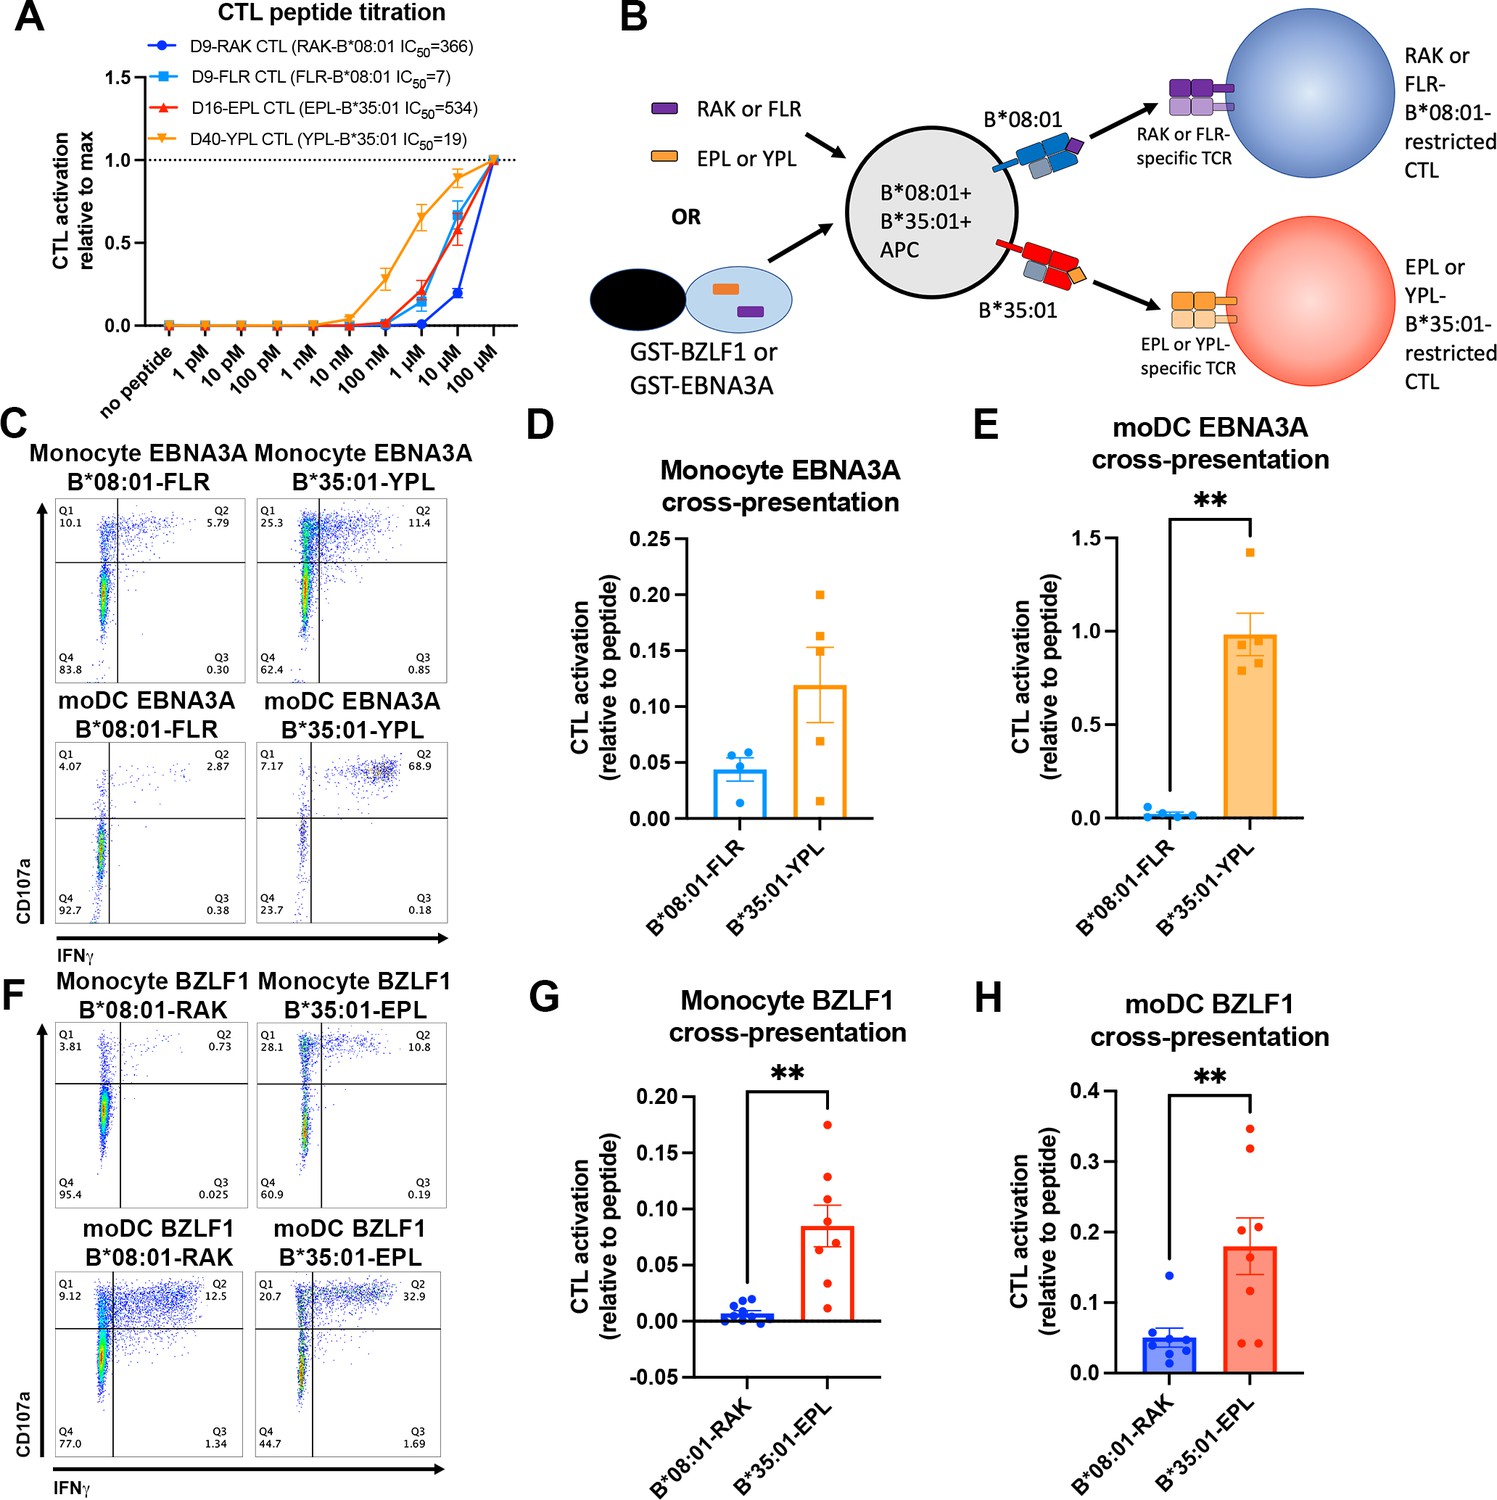
Cross-presentation of epitopes derived from Epstein-Barr virus proteins by B*35:01 compared to B*08:01.
(A) B*08:01-RAK cytotoxic T lymphocytes (CTLs) from donor 9, B*08:01-FLR CTLs from donor 9, B*35:01-EPL CTLs from donor 16, and B*35:01-YPL CTLs from donor 40 were used in peptide titration experiments to measure sensitivity to peptide. Peripheral blood mononuclear cells (PBMCs) from B*08:01+ or B*35:01+ donors were pulsed with peptide overnight at different concentrations, followed by co-culture with each CTL and flow cytometric assessment of activation. B*08:01+ PBMC donors: 94 (n=2) and 148 (n=2). B*35:01+ PBMC donors: 24 (n=4). N=4 independent experiments for B*08:01-RAK and B*35:01-EPL CTLs, and n=3 experiments for B*08:01-FLR and B*35:01-YPL CTLs. (B) Schematic representation of cross-presentation assay. B*08:01+/B*35:01+ double-positive monocytes or monocyte-derived dendritic cells (moDCs) were pulsed with either 50 µM canonical B*08:01 peptide (RAK or FLR), 50 µM canonical B*35:01 peptide (EPL or YPL), or purified GST-BZLF1 or GST-EBNA3A protein antigen (100 µg) for 6 hr, then co-cultured with previously expanded CTLs (either B*08:01-restricted or B*35:01-restricted) at a 1:1 CTL:APC ratio for 5 hr. CTLs were assessed for activation by surface CD107a expression and intracellular IFNγ. (C) Representative flow cytometry plots are shown for CTLs co-cultured with monocytes and moDCs during EBNA3A cross-presentation. CD107a degranulation and intracellular IFNγ expression were measured by flow cytometry. (D) Monocyte cross-presentation of EBNA3A quantified as a ratio relative to peptide, n=4 B*08:01-FLR experiments, n=5 B*35:01-YPL experiments. (E) moDC cross-presentation of EBNA3A quantified as a ratio relative to peptide, n=5 experiments. (F) Representative flow cytometry plots are shown for CTLs co-cultured with monocytes and moDCs during EBNA3A cross-presentation. (G) Monocyte cross-presentation of BZLF1 quantified as a ratio relative to peptide, n=9 experiments. (H) moDC cross-presentation of BZLF1 quantified as a ratio relative to peptide, n=7 experiments. B*08:01 and B*35:01 cross-presentation in D, E, G, and H compared with paired t tests. Monocyte and moDC APC donors were: 16, 25, and 132. B*08:01-RAK CTL donors: 9 and 16. B*08:01-FLR CTL donor: 9. B*35:01-EPL CTL donor: 16. B*35:01-YPL CTL donor: 40.
-
Figure 6—source data 1
Cytotoxic T lymphocyte (CTL) peptide titration.
Data for Figure 6A. B*08:01 or B*35:01 peripheral blood mononuclear cells were pulsed with tenfold increments of peptide, followed by co-culture with Ag-specific CTLs for 5 hr. CTLs were stained for surface CD107a degranulation and intracellular IFNγ. Data normalized to 100 µM concentration.
- https://cdn.elifesciences.org/articles/79144/elife-79144-fig6-data1-v2.xlsx
-
Figure 6—source data 2
Monocyte and monocyte-derived dendritic cell (moDC) cross-presentation of BZLF1 and EBNA3A.
Data for Figure 6C–H. Monocytes or moDCs were pulsed with antigen for 6 hr, followed by co-culture with cytotoxic T lymphocytes (CTLs) for 5 hr. CTLs were stained for activation markers, and antigen cross-presentation data was normalized to activation with peptide.
- https://cdn.elifesciences.org/articles/79144/elife-79144-fig6-data2-v2.xlsx
Figure 6—figure supplement 1
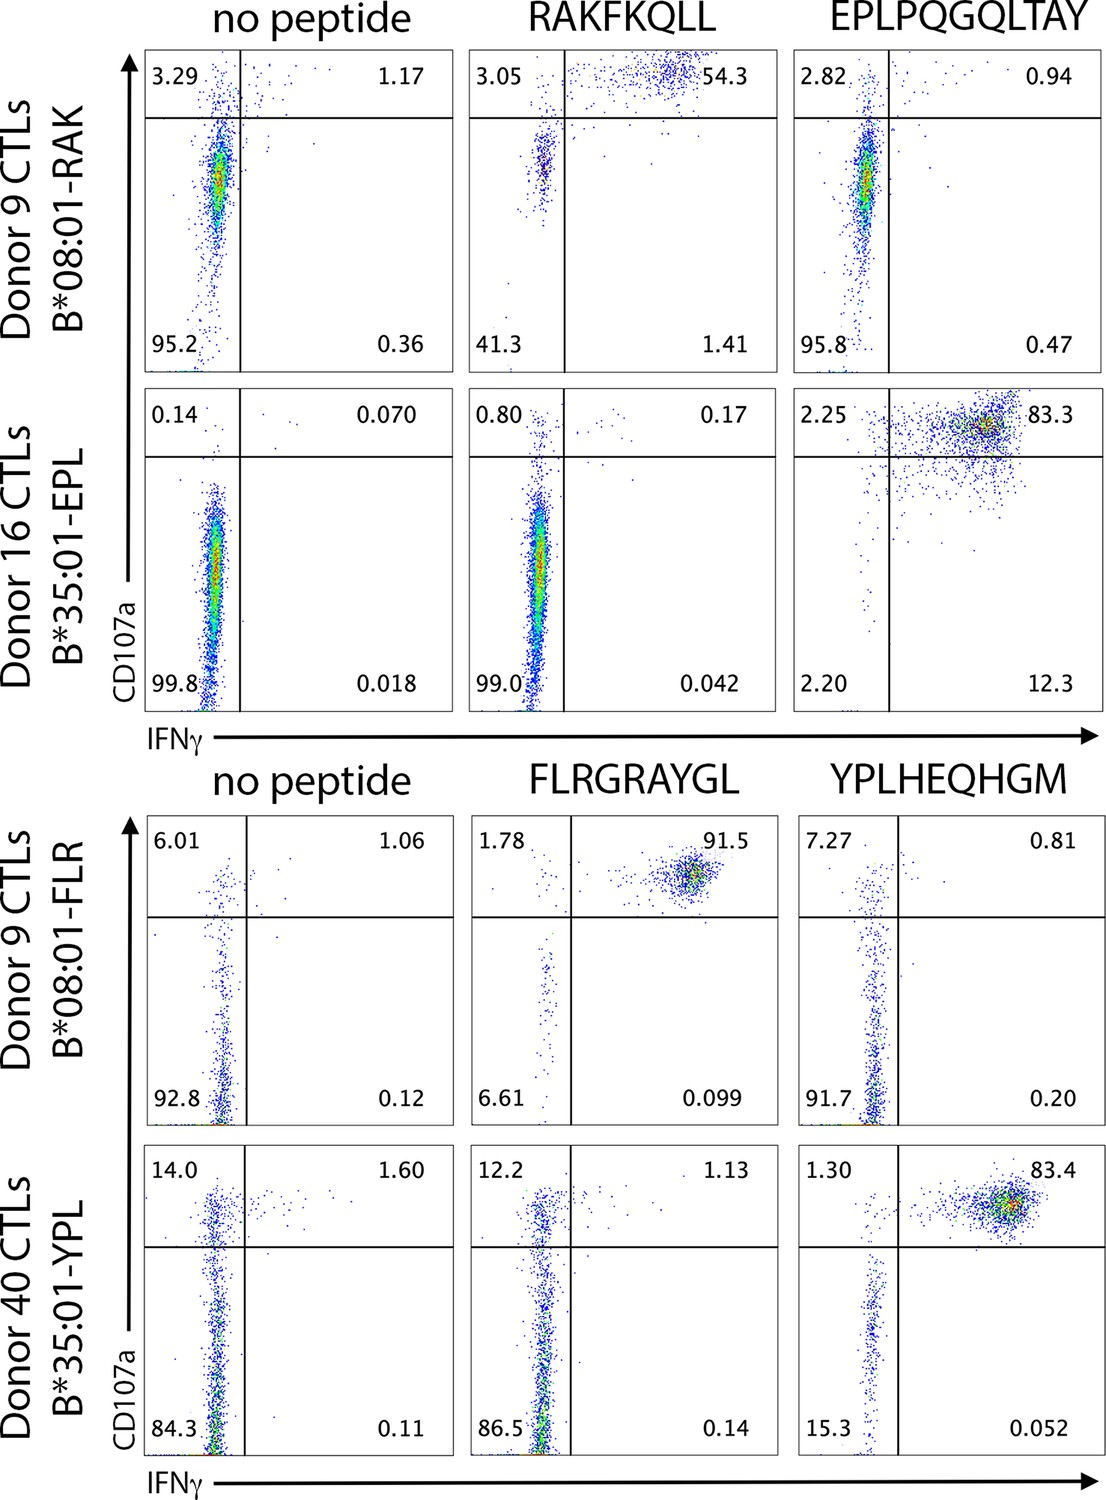
Antigen-specific cytotoxic T lymphocyte (CTL) activation is not cross-reactive within the same antigen source.
B*08:01+ or B*35:01+ monocyte-derived dendritic cells were pulsed with peptide for 6 hr, followed by washing and co-culture with CTLs for 5 hr. CTL activation following co-culture was assessed by CD107a degranulation and intracellular IFNγ staining, and finally flow cytometric analysis. The Epstein-Barr virus (EBV) antigen BZLF1 contains both the RAK epitope (RAKFKQLL) and EPL epitope (EPLPQGQLTAY), which are restricted by B*08:01 and B*35:01, respectively. The EBV antigen EBNA3A contains both the FLR epitope (FLRGRAYGL) and the YPL epitope (YPLHEQHGM), which are restricted by B*08:01 and B*35:01, respectively. Donor 9 CTLs specific for B*08:01-RAK were assessed for EPL cross-reactivity, and donor 16 CTLs specific for B*35:01-EPL were assessed for RAK cross-reactivity. Donor 9 CTLs specific for B*08:01-FLR were assessed for YPL cross-reactivity, and donor 40 CTLs specific for B*35:01-YPL were assessed for FLR cross-reactivity.
Figure 6—figure supplement 2
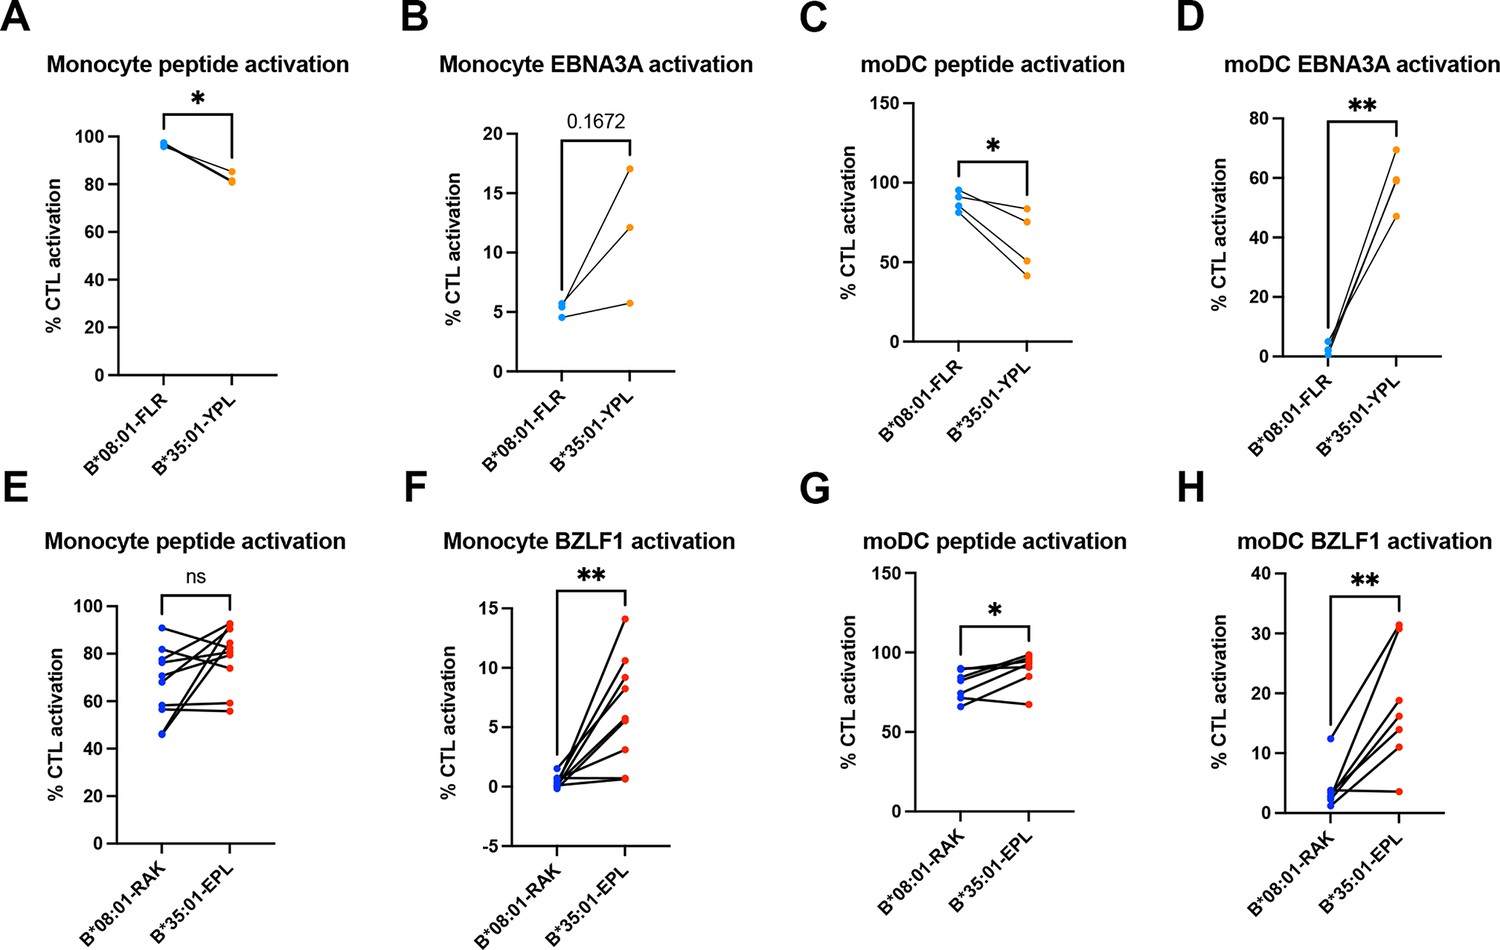
Peptide and soluble antigen presentation by monocytes and monocyte-derived dendritic cells (moDCs).
(A–D) Antigen presentation of peptide and soluble EBNA3A antigen to B*08:01-FLR and B*35:01-YPL cytotoxic T lymphocytes (CTLs). Monocyte peptide (A) and EBNA3A (B) presentation n=3 experiments. moDC peptide (C) and EBNA3A (D) presentation n=4 experiments. (E–H) Antigen presentation of peptide and soluble BZLF1 antigen to B*08:01-RAK and B*35:01-EPL CTLs. Monocyte peptide (E) presentation n=10 experiments, and BZLF1 (F) presentation n=9 experiments. moDC peptide (G) and BZLF1 (H) presentation n=7 experiments. All B*08:01 vs B*35:01 experiments shown were performed in matched experiments and analyzed with paired t tests.
-
Figure 6—figure supplement 2—source data 1
Peptide and soluble Ag percentage of cytotoxic T lymphocyte (CTL) activation.
Data for Figure 6—figure supplement 2A–H. CTL activation in response to peptide or BZLF1/EBNA3A is quantified as the percentage of cells double positive for CD107a and IFNγ.
- https://cdn.elifesciences.org/articles/79144/elife-79144-fig6-figsupp2-data1-v2.xlsx
Figure 7
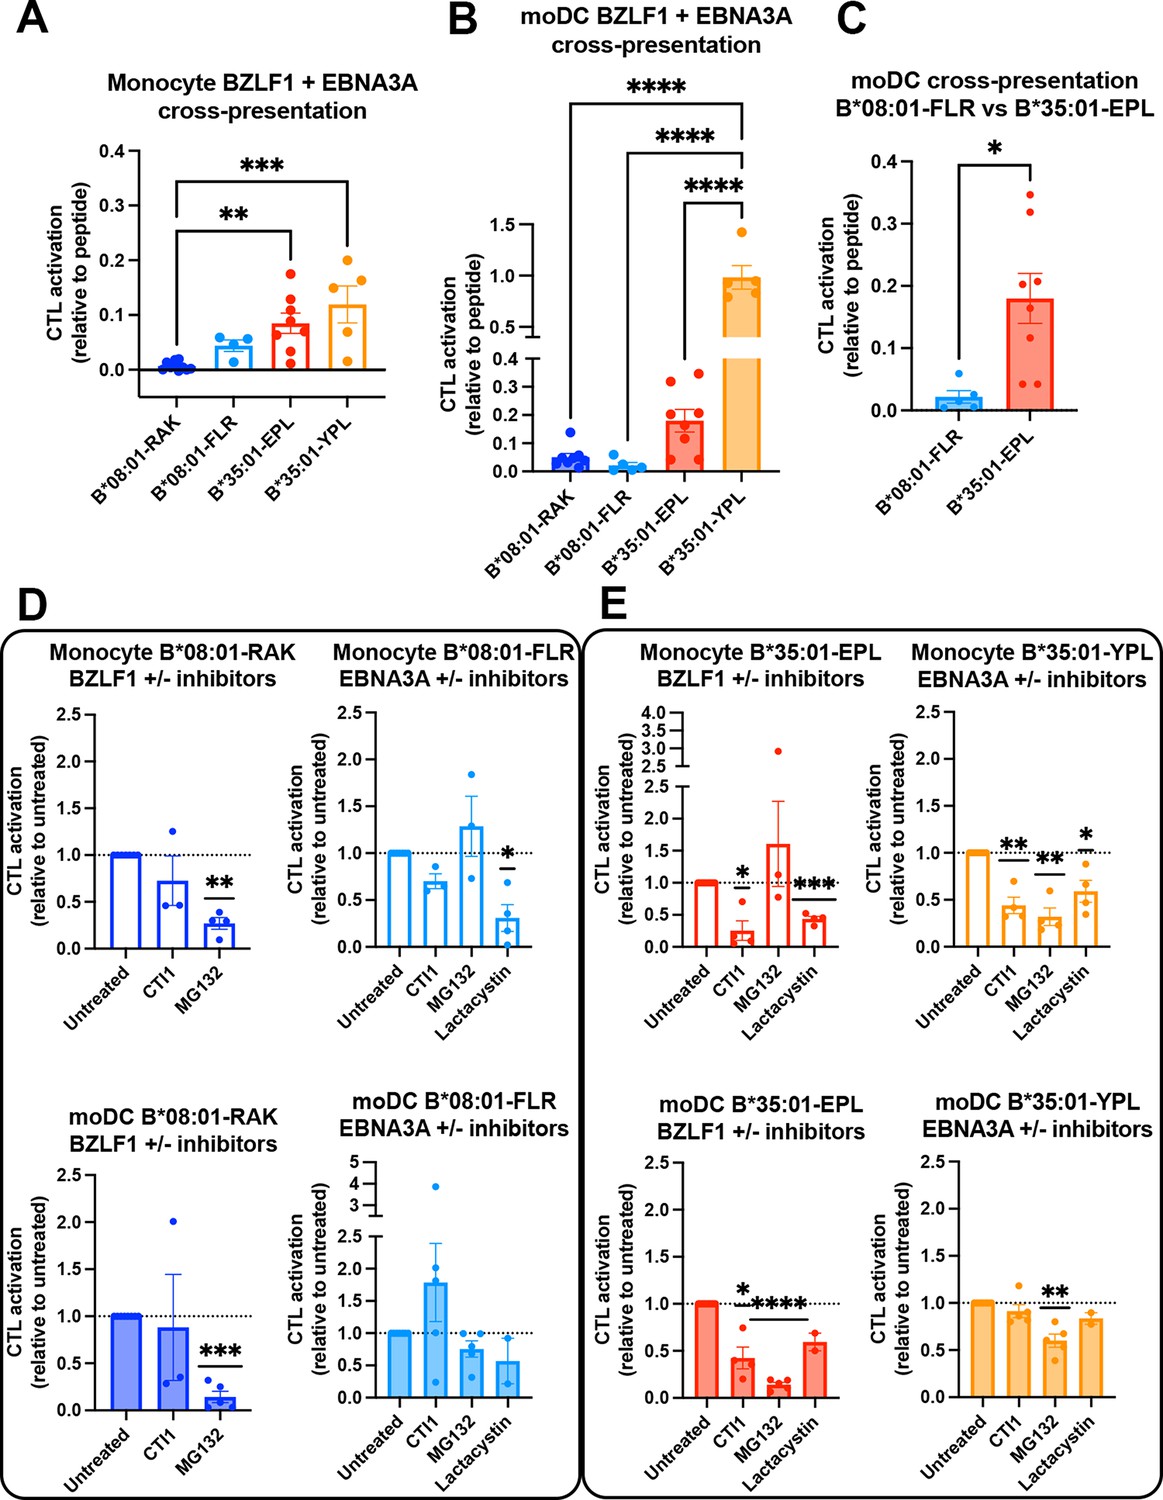
Cross-presentation by B*35:01 displays greater sensitivity to cathepsin inhibition and is more efficient than B*08:01 when matched for T cell responsiveness.
(A and B) Cross-presentation efficiencies of B*08:01-RAK, B*08:01-FLR, B*35:01-EPL, and B*35:01-YPL epitopes from BZLF1 or EBNA3A were compared in monocytes (A) or monocyte-derived dendritic cells (moDCs) (B). Differences were assessed by one-way ANOVA analysis. (C) Two epitopes with similar cytotoxic T lymphocyte (CTL) sensitivities to peptide (Figure 6A) were compared for cross-presentation efficiencies in moDCs with an unpaired t test, displaying a trend toward more efficient B*35:01-EPL cross-presentation. (D–E) Cross-presentation assays were performed as previously described, with the addition of inhibitor treatment. During monocyte or moDC pulse with 100 µg protein antigen, either MG132, lactacystin, or cathepsin inhibitor 1 (CTI1) was added to the antigen presenting cells to inhibit different pathways of antigen processing. Cross-presentation with inhibitors was compared to untreated with a one-sample t test. For monocyte cross-presentation: n=4 MG132 and n=3 CTI1 B*08:01-RAK treatments, n=3 MG132, n=3 CTI1, and n=4 lactacystin B*08:01-FLR treatments, n=3 MG132, n=4 CTI1, and n=4 lactacystin B*35:01-EPL treatments, and n=4 MG132, n=4 CTI1, and n=4 lactacystin B*35:01-YPL treatments. For moDC cross-presentation: n=5 MG132 and n=3 CTI1 B*08:01-RAK treatments, n=5 MG132, n=5 CTI1, and n=2 lactacystin B*08:01-FLR treatments, n=5 MG132, n=4 CTI1, and n=2 lactacystin B*35:01-EPL treatments, and n=5 MG132, n=5 CTI1, and n=2 lactacystin B*35:01-YPL treatments.
-
Figure 7—source data 1
Monocyte and monocyte-derived dendritic cell cross-presentation with pathway inhibitors.
Data for Figure 7D–E. Cross-presentation was performed as in Figure 6, except during antigen pulse the inhibitors MG132, lactacystin, or cathepsin inhibitor I were added. Data is normalized to untreated cross-presentation.
- https://cdn.elifesciences.org/articles/79144/elife-79144-fig7-data1-v2.xlsx
Figure 8
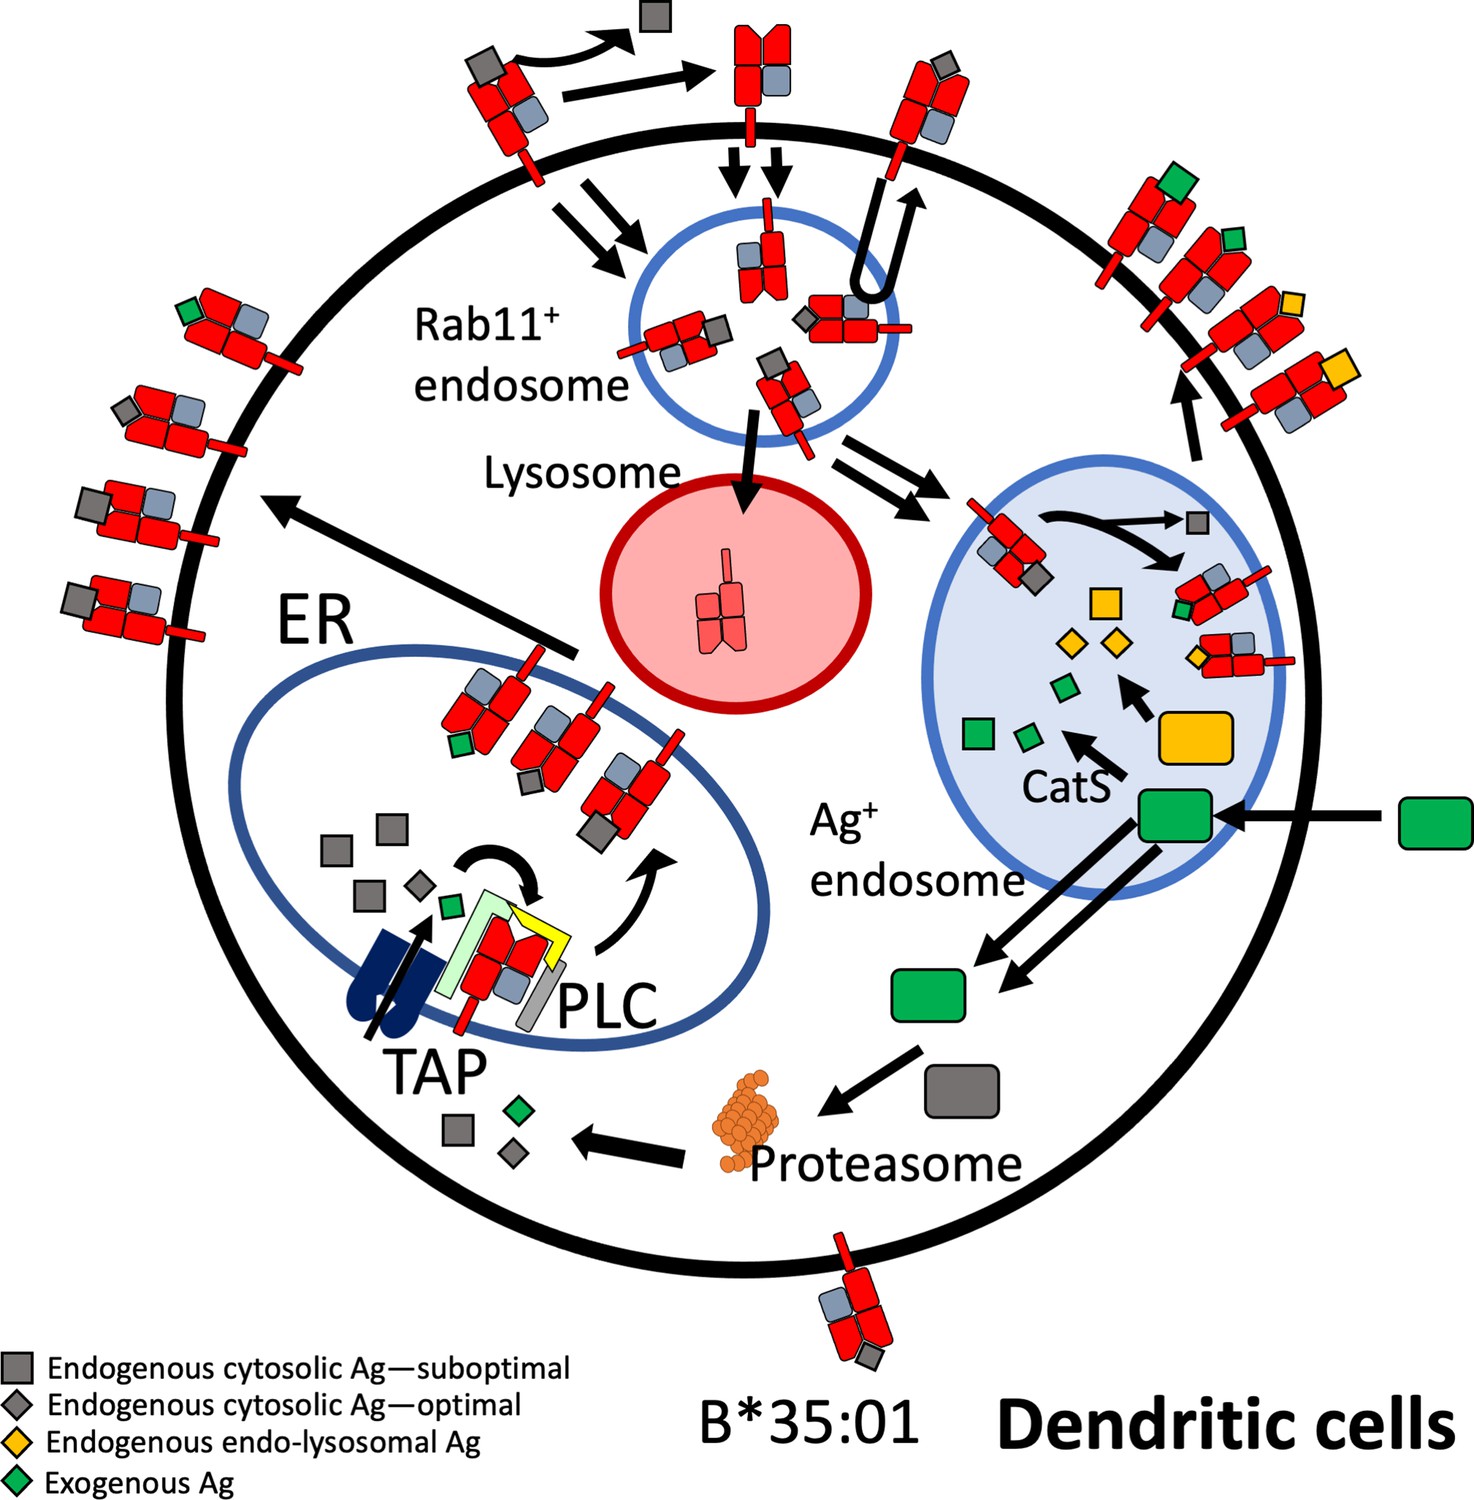
Model for B*35:01 endo-lysosomal assembly pathways in monocyte-derived dendritic cells (moDCs).
HLA-B*35:01 is assembled in the endoplasmic reticulum (ER), where a greater abundance of suboptimal peptides is predicted to be present due to a mismatch between transporter associated with antigen processing (TAP) specificity and that of B*35:01. The tapasin-independent mode of assembly of B*35:01 could allow for the escape of a fraction of suboptimally loaded B*35:01 from the peptide loading complex (PLC) and ER quality control. Suboptimal B*35:01 complexes on the cell surface are endocytosed. Some B*35:01 molecules are trafficked to Rab11+ storage/recycling endosomes or another endosomal compartment where they can be re-assembled with endosomally processed endogenous antigens and recycled to the surface. In a competing pathway, empty or suboptimal conformers are trafficked to lysosomes for degradation. B*35:01 is also recruited from the Rab11+ compartment or another endosomal compartment to antigen-containing endosomes, where exogenous antigens are processed in a cathepsin S-dependent manner. B*35:01 can exchange exogenous peptides within these endosomes, followed by recycling back to the cell surface. moDCs can also transport exogenous antigen to the cytosol for proteasomal processing followed by conventional TAP-dependent assembly.
Additional files
-
Supplementary file 1
Healthy human donors and human leukocyte antigen (HLA) genotypes used in study.
Donors were selected from our previously described cohort of HLA genotyped healthy participants (Yarzabek et al., 2018). Ten primary groups were recruited for this study. Groups 1–8 were selected to be either homozygous for an HLA-B allotype of interest, or heterozygous for one Bw6 allotype and one Bw4 allotype so that anti-Bw6 and anti-Bw4 monoclonal antibodies could be utilized to measure the specific expression/localization of individual HLA-B allotypes. Donors in these groups were selected to have one or less HLA-C allotype that cross-reacts with the anti-Bw6 antibody, or no HLA-A allotypes that cross-react with the anti-Bw4 antibody (Yarzabek et al., 2018). Two cross-reactive HLA-C allotypes (denoted by asterisks) are permitted if the donor is homozygous for the HLA-B allotype of intertest, or if assays not using anti-Bw6 were not performed (e.g. peptide receptivity assays with the HC10 monoclonal antibody). Group 9 donors expressed B*08:01, B*35:01, or both and were selected for use as effector antigen-specific CTLs for all T cell activation assays. Heterozygosity for Bw6/Bw4 was not required for studies with this group. Group 10 contained donors heterozygous for B*08:01 and B*35:01 and were used as antigen-presenting cells for cross-presentation assays. For assays where specific HLA genotype was not required, such as DQ-Ova experiments, non-genotyped donors 248–275 were used, or blood was obtained from the University of Michigan Platelet Core. Donors from the Platelet Core are labeled.
- https://cdn.elifesciences.org/articles/79144/elife-79144-supp1-v2.docx
-
MDAR checklist
- https://cdn.elifesciences.org/articles/79144/elife-79144-mdarchecklist1-v2.docx
Download links
A two-part list of links to download the article, or parts of the article, in various formats.
Downloads (link to download the article as PDF)
Open citations (links to open the citations from this article in various online reference manager services)
Cite this article (links to download the citations from this article in formats compatible with various reference manager tools)
Endo-lysosomal assembly variations among human leukocyte antigen class I (HLA class I) allotypes
eLife 12:e79144.
https://doi.org/10.7554/eLife.79144


