Aminomethanesulfonic acid illuminates the boundary between full and partial agonists of the pentameric glycine receptor
- Department of Neuroscience, Physiology and Pharmacology, Division of Biosciences, University College London, United Kingdom
- Vollum Institute, Oregon Health and Science University, United States
- Laboratory of Soft Matter Physics, Institute of Physics, Chinese Academy of Sciences, China
- Howard Hughes Medical Institute, Oregon Health & Science University, United States
Figures
Figure 1
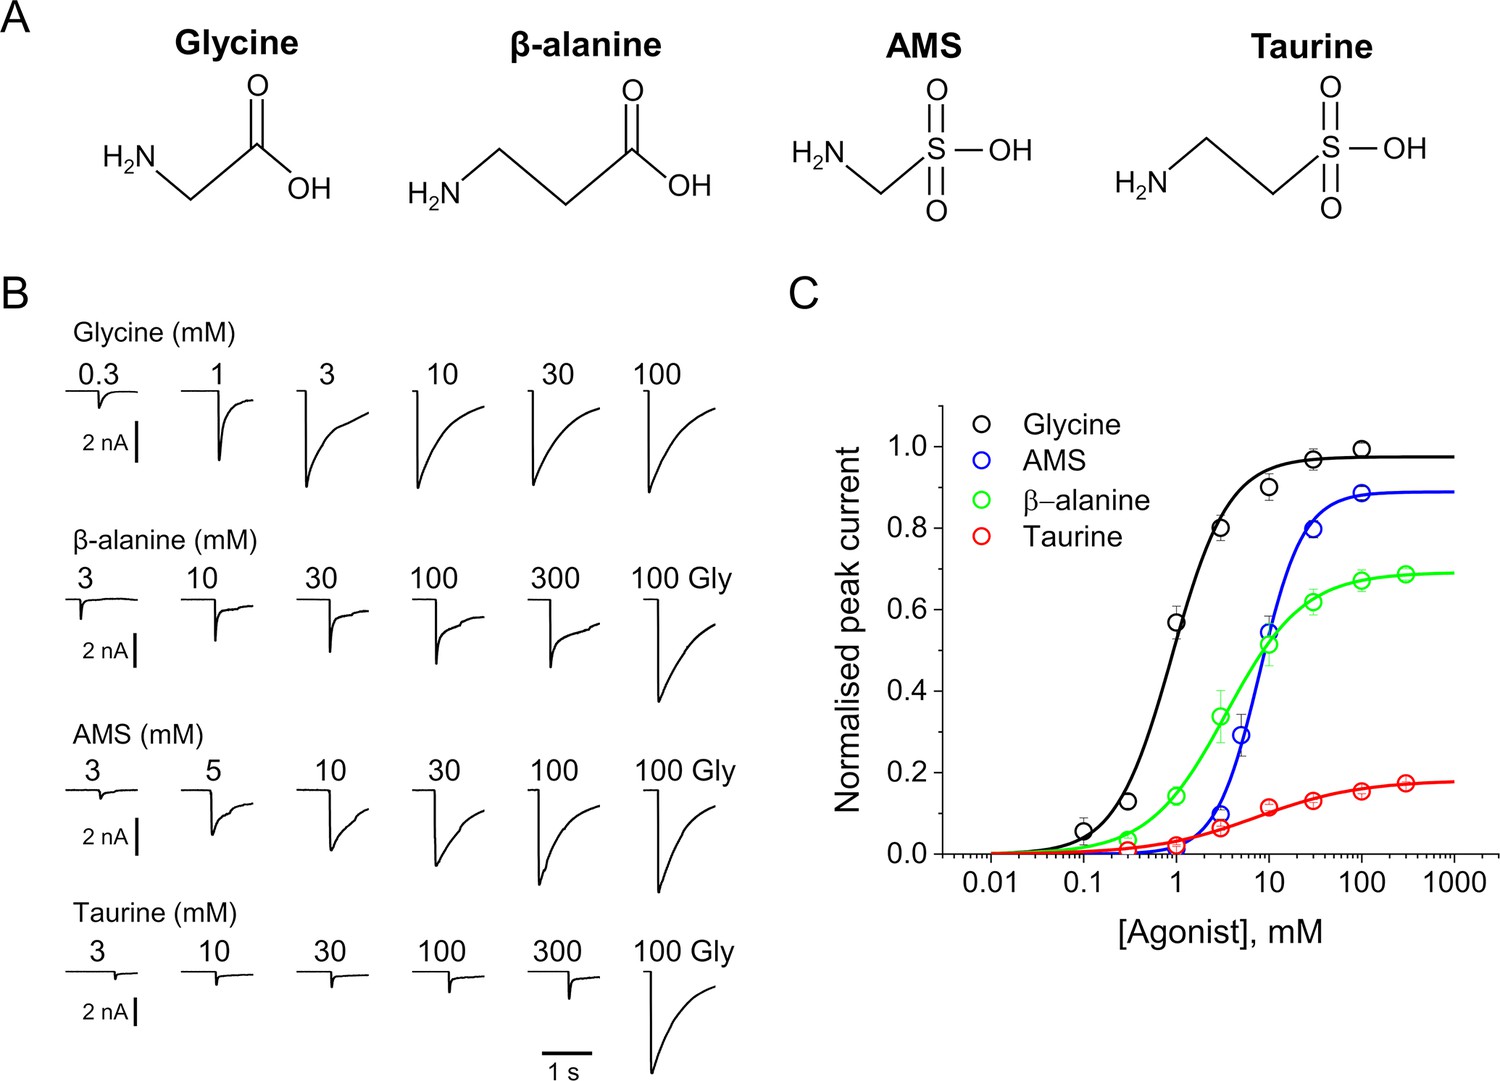
AMS is a highly efficacious agonist on zebrafish α1 GlyR.
(A) Structures of glycine, β-alanine, AMS, and taurine. (B) Whole-cell current responses of HEK293 cells elicited by application of agonist solutions (pH 5) with a U-tube. Cells were held at –40 mV. (C) Average concentration-response curves for glycine (black), β-alanine (green), AMS (blue), and taurine (red), n=6–9 cells. Responses of AMS, β-alanine, and taurine are normalized to those to a saturating concentration of glycine (100 mM) in each cell. AMS, aminomethanesulfonic acid.
-
Figure 1—source data 1
Data for the pooled dose-response curves in the figure.
- https://cdn.elifesciences.org/articles/79148/elife-79148-fig1-data1-v2.xlsx
Figure 2
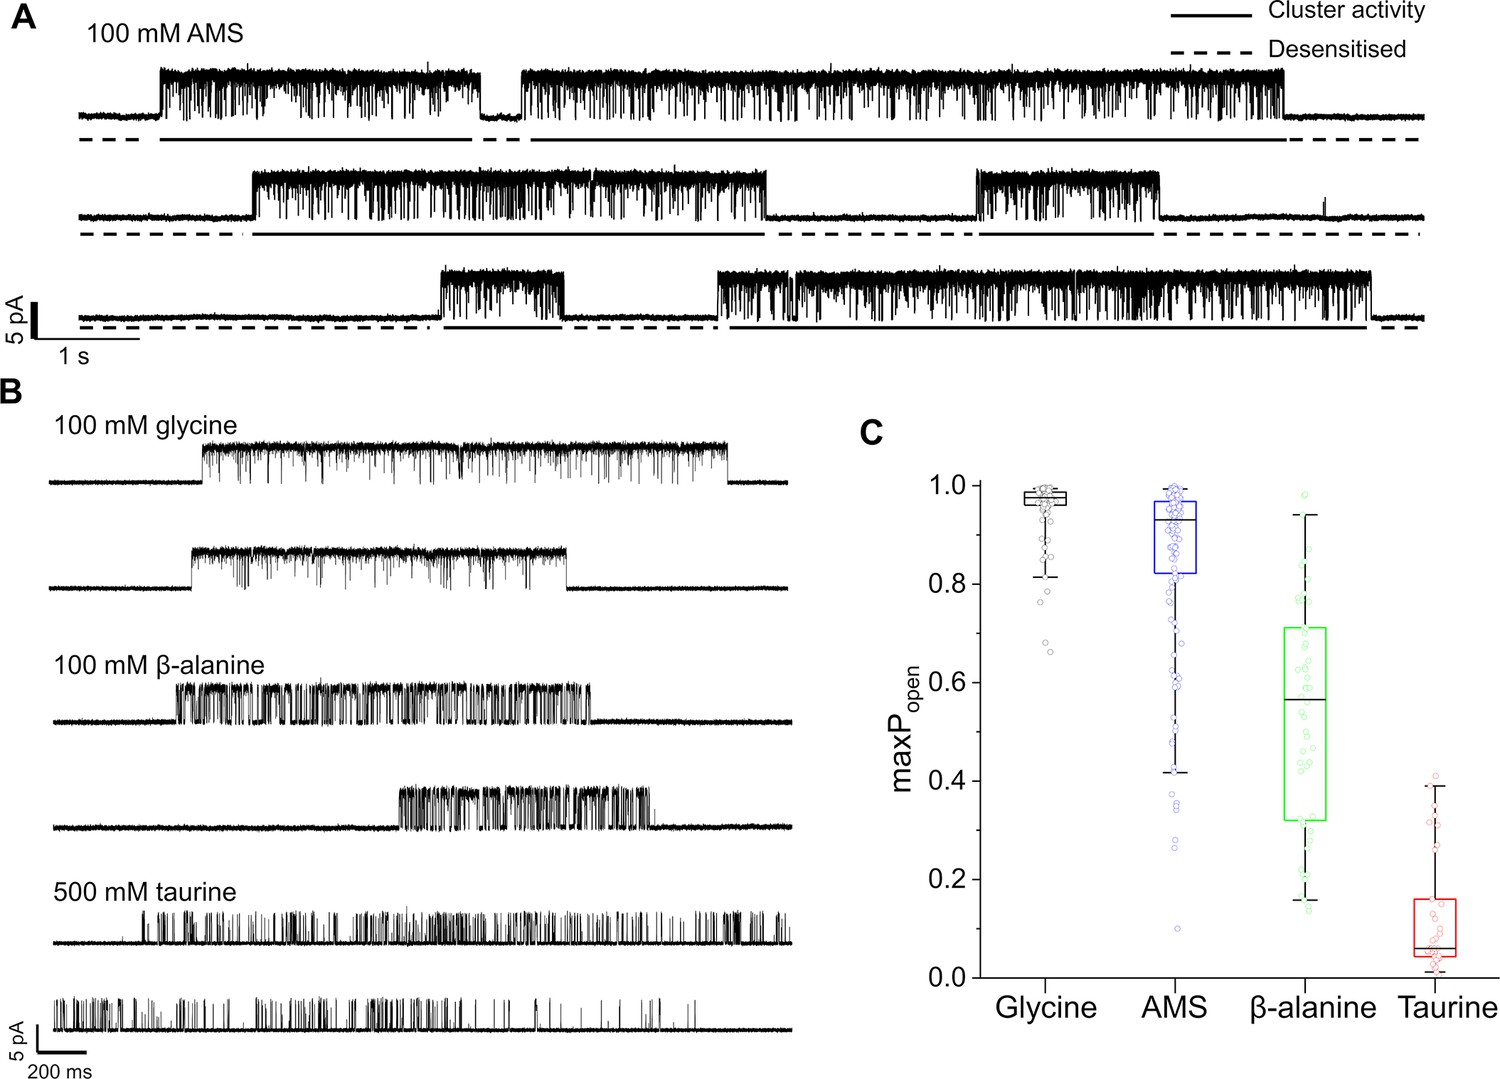
Maximum open probability evoked by different GlyR agonists.
(A, B) Representative single-channel current recordings of zebrafish α1 GlyR activity evoked by high concentrations of agonists. Recordings were made in the cell attached configuration at +100 mV holding potential. (C) Boxplots of maximum Popen values for clusters with the different agonists (one point per cluster). Boxes and whiskers show the 25th and 75th and the 5th and 95th percentiles, respectively. The horizontal black line in the box is the median.
-
Figure 2—source data 1
Raw data for the agonist maximum Popen.
- https://cdn.elifesciences.org/articles/79148/elife-79148-fig2-data1-v2.xlsx
Figure 3 with 3 supplements
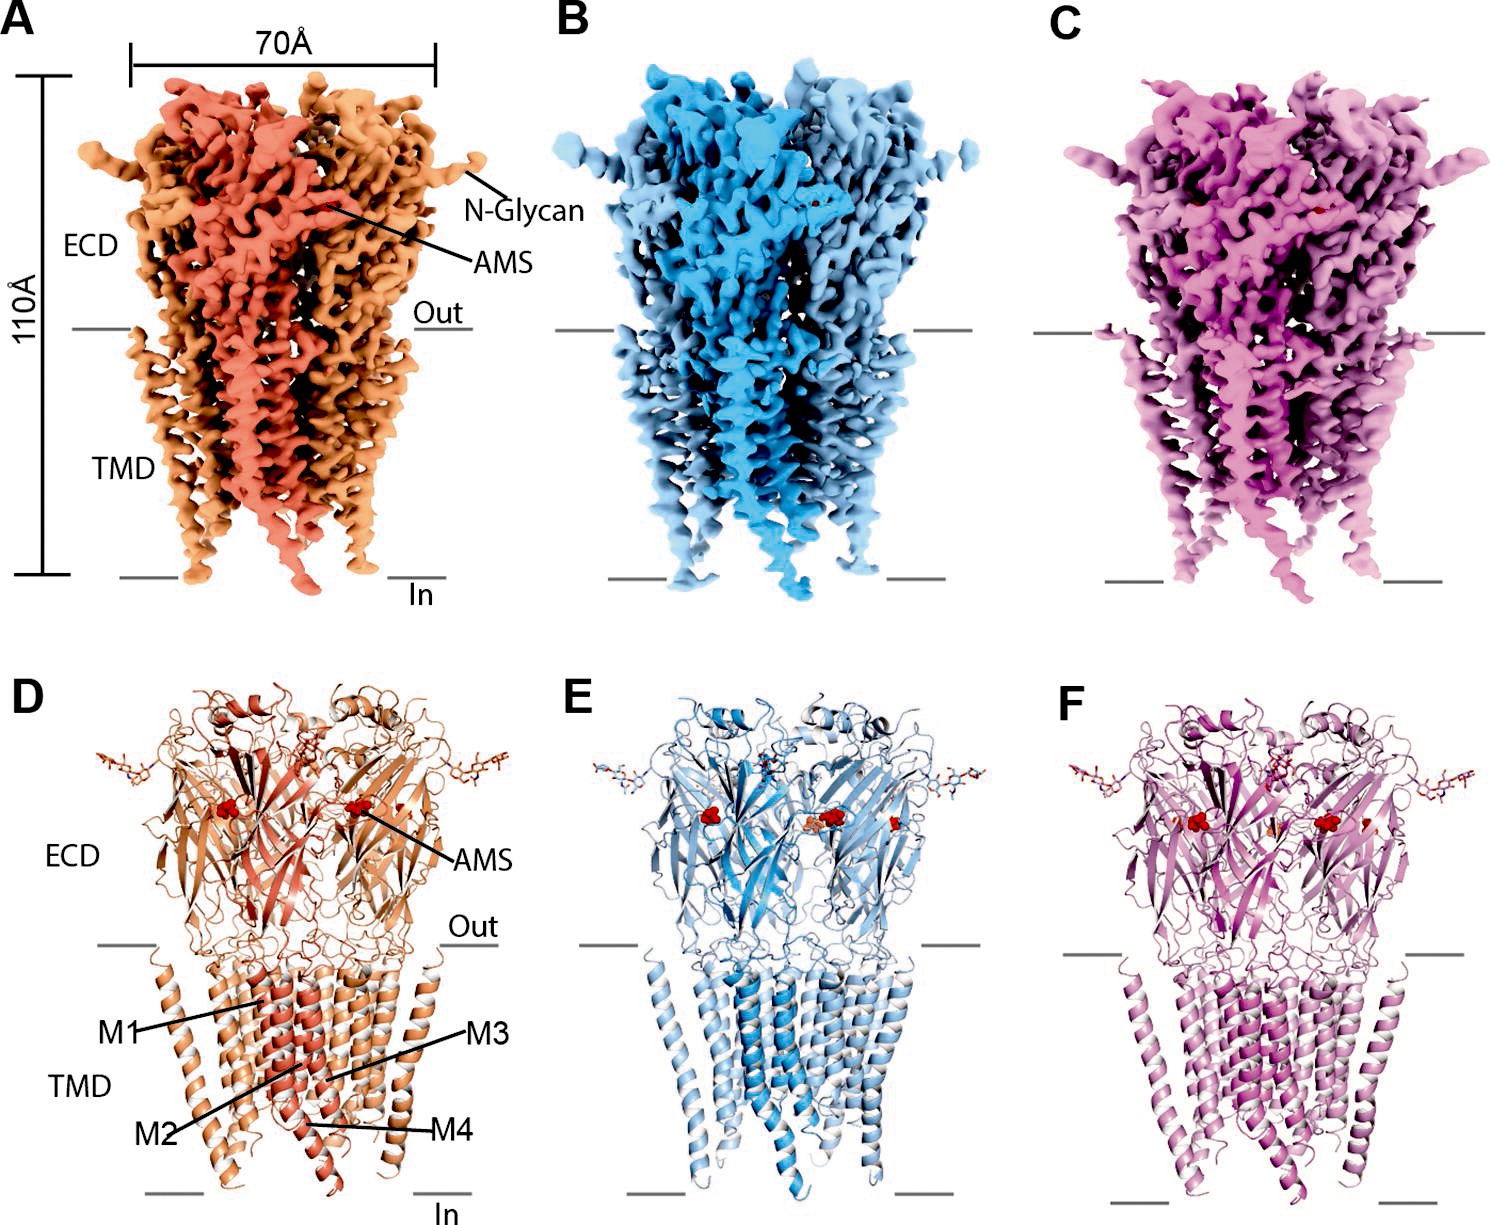
Cryo-EM analysis of structures of zebrafish α1 GlyR bound to AMS.
(A–C) Cryo-EM density maps for desensitized, open, and expanded-open states with one subunit highlighted. The AMS density is in red. (D–F) Atomic models for desensitized, open, and expanded-open states. Shown are GlyR in cartoon representation, AMS in sphere representation (red), and N-glycans in stick representation. AMS, aminomethanesulfonic acid; EM, electron microscopy.
Figure 3—figure supplement 1
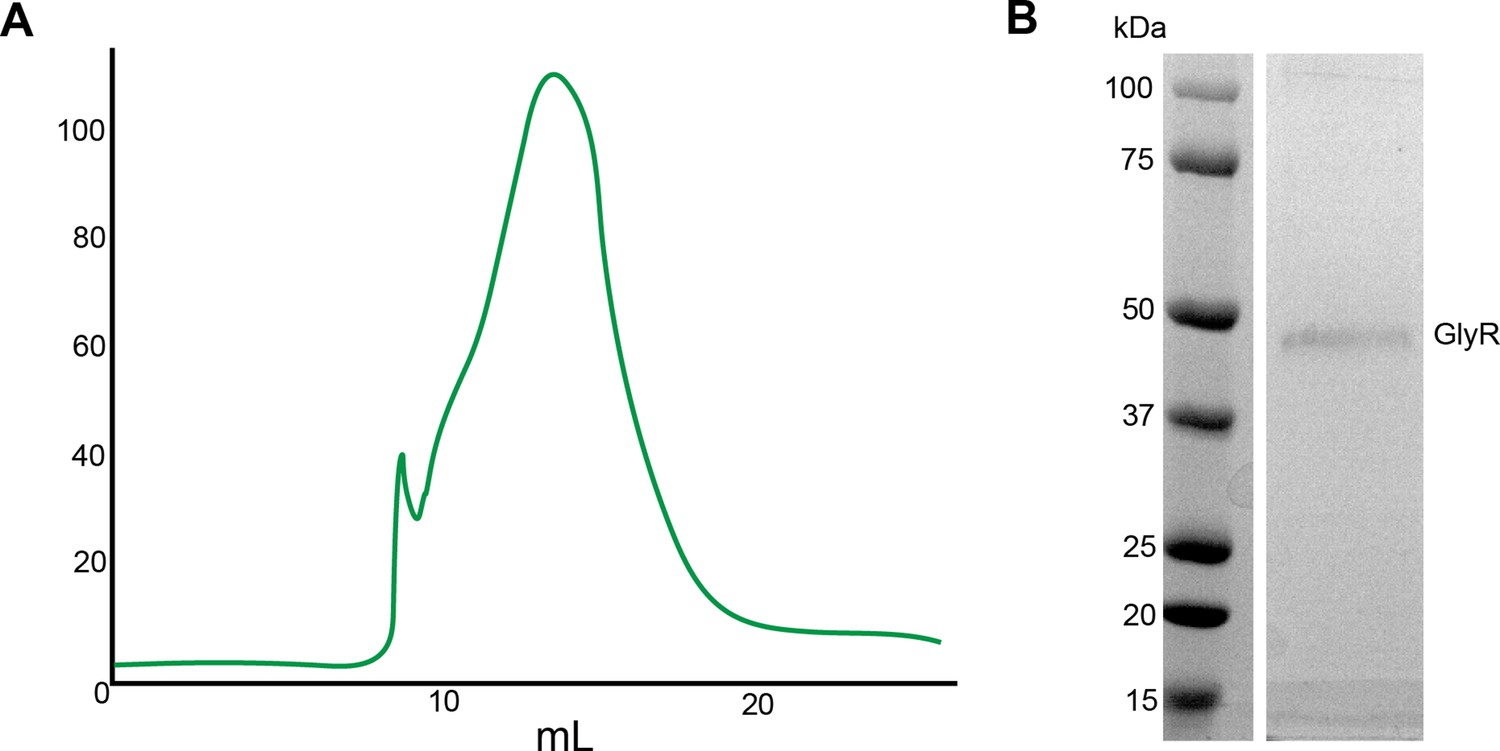
GlyR purification.
(A) SEC trace for purification of GlyR. (B) SDS-PAGE analysis for peak fraction.
-
Figure 3—figure supplement 1—source data 1
Raw data for the original gels after SEC.
- https://cdn.elifesciences.org/articles/79148/elife-79148-fig3-figsupp1-data1-v2.zip
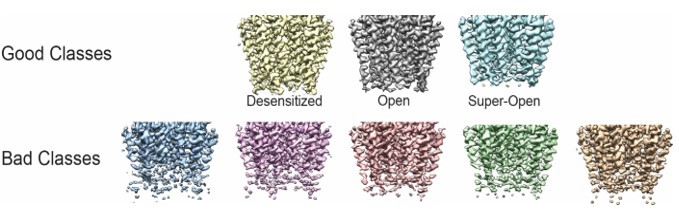
Figure 3—figure supplement 2
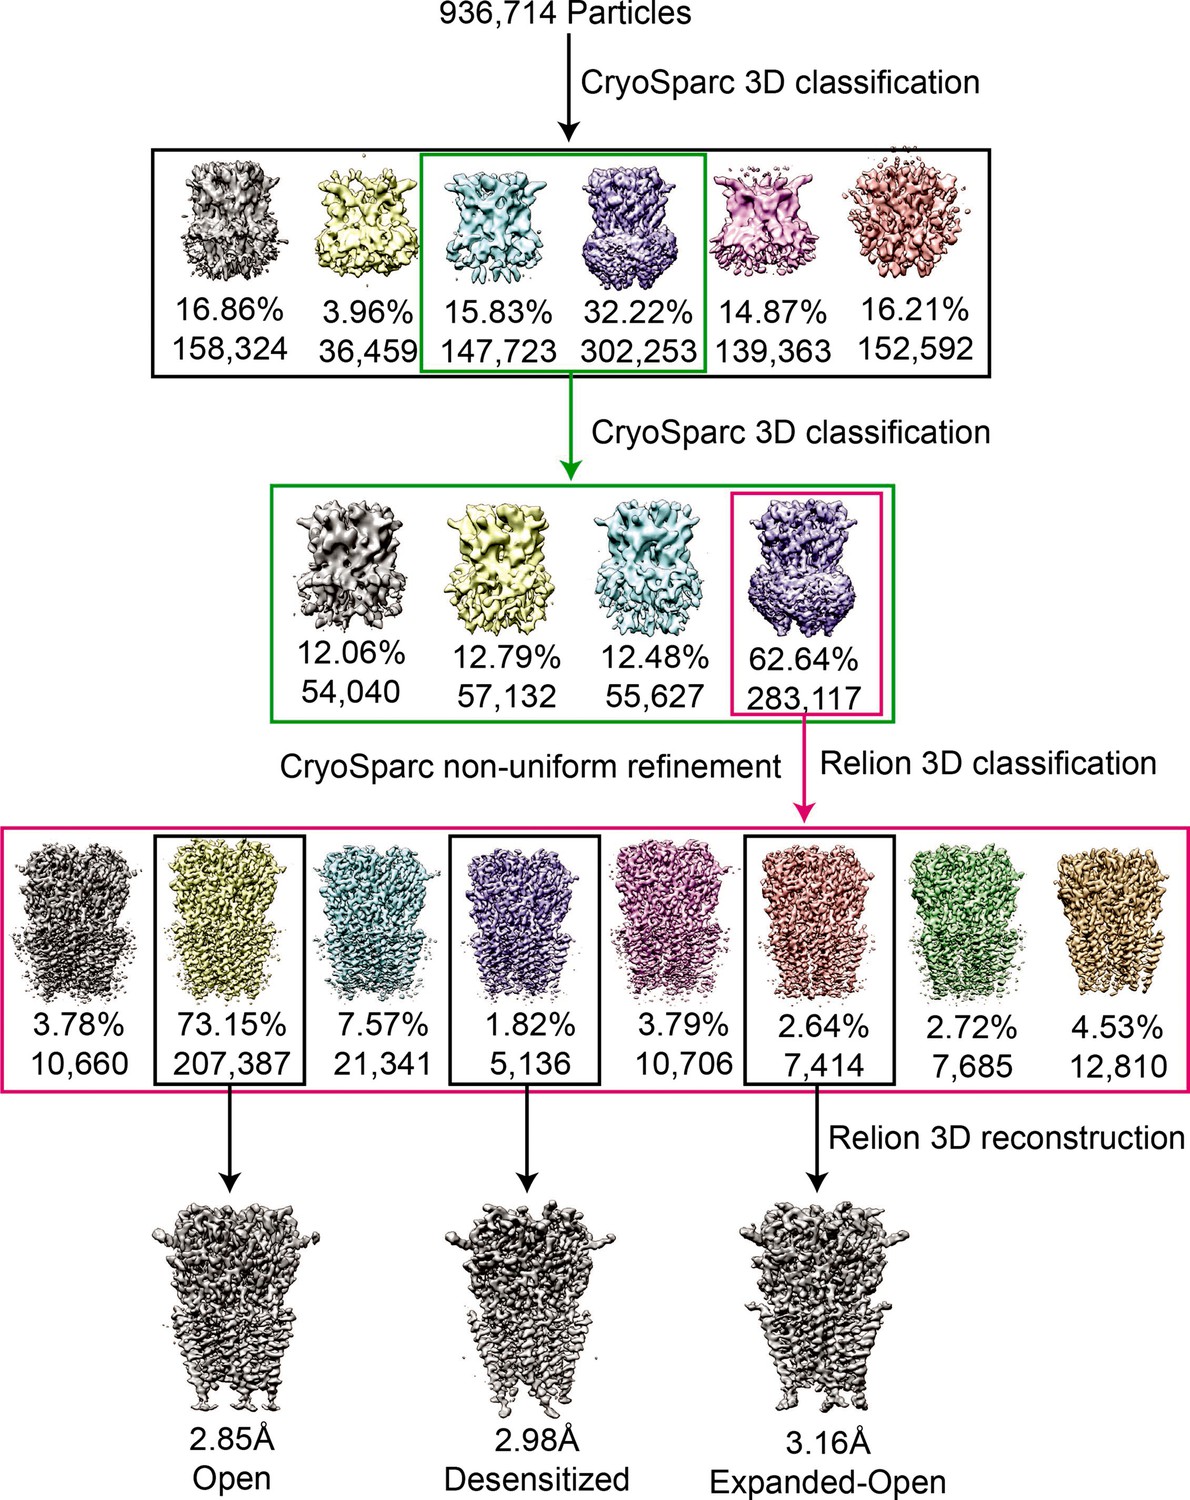
Flow chart for cryo-EM data processing of GlyR bound with AMS.
Figure 3—figure supplement 3

3D reconstruction of GlyR-AMS states.
(A, C, E) Local resolution maps for open (A), desensitized (C), and expanded-open states (E), respectively. (B, D, F) FSC curves without (orange) and with (red) mask generated by cryoSparc, and between the model and the final maps for open (B), desensitized (D), and expanded-open states (F), respectively.
Figure 4
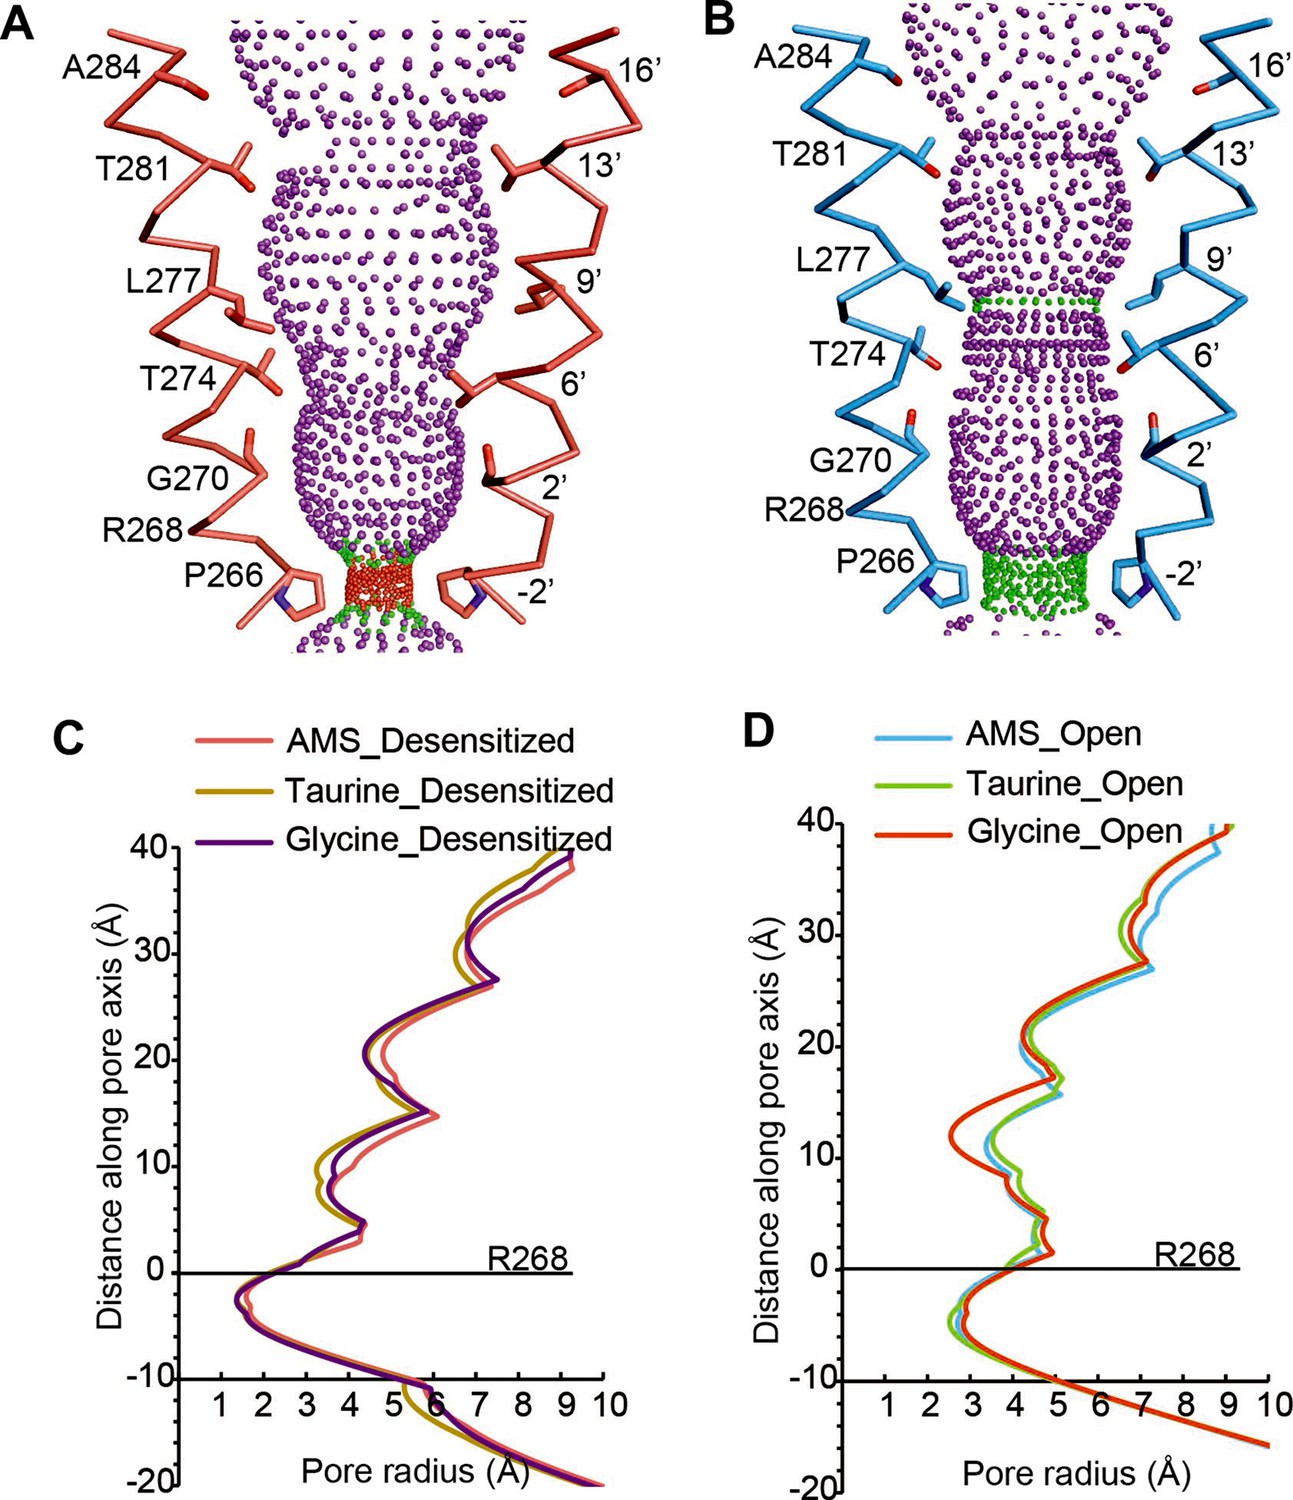
Comparison of ion channel pores.
(A, B) Shape and ion permeation pathway for AMS-bound desensitized (see also (C)) and open (see also (D)) states. M2 helices and key amino acids are shown in ribbon and stick representation, respectively. Purple, green, and red spheres define radii >3.5 Å, 1.8–3.5 Å, and <1.8 Å. (C, D) Profiles of pore radii calculated by the HOLE program for desensitized (A) and open (B) states bound with AMS, taurine, and glycine. The Cα position of R268 was set to 0. AMS, aminomethanesulfonic acid.
Figure 5 with 1 supplement
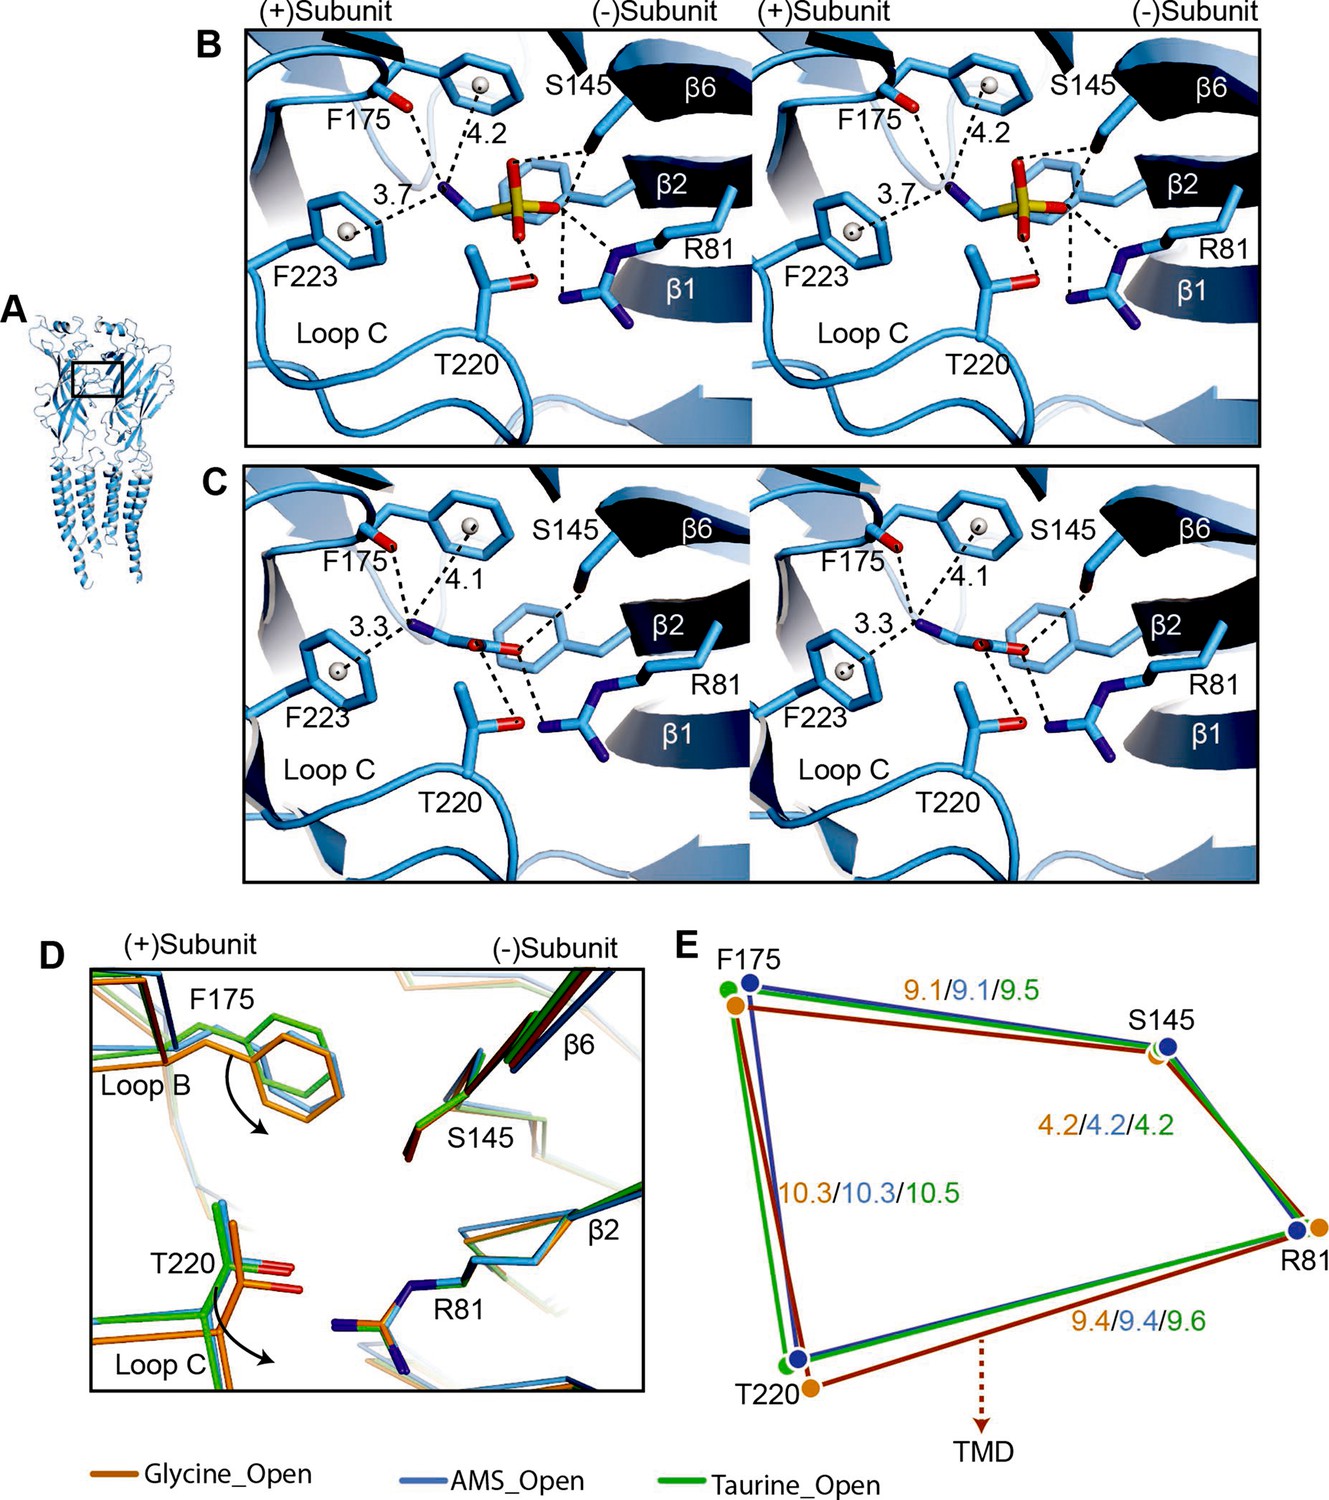
Comparison of agonist binding sites.
(A) Two adjacent GlyR subunits are shown in cartoon representation. The agonist binding pocket is indicated by a black box. (B, C) Stereo figures of the binding sites showing likely hydrogen and cation-π interactions with AMS (B) and glycine (C) bound, respectively. Numbers are the distances in Å of probable cation- π interactions. Numbering of residues includes the signal peptide of 16 amino acids. (D) Comparison of the positions of key binding residues in the open states of the glycine (salmon), taurine (green), and AMS (blue) complexes, obtained by superposing the respective ECDs. (E) Schematic diagram illustrating the distances (Å) between the Cα atoms of key amino acids in glycine-, taurine-, and AMS-bound open states. AMS, aminomethanesulfonic acid; ECD, extracellular domain.
Figure 5—figure supplement 1
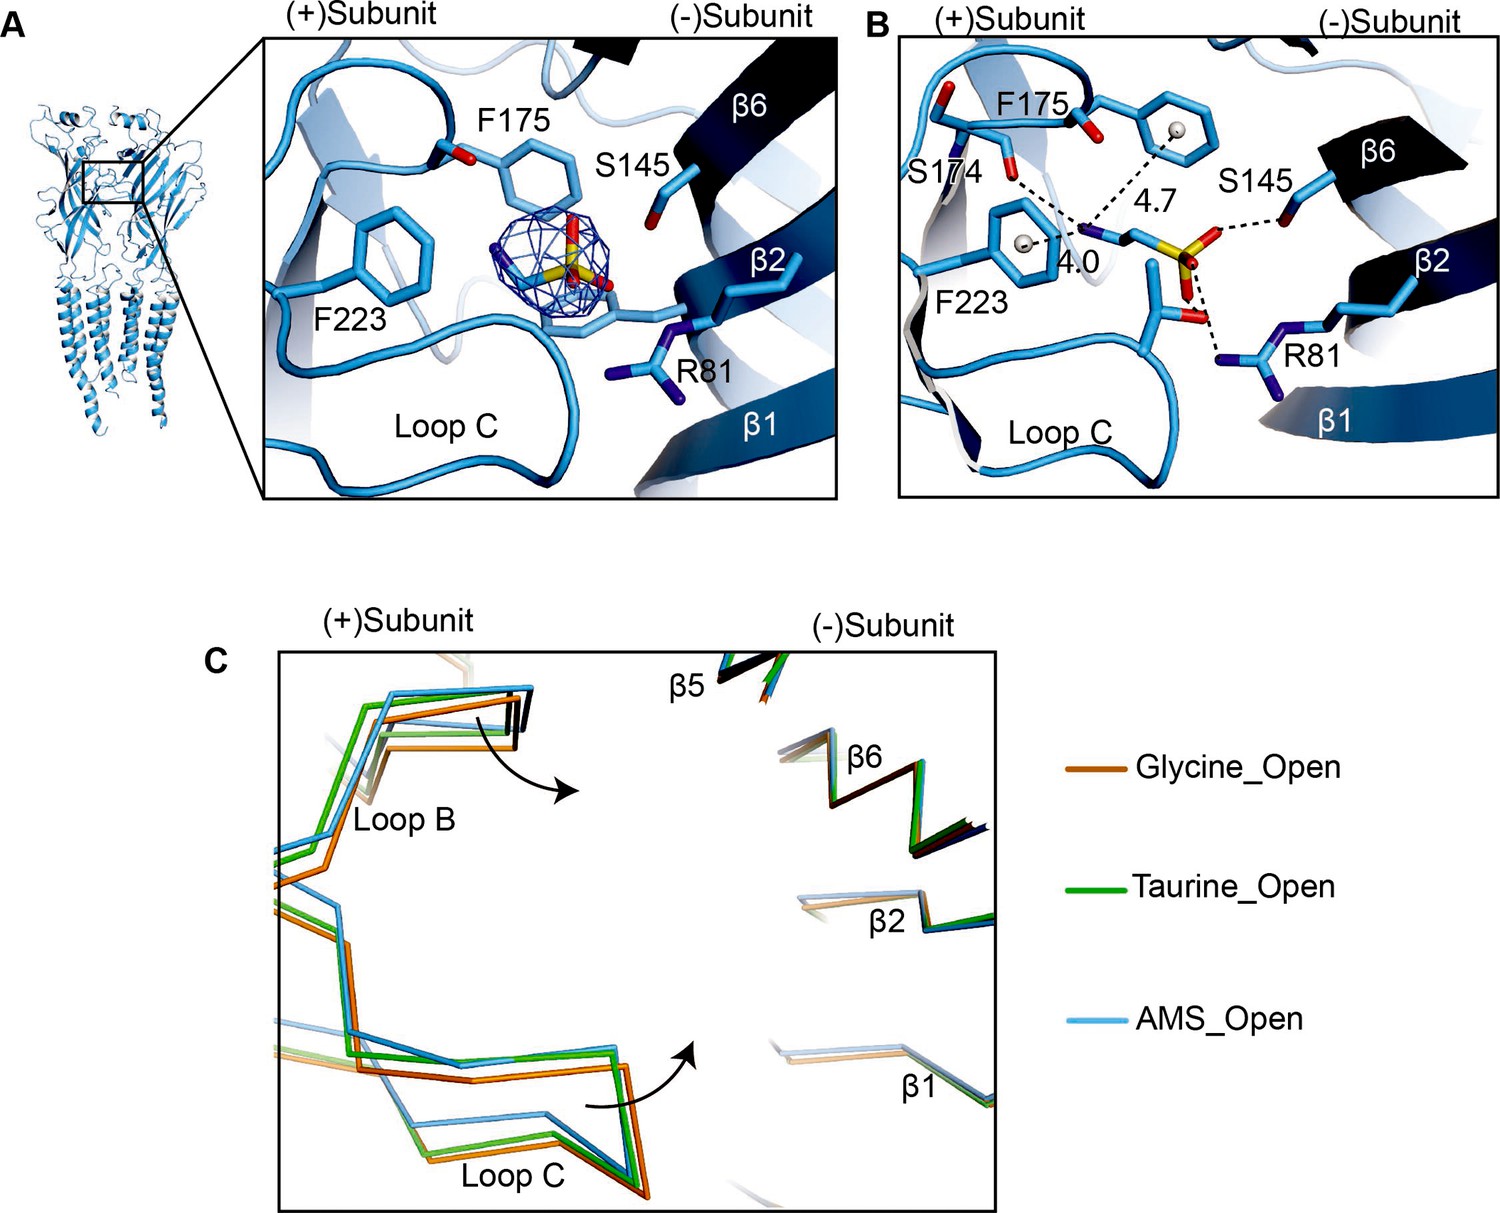
Comparison of loops B and C.
(A) Density of AMS contoured at 8.5σ in the GlyR open state. For AMS, carbon, sulfur, and nitrogen atoms are colored in blue, yellow, and red, respectively. The position of the agonist binding pocket is shown by the box in the subunit dimer shown in cartoon representation on the left. (B) Conformation of the taurine binding site showing likely hydrogen and cation-π interactions with the agonist. Distances of cation-π interaction shown in Å. The color coding is the same to panel (A). The gray spheres represent the centers of mass of the benzene ring. (C) Comparison of the secondary elements loops B and C in the binding pockets for glycine- (salmon), taurine- (green), and AMS-bound (blue) open states by superposing the ECD of the (−) subunit. AMS, aminomethanesulfonic acid; ECD, extracellular domain.
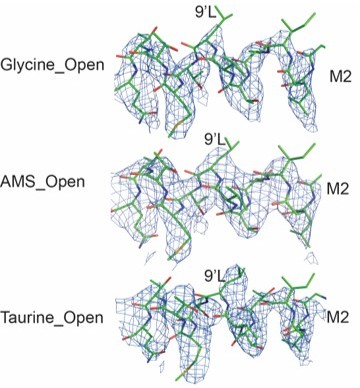
Figure 6

Comparison of the ECD-TMD interface in different agonist-bound complexes.
(A) Superposition of the ECD-TMD interface of the open states of the glycine (salmon), taurine (green), or AMS (blue) bound forms. The key amino acids at the ECD-TMD interface are shown in stick representation. Key secondary structure elements are labelled. The blue spheres represent the centers of mass of the secondary structure elements for the AMS-bound structure. (B) Schematic diagram illustrating the distances (Å) of the center of mass points shown in panel (A) of glycine-, taurine-, and AMS-bound open states. ECD, extracellular domain; TMD, transmembrane domain.
Figure 7
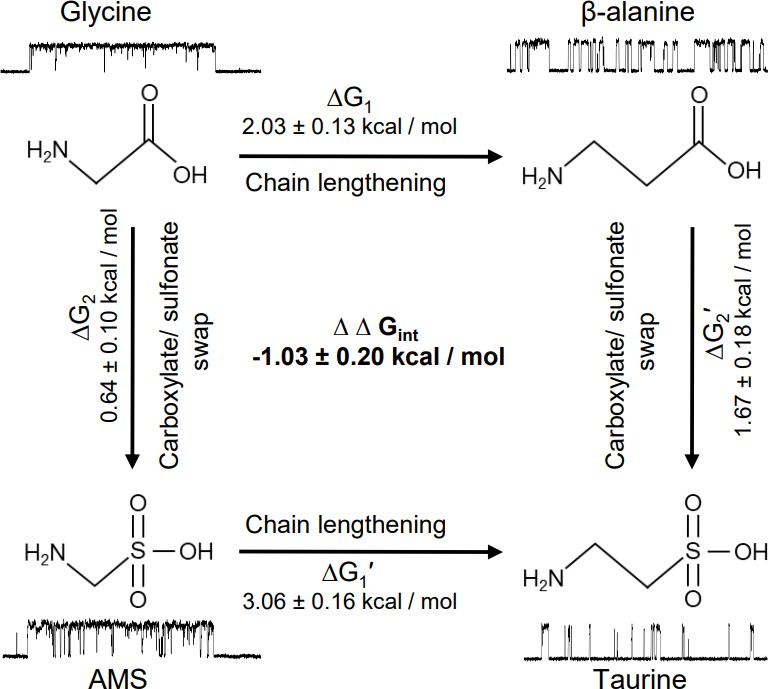
Thermodynamic cycle for the four GlyR agonists functionally characterized, showing their structure and example sweeps of the single-channel activity they elicit.
Author response image 1
Author response image 2
Tables
Table 1
Whole-cell parameters for the action of agonists on the zebrafish α1 GlyR at pH 5.
| Imax, nA | EC50, µM | nH | Iagonist/IGlymax | n | |
|---|---|---|---|---|---|
| Glycine | 4.3±1.3 | 980±360 | 1.20±0.21 | 1 | 8 |
| AMS | 5.8±1.8 | 8700±3100 | 1.95±0.22 | 0.89±0.06 | 9 |
| β-alanine | 3.5±0.3 | 4500±2600 | 1.20±0.40 | 0.69±0.09 | 6 |
| Taurine | 1.1±0.5 | 7900±2800 | 0.85±0.15 | 0.18±0.08 | 6 |
-
Table 1—source data 1
Raw data for the dose-response curves.
- https://cdn.elifesciences.org/articles/79148/elife-79148-table1-data1-v2.xlsx
Table 2
Single-channel parameters of responses elicited by four agonists on zebrafish α1 GlyR.
maxPopen was measured from n clusters of activation and reported as mean ± SD. Data at pH 7.4 are from Ivica et al., 2021.
| pH | Glycine | β-alanine | AMS | Taurine | |
|---|---|---|---|---|---|
| 5 | maxPopen | 0.96±0.06 | 0.54±0.24 | 0.85±0.19 | 0.12±0.12 |
| median Popen | 0.976 | 0.566 | 0.931 | 0.060 | |
| npatches(nclusters) | 8 (92) | 7 (52) | 11 (146) | 9 (37) | |
| Agonist concentration (mM) | 100 | 100 | 100 | 500 | |
| 7.4 | maxPopen | 0.97±0.05 | 0.91±0.21 | / | 0.66±0.24 |
| median Popen | 0.989 | 0.978 | / | 0.728 | |
| npatches(nclusters) | 10 (48) | 7 (30) | / | 7 (71) | |
| Agonist concentration (mM) | 10 | 30 | 100 |
Key resources table
| Reagent type (species) or resource | Designation | Source or reference | Identifiers | Additional information |
|---|---|---|---|---|
| Cell line (Homo sapiens) | HEK293A | Invitrogen: https://www.thermofisher.com/order/catalog/product/R70507?SID=srch-hj-R705-07 | Catalog no. R705-07 | lot #1942007; certified mycoplasma free by supplier |
| Cell line (Spodoptera frugiperda) | Sf9 | Thermo Fisher Scientific: https://www.thermofisher.com/order/catalog/product/12659017 | Catalog no. 12659017 | lot 421973 mycoplasma tested at OHSU |
| Recombinant DNA reagent | Zebrafish GlyRa1 subcloned in pcDNA3 vectorf | https://doi.org/10.1016/j.cell.2021.01.026 | Uniprot identifier: O93430 | |
| Recombinant DNA reagent | Zebrafish GlyRa1 subcloned in pFastBac Dual vector | This paper | Uniprot identifier: O93430 | |
| Software, algorithm | OriginPro software | https://www.originlab.com/ | Origin 2019b | |
| Software | Clampex software, Molecular Devices | https://support.moleculardevices.com/s/article/Axon-pCLAMP-10-Electrophysiology-Data-Acquisition-Analysis-Software-Download-Page | Clampex 10.7 | |
| Software | DC-STATS | Plested and Lape, 2020 | Our lab; https://github.com/DCPROGS/DCSTATS/releases/tag/v.0.3.1-alpha | |
| Software | CVFIT | Lape, 2020b | https://github.com/DCPROGS/CVFIT/releases/tag/v1.0.0-alpha | |
| Software | MotionCor2 | https://doi.org/10.1038/nmeth.4193 | RRID:SCR_016499 | http://msg.ucsf.edu/em/software/motioncor2.html |
| Software | cryoSparc | https://doi.org/10.1038/nmeth.4169 | RRID:SCR_016501 | https://cryosparc.com/ |
| Software | Coot | https://doi.org/10.1107/S0907444910007493 | RRID:SCR_014222 | https://www2.mrc-lmb.cam.ac.uk/personal/pemsley/coot/ |
| Software | Phenix | https://doi.org/10.1107/S2059798318006551 | RRID:SCR_014224 | https://www.phenix-online.org/ |
| Software | Pymol | PyMOL Molecular Graphics System, Schrodinger, LLC | RRID:SCR_000305 | http://www.pymol.org/ |
| Software | UCSF ChimeraX | https://doi.org/10.1002/pro.3235 | RRID:SCR_015872 | http://cgl.ucsf.edu/chimerax/ |
| Antibody | anti-human CD235a-APC (mouse monoclonal) | Thermo Fisher Scientific | Cat#: 17-9987-42; RRID:AB_2043823 | FACS (5 µl per test) |
| Recombinant DNA reagent | PLKO-GFP (plasmid) | This paper | GFP version of pLKO.1-Puro | |
| Recombinant DNA reagent | PLKO.1-Puro (plasmid) | Sigma-Aldrich | RRID:Addgene_10878 | Pol III based shRNA backbone |
| Sequence-based reagent | Gipc1_F | This paper | PCR primers | GGGAAAGGACAAAAGGAACCC |
| Sequence-based reagent | Gipc1_R | This paper | PCR primers | CAGGGCATTTGCACCCCATGCC |
| Sequence-based reagent | siRNA: nontargetin control | Thermo Fisher Scientific | 4390843 | Silencer Select |
| Peptide, recombinant protein | Streptavidin | Thermo Fisher Scientific | Cat#: 434302 | |
| Commercial assay or kit | In-Fusion HD Cloning | Clontech | Clontech: 639647 | |
| Chemical compound, drug | CBR-5884 | Sigma-Aldrich | SML1656 | |
| Chemical compound, drug | SL30010 (SMALP 30010P) | Polyscope | http://polyscope.eu/markets/polyscience/ |
Author response table 1
| EQUILIBRIUM | OCCUPANCY | |||||
|---|---|---|---|---|---|---|
| 0.08mM gly | 100 mM taurine | 10 mM gly | ||||
| Open (=Popen) | 0.56 | 0.56 | 0.95 | |||
| bound closed | 0.18 | 0.44 | 0.05 | |||
| unbound closed | 0.26 | 0.00 | 0.00 |
Author response table 2
| pH 5 | Effect of gating enhancement | Popen | 5x Eeff | |
|---|---|---|---|---|
| Median Popen | Eeff | |||
| Glycine | 0.976 | 40.7 | 0.995 | 203.5 |
| Β-alanine | 0.565 | 1.3 | 0.867 | 6.5 |
| Taurine | 0.057 | 0.06 | 0.231 | 0.3 |
Additional files
-
Supplementary file 1
Statistics for 3D reconstruction and model refinement.
- https://cdn.elifesciences.org/articles/79148/elife-79148-supp1-v2.docx
-
MDAR checklist
- https://cdn.elifesciences.org/articles/79148/elife-79148-mdarchecklist1-v2.docx
Download links
A two-part list of links to download the article, or parts of the article, in various formats.
Downloads (link to download the article as PDF)
Open citations (links to open the citations from this article in various online reference manager services)
Cite this article (links to download the citations from this article in formats compatible with various reference manager tools)
Aminomethanesulfonic acid illuminates the boundary between full and partial agonists of the pentameric glycine receptor
eLife 11:e79148.
https://doi.org/10.7554/eLife.79148


