Olfactory receptor neurons generate multiple response motifs, increasing coding space dimensionality
- Eunice Kennedy Shriver National Institute of Child Health and Human Development (NICHD), National Institutes of Health (NIH), United States
- Brown University - National Institutes of Health Graduate Partnership Program, United States
- Department of Medicine, University of California, San Diego, United States
- Department of Clinical Neurophysiology and MEG Center, Amsterdam Neuroscience, Vrije Universiteit Amsterdam, Netherlands
- Biocircuits Institute, University of California, San Diego, United States
Figures
Figure 1 with 4 supplements
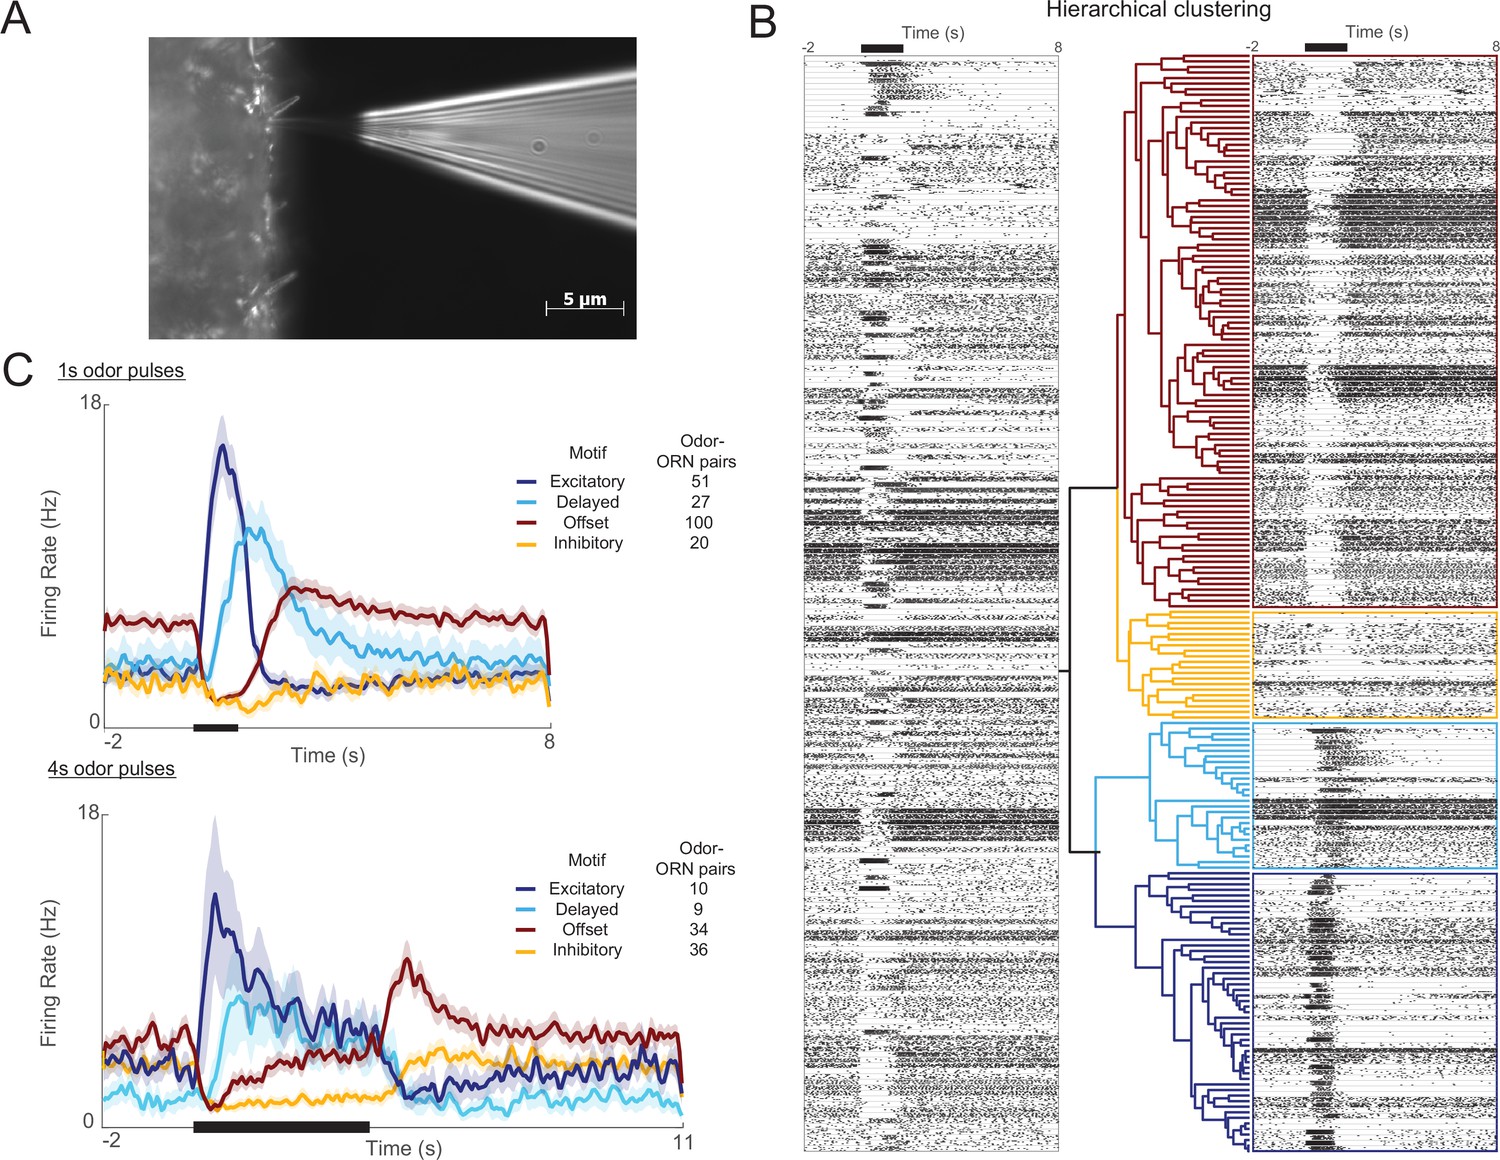
Olfactory receptor neuron (ORN) responses cluster into four distinct motifs.
(A) Extracellular recordings were made with a blunt quartz electrode placed on the base of the sensillum. (B) Raster plot shows ORN spikes elicited by 1 s odor pulse (black bar at top). Horizontal lines separate ORN-odor pairs (five trials each). A hierarchical clustering algorithm (see ‘Materials and methods’) grouped these responses into four distinct motifs. (C) Histograms show the four motifs (excitatory, delayed, offset, and inhibitory) reliably elicited by 1 s and 4 s odor pulses. Five trials each; bold lines: means; shading: SEM.
Figure 1—figure supplement 1
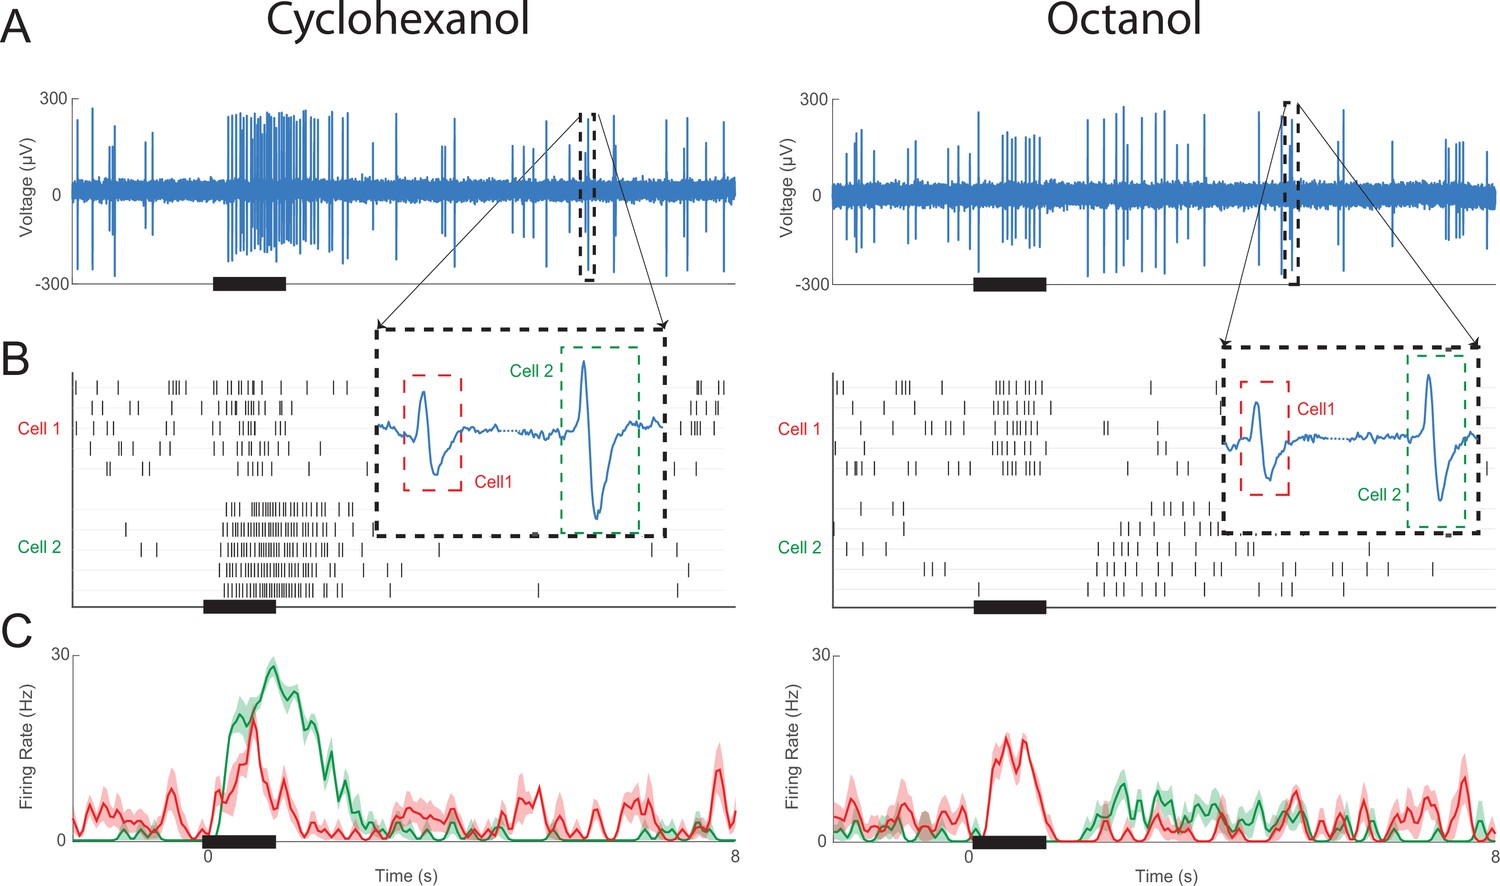
Example of a sensillum recording including two olfactory receptor neurons (ORNs).
(A) Raw voltage recording shows extracellular sensillum responses to pulses of cyclohexanol and octanol. Insets show two waveforms, each originating from spikes in different ORNs. (B) Recordings were then processed through a spike sorting algorithm (see ‘Materials and methods’) to create a raster plot of the two responsive ORNs in this sensillum. (C) Peristimulus time histogram of the two sorted ORN responses. ORN 1 has an excitatory response to both odorants, whereas ORN 2 has an excitatory response to cyclohexanol and an inhibitory response to octanol. bold lines: means; shading: SEM.
Figure 1—figure supplement 2
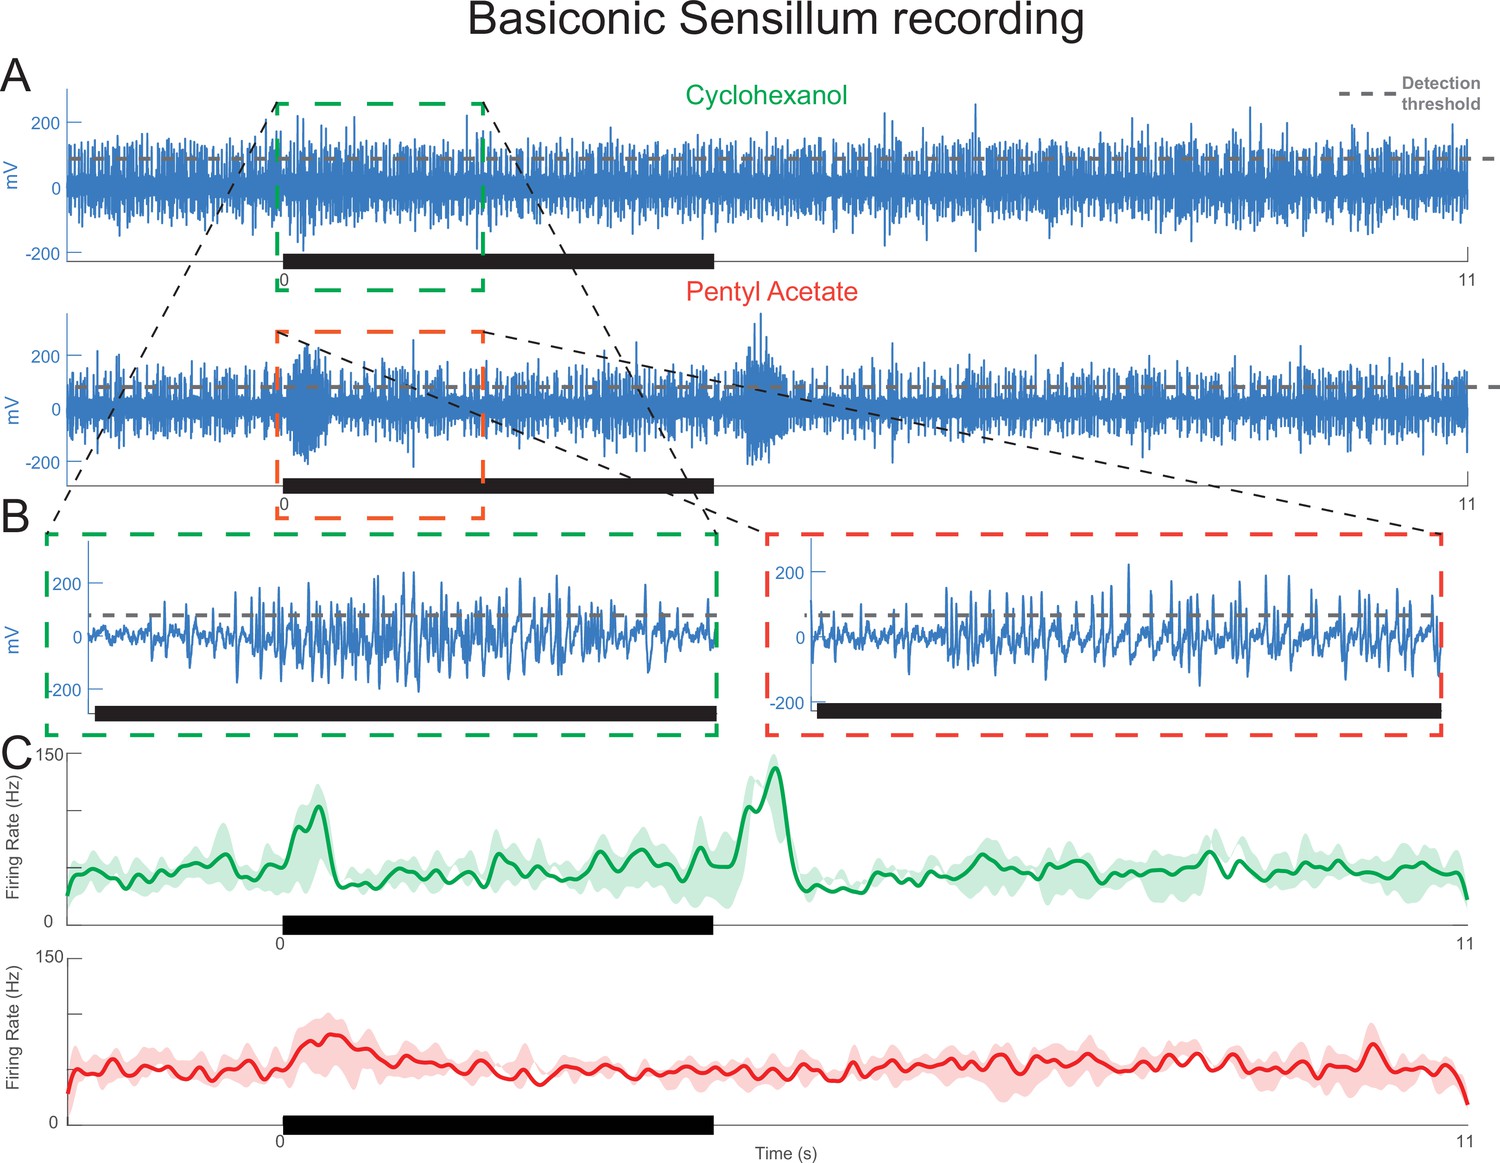
Basiconic sensilla, which contain many olfactory receptor neurons (ORNs), show response patterns consistent with motifs observed in trichoid sensilla.
(A) Extracellular sensillum recording showing responses to cyclohexanol and pentyl acetate. (B) Inset: dense spiking activity from many ORNs makes accurate spike sorting impossible. Gray dotted line: threshold used to detect unsorted spikes within the population response. (C) Peristimulus time histogram showing timing of these spikes. The same ORN population shows different response patterns depending on the odor: cyclohexanol appears to elicit excitatory as well as offset motifs, but pentyl acetate appears to elicit mainly the excitatory motif. bold lines: means; shading: SEM.
Figure 1—figure supplement 3
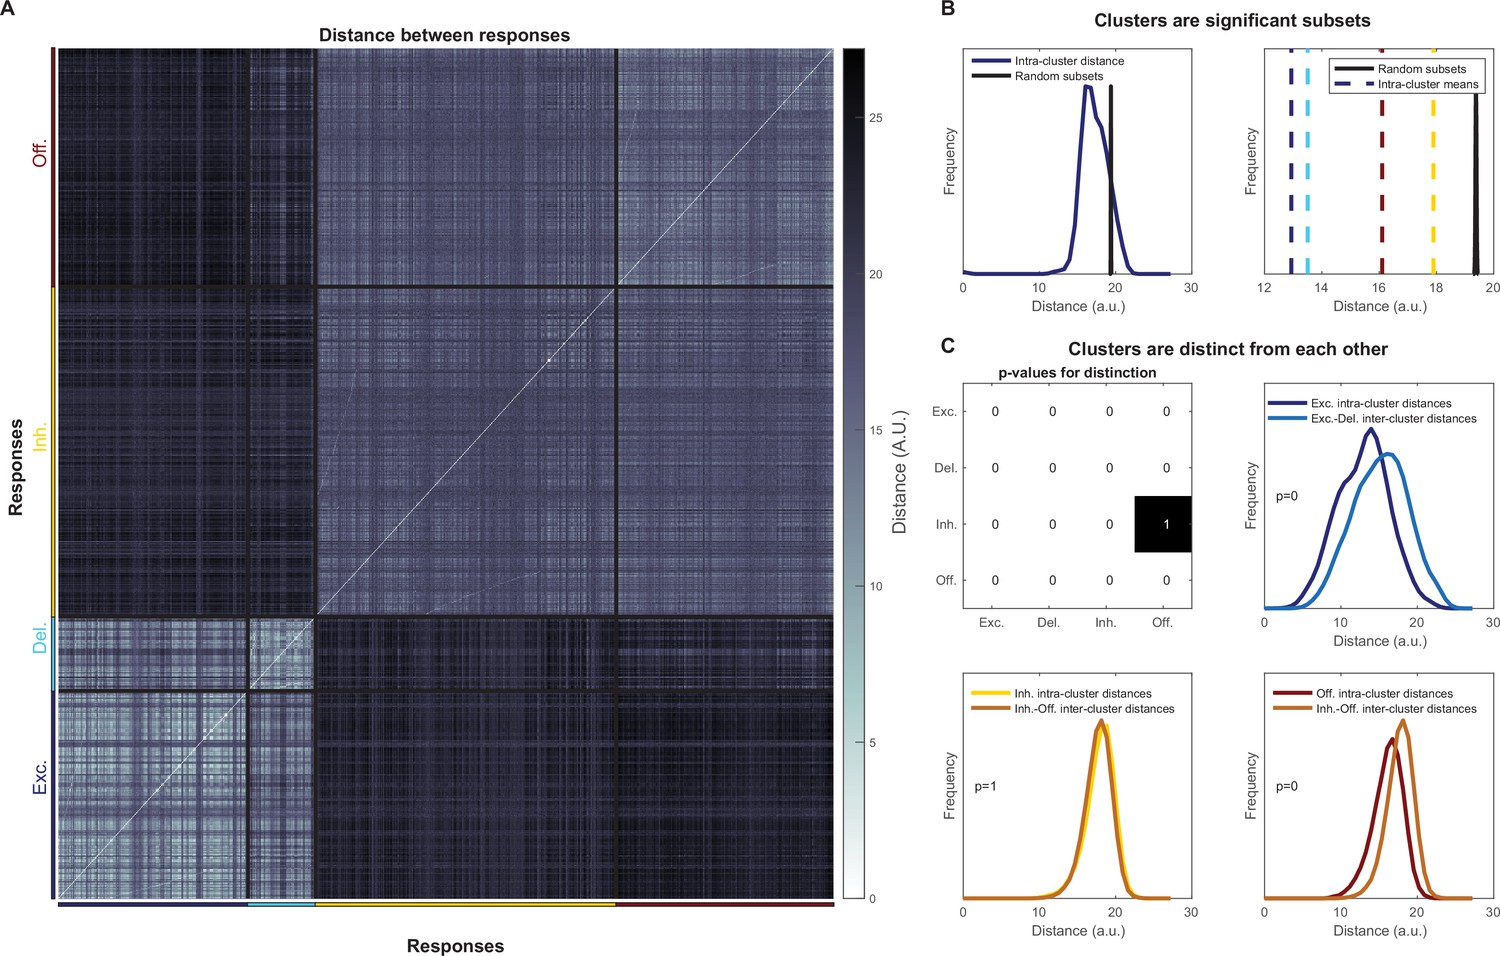
Statistical significance of response motifs found through hierarchical clustering.
(A) Distance between all olfactory receptor neuron (ORN) responses. (B) Comparison of intra-cluster distances with average distances randomly sampled for the delayed cluster (left) and with all intra-cluster distance means, all cluster means are well below the 5th percentile (right). (C) Clusters are distinct from each other: (top-left) p-values for each comparison between different clusters, note, the comparison metric is non-symmetric (see ‘Materials and methods’); example of comparison between the excitatory and delayed clusters (top right); and the two comparisons between the offset and inhibitory clusters. See the ‘Materials and methods’ for an interpretation of these statistics.
Figure 1—figure supplement 4
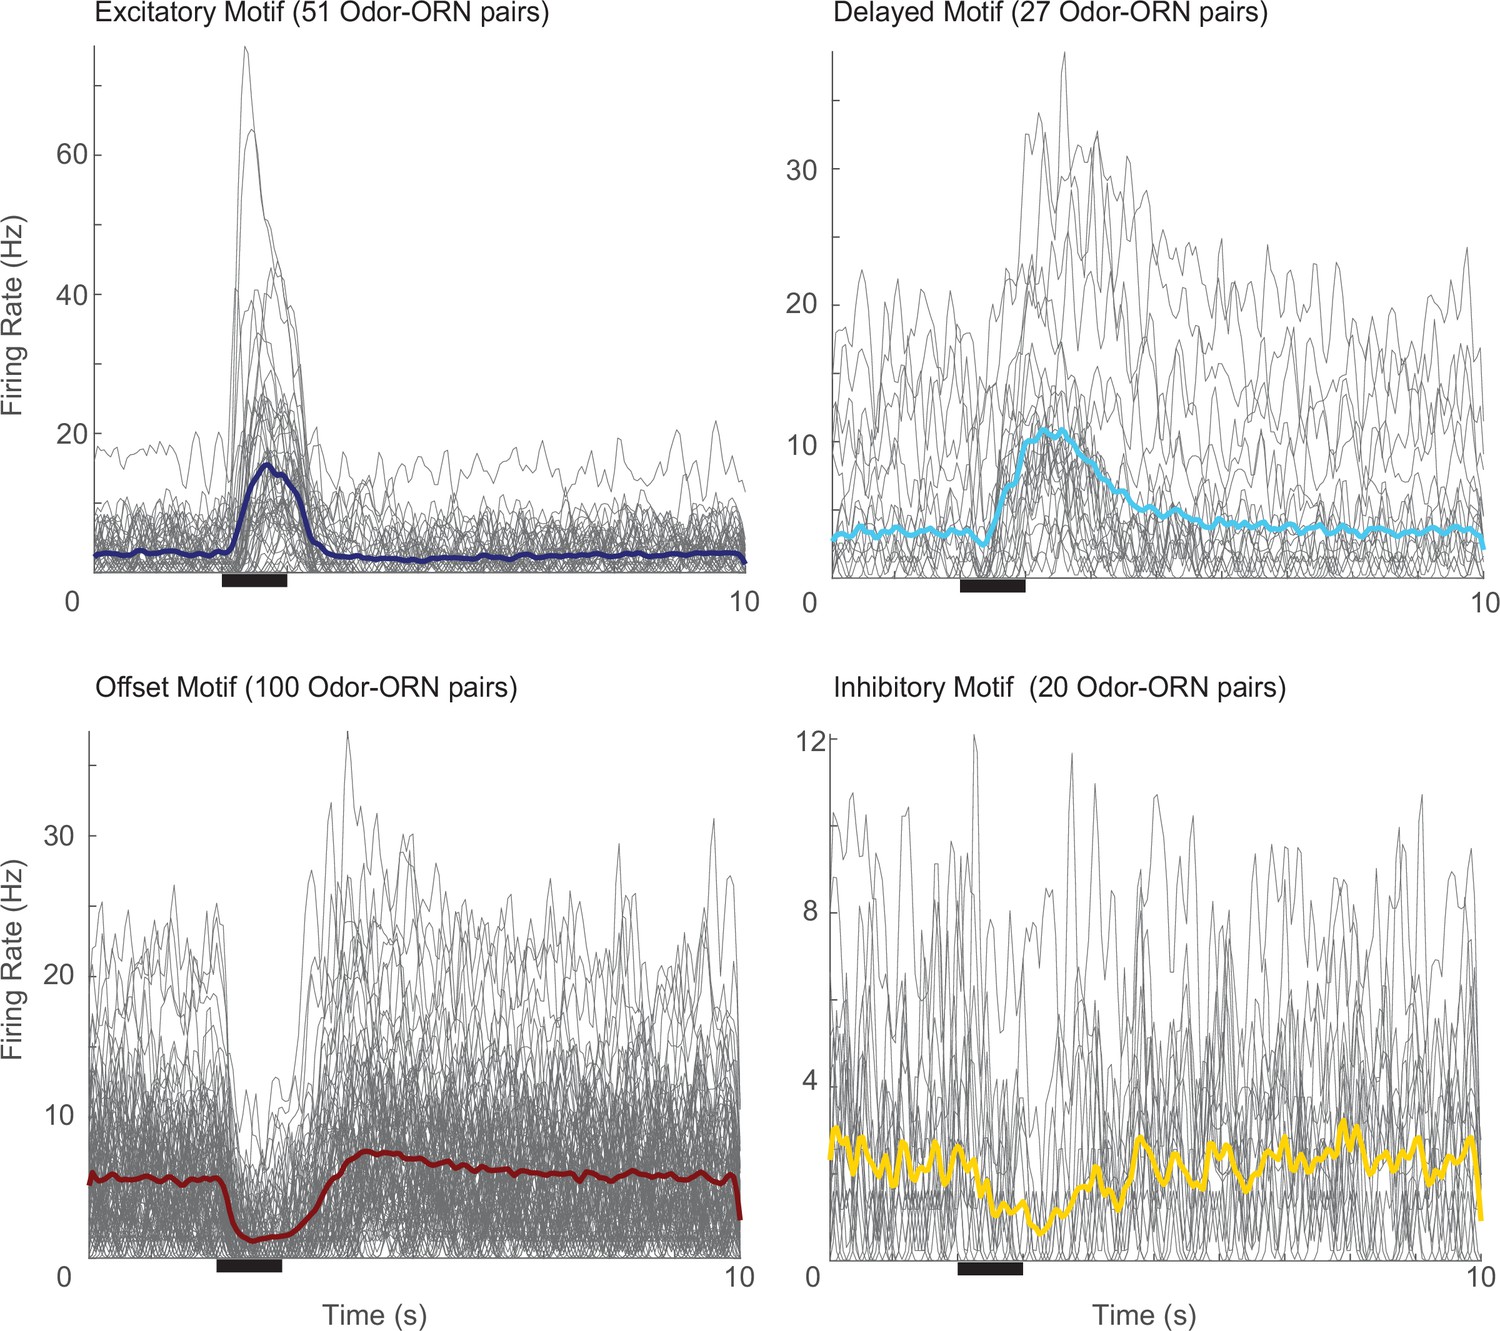
Odor-olfactory receptor neuron (Odor-ORN) responses to 1 s odor pulses, organized by response motif.
A total of 198 odor-ORN responses are plotted in thin gray lines with the average response shown in a thicker color line. Black bar: 1 s odor pulse.
Figure 2 with 1 supplement
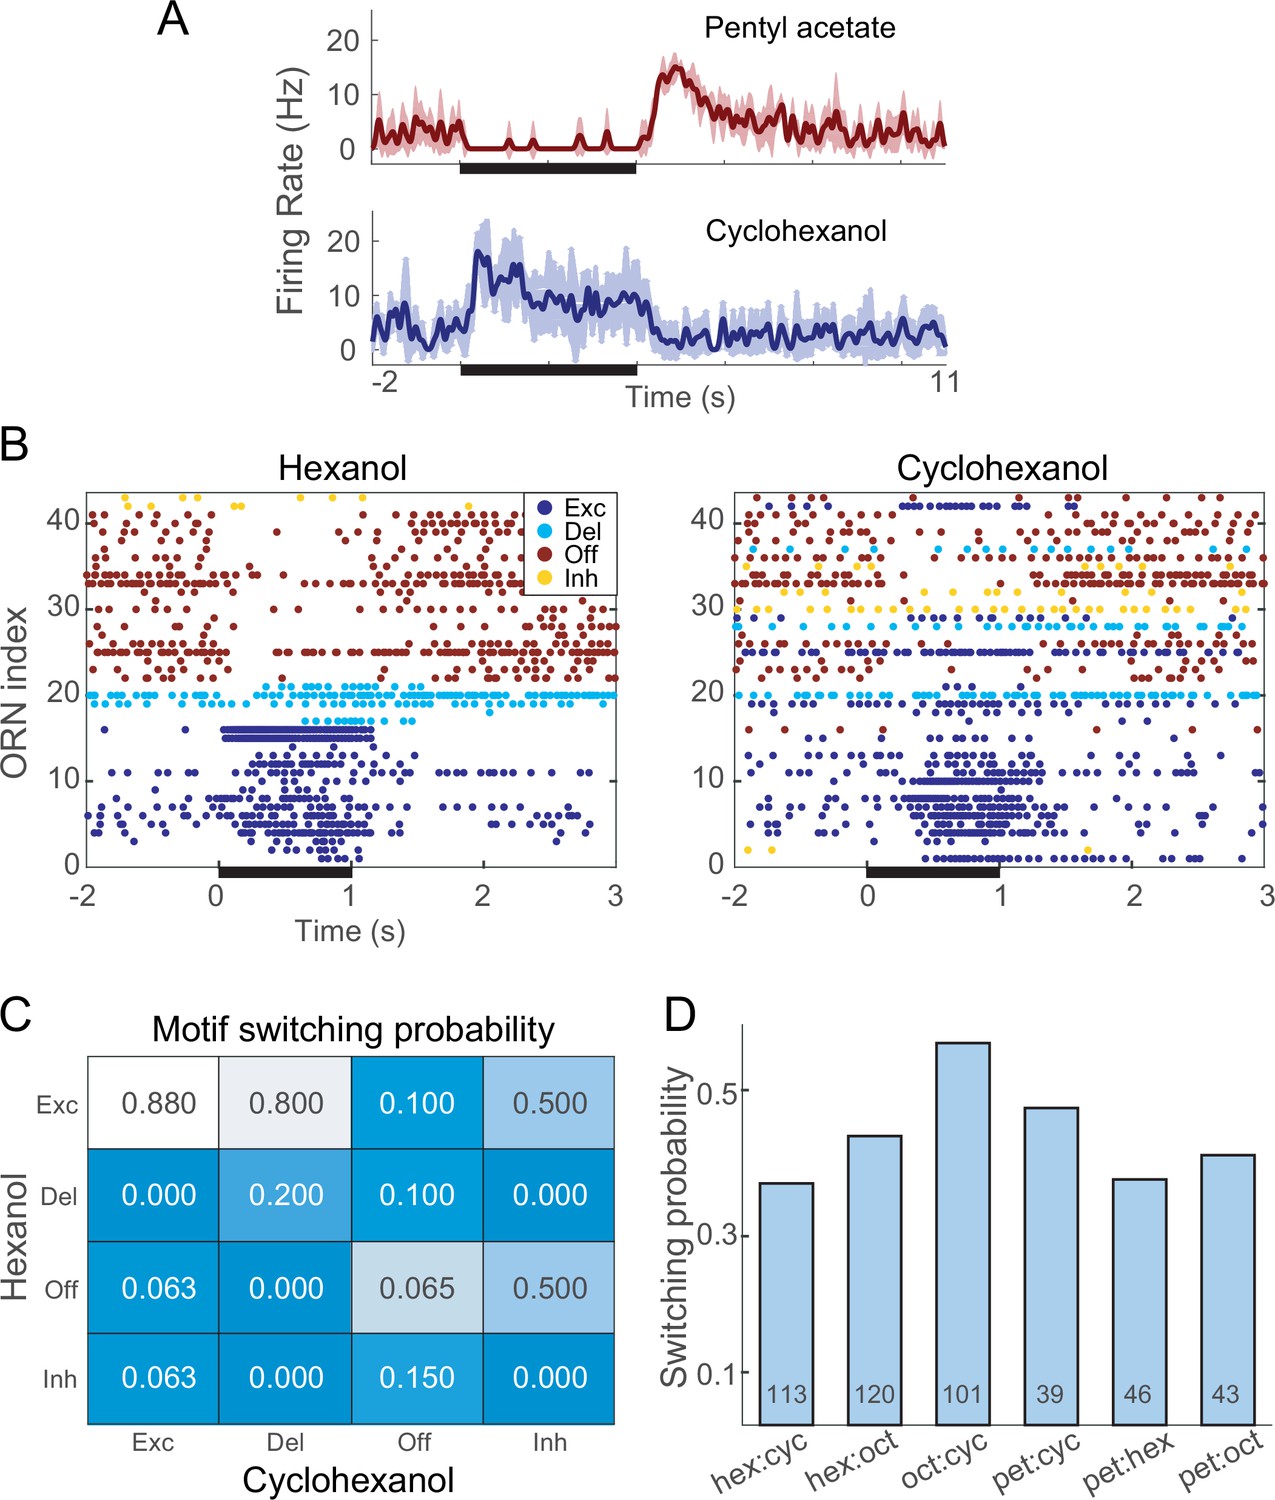
Different odors can elicit different response motifs from a given olfactory receptor neuron (ORN).
(A) A single example ORN responds to two different odorants with different motifs. Five trials; bold lines: mean firing rate; shading: SEM. (B) Raster plots show spiking responses of 41 ORNs to 1 s (black bar) pulses of hexanol and cyclohexanol. Responses to both odors are sorted by motifs elicited by hexanol. (C) Conditional probability of an ORN producing a specific motif in response to hexanol given its response motif to octanol. (D) Switching probabilities varied with odor pairs (numbers at bottoms of bars: numbers of tested ORNs).
Figure 2—figure supplement 1
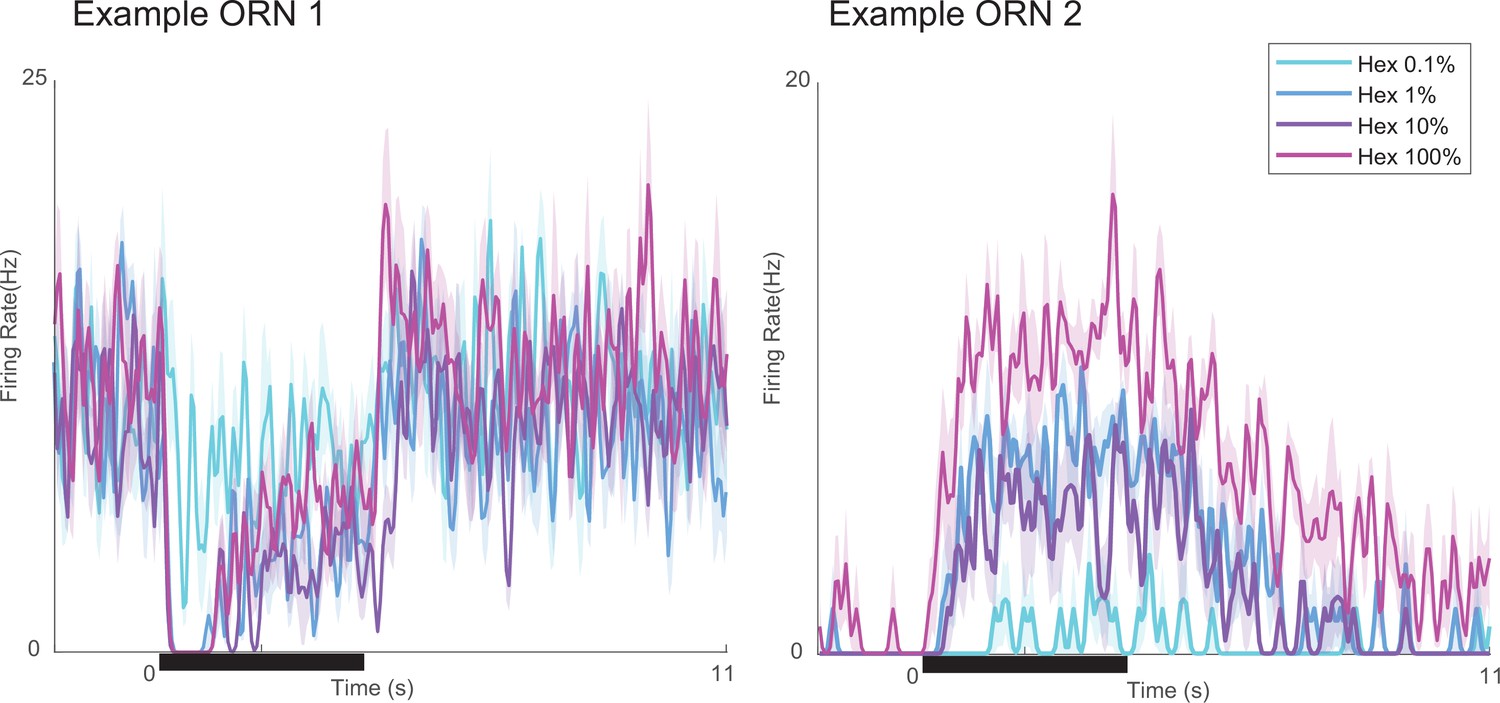
Response motifs vary little with odor concentration.
Two example neurons stimulated with varying concentrations of hexanol (0.1–100%). Bold lines: mean firing rate, five trials; shading: SEM.
Figure 3 with 1 supplement
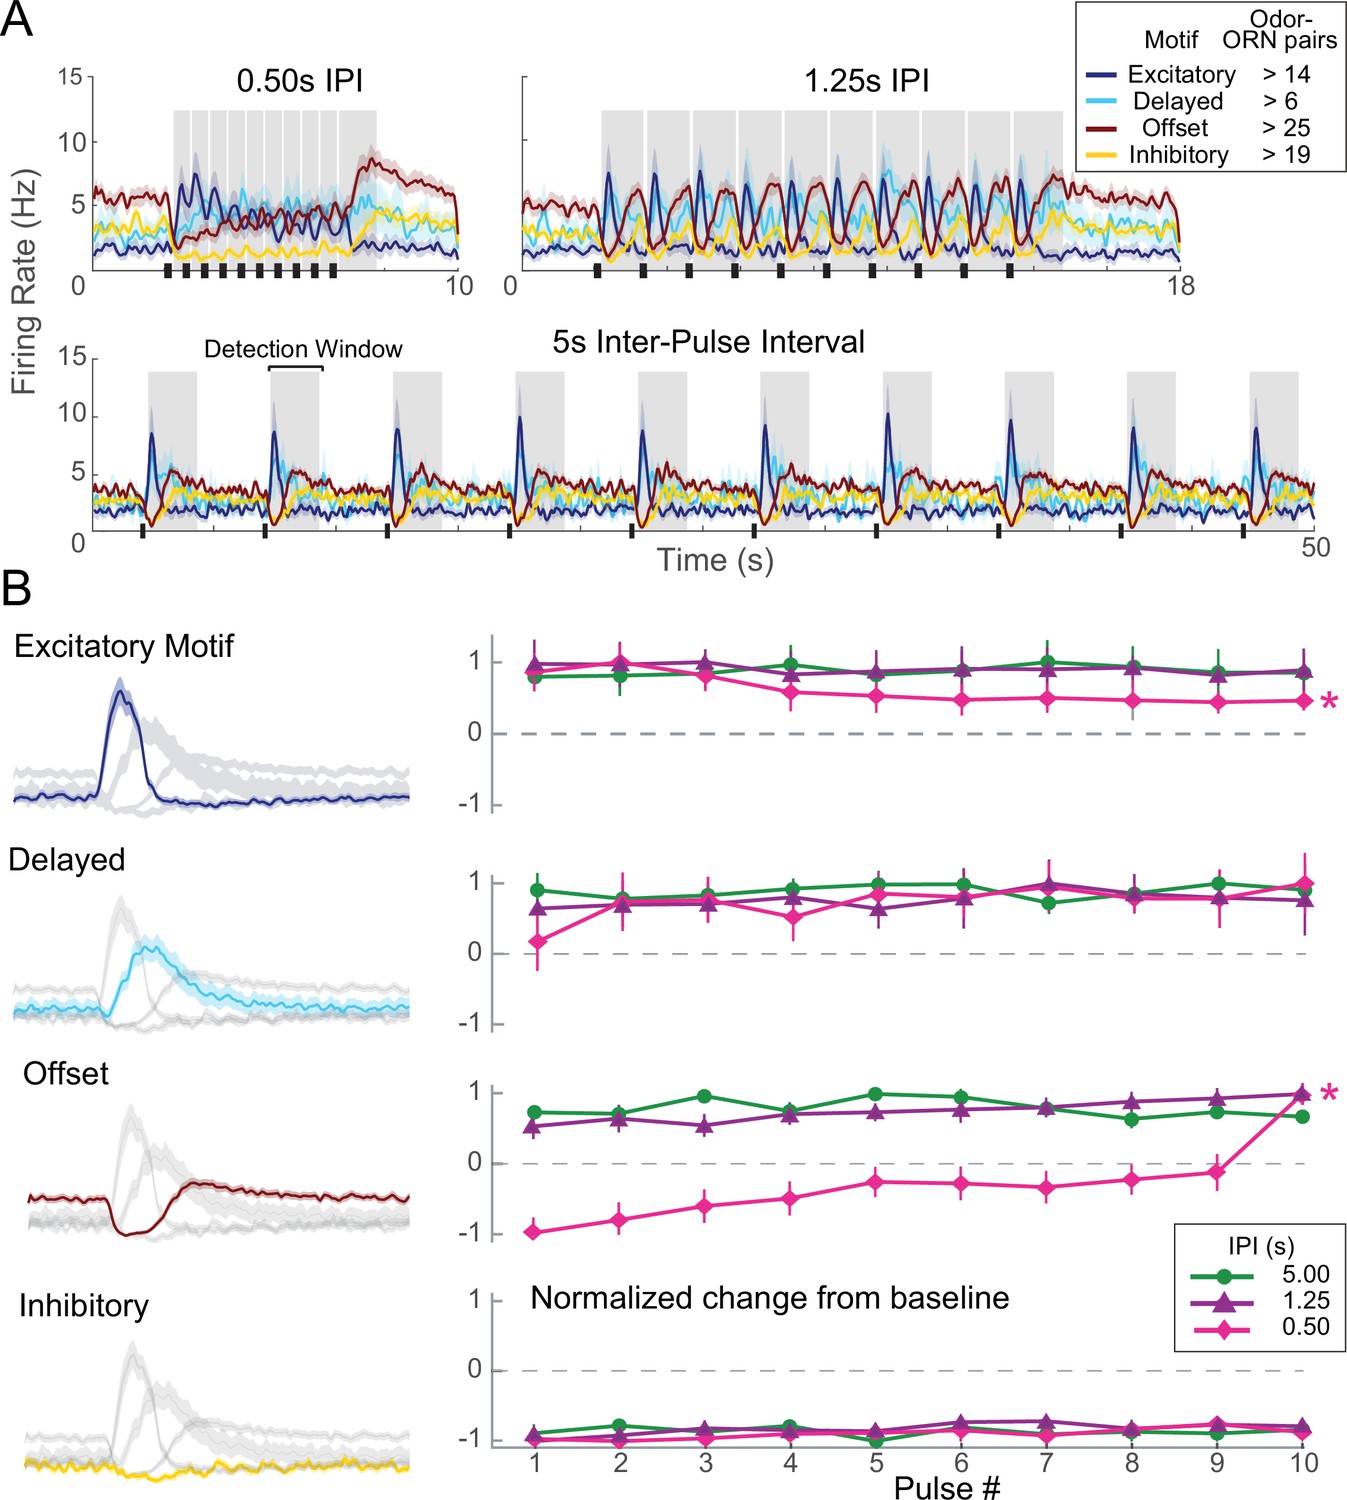
Each olfactory receptor neuron (ORN) response motif has a distinct adaptation profile.
(A) Responses of ORNs, grouped by motif, to odors pulsed at different inter-pulse intervals (IPIs). Peaks for different motifs and pulses were measured as maximum absolute change from baseline within detection windows (shaded areas). (B) Adaptation characteristics of excitatory, delayed, offset, and inhibitory response motif to 10 pulses for each IPI. Left: response motifs; Right: normalized response change from baseline. *Statistically significant changes elicited by odor pulses delivered at 0.50 s IPI. Excitatory motif responses significantly decreased; offset motif responses significantly increased; delayed motif responses modestly increased; and inhibitory motif responses did not change. See Table 1 for statistical tests.
Figure 3—figure supplement 1
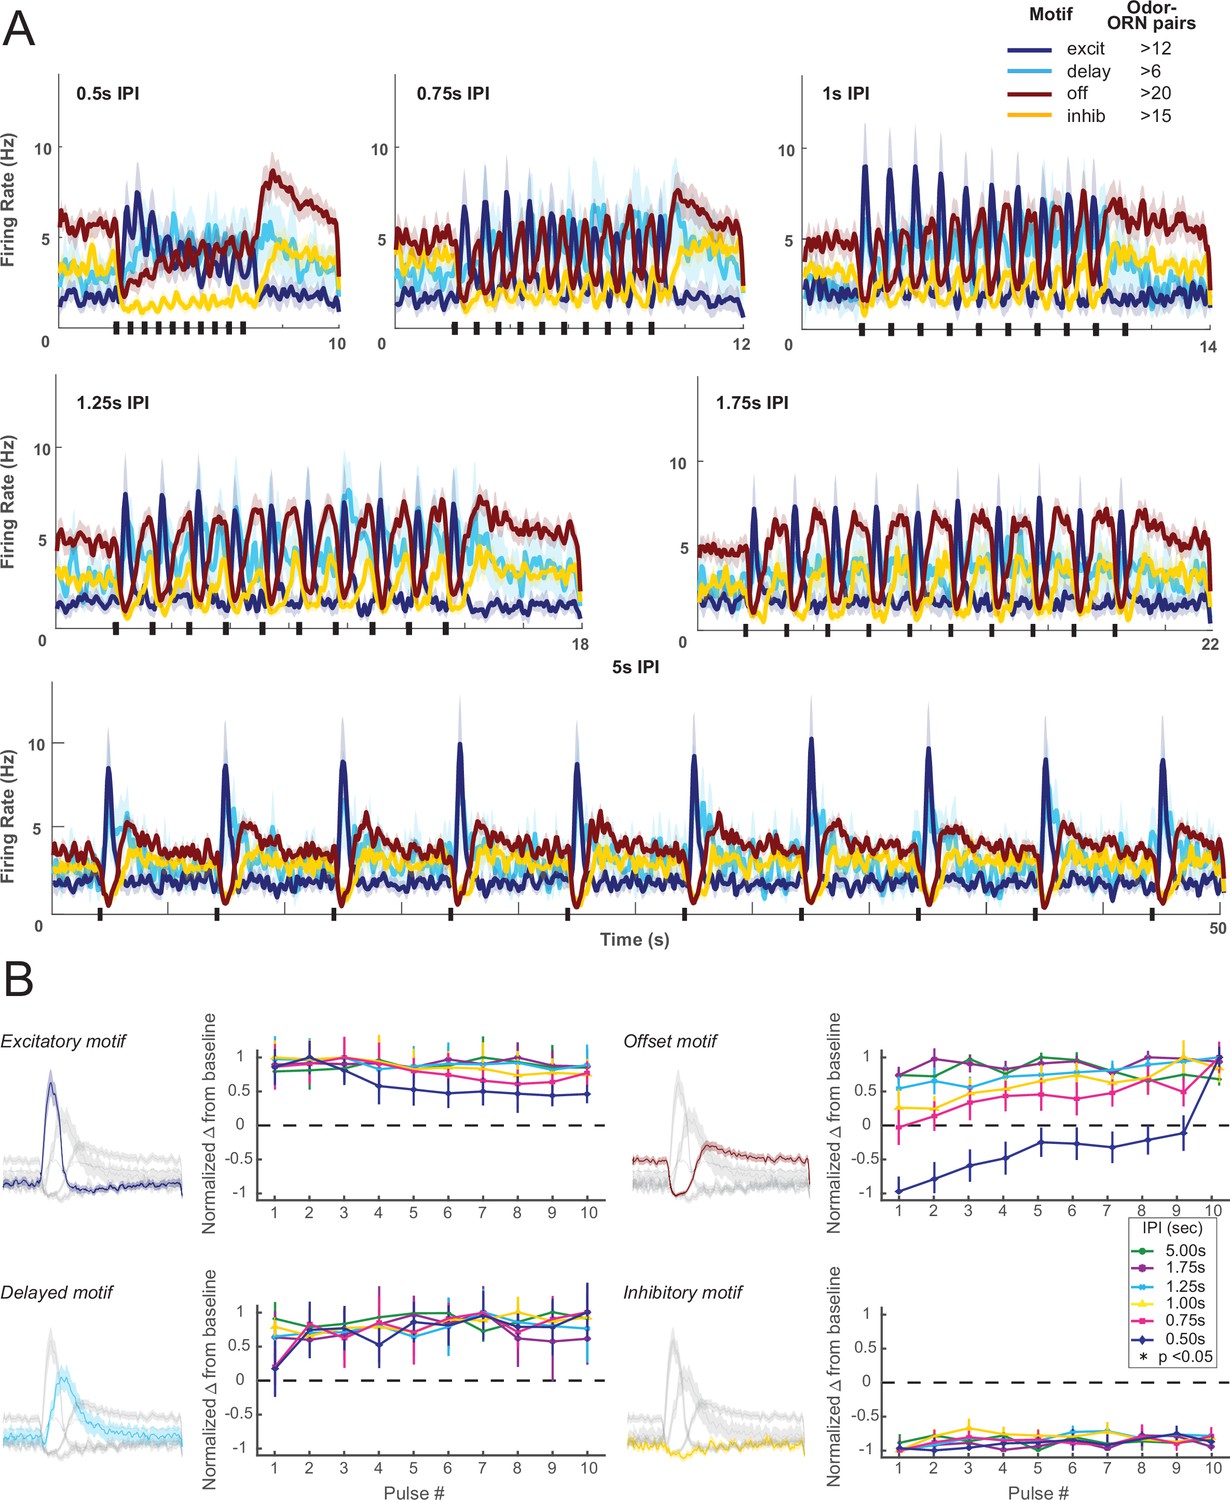
Additional examples of motif-specific adaptation profiles.
(A) Firing rate histograms show responses of olfactory receptor neurons (ORNs), grouped by motif, to odors pulsed at different inter-pulse intervals (IPIs). Peak spiking for different motifs and IPIs were measured within the shaded area. (B) Adaptation characteristics of excitatory, delayed, offset, and inhibitory response motif to 10 pulses for each IPI. A one-way repeated-measures ANOVA was performed to determine if there was a significant (p<0.05) effect on the response with increasing pulse number. According to this metric, the excitatory motif showed a statistically distinct change from baseline at 0.5 s and 1 s IPI. The offset motif showed a statistically distinct change from baseline at 0.5 s, 1 s, and 5 s IPI. The inhibitory motif showed a statistically distinct change from baseline at 0.75 s and 5 s IPI. Error bars: SEM.
Figure 4 with 1 supplement
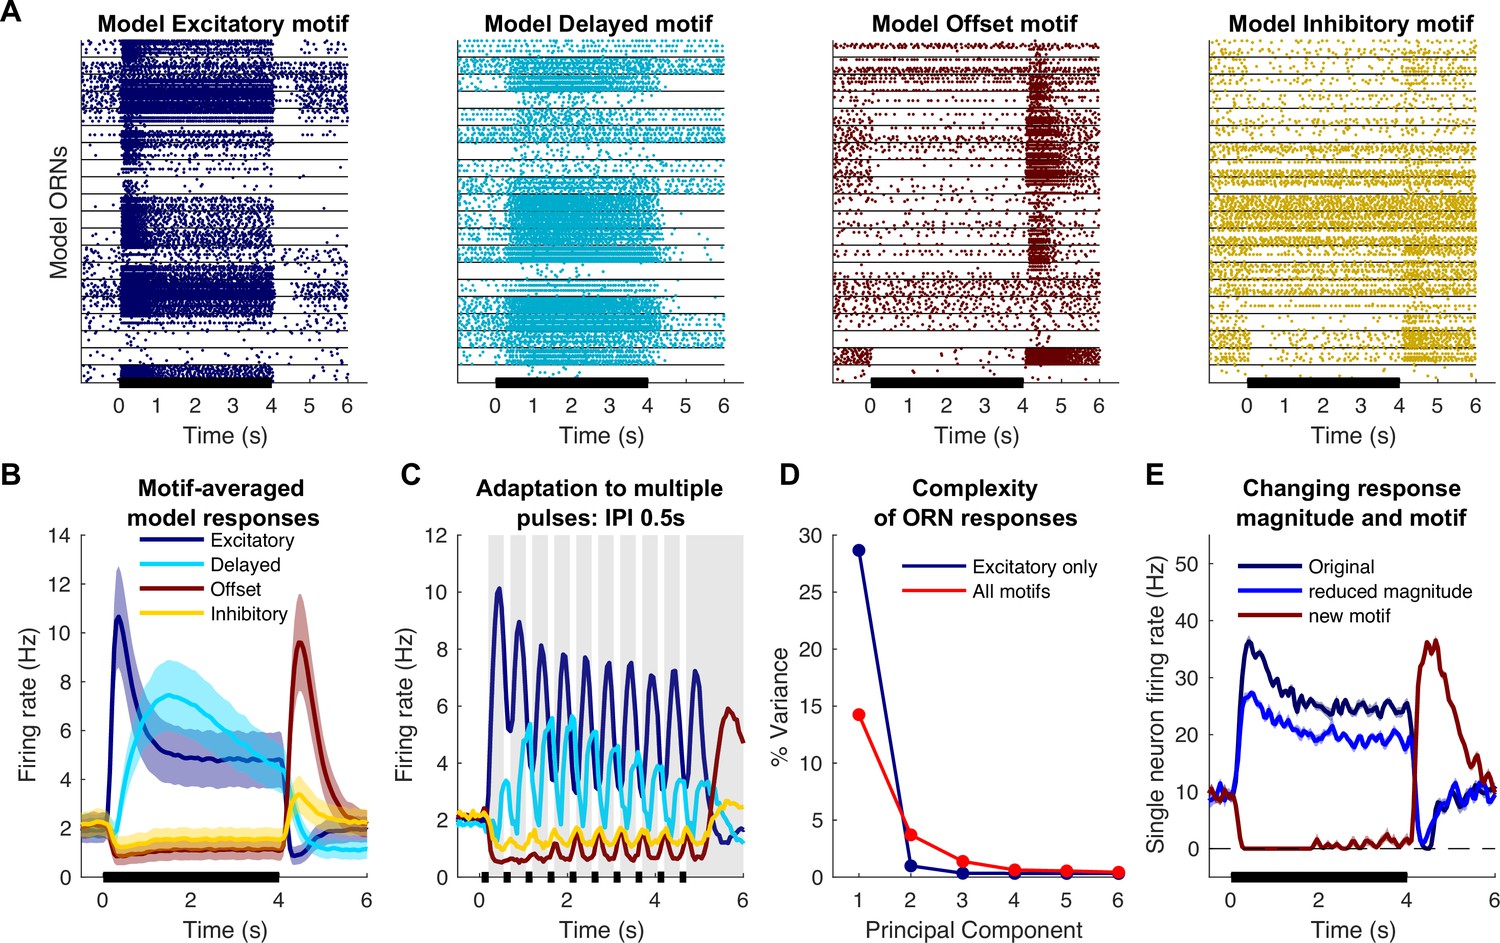
Computational model simulates response motifs.
(A) Raster plots of simulated olfactory receptor neuron (ORN) responses illustrate each motif. Rows: different trials; horizontal lines separate responses of different ORNs. Black bar: odor pulse. (B) Firing rates averaged across trials and ORNs by motif. Bold line: mean; shading: SEM; compare to Figure 1C. (C) Model driven at 0.50 s inter-pulse interval (IPI) simulates adaptation profiles of each motif; firing rate averaged across ORNs within a motif; compare to Figure 3A. (D) Principal component analysis of excitatory only ORN responses (blue) or all response motifs (red) shows the inclusion of multiple motifs adds to the complexity of the responses. (E) The model can vary response magnitude and motif independently; responses of a single model ORN to three different odors are shown.
Figure 4—figure supplement 1
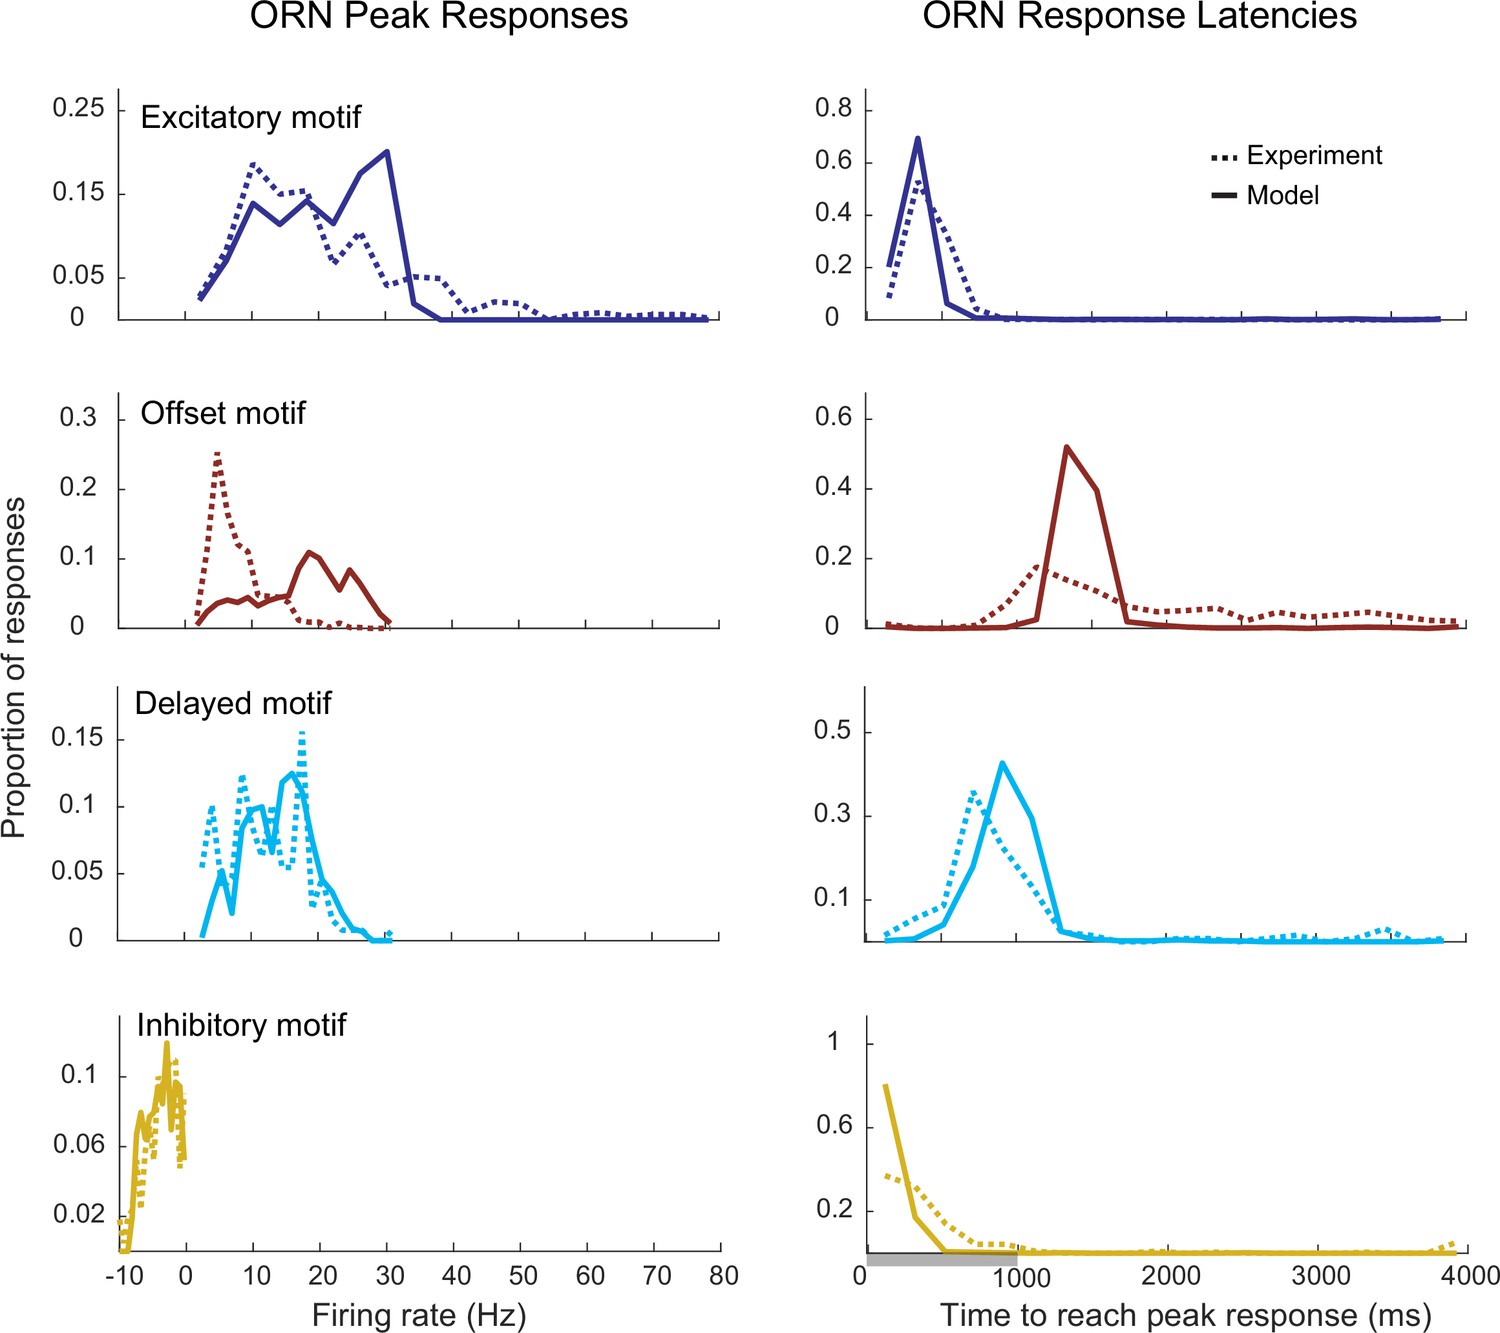
Distribution of peak firing rates and response latencies for different motifs in the model and in vivo elicited by a 1000 ms odor pulse.
Left: the peak responses were calculated as the maximum firing rate for the excitatory, delayed, and offset motifs, and as the minimum firing rate for the Inhibitory motif. Right: the response latencies were calculated as the time required to reach the peak response.
Figure 5
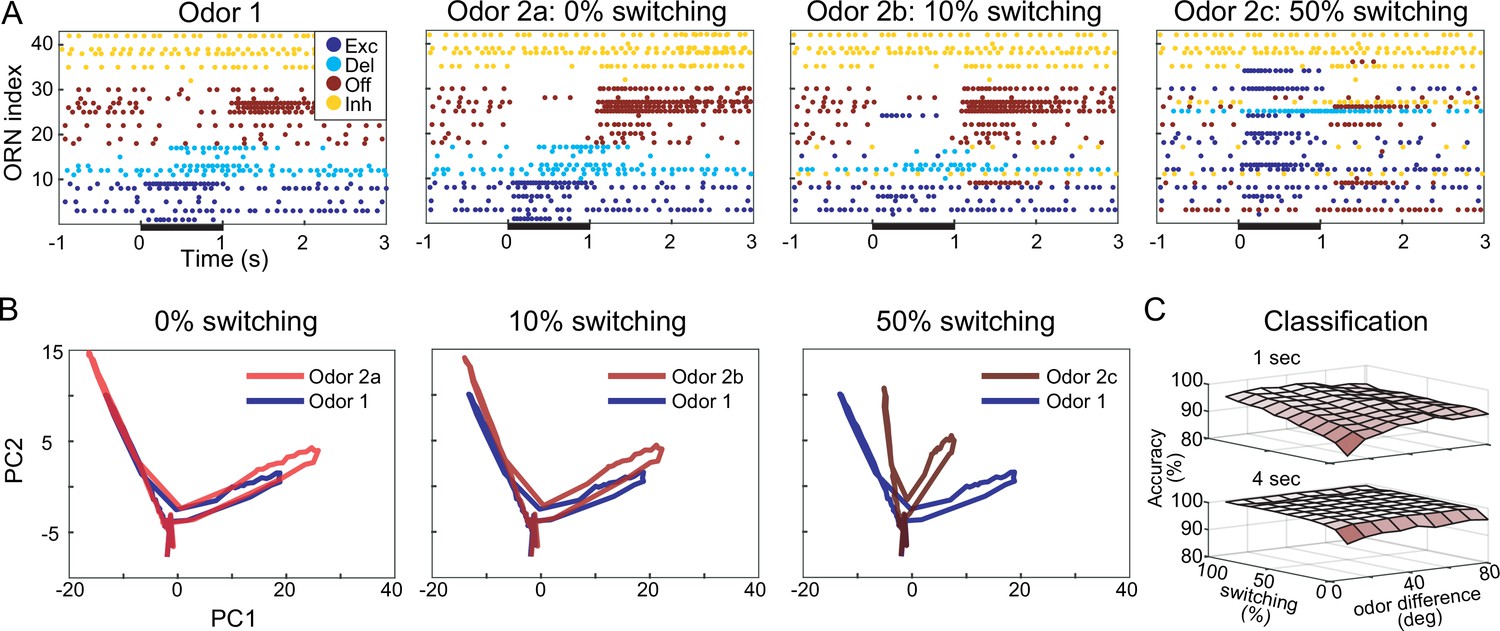
Computational model shows response motif switching substantially improves odor classification.
(A) Simulated olfactory receptor neuron (ORN) spiking illustrates different motif switching probabilities. Odors 1 and 2 are similar (see ‘Materials and methods’). Each ORN response is sorted by motifs elicited by odor 1. Raster plots show the responses to odor 2 become increasingly different from responses to odor 1 as motif switching probability increases. (B) ORN odor-elicited response trajectories in reduced principal component analysis (PCA) space show motif switching increases the separation between responses to similar Odors 1 and 2; response to odor 1 (blue) is the same in each panel; response to odor 2 (red) changes with switching probability. (C) Odor classification success as a function of odor similarity and motif switching probability for 1 s (top) and 4 s (bottom) stimulus pulses; even low switching probabilities improve classification performance; darker shading indicates lower classification accuracy. Odor similarity is quantified by angles (degrees) between odor vectors (see ‘Materials and methods’).
Figure 6 with 1 supplement

Responses to realistic odor plume stimulus.
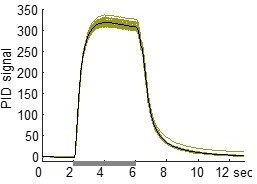
(A) Top: odor plume generated by opening and closing an olfactometer valve, measured by a photoionization detector (PID), and delivered to locust antennae in vivo. Plume represents sampling 2.5 m from odor source. Middle: responses of olfactory receptor neurons (ORNs) recorded in vivo; bottom: responses of model ORNs. (B) Linear–nonlinear prediction of excitatory-type ORN activity in vivo. The first 16 s of 40 s odor plumes were used for training and the next 16 s were used for testing. To assess the agreement, the test stimulus (left) was convolved with the learned filter and the result was passed to the learned threshold function (middle) to generate the predicted firing rate (right). Shading denotes a 95% confidence interval of prediction (see ‘Materials and methods’). Stimulus correlations in naturalistic stimuli were accounted for (see ‘Materials and methods’). (C) Averages of learned filters across all ORNs within a response motif in vivo (top) and in the model (bottom). Delay indicates time since the stimulus arrived at the antenna. (D) Principal component analysis of filters in the delay dimension. Filters of the same response motif cluster together. Top: filters colored by motif type. Bottom: two principal components in the analysis.
Figure 6—figure supplement 1
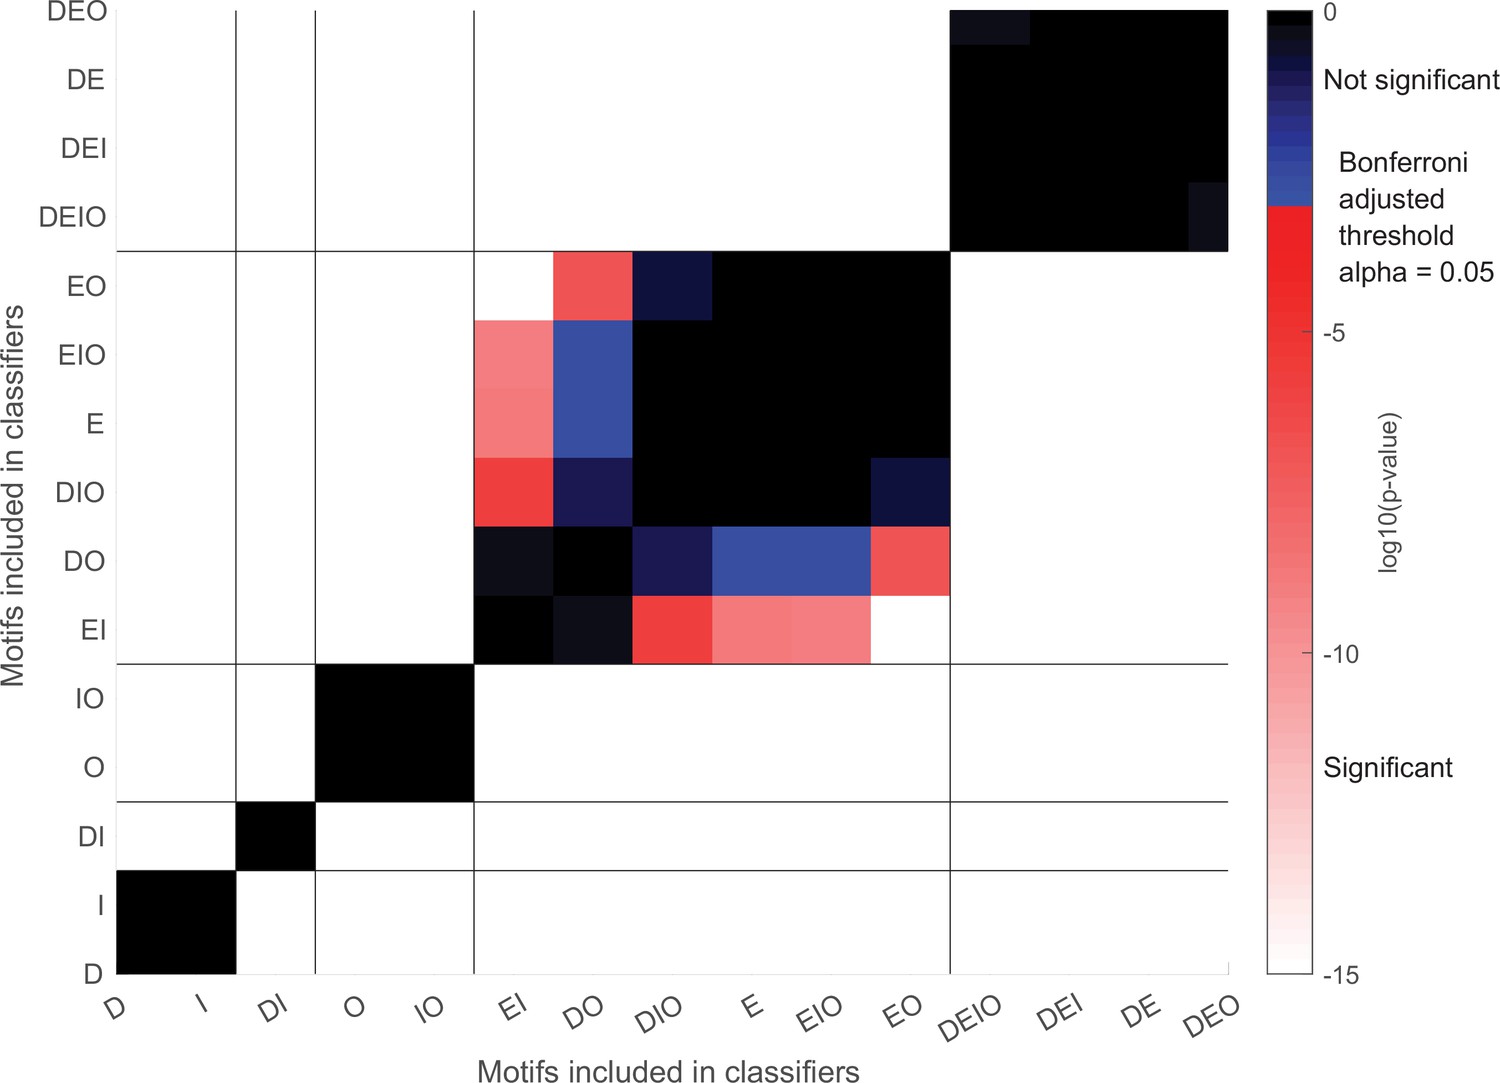
Statistical validation for distance-based classification with different motifs as shown in Figure 6C.
Color plot of log10(p-values). Vertical and horizontal lines separate the same sets of motif groups as in Figure 6C. One-way ANOVA was performed, F(14,374) = 1830.2, p=0. p-Values from Bonferroni post-hoc tests are plotted. Red/white colors denote significant differences, and blue/black colors denote insignificant differences.
Figure 7
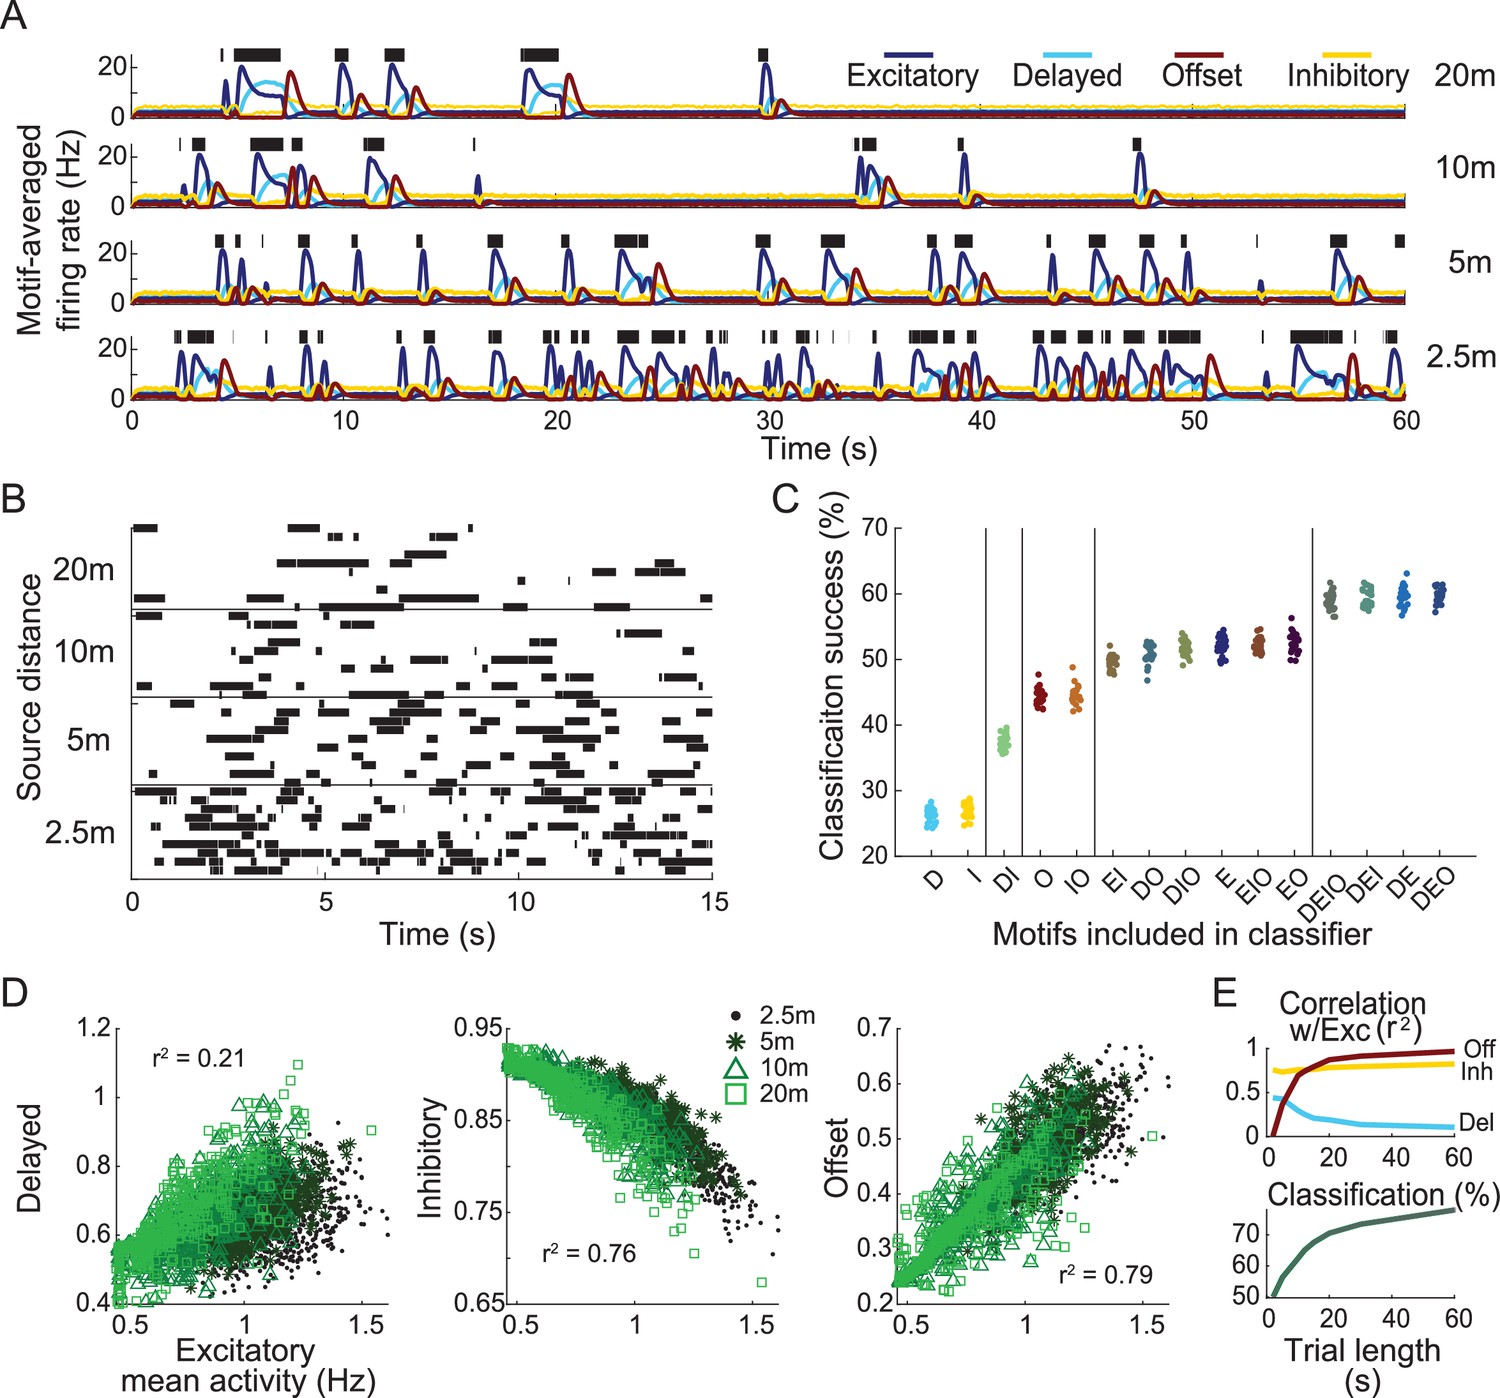
Response motifs encode information needed to determine distance to odor plume source.
(A) Model olfactory receptor neuron (ORN) responses, averaged by motif, to four distance-dependent plumes (see ‘Materials and methods’). Green bars: simulated olfactometer valve open times. (B) Depiction of stimulus classification task. Ten realizations of plume stimuli (trials) are shown for each distance. Plumes are colored by distance to source. The goal of the classification task is to correctly identify all plume stimuli of the same distance as belonging to the same group. (C) The success of distance-dependent plume classification. Each group of points represents 25 differently trained classifiers only including a subset of indicated response motifs. Vertical bars separate groups into statistically distinct sets, where any group within a set is statistically different from all groups outside this set (one-way ANOVA F(14,374) = 1830.2, p=0; see Figure 3—figure supplement 1). The x-axis labels denote which motifs are included in each analysis group: D, delayed; E, excitatory; I, inhibitory; O, offset. (D) Scatter plots show firing activity averaged over the entire 15 s window by motif. (E) Correlation between each motif and the excitatory motif calculated using different sample durations (top). Classification success for different sample durations using responses from all motifs (bottom).
Author response image 1
Tables
Table 1
Results of ANOVA tests for sensory adaptation experiments shown in Figure 3B and Figure 3—figure supplement 1.
| Excitatory motif | Delayed motif | |||||||
|---|---|---|---|---|---|---|---|---|
| IPIs (s) | Df | F-value | p-value | IPIs (s) | Df | F-value | p-value | |
| 0.50 | 1, 9 | 3.11 | 0.002 | 0.50 | 1, 9 | 1.98 | 0.052 | |
| 0.75 | 1, 9 | 0.51 | 0.865 | 0.75 | 1, 9 | 0.88 | 0.549 | |
| 1.00 | 1, 9 | 0.80 | 0.614 | 1.00 | 1, 9 | 0.38 | 0.938 | |
| 1.25 | 1, 9 | 0.84 | 0.576 | 1.25 | 1, 9 | 0.73 | 0.675 | |
| 1.75 | 1, 9 | 0.38 | 0.941 | 1.75 | 1, 9 | 0.32 | 0.966 | |
| 5.00 | 1, 9 | 0.67 | 0.734 | 5.00 | 1, 9 | 1.41 | 0.210 | |
| Offset motif | Inhibitory motif | |||||||
| IPIs (s) | Df | F-value | p-value | IPIs (s) | Df | F-value | p-value | |
| 0.50 | 1, 9 | 33.06 | 1.484E-37 | 0.50 | 1, 9 | 0.78 | 0.634 | |
| 0.75 | 1, 9 | 6.59 | 4.663E-08 | 0.75 | 1, 9 | 1.05 | 0.406 | |
| 1.00 | 1, 9 | 4.29 | 4.650E-05 | 1.00 | 1, 9 | 1.46 | 0.162 | |
| 1.25 | 1, 9 | 2.94 | 0.003 | 1.25 | 1, 9 | 1.21 | 0.293 | |
| 1.75 | 1, 9 | 1.32 | 0.229 | 1.75 | 1, 9 | 0.66 | 0.747 | |
| 5.00 | 1, 9 | 1.76 | 0.077 | 5.00 | 1, 9 | 1.57 | 0.127 | |
-
IPI: inter-pulse interval.
Additional files
Download links
A two-part list of links to download the article, or parts of the article, in various formats.
Downloads (link to download the article as PDF)
Open citations (links to open the citations from this article in various online reference manager services)
Cite this article (links to download the citations from this article in formats compatible with various reference manager tools)
Olfactory receptor neurons generate multiple response motifs, increasing coding space dimensionality
eLife 12:e79152.
https://doi.org/10.7554/eLife.79152


