Murine blastocysts generated by in vitro fertilization show increased Warburg metabolism and altered lactate production
- Center for Reproductive Sciences, Department of Obstetrics and Gynecology, University of California, San Francisco, United States
- Division of Cardiovascular Medicine, Department of Medicine, Stanford University, United States
Figures
Figure 1 with 1 supplement
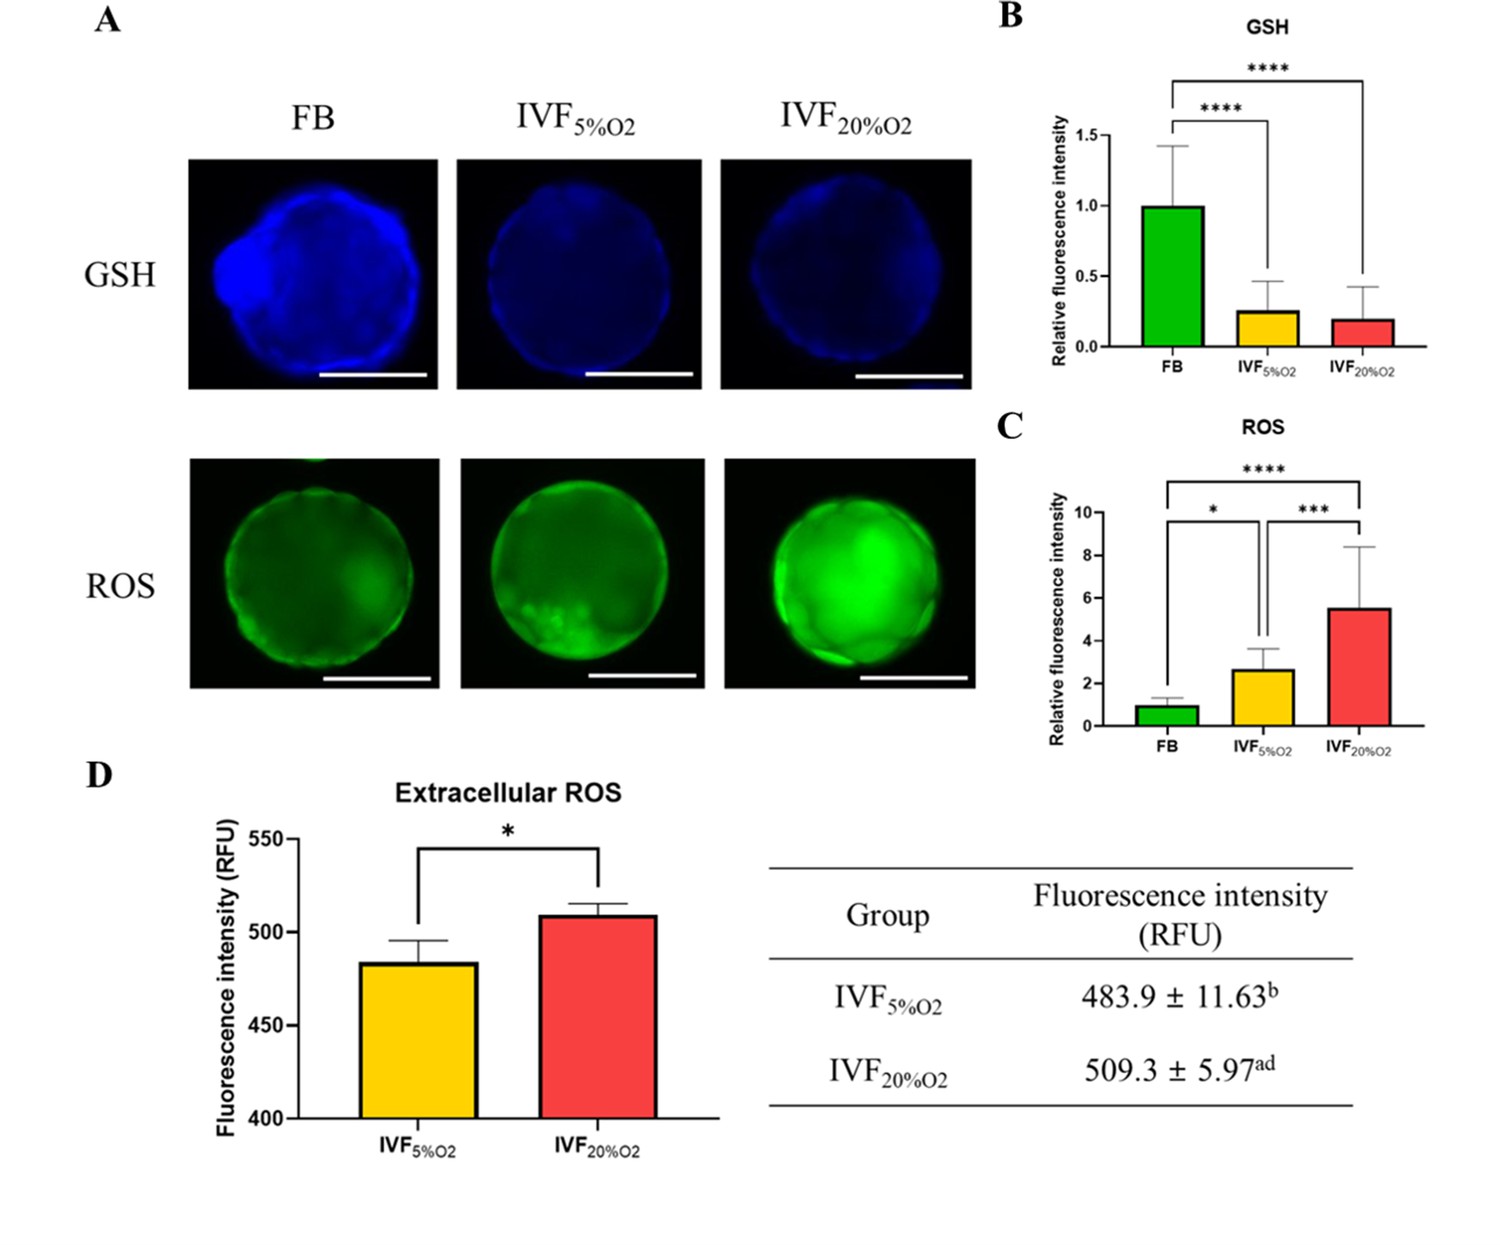
The levels of glutathione (GSH) and reactive oxygen species (ROS).
(A) Analysis of glutathione (GSH) and reactive oxygen species (ROS) in blastocysts. (B) GSH levels are lower in in vitro fertilization-generated blastocysts, while ROS levels are higher both (C) intracellularly and (D) extracellularly. Since flushed blastocyst (FB) were not cultured, the ROS value for the FB group is missing. Data are shown as means ± SD and at least three independent replicates were performed. Error bar indicates standard deviation. One asterisk (*) if p<0.05. Three and four asterisks (*** and ****) if p<0.001 and<0.0001, respectively. Bar = 50 µm.
-
Figure 1—source data 1
The ROS and GSH level in embryos (Figure 1A–C).
- https://cdn.elifesciences.org/articles/79153/elife-79153-fig1-data1-v2.xlsx
-
Figure 1—source data 2
The extracellular ROS level in embryo culture medium (Figure 1D).
- https://cdn.elifesciences.org/articles/79153/elife-79153-fig1-data2-v2.xlsx
Figure 1—figure supplement 1
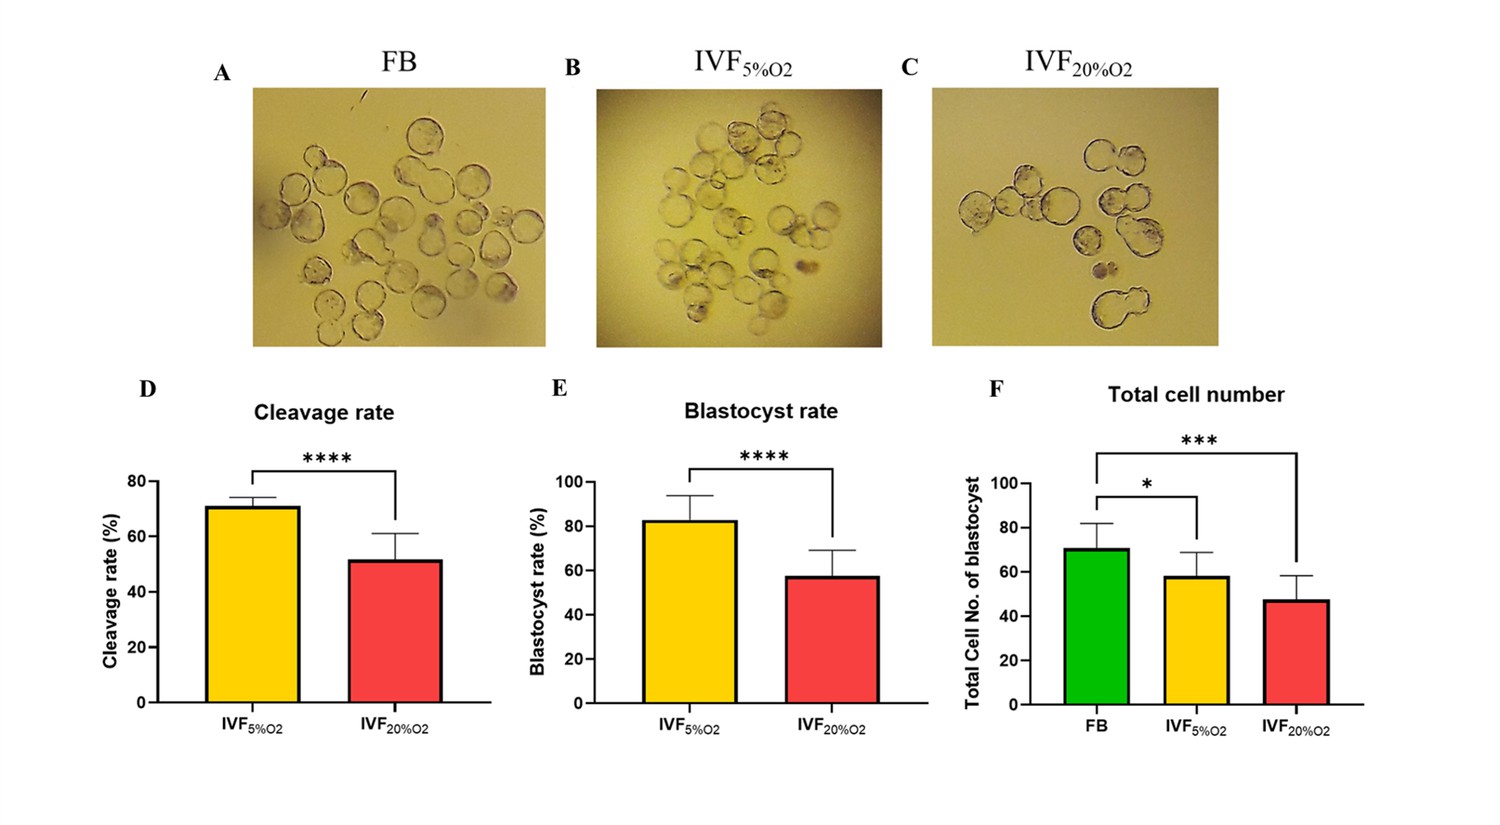
Morphology of blastocyst generated after natural mating (in vivo or flushed blastocyst-group, (A) or by in vitro fertilization (IVF) using physiologic oxygen (B) IVF5%O2 group, or IVF20%O2 (C) IVF 20%O2 group).
In addition, (D) embryos generated by IVF and cultured in physiologic oxygen (5%O2), showed higher 2 cell rate (71.0 ± 3.1%, p<0.0001) and (E) blastocyst rate (82.8 ± 10.9%, p<0.0001) compared to embryos cultured under 20%O2 (51.8 ± 9.3%, p<0.0001 and 57.5 ± 11.6%, p<0.0001, respectively). (F) IVF generated blastocysts had lower total cell number (IVF 5%O2: 58.1 ± 10.8; IVF20%O2 47.5 ± 10.9), compared to in vivo generated blastocysts (70.6 ± 11.3, p<0.05). Data are shown as means ± SD. A total of 11 independent replicates were performed. Error bar indicates standard deviation. One asterisk (*) indicates p-value smaller than 0.05. Three and four asterisks (*** and ****) indicate p-value smaller than 0.001 and 0.0001, respectively.
-
Figure 1—figure supplement 1—source data 1
The cleavage and blastocyst rate in embryos (Figure 1D-E).
- https://cdn.elifesciences.org/articles/79153/elife-79153-fig1-figsupp1-data1-v2.xlsx
-
Figure 1—figure supplement 1—source data 2
The total cell number of blastocysts (Figure 1F).
- https://cdn.elifesciences.org/articles/79153/elife-79153-fig1-figsupp1-data2-v2.xlsx
Figure 2
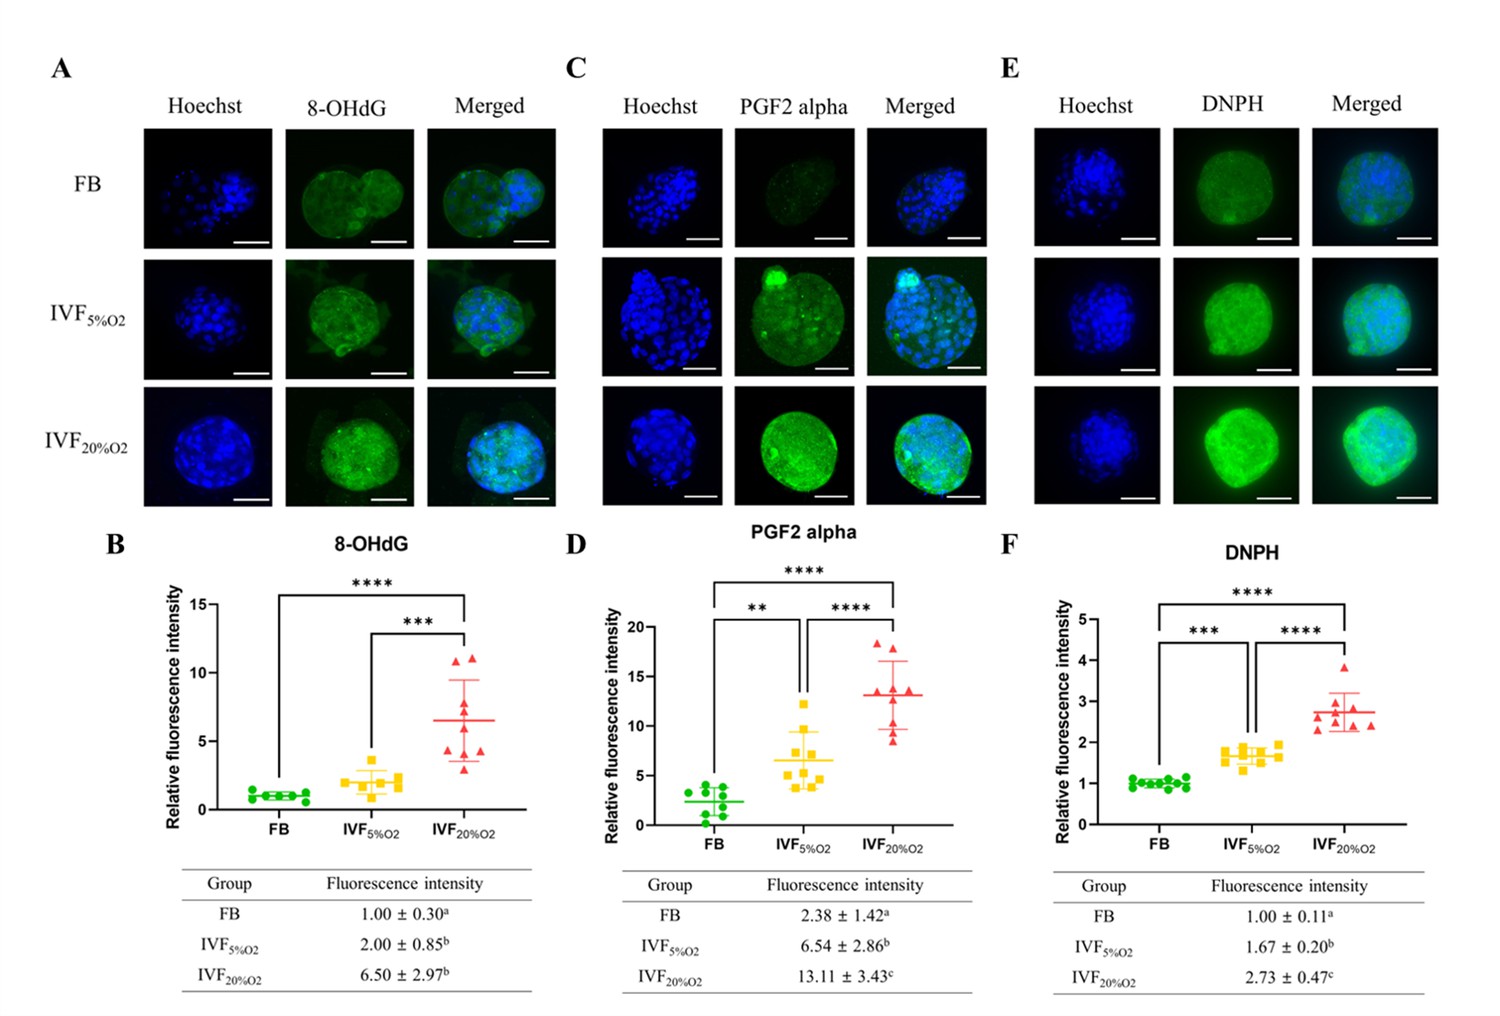
Immunocytochemical analysis of oxidative-related markers in blastocysts.
(A and B) In vitro fertilization (IVF) generated blastocysts show increase in 8-OHdG staining (DNA damage marker, green), (C and D) PGF2-alpha (lipid damage marker, green) and (E and F) 2,4-dinitrophenylhydrazine (DNPH) staining (protein damage marker, green) compared to in vivo control embryos. Data are shown as means ± SD and at least three independent replicates were performed. Error bar indicates standard deviation. * if p<0.05; ** if p<0.01, *** if p<0.001 and **** if p<0.0001. Bar = 50 µm.
-
Figure 2—source data 1
The level of oxidative damage (DNA, lipids, and proteins) in embryos (Figure 2A–F).
- https://cdn.elifesciences.org/articles/79153/elife-79153-fig2-data1-v2.xlsx
Figure 3

Metabolic analysis of mitochondrial and glycolytic function using Agilent Seahorse XF HS Mini.
(A) Mitochondrial respiration was analyzed at baseline or after injection of oligomycin (Adenosine triphosphate [ATP] synthase inhibitor), carbonyl cyanide-p-trifluoromethoxyphenylhydrazone (FCCP, an uncoupler of oxidative phosphorylation), and rotenone/antimycin A (Complex I/III inhibitors). (B) In vitro fertilization (IVF)-generated blastocysts show reduced basal oxygen consumption rate (flushed blastocyst [FB]: 2.3 ± 0.2 pmol/min/blastocyst, IVF5%O2: 2.0 ± 0.2 pmol/min/blastocyst, IVF20%O2: 1.5 ± 0.2 pmol/min/blastocyst), (C) ATP production (FB: 1.6 ± 0.1 pmol/min/blastocyst, IVF5%O2: 1.2 ± 0.1 pmol/min/blastocyst, IVF20%O2: 0.9 ± 0.3 pmol/min/blastocyst) and (D) maximal respiration (FB: 4.0 ± 0.2 pmol/min/blastocyst, IVF5%O2: 2.9 ± 0.2 pmol/min/blastocyst, IVF20%O2: 2.5 ± 0.2 pmol/min/blastocyst) compared to in vivo-generated embryos. (E) Glycolysis was studied at baseline or after injection of rotenone/antimycin and 2-deoxy-D-glucose (2-DG, glycolysis inhibitor). (F) IVF generated embryos showed increase in basal glycolysis (FB: 1.3 ± 0.0 pmol/min/blastocyst, IVF5%O2: 1.5 ± 0.1 pmol/min/blastocyst, IVF20%O2: 1.7 ± 0.1 pmol/min/blastocyst), (G) basal proton efflux rate (FB: 2.7 ± 0.0 pmol/min/blastocyst, IVF5%O2: 3.2 ± 0.2 pmol/min/blastocyst, IVF20%O2: 3.7 ± 0.0 pmol/min/blastocyst) and (H) compensatory glycolysis rate (FB: 0.8 ± 0.0 pmol/min/blastocyst, IVF5%O2: 0.9 ± 0.1 pmol/min/blastocyst, IVF20%O2: 1.1 ± 0.1 pmol/min/blastocyst) compared to in vivo generated embryos. Overall, IVF embryos utilize more glycolysis and less oxidative phosphorylation to generate energy. (I) Bar chart of blastocysts ranked by oxygen consumption rate (OCR) to extracellular acidification rate (ECAR) ratio along the X-axis. (J) Energy maps of blastocysts. Data are shown as means ± SD and at least three independent replicates were performed. Error bar indicates standard deviation. Different superscript indicates statistically significant differences. * if p<0.05; ** if p<0.01, *** if p<0.001 and **** if p<0.0001.
-
Figure 3—source data 1
The mitochondrial activity in embryos (Figure 3A).
- https://cdn.elifesciences.org/articles/79153/elife-79153-fig3-data1-v2.xlsx
-
Figure 3—source data 2
The mitochondrial activity in embryos (Figure 3B–D).
- https://cdn.elifesciences.org/articles/79153/elife-79153-fig3-data2-v2.xlsx
-
Figure 3—source data 3
The glycolytic function in embryos (Figure 3E–H).
- https://cdn.elifesciences.org/articles/79153/elife-79153-fig3-data3-v2.xlsx
-
Figure 3—source data 4
The ratio of oxygen consumption rate and extracellular acidification rate in embryos (Figure 3I–J).
- https://cdn.elifesciences.org/articles/79153/elife-79153-fig3-data4-v2.xlsx
Figure 4 with 1 supplement
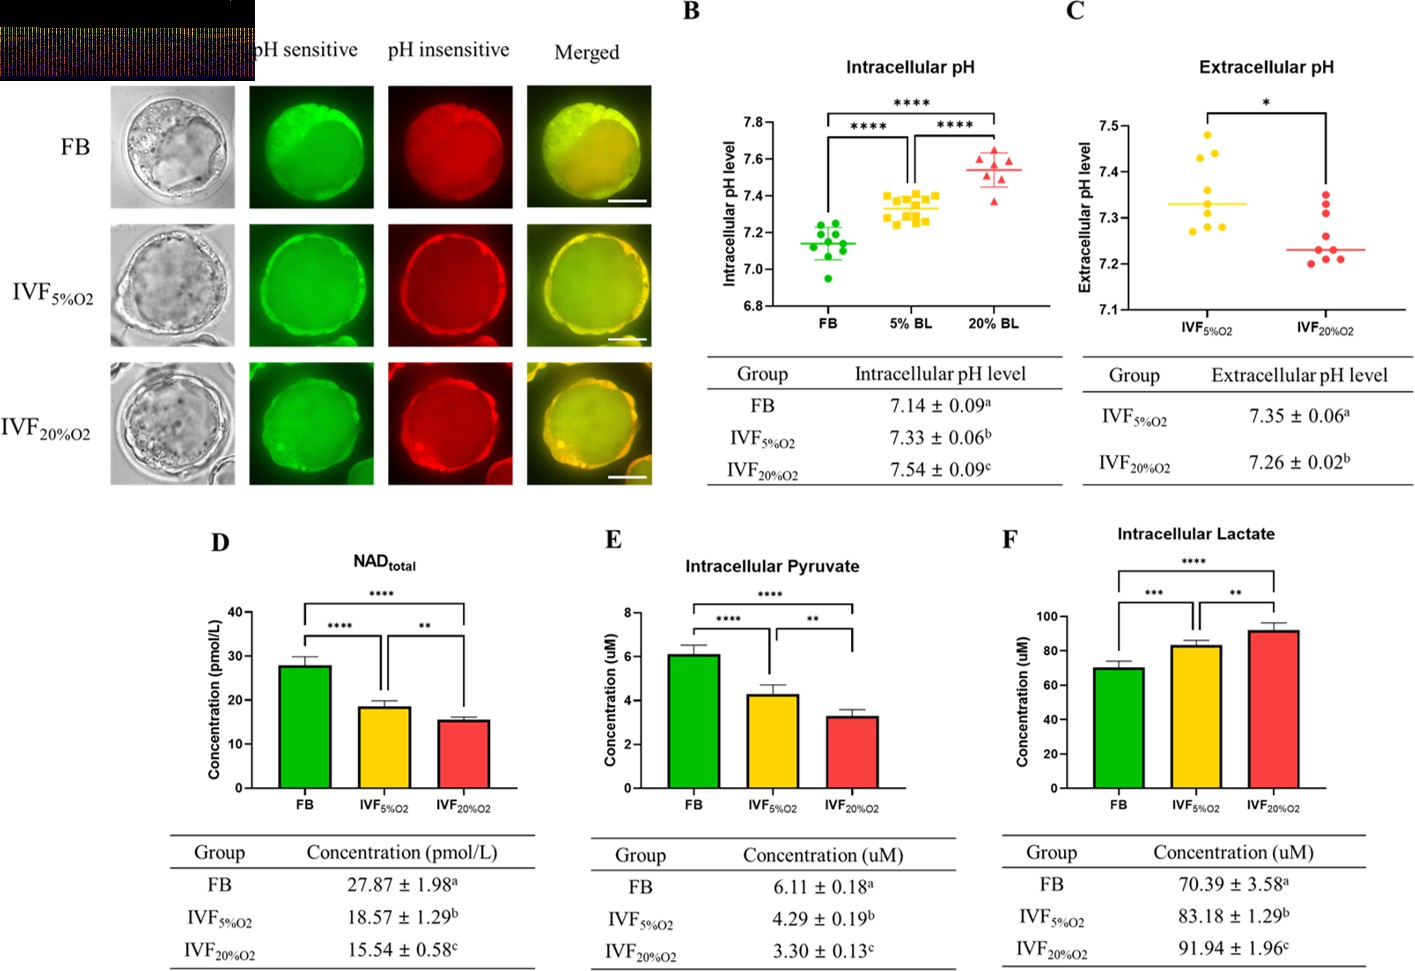
IVF-generated embryos show several metabolic alterations.
(A) Confocal microscopy images of blastocysts using phase contrast or confocal microscopy. Two fluorescence emission wavelengths were used, 640 nm (pH sensitive, green) and 600 nm (pH insensitive, yellow) with an excitation wavelength of 535 nm. (B) In vitro fertilization (IVF)-generated embryos show higher intracellular pH and (C) lower extracellular pH in culture medium. Of note extracellular pH levels of in vivo-generated embryos are missing since in vivo embryos are not cultured. (D) IVF-generated embryos also showed reduction in nicotinamide adenine dinucleotide (NAD) levels and (E) intracellular pyruvate levels, but higher intracellular lactate (F). Values are mean ± SD. Data are shown as the means ± SD and at least three independent replicates were performed except pyruvate and lactate assay. For pyruvate and lactate assay, total 300 blastocysts were used for one biological replication and seven technical replications. Error bar indicates standard deviation. * if p<0.05; ** if p<0.01, *** if p<0.001 and **** if p<0.0001. Bar = 50 µm.
-
Figure 4—source data 1
Intracellular pH level in embryos (Figure 4A–B).
- https://cdn.elifesciences.org/articles/79153/elife-79153-fig4-data1-v2.xlsx
-
Figure 4—source data 2
The NAD level in embryos (Figure 4D).
- https://cdn.elifesciences.org/articles/79153/elife-79153-fig4-data2-v2.xlsx
-
Figure 4—source data 3
The intracellular pyruvate level in embryos (Figure 4E).
- https://cdn.elifesciences.org/articles/79153/elife-79153-fig4-data3-v2.xlsx
-
Figure 4—source data 4
The intracellular lactate level in embryos (Figure 4F).
- https://cdn.elifesciences.org/articles/79153/elife-79153-fig4-data4-v2.xlsx
Figure 4—figure supplement 1
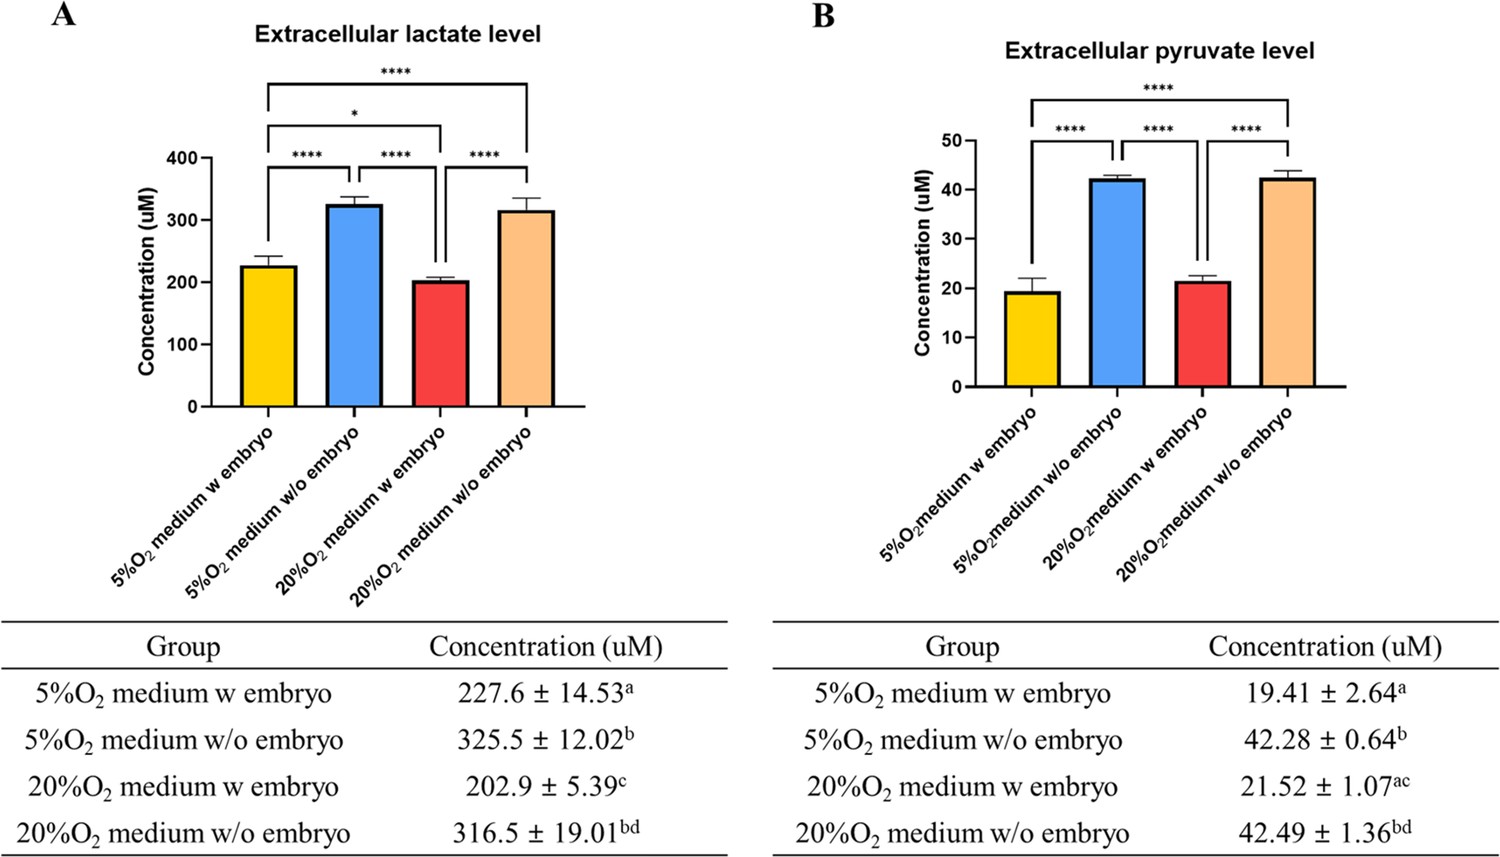
Lactate (A) and pyruvate (B) levels are lower in media where in vitro fertilization (IVF)-generated embryos are cultured compared to media maintained in incubator without embryos.
Seven biological replications were performed for each experiment. Error bar indicates standard deviation. * if p<0.05; ** if p<0.01, *** if p<0.001 and **** if p<0.0001.
-
Figure 4—figure supplement 1—source data 1
The extracellular lactate and pyruvate level in embryo culture medium (Figure 4—figure supplement 1A-B).
- https://cdn.elifesciences.org/articles/79153/elife-79153-fig4-figsupp1-data1-v2.xlsx
Figure 5
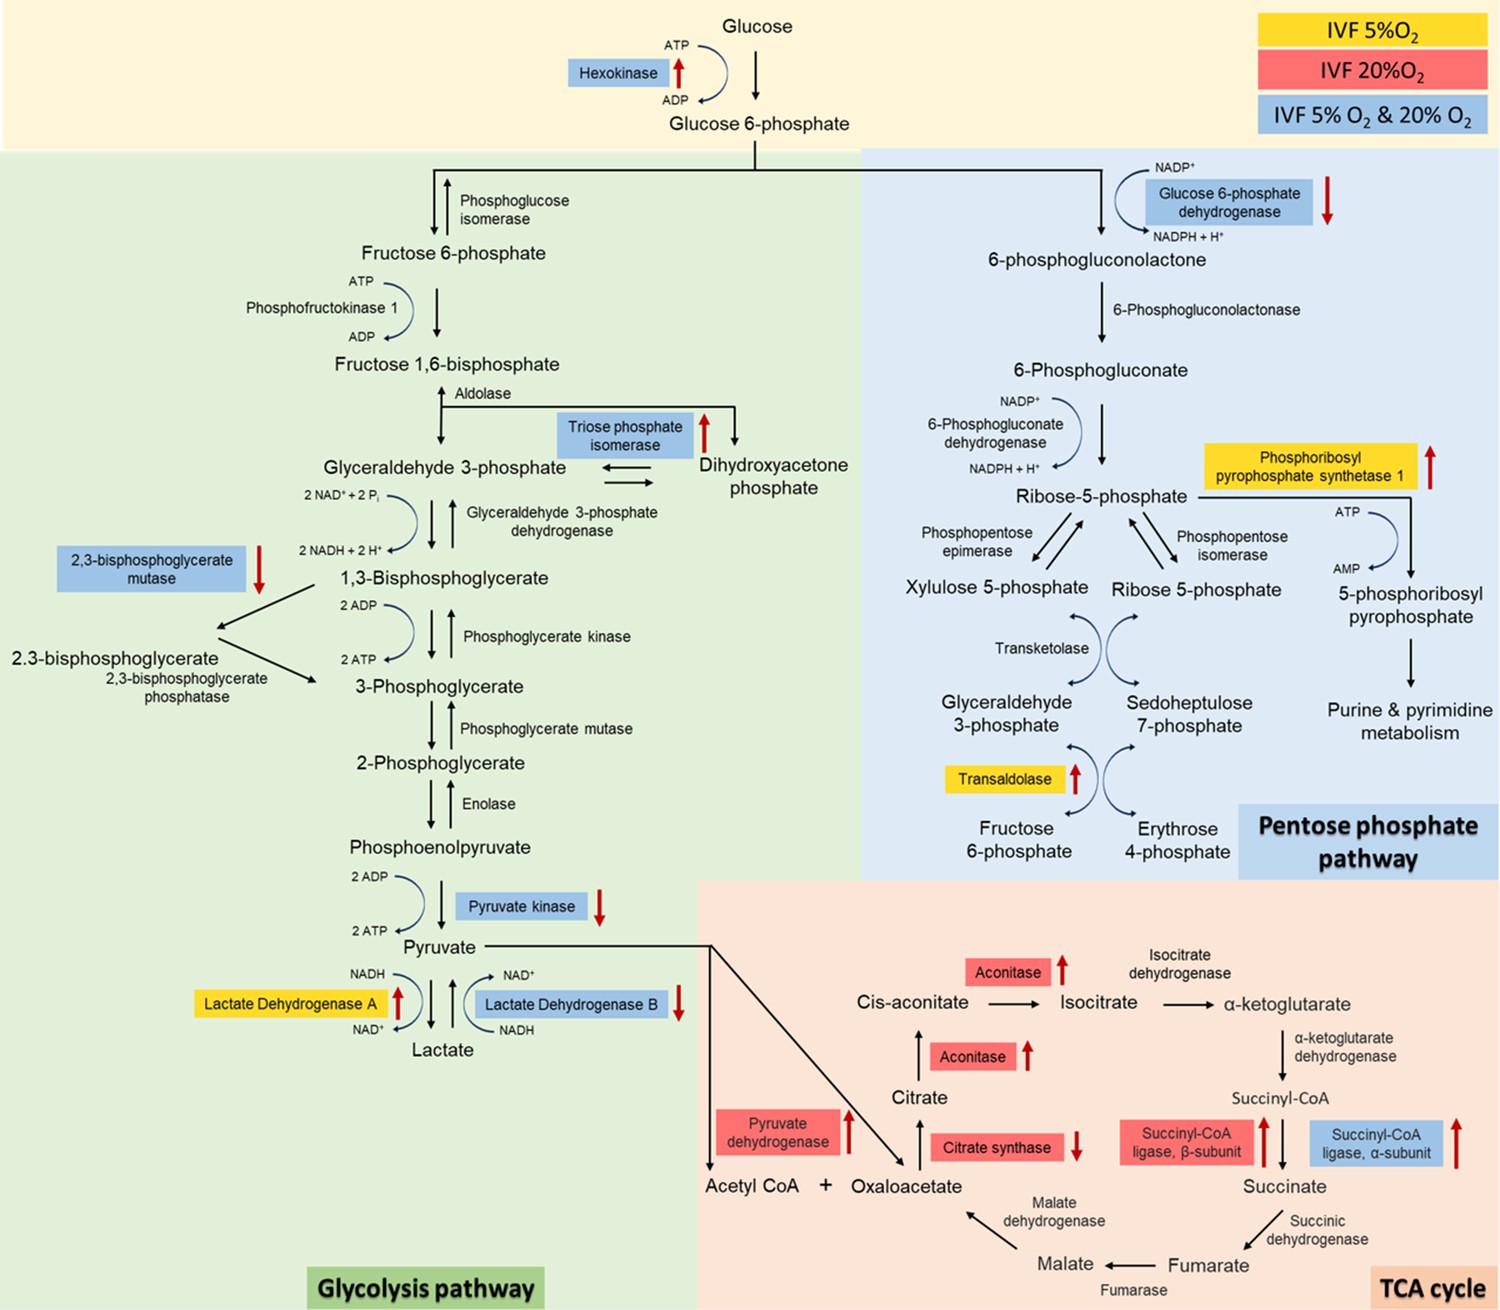
Analysis of glycolysis, pentose phosphate pathway (PPP) and tricarboxylic acid (TCA) cycle proteins dysregulated in in vitro fertilization (IVF)-generated blastocysts vs control.
Overall, 3965 proteins were identified and 1029 were differentially expressed between the groups. IVF5%O2-generated blastocysts had 334 proteins upregulated relative to the control (flushed blastocyst), while 499 proteins were upregulated on IVF20%O2 embryos, with 85% overlap. Six glycolytic proteins had different levels in IVF embryos compared to control. Hexokinase 2 (HK) and triosephosphate isomerase 1 (TPI) were upregulated, while 2,3-bisphosphoglycerate mutase (BPGM), pyruvate kinase (PK), and lactate dehydrogenase B (LDHB) were downregulated in both IVF groups compared to in vivo generated blastocysts. In addition, lactate dehydrogenase A (LDHA) isoenzyme was upregulated only in IVF5%O2 blastocysts compared to control. Three proteins involved in the pentose phosphate pathway were different between IVF embryos and control embryos. Glucose 6-phopshate dehydrogenase (G6PD) was decreased in both IVF groups, while phosphoribosyl pyrophosphate synthetase 1 (PRPS1) and transaldolase 1 (TALDO1) were higher in IVF5%O2-generated blastocysts compared to control. Four proteins associated with TCA cycle were significantly dysregulated in IVF-generated embryos. Succinyl-CoA ligase α (SUCLG1) was significantly upregulated in both IVF group compared to in vivo embryos. The remaining proteins were dysregulated only in IVF20%O2–generated embryos compared to control: pyruvate dehydrogenase (PDHA1), aconitase (ACO2), and succinyl-CoA ligase β (SUCLG2) were upregulated, while citrate synthase (CS) was downregulated. Proteins are highlighted in blue color, if they were statistically different (p<0.05) in both IVF groups compared to control; yellow color indicates changes of only IVF5%O2-generated blastocysts vs in vivo embryo; red color indicates changes of only IVF20%O2-generated blastocysts vs in vivo embryo; black arrows represent the directionality of the interaction (increased or decreased).
-
Figure 5—source data 1
The proteomic analysis data (Figure 5).
- https://cdn.elifesciences.org/articles/79153/elife-79153-fig5-data1-v2.xlsx
Figure 6
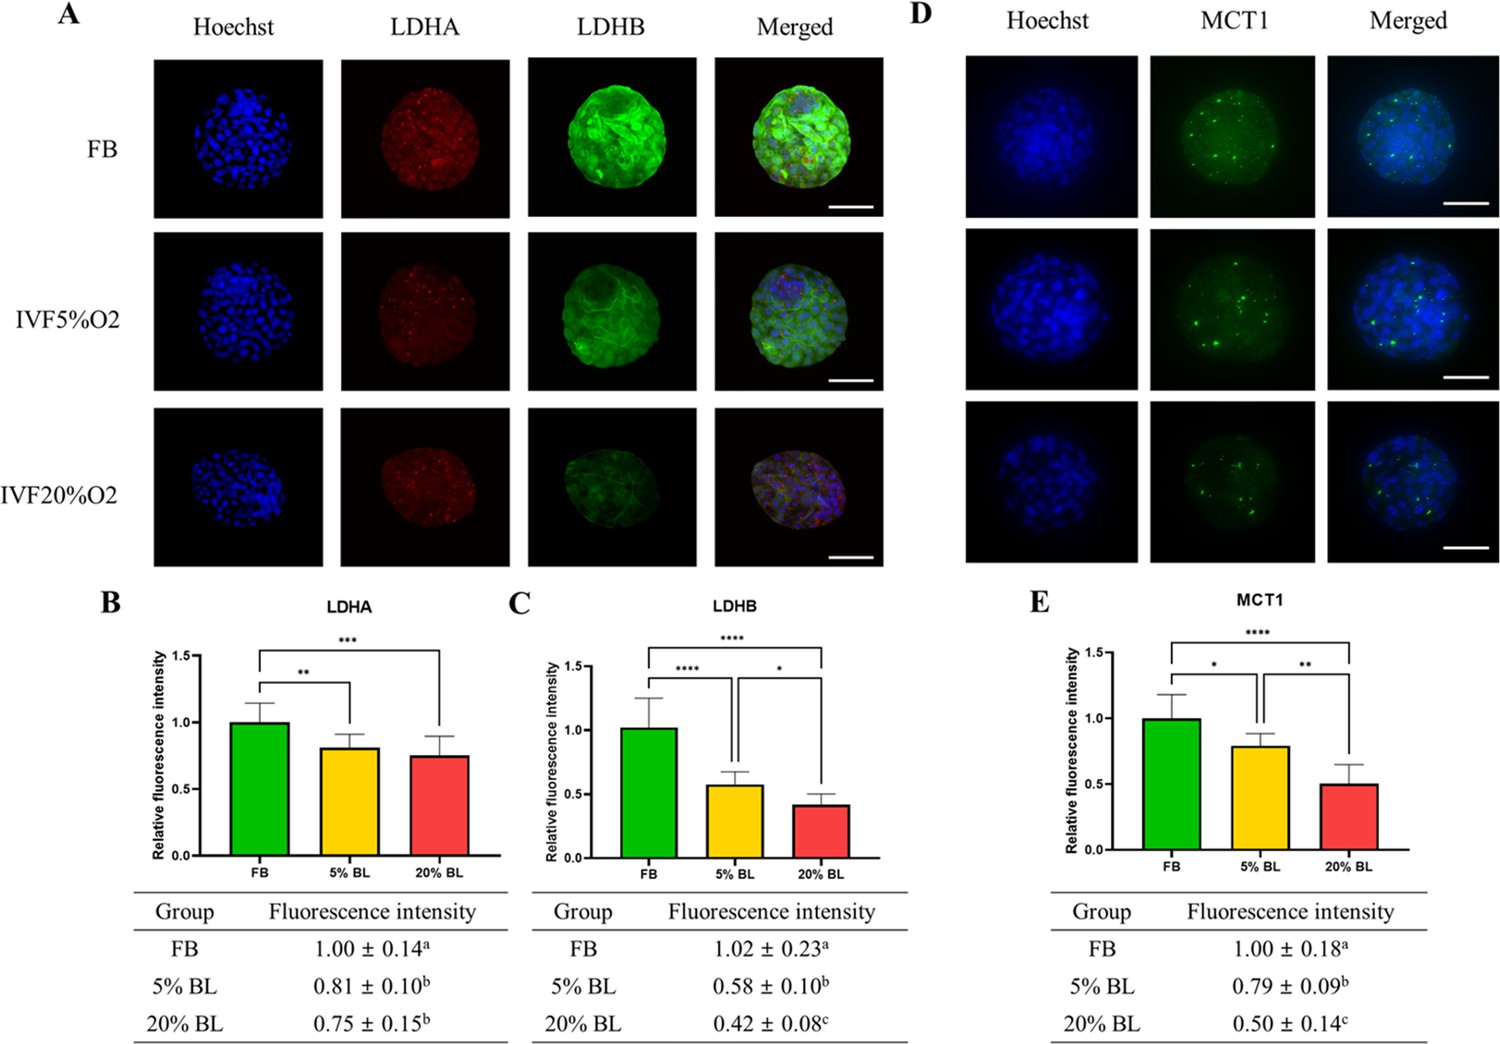
IVF-generated embryos show downregulation of enzymes involved in lactate metabolism.
(A) Expression levels of lactate dehydrogenase (LDH)-A and LDH-B (red color: LDHA, green color: LDHB) and (B and C) their quantification. (D and E) MCT1 enzyme is downregulated in in vitro fertilization (IVF) embryos compared to control. The expression level of LDHB and MCT1 was decreased in IVF20%O2 compared with IVF5%O2 blastocysts. Data are presented as means ± SD and at least three independent replicates were performed. Error bar indicates standard deviation. * if p<0.05; ** if p<0.01, *** if p<0.001 and **** if p<0.0001. Bar = 50 µm.
-
Figure 6—source data 1
The fluorescence intensity of LDHB, LDHA, and MCT1 in embryos (Figure 6A–E).
- https://cdn.elifesciences.org/articles/79153/elife-79153-fig6-data1-v2.xlsx
Figure 7 with 1 supplement
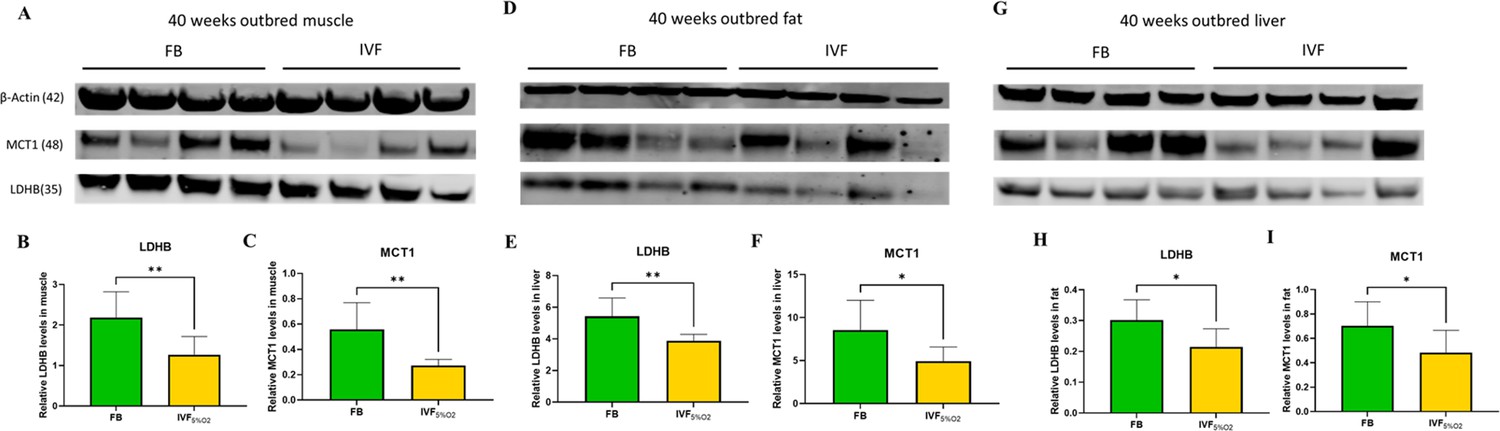
Western blot analysis of protein levels of lactate dehydrogenase (LDH)-B and MCT1 enzymes in selected insulin sensitive tissues of 40-week-old mice conceived in vivo (FB n=8, 50% females) or by IVF5%O2 (n=8, 50% females).
In vitro fertilization (IVF)-conceived mice show reduced levels of LDHB and monocarboxylate transporter 1 (MCT1) in gastrocnemius muscle (A–C) gonadal adipose tissue (D–F) and liver (G–I). Selected blots are shown. Data are presented as means ± SD and at least three independent replicates were performed. Error bar indicates standard deviation. * if p<0.05; ** if p<0.01. FB: flushed blastocyst.
-
Figure 7—source data 1
Eight biological replicates for FB and IVF were compared.
The value of each biological replicate was the average of 4 technical replicates. (i) Muscle, Western blot images (ppt), source data (xls). (ii) Fat, Western blot images (ppt), source data (xls). (iii) Liver, Western blot images (ppt), source data (xls).
- https://cdn.elifesciences.org/articles/79153/elife-79153-fig7-data1-v2.zip
Figure 7—figure supplement 1
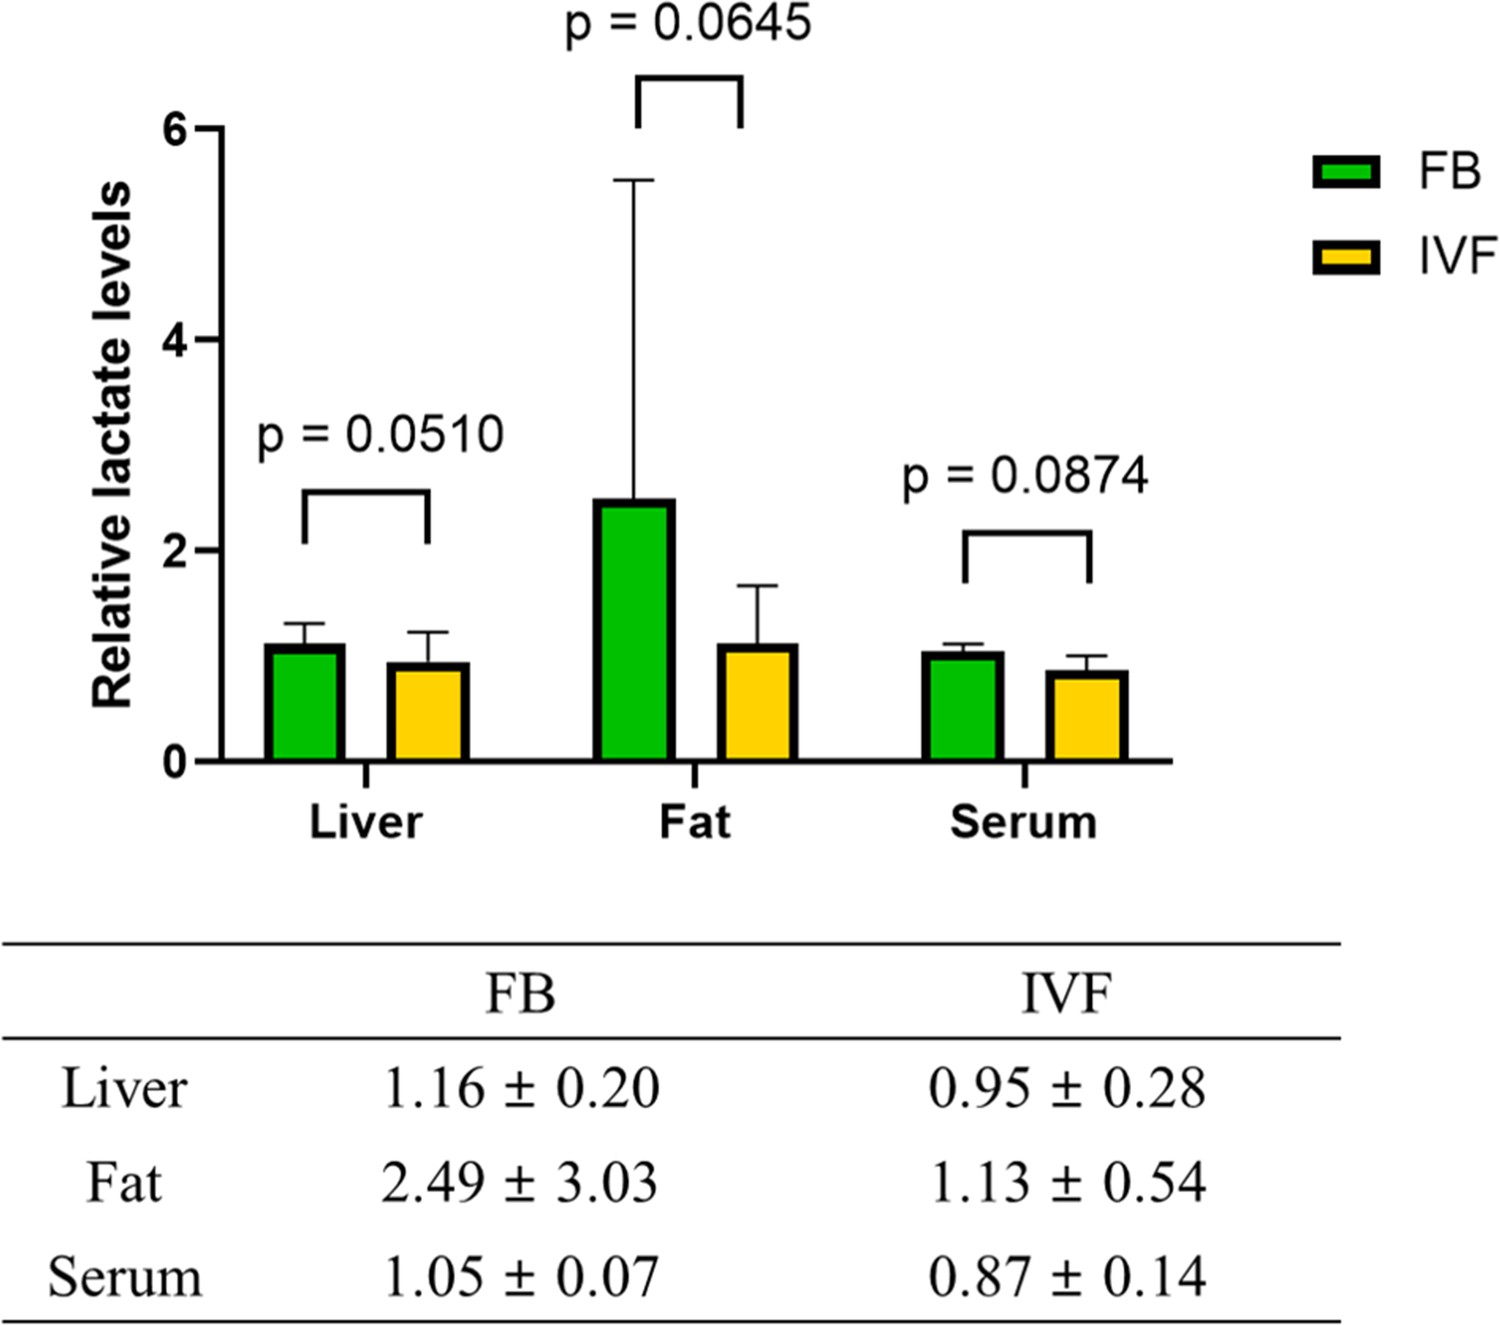
Unsupervised metabolomic analysis by LC/MS was performed in liver, gonadal adipose tissue, and serum of in vivo conceived mice or mice conceived by in vitro fertilization (IVF) (5%O2).
Data are from Feuer et al., 2014b and at least three independent replicates were performed. Error bar indicates standard deviation.Relative lactic acid levels trend lower in IVF conceived mice.
-
Figure 7—figure supplement 1—source data 1
The lactate level in liver, fat, and serum in adult mice.
- https://cdn.elifesciences.org/articles/79153/elife-79153-fig7-figsupp1-data1-v2.xlsx
Figure 8
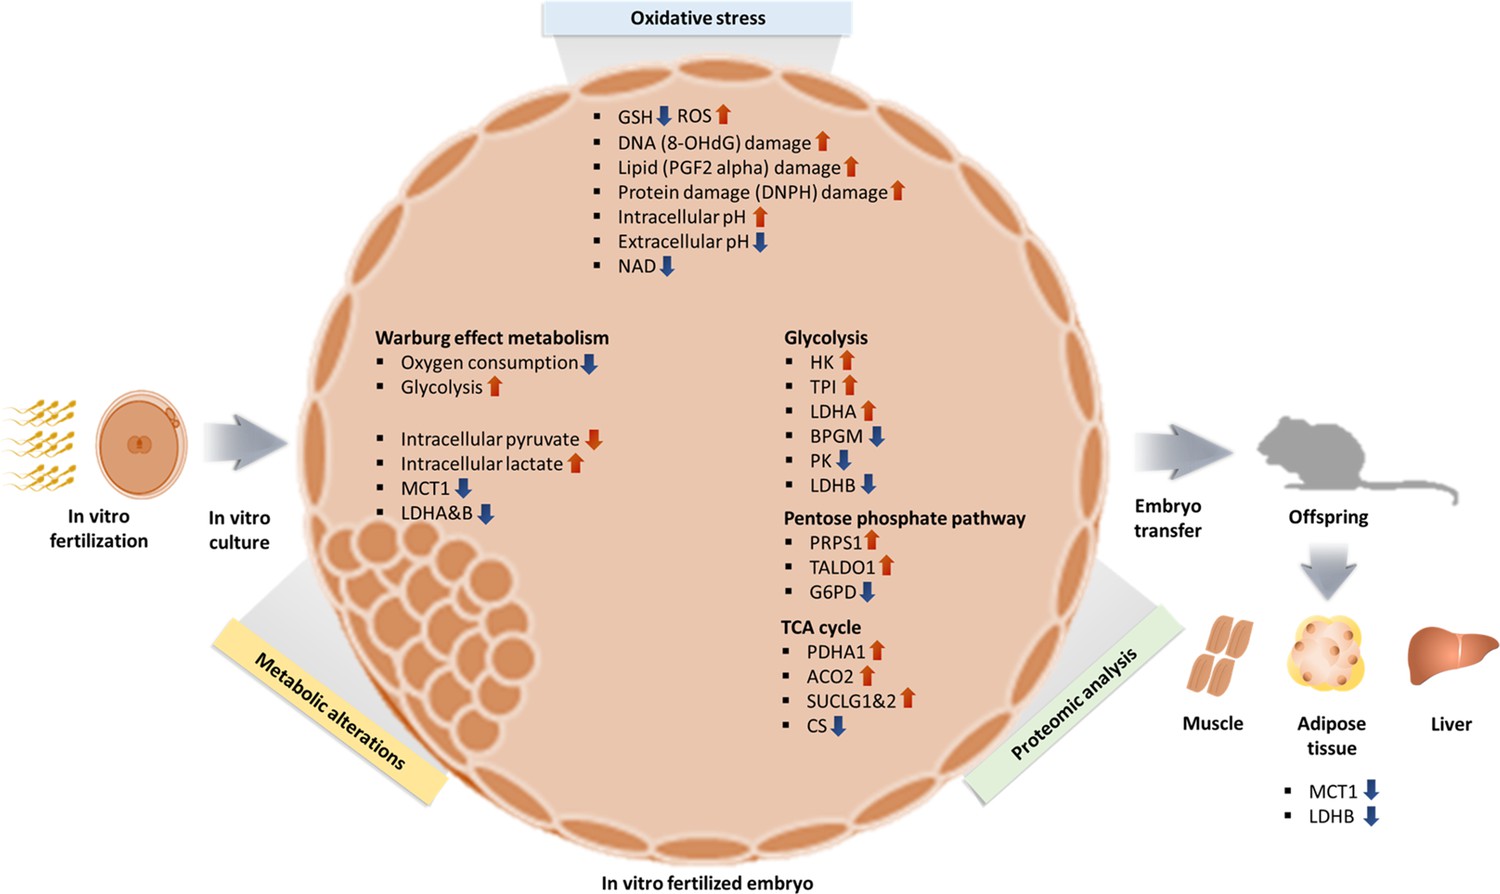
Summary of changes observed in IVF generated blastocysts and offspring.
In vitro fertilization (IVF) generated embryos show increase in ROS and oxidative damage and significant metabolic derangement including decreased NAD levels, increased intracellular pH and contemporaneous decrease in extracellular pH and increased Warburg metabolism. Ultimately, IVF-generated embryos show increased intracellular lactate levels, likely secondary to decreased level of MCT1, LDH-A, and LDH-B enzymes. Of note, adult mice conceived by IVF also show decreased levels of MCT1 and LDH-B.
Tables
Key resources table
| Reagent type (species) or resource | Designation | Source or reference | Identifiers | Additional information |
|---|---|---|---|---|
| Antibody | Anti-8-Hydroxy-2- deoxyguanosine (Mouse monoclonal) | Abcam | Cat#: ab48508 | IF (1:200) |
| Antibody | Anti-8 iso Prostaglandin F2 alpha (Rabbit polyclonal) | Abcam | Cat#: ab2280 | IF (1:200) |
| Antibody | Anti-DNP antibody (Rabbit polyclonal) | Sigma | Cat#: D9656 | IF (1:200) |
| Antibody | Anti-MCT1 antibody (Mouse monoclonal) | Santa Cruz | Cat#: sc365501 | IF (1:200) |
| Antibody | Anti-LDHA antibody (Rabbit monoclonal) | Cell Signaling | Cat#: 3582 | IF (1:200) |
| Antibody | Anti-LDHB antibody (Mouse monoclonal) | Santa Cruz | Cat#: sc100775 | IF (1:200) |
| Antibody | Goat anti-Rabbit (goat polyclonal, Alexa Fluor conjugate) | Abcam | Cat#: ab150077 | IF (1:200) |
| Antibody | Donkey anti-Rabbit (donkey polyclonal, Alexa Fluor conjugate) | Abcam | Cat#: ab150075 | IF (1:200) |
| Antibody | Goat anti-Mouse (goat polyclonal, Alexa Fluor conjugate) | Abcam | Cat#: ab150113 | IF (1:200) |
| Biological sample (mouse) | Blastocyst | This paper | Female | |
| Biological sample (mouse) | Liver | This paper | Male/Female | |
| Biological sample (mouse) | Muscle | This paper | Male/Female | |
| Biological sample (mouse) | Fat | This paper | Male/Female | |
| Commercial assay or kit | Seahorse XF Cell Mito Stress Test kit | Agilent | 103010–100 | |
| Commercial assay or kit | Seahorse XF Glycolysis Stress Test kit | Agilent | 103020–100 | |
| Commercial assay or kit | Pyruvate assay kit | Cayman | Cat#: 700470 | |
| Commercial assay or kit | Lactate assay kit | Cayman | Cat#: 700510 | |
| Commercial assay or kit | NAD Quantitation kit | Sigma | Cat#: MAK037 | |
| Chemical compound, drug | SNARF-1 | Thermo fisher | Cat#: C1272 | |
| Software, algorithm | GraphPad Prism | GraphPad | ||
| Strain, strain background (mouse) | CF-1 | ENVIGO | Hsd:NSA | Oocyte donor |
| Strain, strain background (mouse) | B6D2F1 | The Jackson Laboratory | 100006 | Sperm donor |
Additional files
-
MDAR checklist
- https://cdn.elifesciences.org/articles/79153/elife-79153-mdarchecklist1-v2.pdf
-
Source data 1
The source data for Figures 1—7 and Figure 1—figure supplement 1, Figure 4—figure supplement 1, Figure 7—figure supplement 1.
- https://cdn.elifesciences.org/articles/79153/elife-79153-data1-v2.zip
Download links
A two-part list of links to download the article, or parts of the article, in various formats.
Downloads (link to download the article as PDF)
Open citations (links to open the citations from this article in various online reference manager services)
Cite this article (links to download the citations from this article in formats compatible with various reference manager tools)
Murine blastocysts generated by in vitro fertilization show increased Warburg metabolism and altered lactate production
eLife 11:e79153.
https://doi.org/10.7554/eLife.79153


