Inhibitory IL-10-producing CD4+ T cells are T-bet-dependent and facilitate cytomegalovirus persistence via coexpression of arginase-1
- Division of Infection and Immunity, School of Medicine, Cardiff University, United Kingdom
- Systems Immunity Research Institute, School of Medicine, Cardiff University, United Kingdom
- Wellcome Sanger Institute, Wellcome Genome Campus, United Kingdom
- Center of Life Sciences, Skolkovo Institute of Science and Technology, Russian Federation
- Genomics of Adaptive Immunity Department, Shemyakin-Ovchinnikov Institute of Bioorganic Chemistry, Russian Academy of Sciences, Russian Federation
- Institute of Clinical Molecular Biology, Christian-Albrecht-University of Kiel, Germany
- Institute of Translational Medicine, Center for Precision Genome Editing and Genetic Technologies for Biomedicine, Pirogov Russian National Research Medical University, Russian Federation
- Institute of Immunology and Immunotherapy, University of Birmingham, United Kingdom
- Abu Dhabi Stem Cell Center, United Arab Emirates
Figures
Figure 1 with 1 supplement
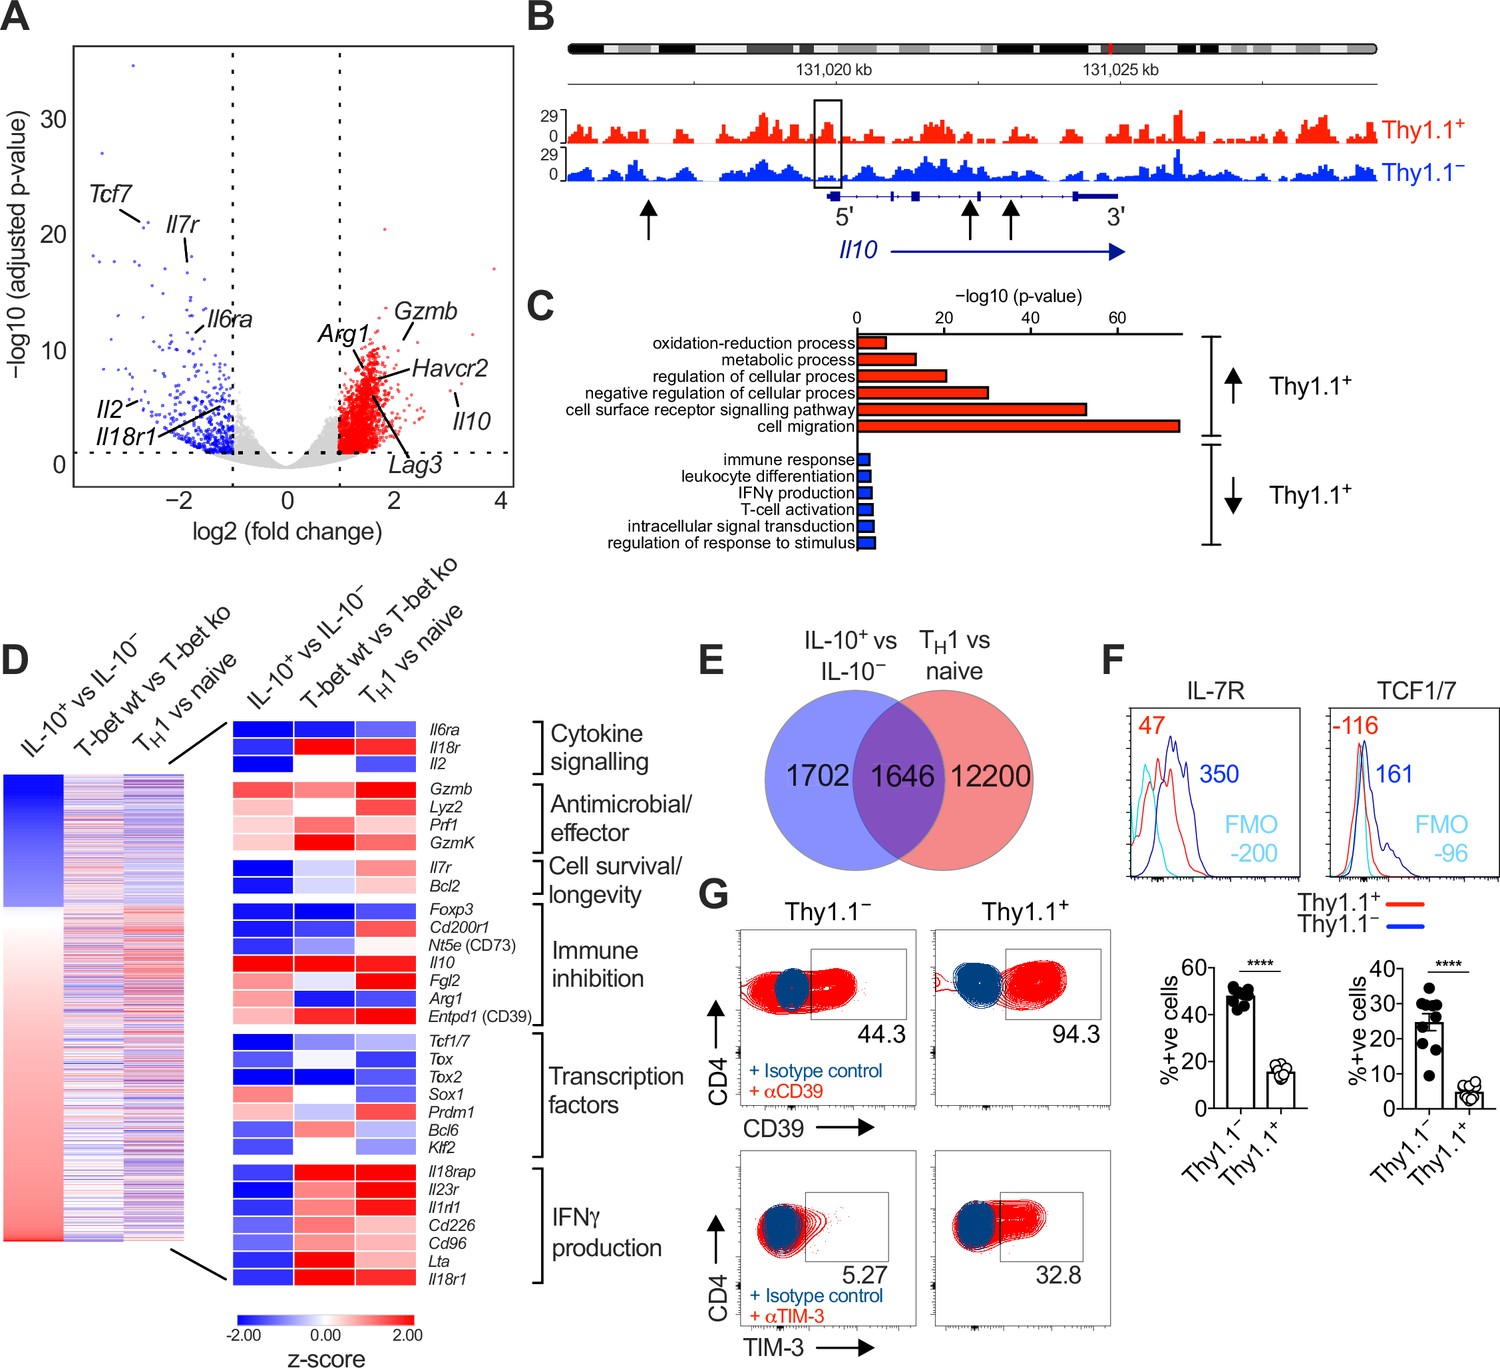
Interleukin (IL)-10-producing CD4+ T cells display a TH1-like profile.
10BiT mice were infected with 3 × 10⁴ pfu of murine cytomegalovirus (MCMV). Leukocytes were isolated from the salivary glands (SGs) on day 14 p.i. and sorted as CD4+ CD44+ CD62L− CD90/90.1+ (Thy1.1+) or CD90/90.1− (Thy1.1−) populations via fluorescence-activated cell sorting (FACS). (A) Volcano plot highlighting differentially upregulated genes in Thy1.1+ CD4+ T cells (red) versus Thy1.1− CD4+ T cells (blue). (B) ATAC-seq profiles showing accessible chromatin regions in the Il10 gene for Thy1.1+ CD4+ T cells (red) and Thy1.1− CD4+ T cells (blue). Data are shown as normalized values accounting for the total number of reads per lane. The black box indicates a major difference in chromatin accessibility. Black arrows indicate binding motifs for Tbx21. (C) Gene ontology analysis of data from (A) indicating the top six modules that were upregulated (red) or downregulated (blue) in Thy1.1+ CD4+ T cells. (D) Heatmap comparing data from (A) (left column) with published data from T-bet+ versus T-bet-knockout CD4+ T cells (middle column, GSE38808) and TH1 versus naive CD4+ T cells (right column, E-MTAB-2582). Displayed genes were selected according to relevant pathways identified via gene ontology analysis and tabulated against respective functions (all p < 0.05). (E) Venn diagram showing the overlap between genes enriched in Thy1.1+ CD4+ T cells (A, D) and genes enriched in TH1-like CD4+ T cells (E-MTAB-2582). Data in (A–E) are shown as pooled analyses from a minimum of n = 5 mice per group representing three independent experiments. (F) Representative histograms (top) and summary bar graphs (bottom) showing the expression of IL-7R and TCF1/7 among Thy1.1+ CD4+ T cells (red) and Thy1.1− CD4+ T cells (blue). The fluorescence-minus-one control is shown in sky blue (top). Bottom: data are shown as mean ± standard error of the mean (SEM; n = 10 mice per group representing two independent experiments). ****p < 0.0001 (Mann–Whitney U test). (G) Representative flow cytometry plots showing the expression of CD39 and TIM-3 among Thy1.1+ CD4+ T cells (red) and Thy1.1− CD4+ T cells (blue). Data are shown as pooled analyses from a minimum of n = 10 mice per group representing two independent experiments.
-
Figure 1—source data 1
Interleukin (IL)-10-producing CD4+ T cells display a TH1-like profile.
Source data Figure 1C: gene ontology analysis indicating the top six modules that were upregulated (red) or downregulated (blue) in Thy1.1+ CD4+ T cells isolated from the salivary glands (SGs) on day 14 p.i. (10BiT mice). Source data Figure 1F: percent expression of IL-7R and TCF1/7 among Thy1.1+ CD4+ T cells and Thy1.1− CD4+ T cells isolated from the SGs on day 14 p.i. (10BiT mice).
- https://cdn.elifesciences.org/articles/79165/elife-79165-fig1-data1-v1.xlsx
Figure 1—figure supplement 1
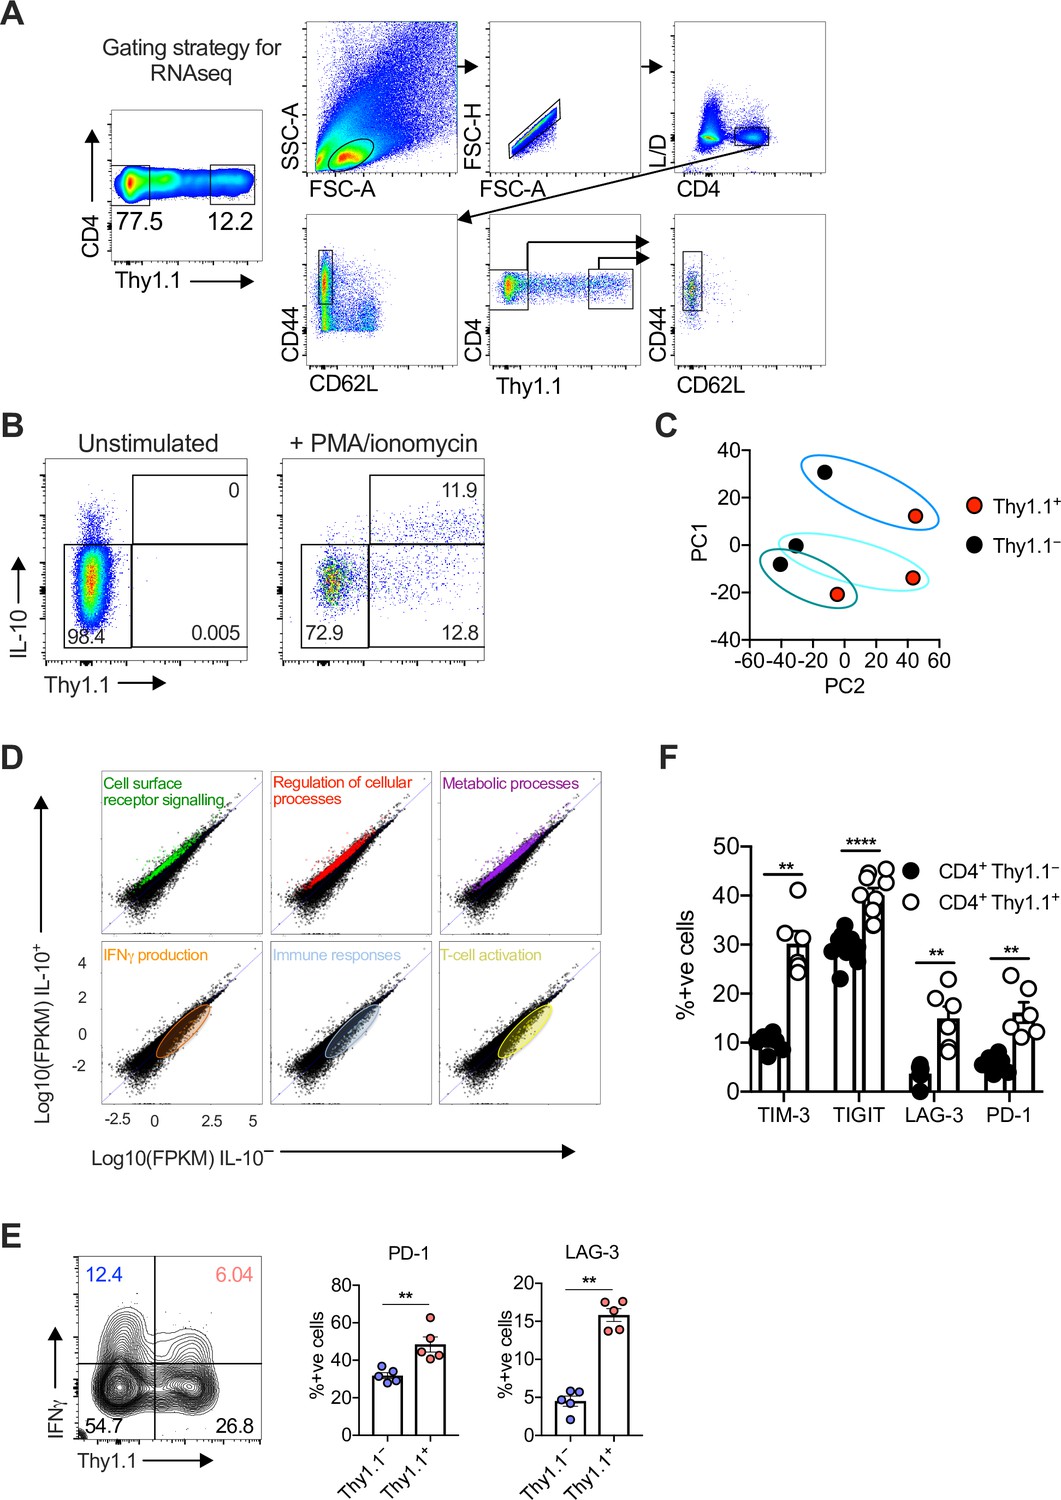
Characterization of CD4+ T cells isolated from the salivary glands (SGs) after infection with murine cytomegalovirus (MCMV).
10BiT mice were infected with 3 × 10⁴ pfu of MCMV. Leukocytes were isolated from the SGs on day 14 p.i. (A) Flow cytometric gating strategy. Leukocytes were identified as CD4+ CD44+ CD62L− CD90/90.1+ (Thy1.1+) or CD90/90.1− (Thy1.1−) populations for downstream molecular analyses (ATAC-seq, RNA-seq, and TCR-seq). (B) Representative flow cytometry plots showing the expression of interleukin (IL)-10 versus Thy1.1 among CD4+ T cells cultured briefly ex vivo in the absence (left) or presence of phorbol myristate acetate (PMA) and ionomycin (right). (C) Principal component analysis (PCA) plots from (A) after RNA-seq analysis. (D) Gene expression levels identifying the location of gene clusters from the gene ontology analysis (Figure 1C). (E) Representative flow cytometry plot (left) and summary bar graphs (right) showing the expression of PD-1 and LAG-3 among CD4+ T cells expressing interferon (IFN)γ after stimulation with PMA and ionomycin. Data are shown as mean ± standard error of the mean (SEM; n = 5 mice per group representing two independent experiments). **p < 0.01 (Mann–Whitney U test). (F) Summary bar graph showing the expression of TIM-3, TIGIT, LAG-3, and PD-1 among Thy1.1+ CD4+ T cells (red) and Thy1.1− CD4+ T cells (blue) measured via flow cytometry. Data are shown as mean ± SEM (n = 6–9 mice per group representing two independent experiments). **p < 0.01, ****p < 0.0001 (Mann–Whitney U test).
-
Figure 1—figure supplement 1—source data 1
Characterization of CD4+ T cells isolated from the salivary glands (SGs) after infection with murine cytomegalovirus (MCMV).
Source data Figure 1—figure supplement 1C: Principal component analysis (PCA) scores for Thy1.1+ CD4+ T cells and Thy1.1− CD4+ T cells isolated from the SGs on day 14 p.i. (10BiT mice). Source data Figure 1—figure supplement 1E: percent expression of PD-1 and LAG-3 among Thy1.1+ CD4+ T cells (red) and Thy1.1− CD4+ T cells (blue) isolated from the SGs on day 14 p.i. measured via flow cytometry after gating on interferon (IFN)γ+ events in response to direct ex vivo stimulation with PMA and ionomycin (10BiT mice). Source data Figure 1—figure supplement 1F: percent expression of TIM-3, TIGIT, LAG-3, and PD-1 among Thy1.1+ CD4+ T cells and Thy1.1− CD4+ T cells isolated from the SGs on day 14 p.i. measured via flow cytometry (10BiT mice).
- https://cdn.elifesciences.org/articles/79165/elife-79165-fig1-figsupp1-data1-v1.xlsx
Figure 2 with 1 supplement
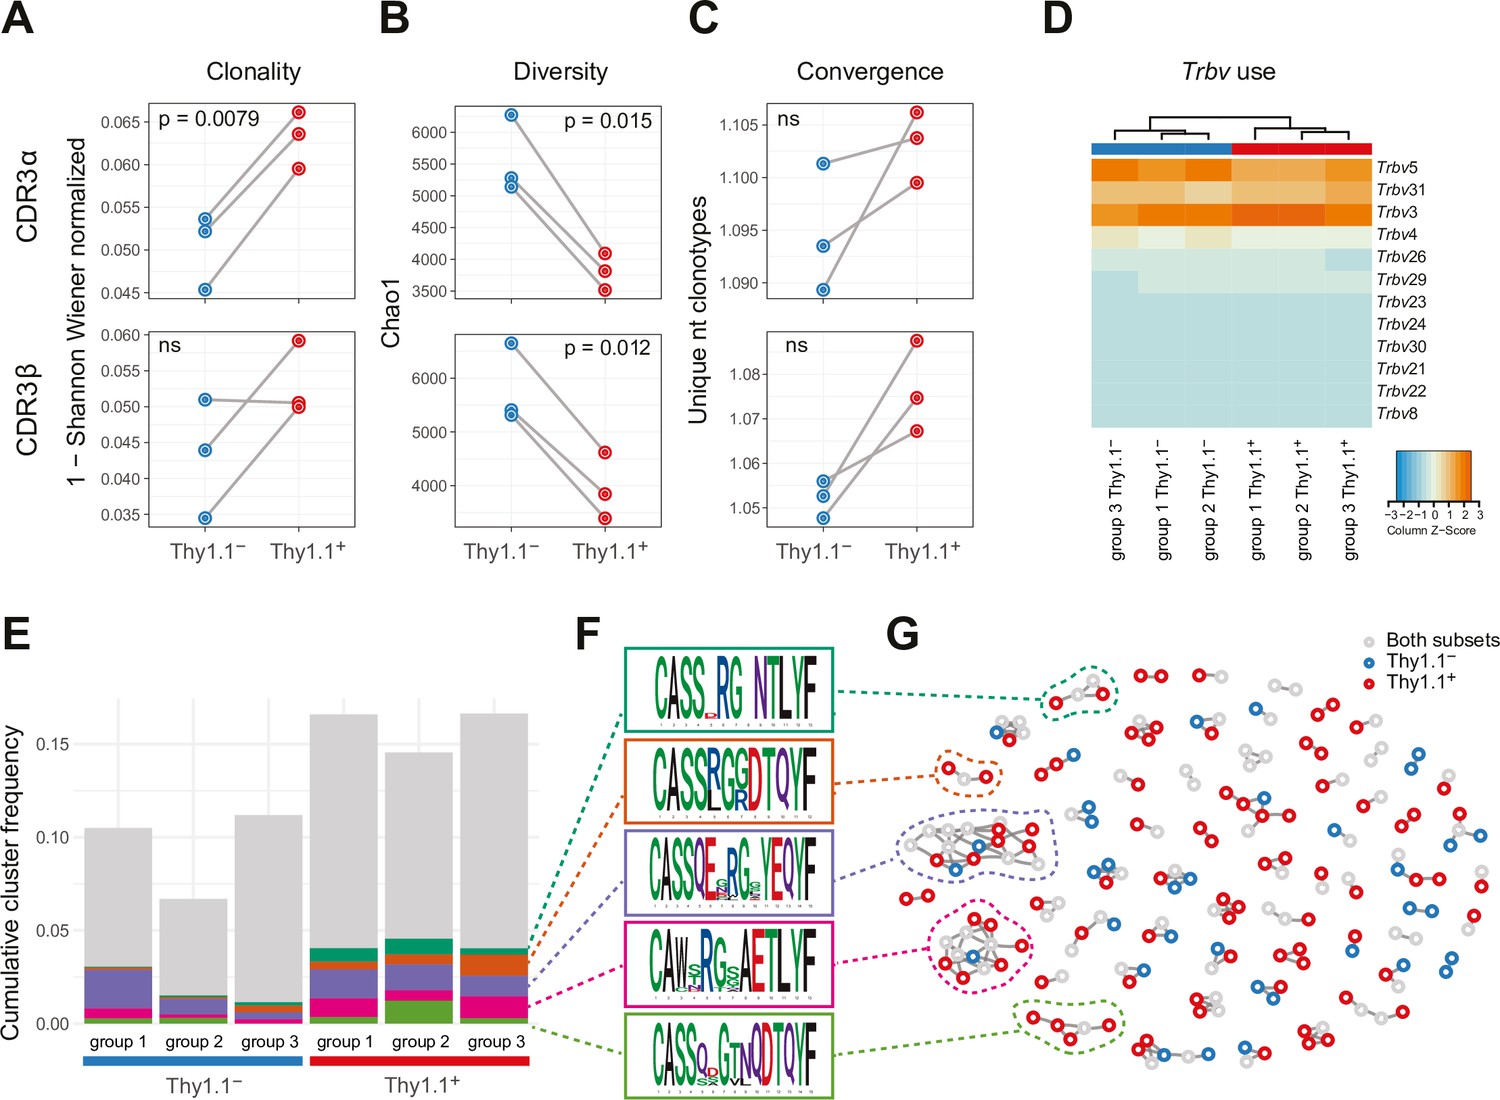
Interleukin (IL)-10-producing CD4+ T cells exhibit prominent clonal structures.
10BiT mice were infected with 3 × 10⁴ pfu of murine cytomegalovirus (MCMV). Leukocytes were isolated from the salivary glands (SGs) on day 14 p.i. and sorted as CD4+ CD44+ CD62L− CD90/90.1+ (Thy1.1+) or CD90/90.1− (Thy1.1−) populations via fluorescence-activated cell sorting (FACS). (A) Clonality and (B) diversity metrics calculated for the T cell receptor (TCR)α (top) and TCRβ repertoires (bottom) derived from Thy1.1+ CD4+ T cells and Thy1.1− CD4+ T cells. (C) TCR convergence measured as the average number of nucleotide sequences encoding amino acid-identical complementarity-determining region (CDR)3α (top) and CDR3β loops (bottom) across the 2000 most prevalent clonotypes. (A–C) p values were calculated using a paired t-test with Benjamini–Hochberg correction. ns, not significant. (D) Hierarchical clustering of Trbv gene use weighted by clonotype frequency. (E–G) Cluster analysis of the 500 most prevalent TCRβ clonotypes using the tcrgrapher pipeline. (E) The cumulative frequency of tcrgrapher hits per sample is shown in gray. The frequency of each cluster comprising at least two tcrgrapher hits was calculated for each sample and averaged across all six repertoires. The five most prevalent clusters are shown in color. (F) Amino acid logos for each of the five most prevalent clusters. (G) Visual representation of clusters comprising at least two tcrgrapher hits. Nodes represent unique amino acid sequences. Edges connect sequences with a single amino acid mismatch. Amino acid sequences present only in Thy1.1+ CD4+ T cells are shown in red, amino acid sequences present only in Thy1.1− CD4+ T cells are shown in blue, and amino acid sequences present in both Thy1.1+ CD4+ T cells and Thy1.1− CD4+ T cells are shown in gray. Data are shown as pooled analyses from n = 4 mice per group representing three independent experiments (groups 1–3).
Figure 2—figure supplement 1

Analysis of repertoire diversity and overlap and the physicochemical properties of T cell receptors (TCRs).
(A) Visual representation of repertoire diversity. The inner rings indicate the frequencies of clonotypes sampled once, twice, or more often. The middle rings indicate the 20th, 40th, 60th, 80th, and 100th percentiles (Q1–Q5, respectively). The outer rings indicate the frequencies of the top five most abundant clonotypes with corresponding sequence information. Left: TCRβ. Right: TCRα. (B) F2 overlap metrics for the 2000 most prevalent clonotypes showing pairwise calculations to estimate the sharing of amino acid sequences with identical V genes. Left: TCRβ. Right: TCRα. (C) Mean physicochemical properties of the central five amino acids in the complementarity-determining region (CDR)3β (top) and CDR3α loops (bottom) weighted by clonotype frequency. Right: averaged and weighted nucleotide lengths for CDR3β (top) and CDR3α (bottom). Significance was evaluated using a paired t-test with Benjamini–Hochberg correction. ns, not significant.
Figure 3 with 1 supplement
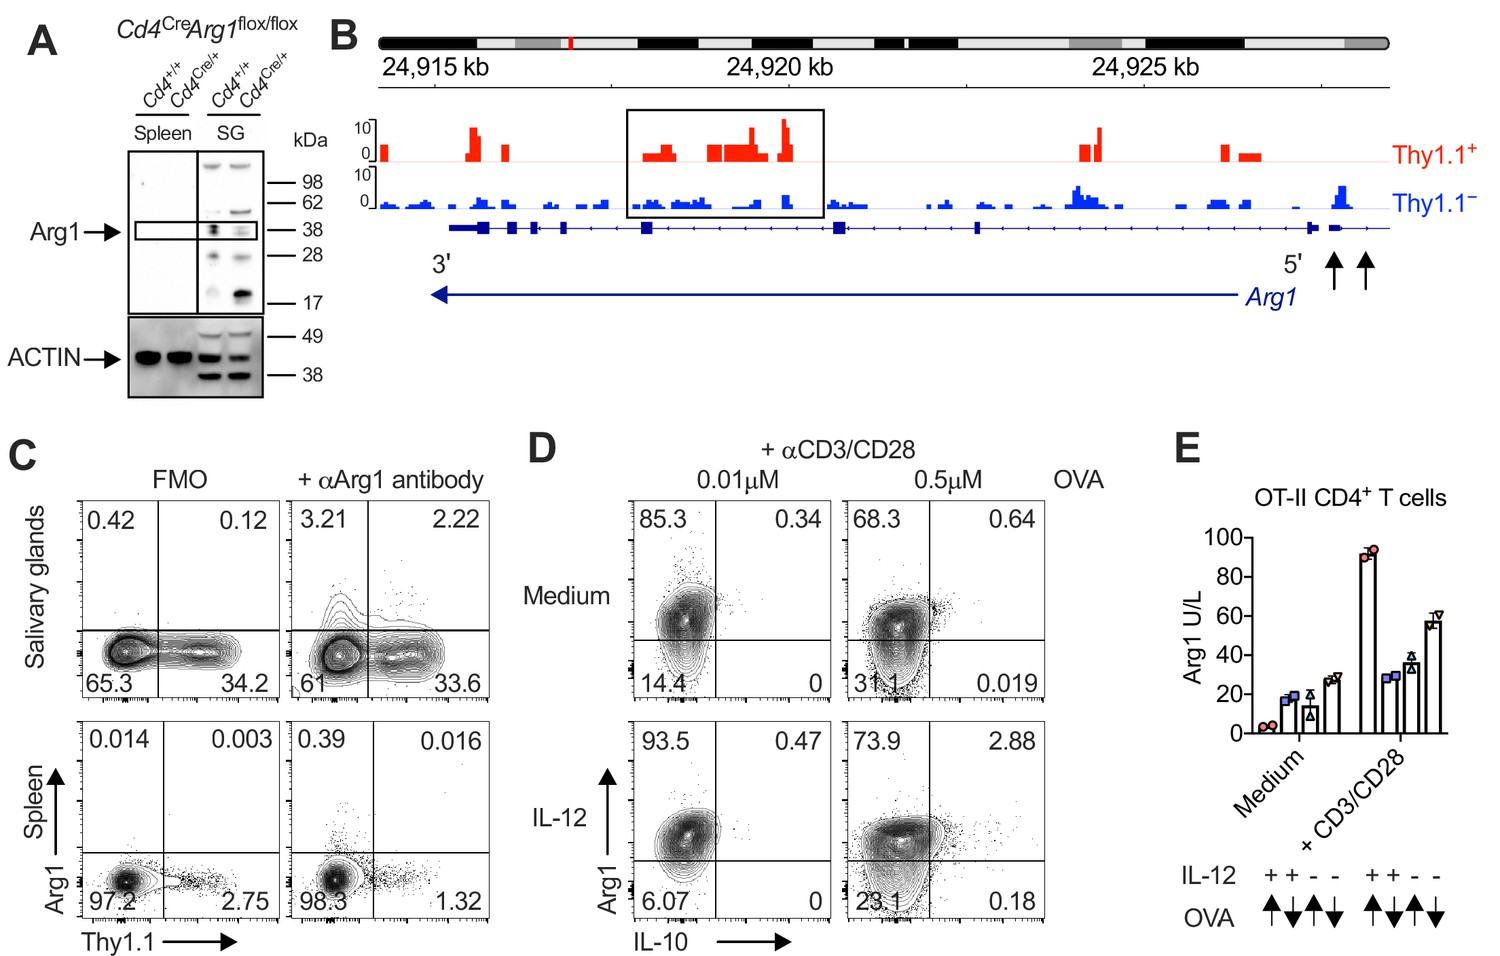
Interleukin (IL)-10-producing CD4+ T cells are enriched for expression of arginase-1 (Arg1).
(A) Expression of Arg1 among leukocytes isolated via magnetic separation from the salivary glands (SGs) and spleens of Cd4+/+Arg1flox/flox or Cd4Cre/+Arg1flox/flox mice on day 14 p.i. detected by Western blot. (B, C) 10BiT mice were infected with 3 × 10⁴ pfu of murine cytomegalovirus (MCMV). (B) Leukocytes were isolated from the SGs on day 14 p.i. and sorted as CD4+ CD44+ CD62L− CD90/90.1+ (Thy1.1+) or CD90/90.1− (Thy1.1−) populations via fluorescence-activated cell sorting (FACS). ATAC-seq profiles show accessible chromatin regions in the Arg1 gene for Thy1.1+ CD4+ T cells (red) and Thy1.1− CD4+ T cells (blue). Data are shown as normalized values accounting for the total number of reads per lane. The black box indicates a major difference in chromatin accessibility. Black arrows indicate binding motifs for Tbx21. Data are shown as pooled analyses from a minimum of n = 5 mice per group representing three independent experiments. (C) Representative flow cytometry plots showing the expression of Arg1 versus Thy1.1 among CD4+ T cells isolated from the SGs and spleens on day 14 p.i. (A, C) Data are shown as pooled analyses from a minimum of n = 7 mice per group representing three independent experiments. (D) Representative flow cytometry plots showing the expression of Arg1 versus IL-10 among OT-II-specific CD4+ T cells generated in vitro in the absence or presence of IL-12 (3 ng/ml) ± OVA323–339 for 7 days and then stimulated with anti-CD3/CD28 for 4 hr. (E) Summary bar graph showing Arg1 protein concentrations in culture supernatants from (D) after stimulation with anti-CD3/CD28 for 48 hr. Up arrows indicate the higher concentration of OVA323–339 (0.5 μM), and down arrows indicate the lower concentration of OVA323–339 (0.01 μM). Data are shown as mean ± standard error of the mean (SEM).
-
Figure 3—source data 1
Interleukin (IL)-10-producing CD4+ T cells are enriched for expression of arginase-1 (Arg1).
Source data Figure 3A: expression of Arg1 among leukocytes isolated via magnetic separation from the salivary glands (SGs) and spleens of Cd4+/+Arg1flox/flox or Cd4Cre/+Arg1flox/flox mice on day 14 p.i. detected by Western blot. Original blots are shown for each antibody. Uncut blots are shown with black boxes to delineate the images used in Figure 3A.
- https://cdn.elifesciences.org/articles/79165/elife-79165-fig3-data1-v1.zip
-
Figure 3—source data 2
Interleukin (IL)-10-producing CD4+ T cells are enriched for expression of arginase-1 (Arg1).
Source data Figure 3E: Arg1 protein concentrations in culture supernatants after stimulation of leukocytes with anti-CD3/CD28 for 48 hr measured via ELISA.
- https://cdn.elifesciences.org/articles/79165/elife-79165-fig3-data2-v1.xlsx
Figure 3—figure supplement 1
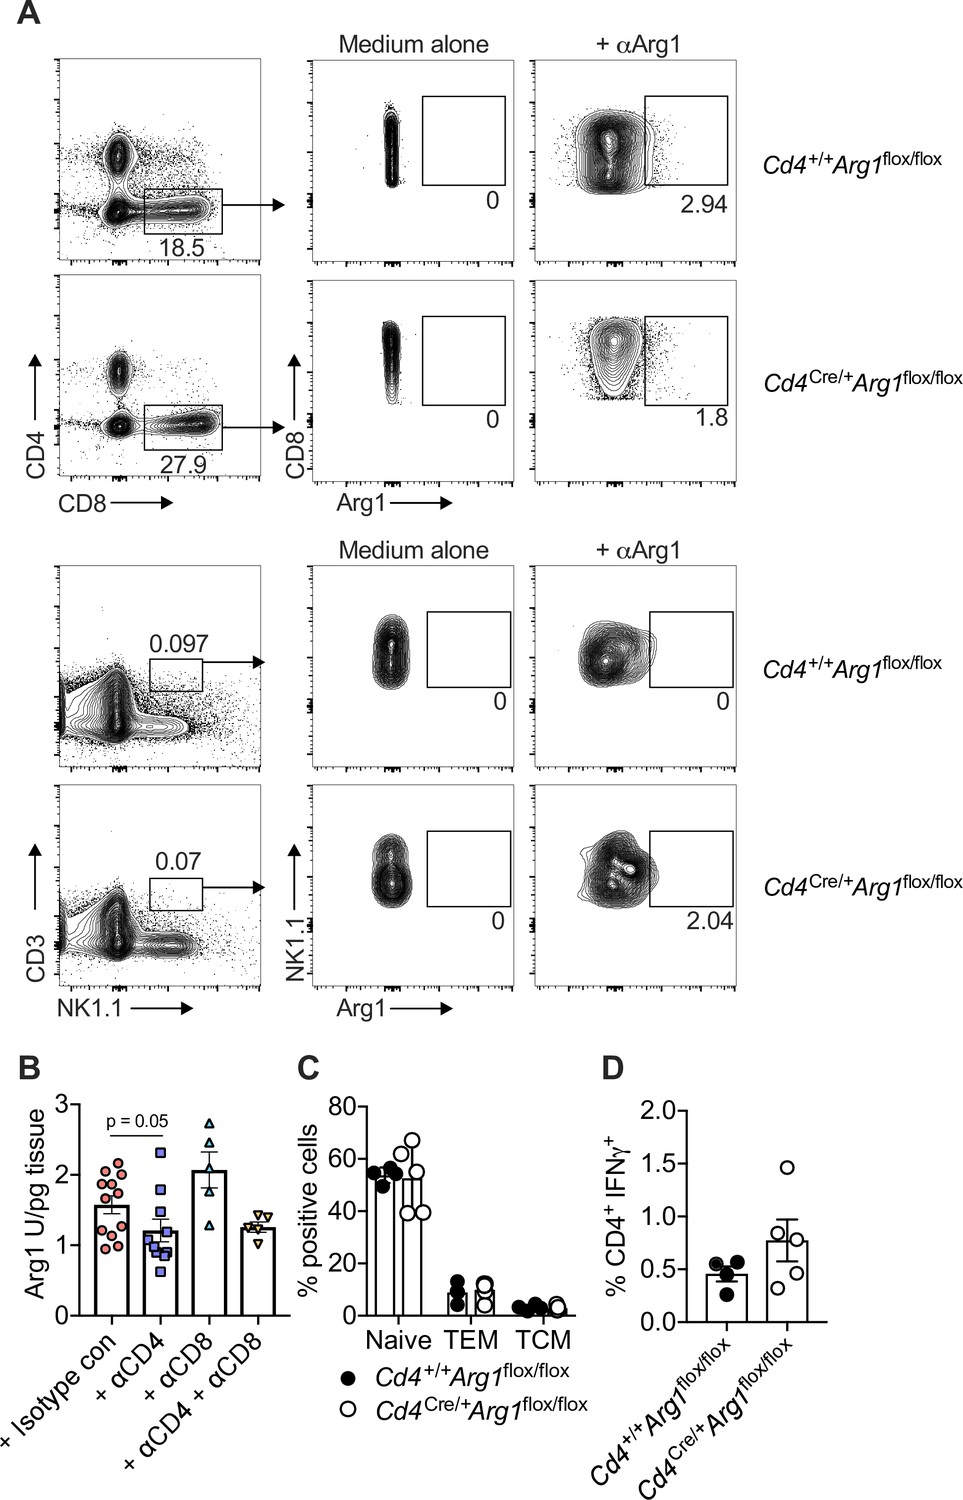
T cell-specific deletion of arginase-1 (Arg1) does not impact the function or phenotype of T cells in naive mice.
(A) Cd4+/+Arg1flox/flox and Cd4Cre/+Arg1flox/flox mice were infected with 3 × 10⁴ pfu of murine cytomegalovirus (MCMV). Leukocytes were isolated from the salivary glands (SGs) on day 14 p.i. Representative flow cytometry plots show the expression of CD8 versus Arg1 (top) and NKT1.1 versus Arg1 (bottom). (B) C57BL/6 mice were infected with 3 × 10⁴ pfu of MCMV. Isotype control, anti-CD4, anti-CD8, or anti-CD4 and anti-CD8 antibodies were administered on days 6 and 8 p.i. SG homogenates were prepared on day 14 p.i. Arg1 protein concentrations were measured via ELISA. Data are shown as mean ± standard error of the mean (SEM; n = 5–12 mice per group representing one independent experiment). Significance was evaluated using the Mann–Whitney U test. (C, D) Splenocytes were harvested from naive Cd4+/+Arg1flox/flox and Cd4Cre/+Arg1flox/flox mice. (C) Summary bar graph showing the overall frequencies of naive, central memory (CM), and effector memory (EM) CD4+ T cells. Data are shown as mean ± SEM (n = 3–4 mice per group representing two independent experiments). (D) Summary bar graph showing the expression of interferon (IFN)γ among CD4+ T cells after ex vivo stimulation with PMA and ionomycin. Data are shown as mean ± SEM (n = 5 mice per group representing two independent experiments).
-
Figure 3—figure supplement 1—source data 1
T cell-specific deletion of arginase-1 (Arg1) does not impact the function or phenotype of T cells in naive mice.
Source data Figure 3—figure supplement 1B: Arg1 protein concentrations in salivary gland (SG) homogenates (U/pg tissue) isolated on day 14 p.i. from C57BL/6 mice treated with isotype control, anti-CD4, anti-CD8, or anti-CD4 and anti-CD8 antibodies on days 6 and 8 p.i. measured via ELISA. Source data Figure 3—figure supplement 1C: frequencies of naive, central memory (CM), and effector memory (EM) CD4+ T cells among splenocytes isolated from uninfected Cd4+/+Arg1flox/flox and Cd4Cre/+Arg1flox/flox mice. Source data Figure 3—figure supplement 1D: percent expression of interferon (IFN)γ among CD4+ T cells after ex vivo stimulation of splenocytes isolated from uninfected Cd4+/+Arg1flox/flox and Cd4Cre/+Arg1flox/flox mice with PMA and ionomycin.
- https://cdn.elifesciences.org/articles/79165/elife-79165-fig3-figsupp1-data1-v1.xlsx
Figure 4 with 1 supplement
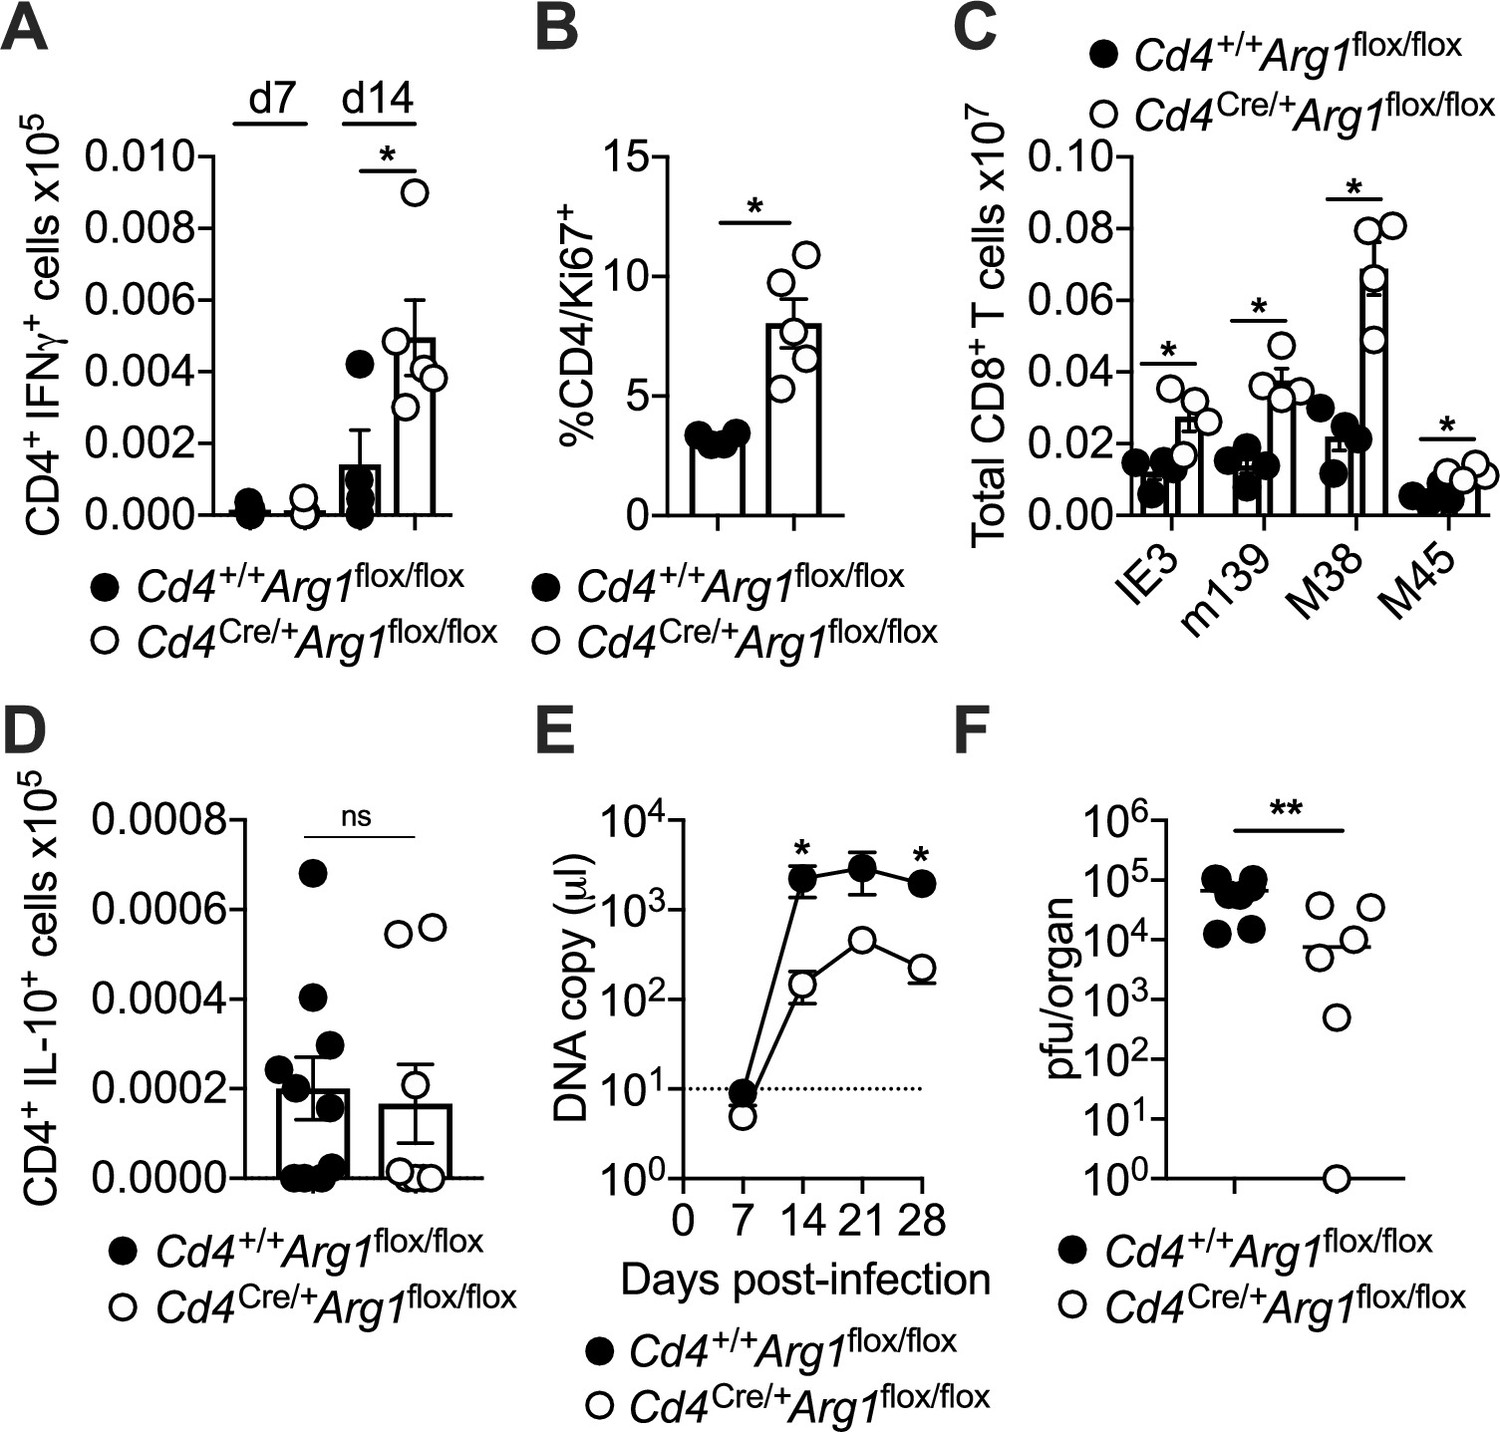
CD4+ T cells promote viral persistence via expression of arginase-1 (Arg1).
Cd4+/+Arg1flox/flox and Cd4Cre/+Arg1flox/flox mice were infected with 3 × 10⁴ pfu of murine cytomegalovirus (MCMV). (A) MCMV-specific CD4+ T cell responses in the salivary glands (SGs) on days 7 and 14 p.i. measured using flow cytometry to detect interferon (IFN)γ. Immunodominant peptides were pooled for stimulation. Data are shown as mean ± standard error of the mean (SEM; n = 4–6 mice per group representing three independent experiments). (B) Expression of Ki-67 among CD4+ T cells isolated from the SGs on day 14 p.i. measured via flow cytometry. Data are shown as mean ± SEM (n = 4–5 mice per group representing two independent experiments). (C) MCMV tetramer+ CD8+ T cells quantified in spleens on day 30 p.i. via flow cytometry. Data are shown as mean ± SEM (n = 4 mice per group representing two independent experiments). (D) MCMV-specific CD4+ T cell responses in the SGs on days 7 and 14 p.i. measured using flow cytometry to detect interleukin (IL)-10. Immunodominant peptides were pooled for stimulation. Data are shown as mean ± SEM (n = 8–10 mice per group representing two independent experiments). (A–D) *p < 0.05 (Mann–Whitney U test). (E) Viral genomes in saliva on days 7, 14, 21, and 28 p.i. measured via qPCR. Data are shown as mean ± SEM (n = 8 mice per group representing two independent experiments). *p < 0.05 (Mann–Whitney U test). (F) MCMV replication in SG homogenates on day 30 p.i. measured via plaque assay. Data are shown as individual points with median values (n = 6–7 mice per group representing two or three independent experiments). **p < 0.01 (Mann–Whitney U test).
-
Figure 4—source data 1
CD4+ T cells promote viral persistence via expression of arginase-1 (Arg1).
Source data Figure 4A: murine cytomegalovirus (MCMV)-specific CD4+ T cell responses in the salivary glands (SGs) on days 7 and 14 p.i. measured using flow cytometry to detect interferon (IFN)γ (Cd4+/+Arg1flox/flox and Cd4Cre/+Arg1flox/flox mice). Source data Figure 4B: percent expression of Ki-67 among CD4+ T cells isolated from the SGs on day 14 p.i. measured via flow cytometry (Cd4+/+Arg1flox/flox and Cd4Cre/+Arg1flox/flox mice). Source data Figure 4C: MCMV tetramer+ CD8+ T cells quantified in spleens on day 30 p.i. via flow cytometry (Cd4+/+Arg1flox/flox and Cd4Cre/+Arg1flox/flox mice). Source data Figure 4D: MCMV-specific CD4+ T cell responses in the SGs on days 7 and 14 p.i. measured using flow cytometry to detect interleukin (IL)-10 (Cd4+/+Arg1flox/flox and Cd4Cre/+Arg1flox/flox mice). Source data Figure 4E: viral genomes in saliva (DNA copies/μl) on days 7, 14, 21, and 28 p.i. measured via qPCR (Cd4+/+Arg1flox/flox and Cd4Cre/+Arg1flox/flox mice). Source data Figure 4F: MCMV replication in SG homogenates (pfu/organ) on day 30 p.i. measured via plaque assay (Cd4+/+Arg1flox/flox and Cd4Cre/+Arg1flox/flox mice).
- https://cdn.elifesciences.org/articles/79165/elife-79165-fig4-data1-v1.xlsx
Figure 4—figure supplement 1
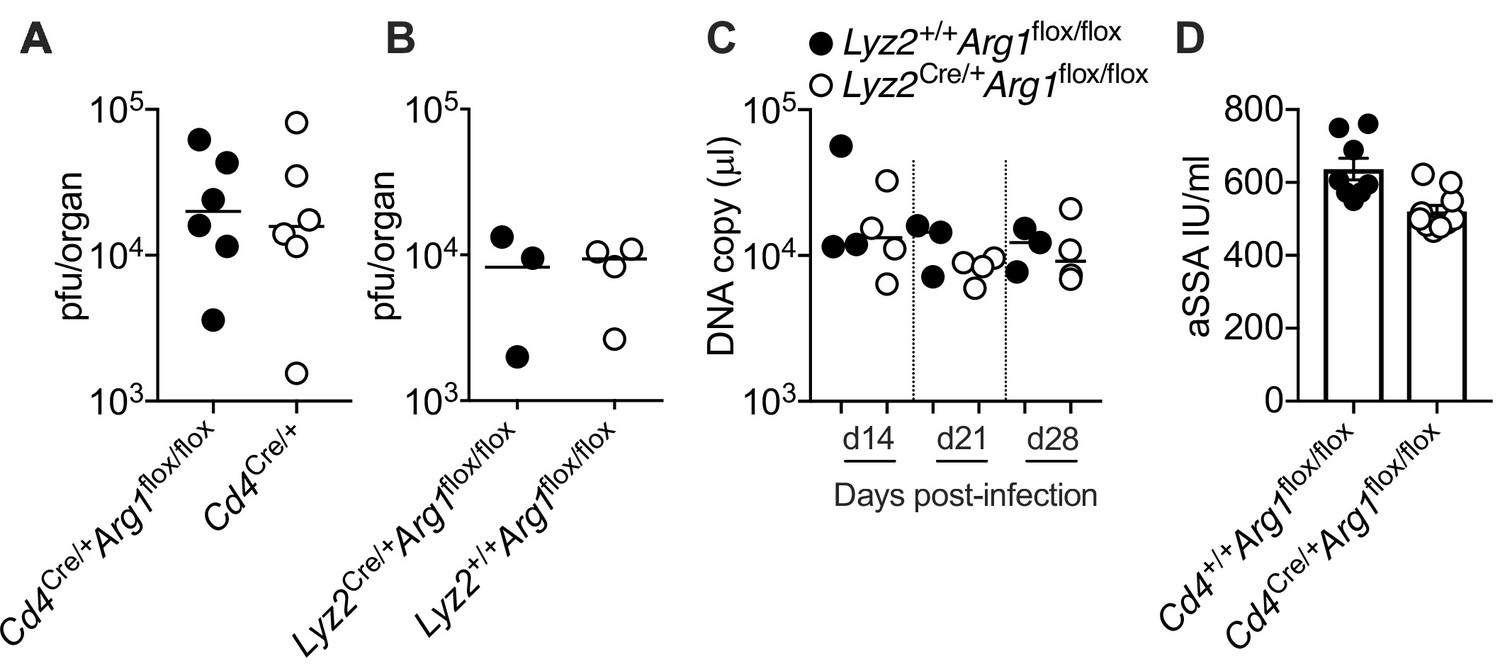
Arginase-1 (Arg1) expression in myeloid cells does not impact the replication of murine cytomegalovirus (MCMV).
(A) Cd4Cre/+Arg1flox/flox and Cd4Cre/+ mice were infected with 3 × 10⁴ pfu of MCMV. (B, C) Lyz2+/+Arg1flox/flox and Lyz2Cre/+Arg1flox/flox mice were infected with 3 × 10⁴ pfu of MCMV. (D) Cd4+/+Arg1flox/flox and Cd4Cre/+Arg1flox/flox mice were infected with 3 × 10⁴ pfu of MCMV. (A) MCMV replication in salivary gland (SG) homogenates on day 14 p.i. measured via plaque assay. Data are shown as individual points with median values (n = 6 mice per group representing one independent experiment). (B) MCMV replication in SG homogenates on day 28 p.i. measured via plaque assay. Data are shown as individual points with median values (n = 3–4 mice per group representing two independent experiments). (C) Viral genomes in saliva on days 14, 21, and 28 p.i. measured via qPCR. Data are shown as individual points with median values (n = 3–4 mice per group representing two independent experiments). (D) Cardiac punctures were performed on day 30 p.i. Anti-SSA IgG titers were measured in plasma samples via ELISA. Data are shown as mean ± standard error of the mean (SEM; n=10 mice per group representing two independent experiments).
-
Figure 4—figure supplement 1—source data 1
Arginase-1 (Arg1) expression in myeloid cells does not impact the replication of murine cytomegalovirus (MCMV).
Source data Figure 4—figure supplement 1A: MCMV replication in salivary gland (SG) homogenates (pfu/organ) on day 14 p.i. measured via plaque assay (Cd4+/+Arg1flox/flox and Cd4Cre/+Arg1flox/flox mice). Source data Figure 4—figure supplement 1B: MCMV replication in SG homogenates (pfu/organ) on day 28 p.i. measured via plaque assay (Lyz2+/+Arg1flox/flox and Lyz2Cre/+Arg1flox/flox mice). Source data Figure 4—figure supplement 1C: viral genomes in saliva (DNA copies/μl) on days 14, 21, and 28 p.i. measured via qPCR (Lyz2+/+Arg1flox/flox and Lyz2Cre/+Arg1flox/flox mice). Source data Figure 4—figure supplement 1D: anti-SSA IgG titers measured in plasma samples on day 30 p.i. via ELISA (Cd4+/+Arg1flox/flox and Cd4Cre/+Arg1flox/flox mice).
- https://cdn.elifesciences.org/articles/79165/elife-79165-fig4-figsupp1-data1-v1.xlsx
Figure 5 with 1 supplement
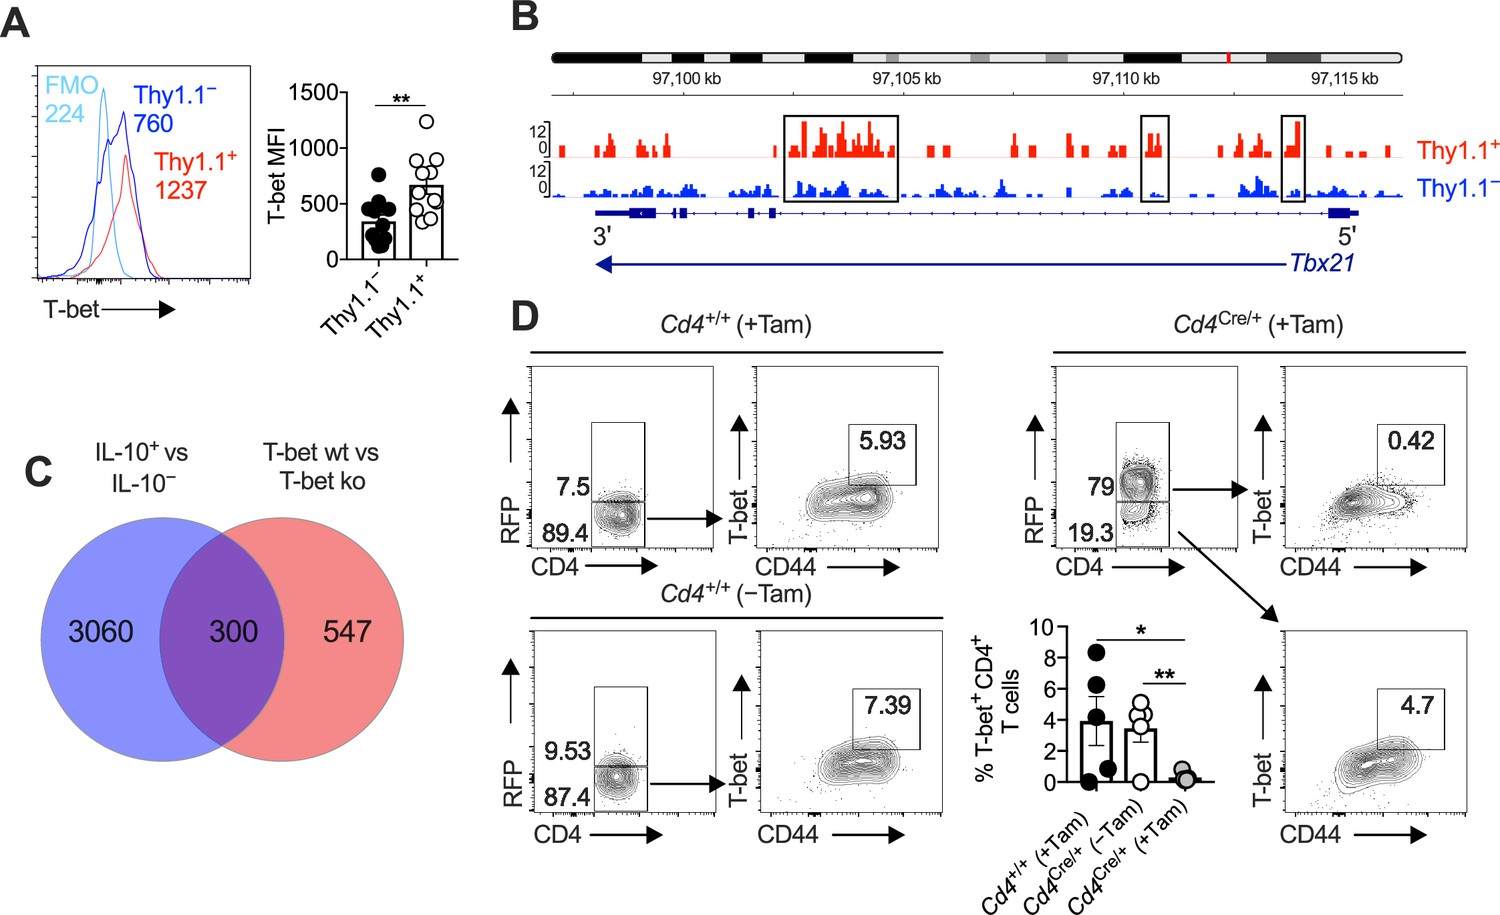
Interleukin (IL)-10-producing CD4+ T cells express T-bet and T-bet-inducible genes.
(A, B) 10BiT mice were infected with 3 × 10⁴ pfu of murine cytomegalovirus (MCMV). (A) Leukocytes were isolated from the salivary glands (SGs) on day 14 p.i. Representative histograms (left) and summary bar graph (right) show the expression of T-bet among Thy1.1+ CD4+ T cells (red) and Thy1.1− CD4+ T cells (blue). Data are shown as mean ± standard error of the mean (SEM; n = 5–6 mice per group pooled from two independent experiments). MFI, median fluorescence intensity. **p < 0.01 (Mann–Whitney U test). (B) Leukocytes were isolated from the SGs on day 14 p.i. and sorted as CD4+ CD44+ CD62L− CD90/90.1+ (Thy1.1+) or CD90/90.1− (Thy1.1−) populations via fluorescence-activated cell sorting (FACS). ATAC-seq profiles show accessible chromatin regions in the Tbx21 gene for Thy1.1+ CD4+ T cells (red) and Thy1.1− CD4+ T cells (blue). Data are shown as normalized values accounting for the total number of reads per lane. The black boxes indicate major differences in chromatin accessibility. Data are shown as pooled analyses from a minimum of n = 5 mice per group representing three independent experiments. (C) Venn diagram showing the overlap between genes enriched in Thy1.1+ CD4+ T cells (A, D) and genes enriched in T-bet+ CD4+ T cells (GSE38808). (D) Cd4+/+Tbx21flox/flox (Cd4+/+) and Cd4CreERT2/+Tbx21flox/flox (Cd4Cre/+) mice were infected with 3 × 10⁴ pfu of MCMV. Tamoxifen was administered (+Tam) or withheld (−Tam) from days 7 to 12 p.i. Leukocytes were isolated from the SGs on day 14 p.i. Representative flow cytometry plots show the expression of CD4 versus RFP (left) and CD44 versus T-bet for the gated populations (right). Data in the bar graph are shown as mean ± SEM (n = 4–5 mice per group representing four or five independent experiments). *p < 0.05, **p < 0.01 (Mann–Whitney U test).
-
Figure 5—source data 1
Interleukin (IL)-10-producing CD4+ T cells express T-bet and T-bet-inducible genes.
Source data Figure 5A: expression of T-bet (median fluorescence intensity, MFI) among Thy1.1+ CD4+ T cells and Thy1.1− CD4+ T cells isolated from the salivary glands (SGs) on day 14 p.i. measured via flow cytometry (10BiT mice). Source data Figure 5D: percent expression of CD4 versus T-bet among leukocytes isolated from the SGs on day 14 p.i. (Cd4+/+Tbx21flox/flox and Cd4CreERT2/+Tbx21flox/flox mice).
- https://cdn.elifesciences.org/articles/79165/elife-79165-fig5-data1-v1.xlsx
Figure 5—figure supplement 1
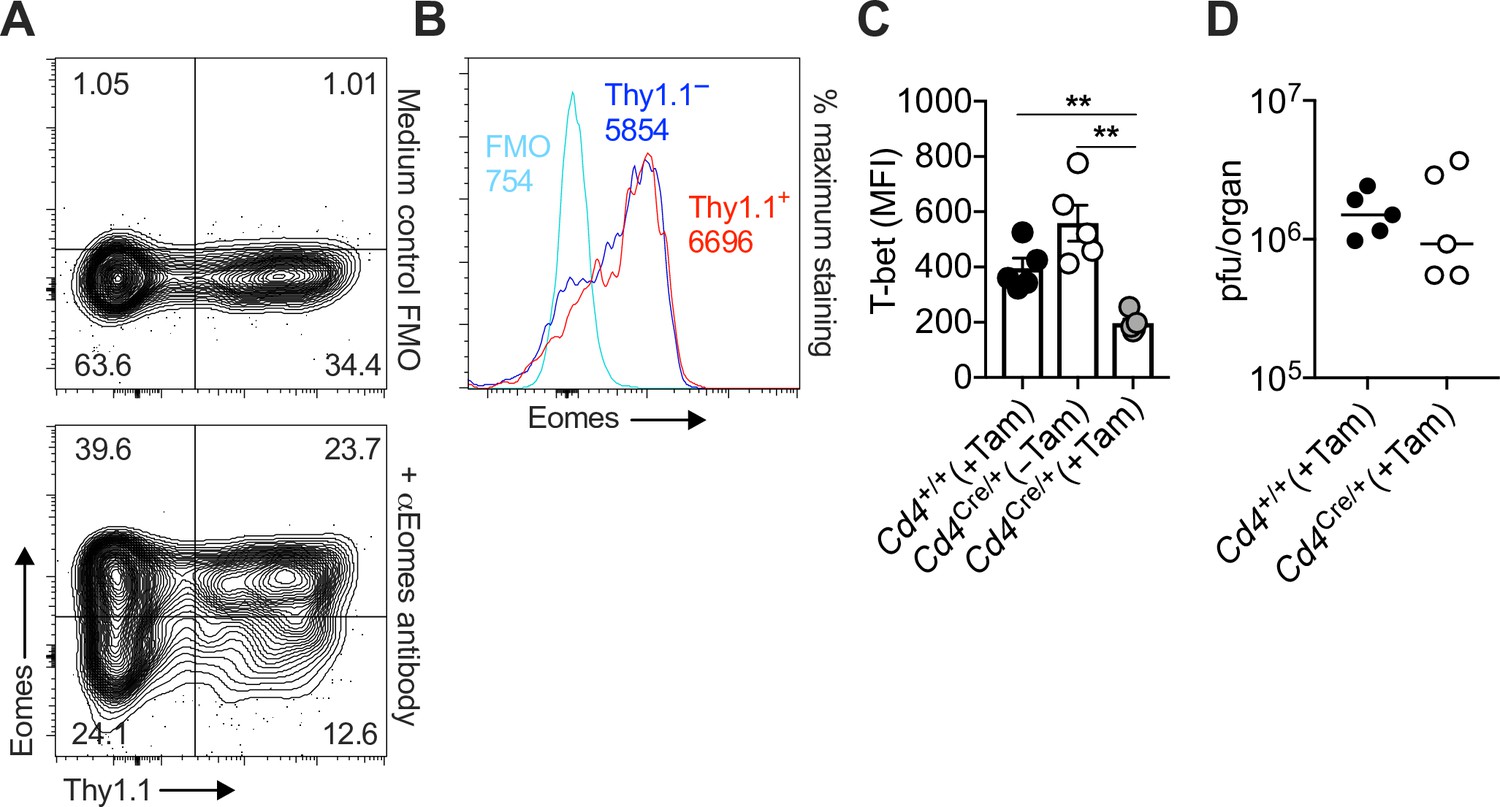
Interleukin (IL)-10-producing CD4+ T cells are not selectively regulated by Eomes.
Representative flow cytometry plots (A) and histograms (B) showing the expression of Eomes versus Thy1.1. (C, D) Cd4+/+Tbx21flox/flox and Cd4CreERT2/+Tbx21flox/flox mice were infected with 3 × 10⁴ pfu of murine cytomegalovirus (MCMV). Tamoxifen was administered (+Tam) or withheld (−Tam) from days 7 to 12 p.i. (C) Leukocytes were isolated from the salivary glands (SGs) on day 14 p.i. The expression of T-bet was measured via flow cytometry. Data are shown as mean ± standard error of the mean (SEM; n = 4–5 mice per group representing four or five independent experiments). MFI, median fluorescence intensity. **p < 0.01 (Mann–Whitney U test). (D) MCMV replication in SG homogenates on day 28 p.i. measured via plaque assay. Data are shown as individual points with median values (n = 5 mice per group representing three independent experiments).
-
Figure 5—figure supplement 1—source data 1
Interleukin (IL)-10-producing CD4+ T cells are not selectively regulated by Eomes.
Source data Figure 5—figure supplement 1C: expression of T-bet (median fluorescence intensity, MFI) among CD4+ T cells isolated from the salivary glands (SGs) on day 14 p.i. measured vi flow cytometry (Cd4+/+Tbx21flox/flox and Cd4CreERT2/+Tbx21flox/flox mice). Source data Figure 5—figure supplement 1D: murine cytomegalovirus (MCMV) replication in SG homogenates (pfu/organ) on day 28 p.i. measured via plaque assay (Cd4+/+Tbx21flox/flox and Cd4CreERT2/+Tbx21flox/flox mice).
- https://cdn.elifesciences.org/articles/79165/elife-79165-fig5-figsupp1-data1-v1.xlsx
Figure 6
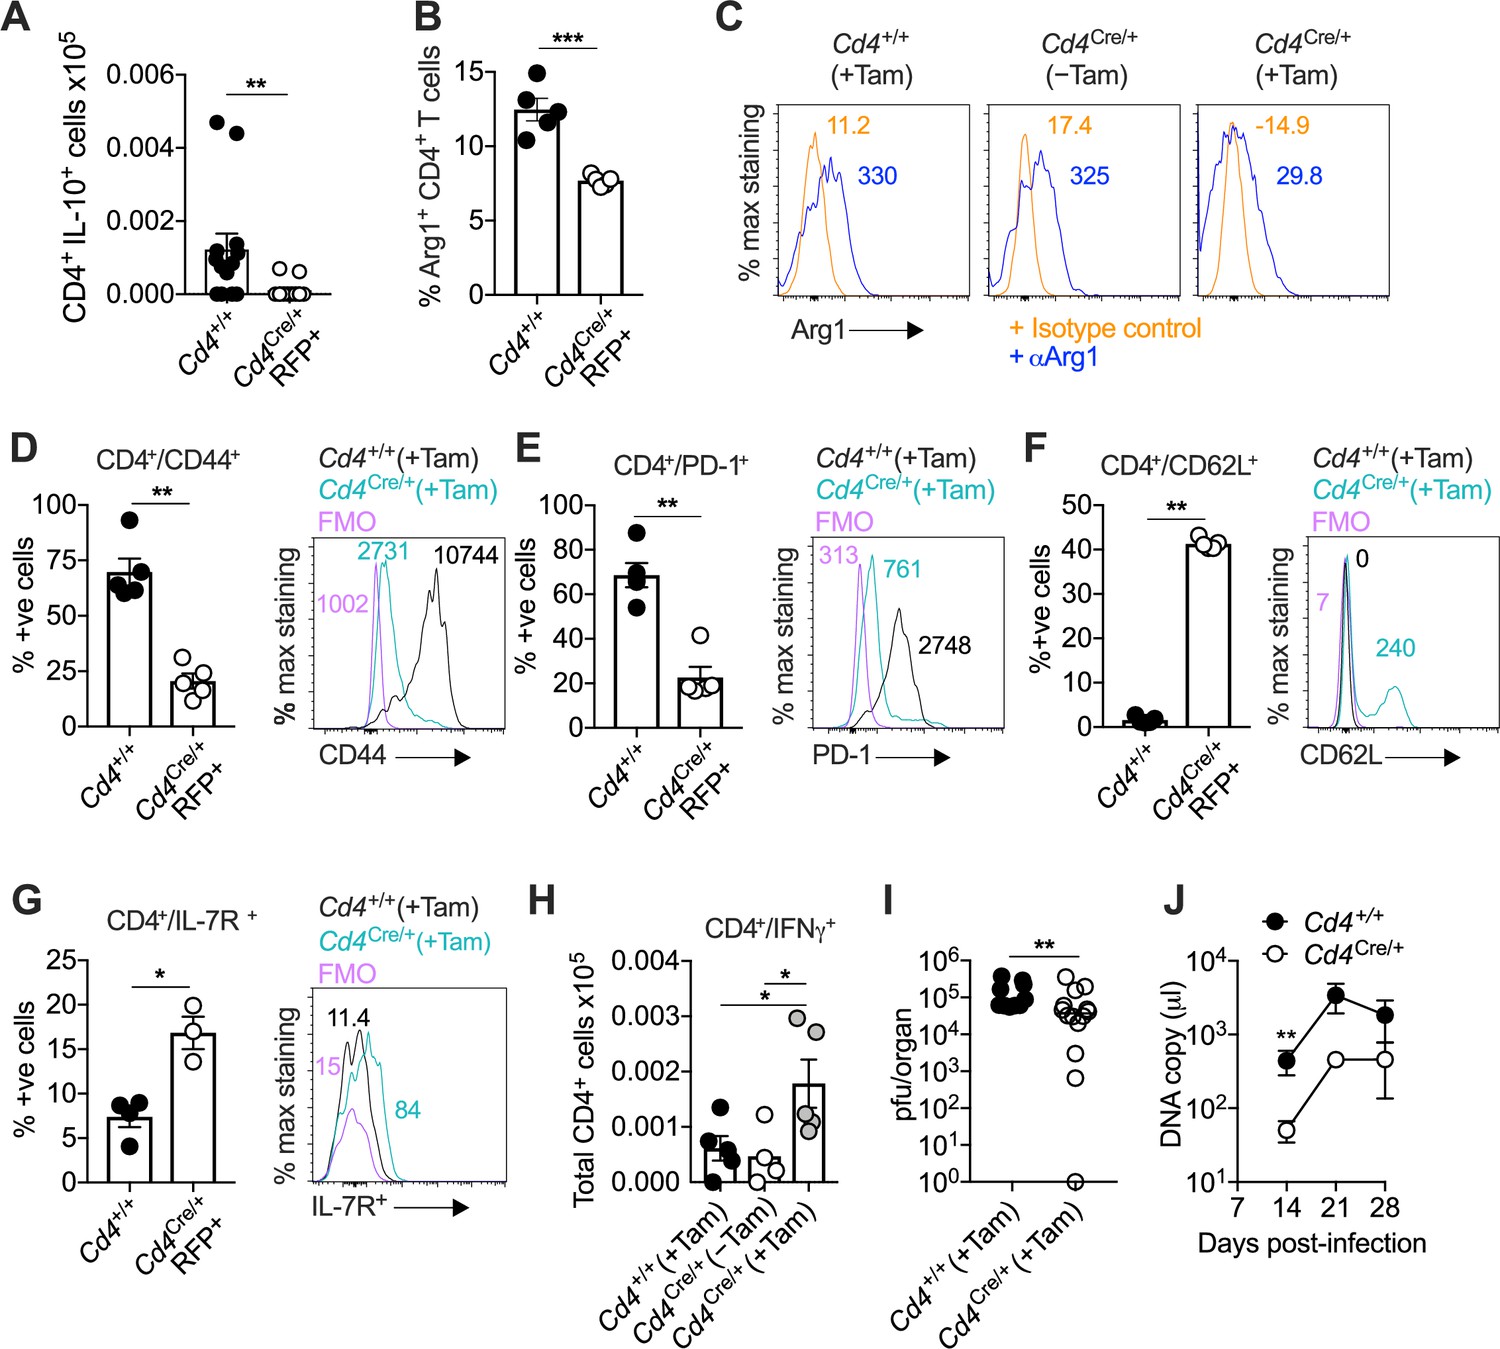
Interleukin (IL)-10-producing CD4+ T cells develop in a T-bet-dependent manner.
(A–J) Cd4+/+Tbx21flox/flox (Cd4+/+) and Cd4CreERT2/+Tbx21flox/flox (Cd4Cre/+) mice were infected with 3 × 10⁴ pfu of murine cytomegalovirus (MCMV). Tamoxifen was administered (+Tam) or withheld (−Tam) from days 7 to 12 p.i. Leukocytes were isolated from the salivary glands (SGs) on day 14 p.i. (A) MCMV-specific CD4+ T cell responses in the SGs measured using flow cytometry to detect IL-10. Immunodominant peptides were pooled for stimulation. Data are shown as mean ± standard error of the mean (SEM; n = 4–5 mice per group representing two independent experiments). **p < 0.01 (Mann–Whitney U test). Summary bar graph (B) and representative histograms (C) showing the expression of arginase-1 (Arg1) among CD4+ T cells measured via flow cytometry. Data are shown as mean ± SEM (n = 5 mice per group representing two independent experiments). ***p < 0.001 (Mann–Whitney U test). Summary bar graphs (left) and representative histograms (right) showing the expression of CD44 (D), PD-1 (E), CD62L (F), and IL-7R (G) among CD4+ T cells measured via flow cytometry. Data in (D–F) are shown as mean ± SEM (n = 5 mice per group representing two independent experiments). Data in (G) are shown as mean ± SEM (n = 3–4 mice per group representing two independent experiments). *p < 0.05, **p < 0.01 (Mann–Whitney U test). (H) MCMV-specific CD4+ T cell responses in the SGs measured using flow cytometry to detect interferon (IFN)γ. Immunodominant peptides were pooled for stimulation. Data are shown as mean ± SEM (n = 4–5 mice per group representing two independent experiments). *p < 0.05 (Mann–Whitney U test). (I) MCMV replication in SG homogenates on day 14 p.i. measured via plaque assay. Data are shown as individual points with median values (n = 10–14 mice per group pooled from three independent experiments). **p < 0.01 (Mann–Whitney U test). (J) Viral genomes in saliva on days 7, 14, 21, and 28 p.i. measured via qPCR. Data are shown as mean ± SEM (n = 5 mice per group representing two independent experiments). **p < 0.01 (Mann–Whitney U test). Data in (A–I) show all groups after the administration of tamoxifen.
-
Figure 6—source data 1
Interleukin (IL)-10-producing CD4+ T cells develop in a T-bet-dependent manner.
Source data Figure 6A: murine cytomegalovirus (MCMV)-specific CD4+ T cell responses in the salivary glands (SGs) on day 14 p.i. measured using flow cytometry to detect IL-10 (Cd4+/+Tbx21flox/flox and Cd4CreERT2/+Tbx21flox/flox mice). Source data Figure 6B: percent expression of arginase-1 (Arg1) among CD4+ T cells isolated from the SGs on day 14 p.i measured via flow cytometry (Cd4+/+Tbx21flox/flox and Cd4CreERT2/+Tbx21flox/flox mice). Source data Figure 4D–G: percent expression of CD44 (D), PD-1 (E), CD62L (F), and IL-7R (G) among CD4+ T cells isolated from SGs on day 14 p.i. measured via flow cytometry (Cd4+/+Tbx21flox/flox and Cd4CreERT2/+Tbx21flox/flox mice). Source data Figure 6H: MCMV-specific CD4+ T cell responses in the SGs on day 14 p.i. measured using flow cytometry to detect interferon (IFN)γ (Cd4+/+Tbx21flox/flox and Cd4CreERT2/+Tbx21flox/flox mice). Source data Figure 6I: MCMV replication in SG homogenates (pfu/organ) on day 14 p.i. measured via plaque assay (Cd4+/+Tbx21flox/flox and Cd4CreERT2/+Tbx21flox/flox mice). Source data Figure 6J: viral genomes in saliva (DNA copies/μl) on days 14, 21, and 28 p.i. measured via qPCR (Cd4+/+Tbx21flox/flox and Cd4CreERT2/+Tbx21flox/flox mice).
- https://cdn.elifesciences.org/articles/79165/elife-79165-fig6-data1-v1.xlsx
Author response image 1

Granzyme B protein expression by salivary gland CD44 is not detectable by flow cytometry.
Granzyme B and Thy1.1 expression by salivary gland CD4 T cells was assessed by flow cytometry 14 days after MCMV infection of 10-Bit mice.
Author response image 2

Author response image 3

Eomes expression by Thy1.
1+ and Thy1.1- CD4+ T cells 14 days post-MCMV infection.
Additional files
Download links
A two-part list of links to download the article, or parts of the article, in various formats.
Downloads (link to download the article as PDF)
Open citations (links to open the citations from this article in various online reference manager services)
Cite this article (links to download the citations from this article in formats compatible with various reference manager tools)
Inhibitory IL-10-producing CD4+ T cells are T-bet-dependent and facilitate cytomegalovirus persistence via coexpression of arginase-1
eLife 12:e79165.
https://doi.org/10.7554/eLife.79165


