Analysis of allelic cross-reactivity of monoclonal IgG antibodies by a multiplexed reverse FluoroSpot assay
- Centre for Medical Parasitology, Department of Immunology and Microbiology, Faculty of Health and Medical Sciences, University of Copenhagen, Denmark
- West African Centre for Cell Biology of Infectious Pathogens, Department of Biochemistry, Cell and Molecular Biology, University of Ghana, Ghana
- Department of Immunology, Noguchi Memorial Institute for Medical Research, University of Ghana, Ghana
- Mabtech AB, Sweden
- Department of Molecular Biosciences, The Wenner-Gren Institute, Sweden
- Department of Infectious Diseases, Rigshospitalet, Denmark
Figures
Figure 1 with 4 supplements
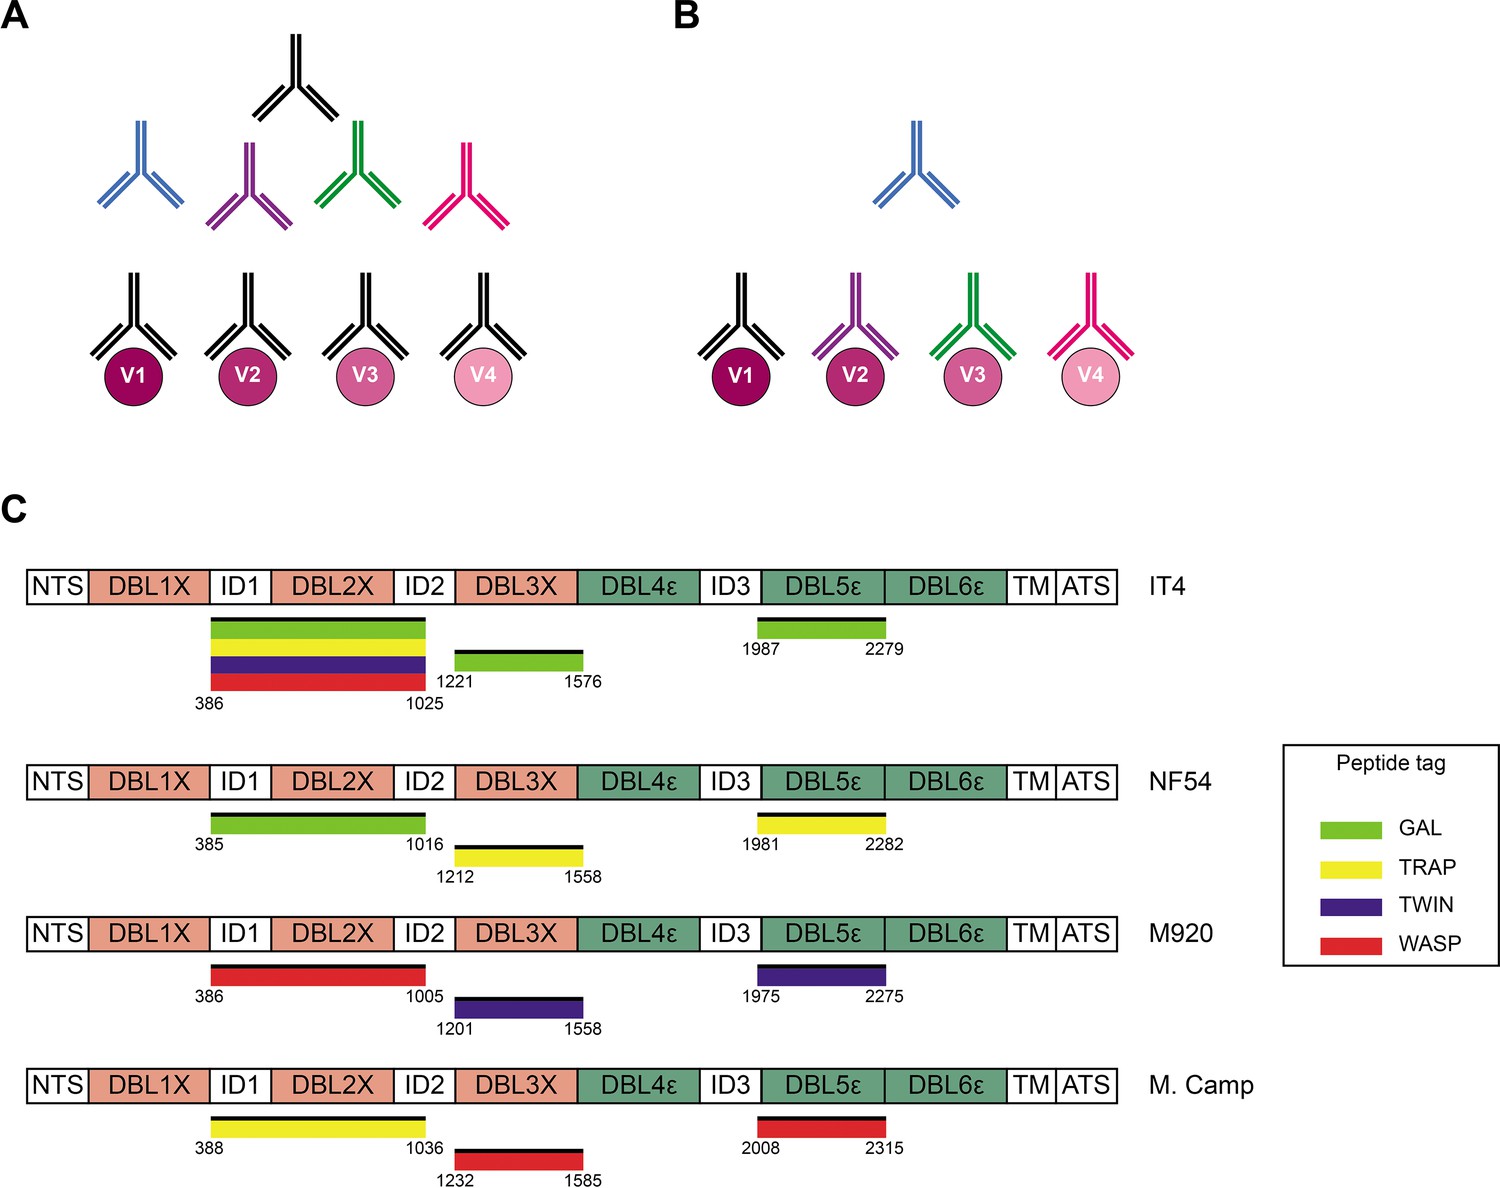
Cross-reactivity in the VAR2CSA-specific response present in serum.
(A) Schematic representing ‘true’ cross-reactivity where an epitope shared among different VAR2CSA variants (V1–V4) is recognized by a single monoclonal antibody (colored in black) present in the polyclonal serum. (B) In ‘apparent’ cross-reactivity a VAR2CSA polymorphic epitope is recognized by several different variant-specific monoclonal antibodies present in serum. (C) Schematic structure of the VAR2CSA variants included in this study, depicting the N-terminal segment (NTS), the six Duffy binding-like (DBL) domains, the interdomain (ID) regions, the transmembrane domain (TM), and the intracellular acidic terminal segment (ATS). The relevant domain boundaries are indicated with amino acid positions under each schematic. The peptide-tagged recombinant domains are also indicated under the sequence with the corresponding fluorophore colors used for detection in the reversed FluoroSpot assay.
Figure 1—figure supplement 1
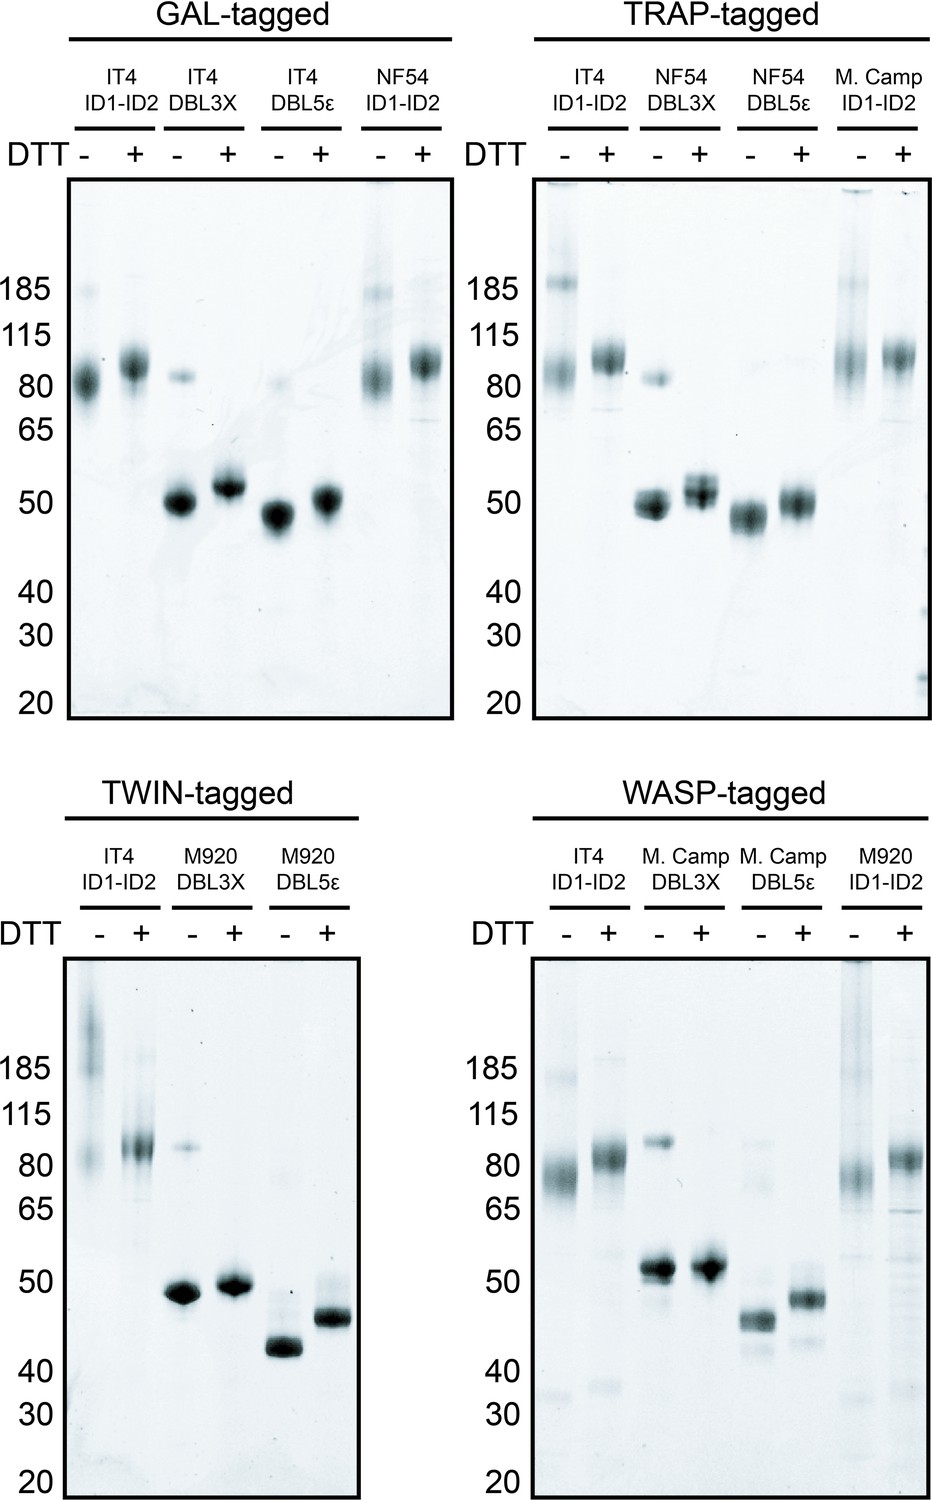
Instant blue-stained gels of purified, recombinant peptide-tagged VAR2CSA domains under reducing (+DTT) and non-reducing conditions (−DTT).
-
Figure 1—figure supplement 1—source data 1
Uncropped images used to build Figure 1—figure supplement 1.
The dashed lines represent the portions of the images used for the final figure.
- https://cdn.elifesciences.org/articles/79245/elife-79245-fig1-figsupp1-data1-v1.jpg
-
Figure 1—figure supplement 1—source data 2
Original picture file for the instant blue-stained gel of the purified recombinant GAL-tagged VAR2CSA domains.
- https://cdn.elifesciences.org/articles/79245/elife-79245-fig1-figsupp1-data2-v1.tif
-
Figure 1—figure supplement 1—source data 3
Original picture file for the instant blue-stained gel of the purified recombinant TRAP-tagged VAR2CSA domains.
- https://cdn.elifesciences.org/articles/79245/elife-79245-fig1-figsupp1-data3-v1.tif
-
Figure 1—figure supplement 1—source data 4
Original picture file for the instant blue-stained gel of the purified recombinant TWIN-tagged VAR2CSA domains.
- https://cdn.elifesciences.org/articles/79245/elife-79245-fig1-figsupp1-data4-v1.tif
-
Figure 1—figure supplement 1—source data 5
Original picture file for the instant blue-stained gel of the purified recombinant WASP-tagged VAR2CSA domains.
- https://cdn.elifesciences.org/articles/79245/elife-79245-fig1-figsupp1-data5-v1.tif
Figure 1—figure supplement 2
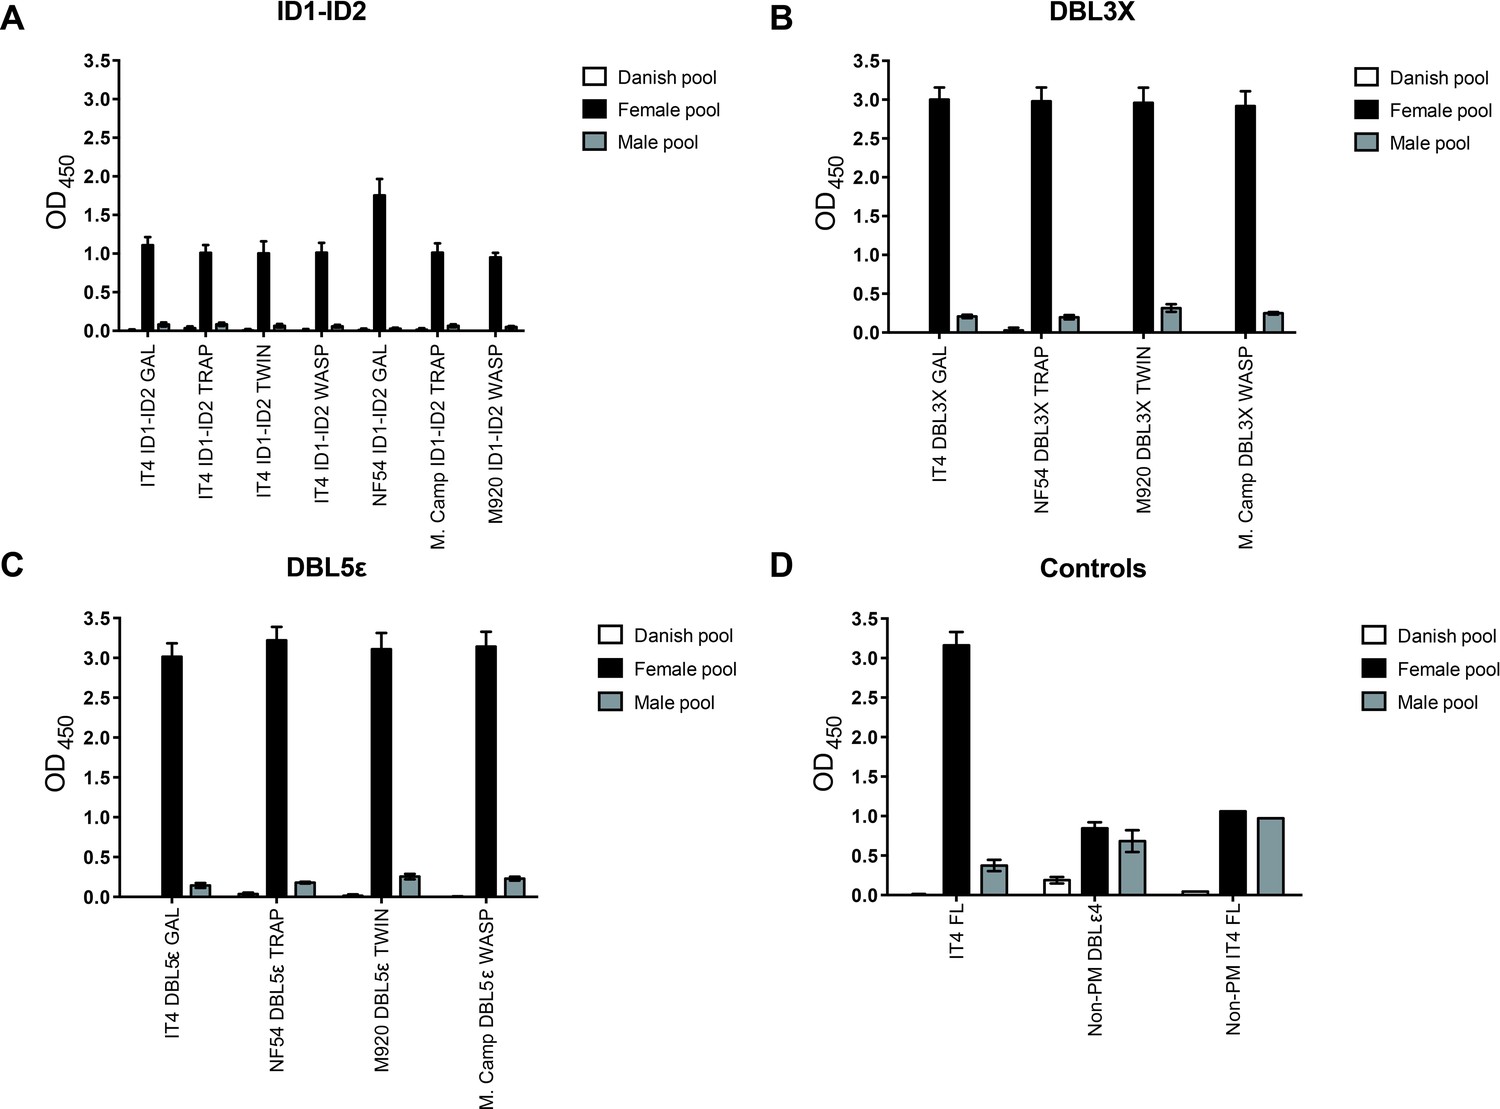
IgG-binding to recombinant VAR2CSA domains by ELISA.
IgG binding of malaria-exposed (female and male pool) and malaria-naïve (Danish pool) donors to immobilized recombinant proteins: (A) ID1-ID2, (B) DBL3X, (C) DBL5ε, and (D) control antigens. Means and standard deviations of data from three independent experiments are shown. ELISA, enzyme-linked immunosorbent assay.
Figure 1—figure supplement 3
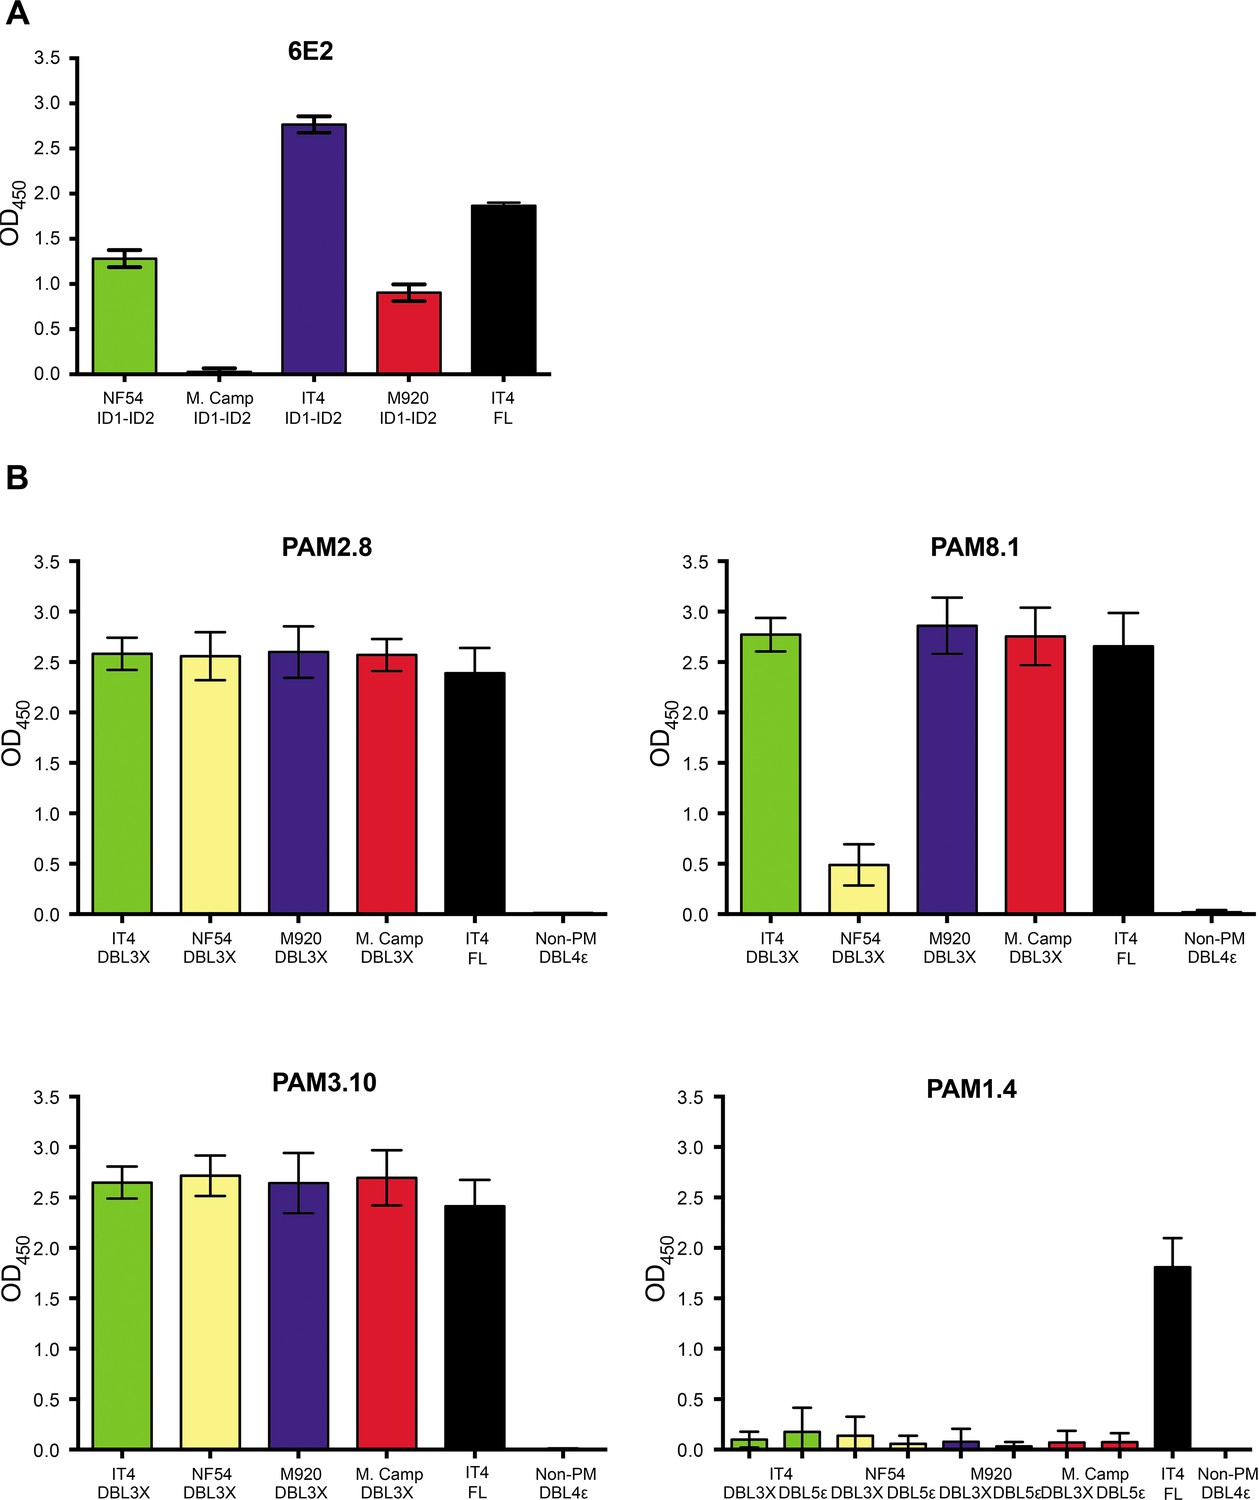
Antibody binding to recombinant VAR2CSA domains by ELISA.
(A) 6E2 binding to the four ID1-ID2 variants (NF54, M. Camp, IT4, and M920) and to full-length IT4 VAR2CSA. (B) PAM2.8, PAM8.1, PAM3.10, and PAM1.4 (control) binding to the four DBL3X and DBL5ε variants (IT4, NF54, M920 and M. Camp) and to full-length IT4 VAR2CSA. Means and standard deviations of data from three independent experiments are shown. ELISA, enzyme-linked immunosorbent assay.
Figure 1—figure supplement 4
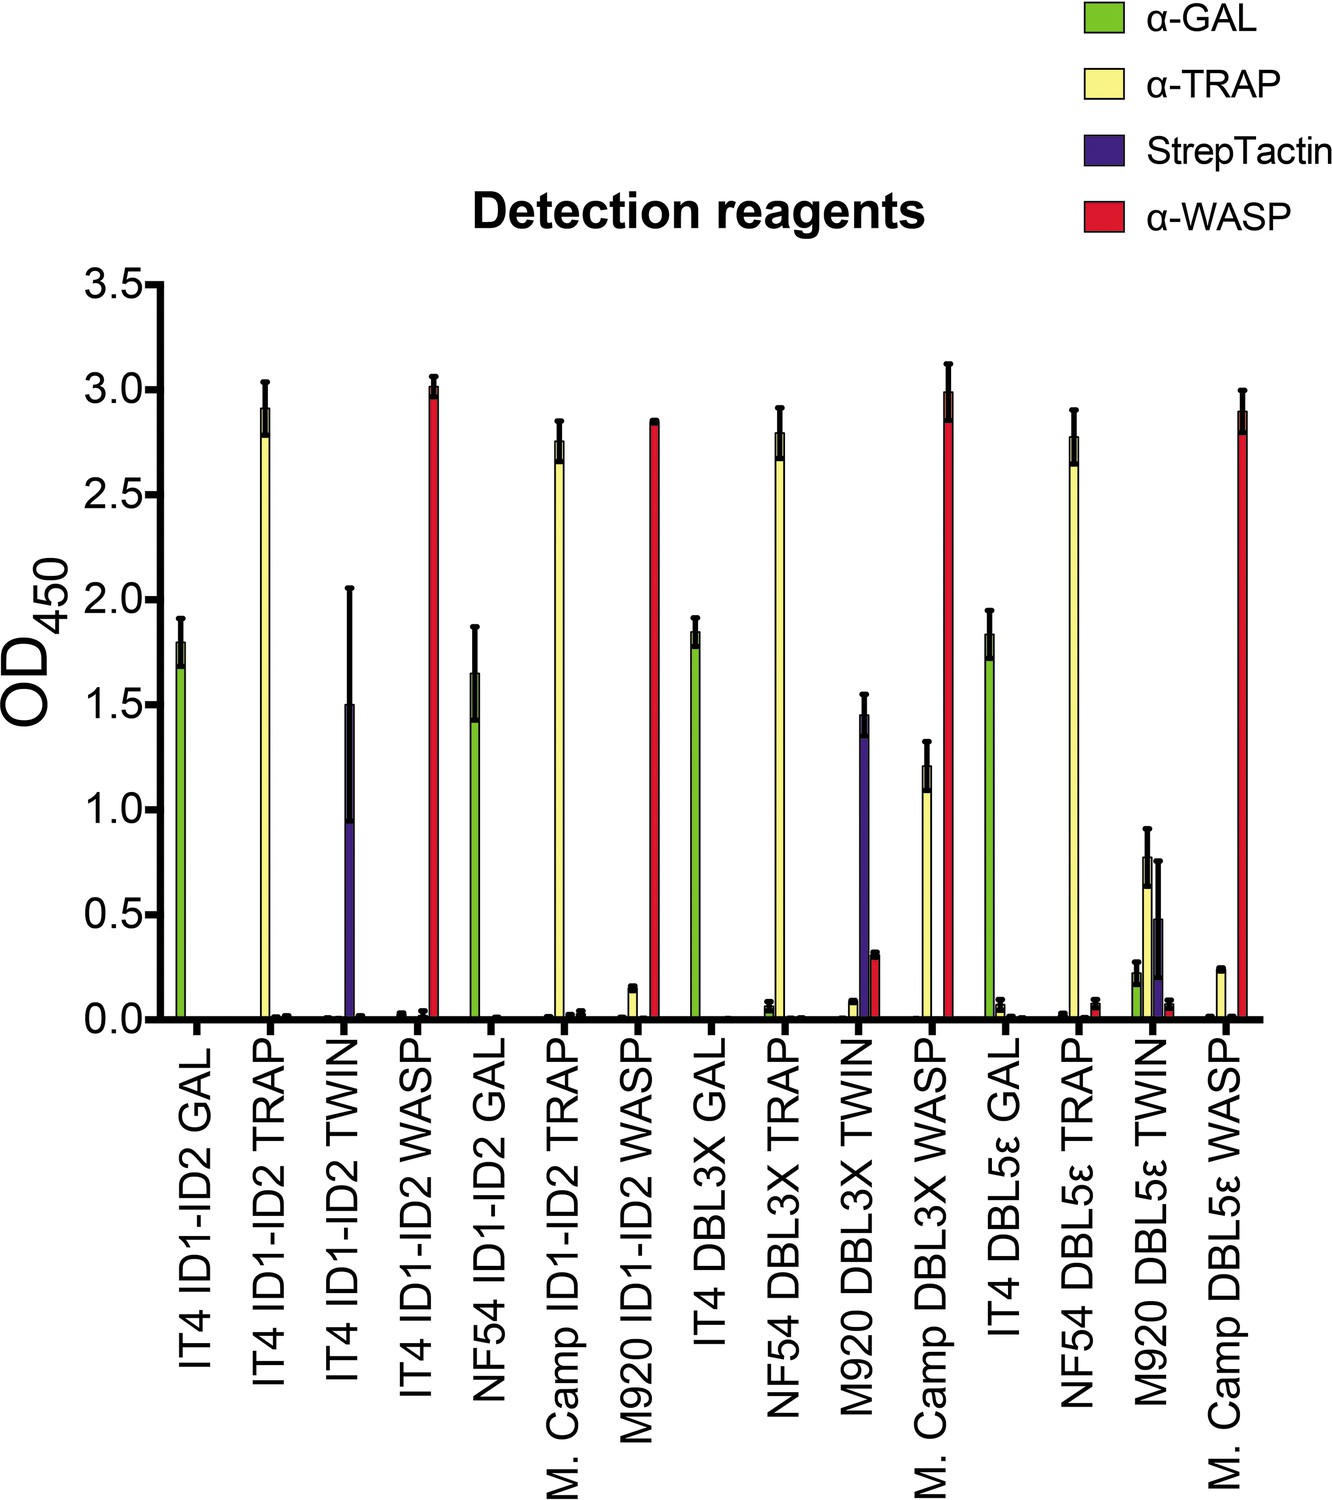
FluoroSpot detection reagents binding to recombinant VAR2CSA domains by ELISA.
Means and standard deviations of data from three independent experiments are shown. ELISA, enzyme-linked immunosorbent assay.
Figure 2 with 2 supplements

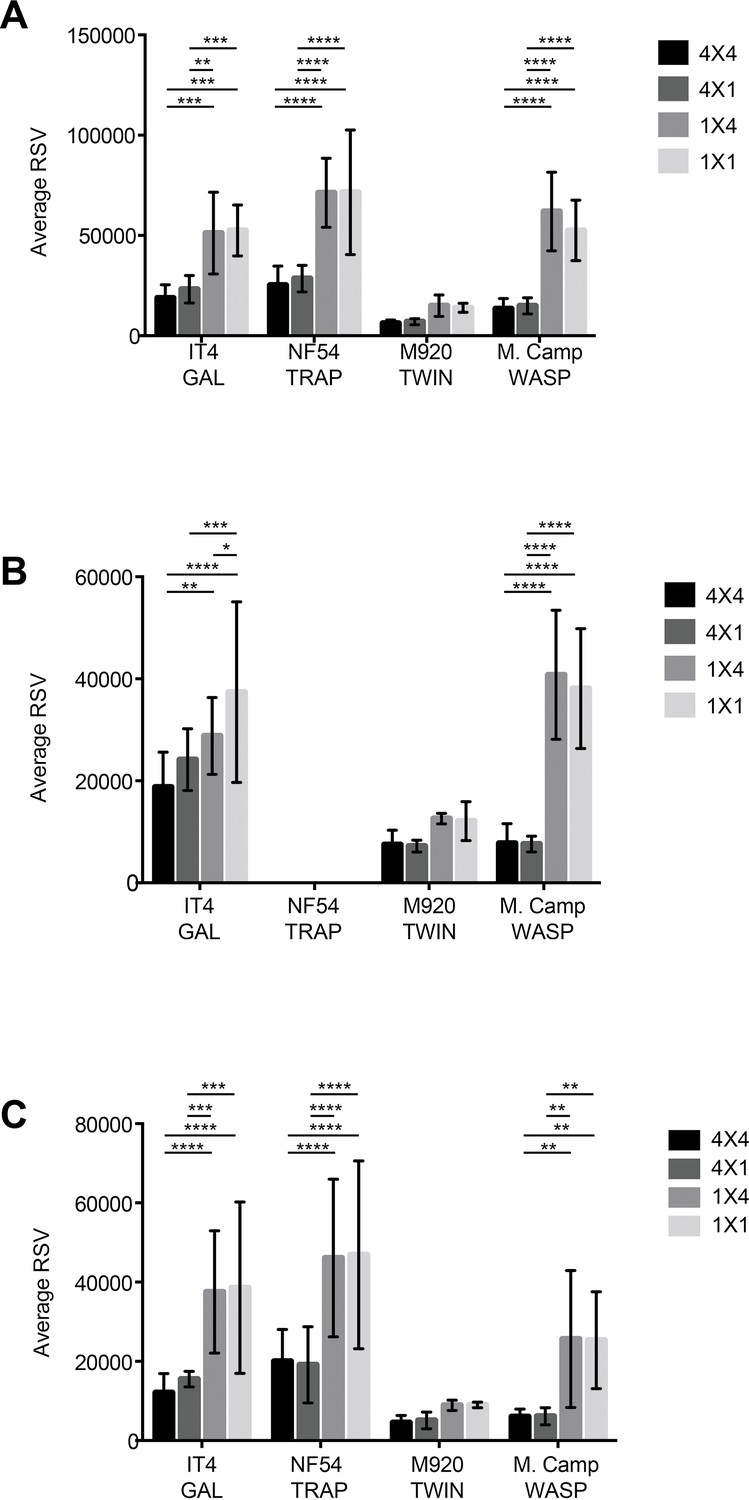
FluoroSpot analysis of the 6E2 monoclonal antibody against the IT4 ID1-ID2 domain.
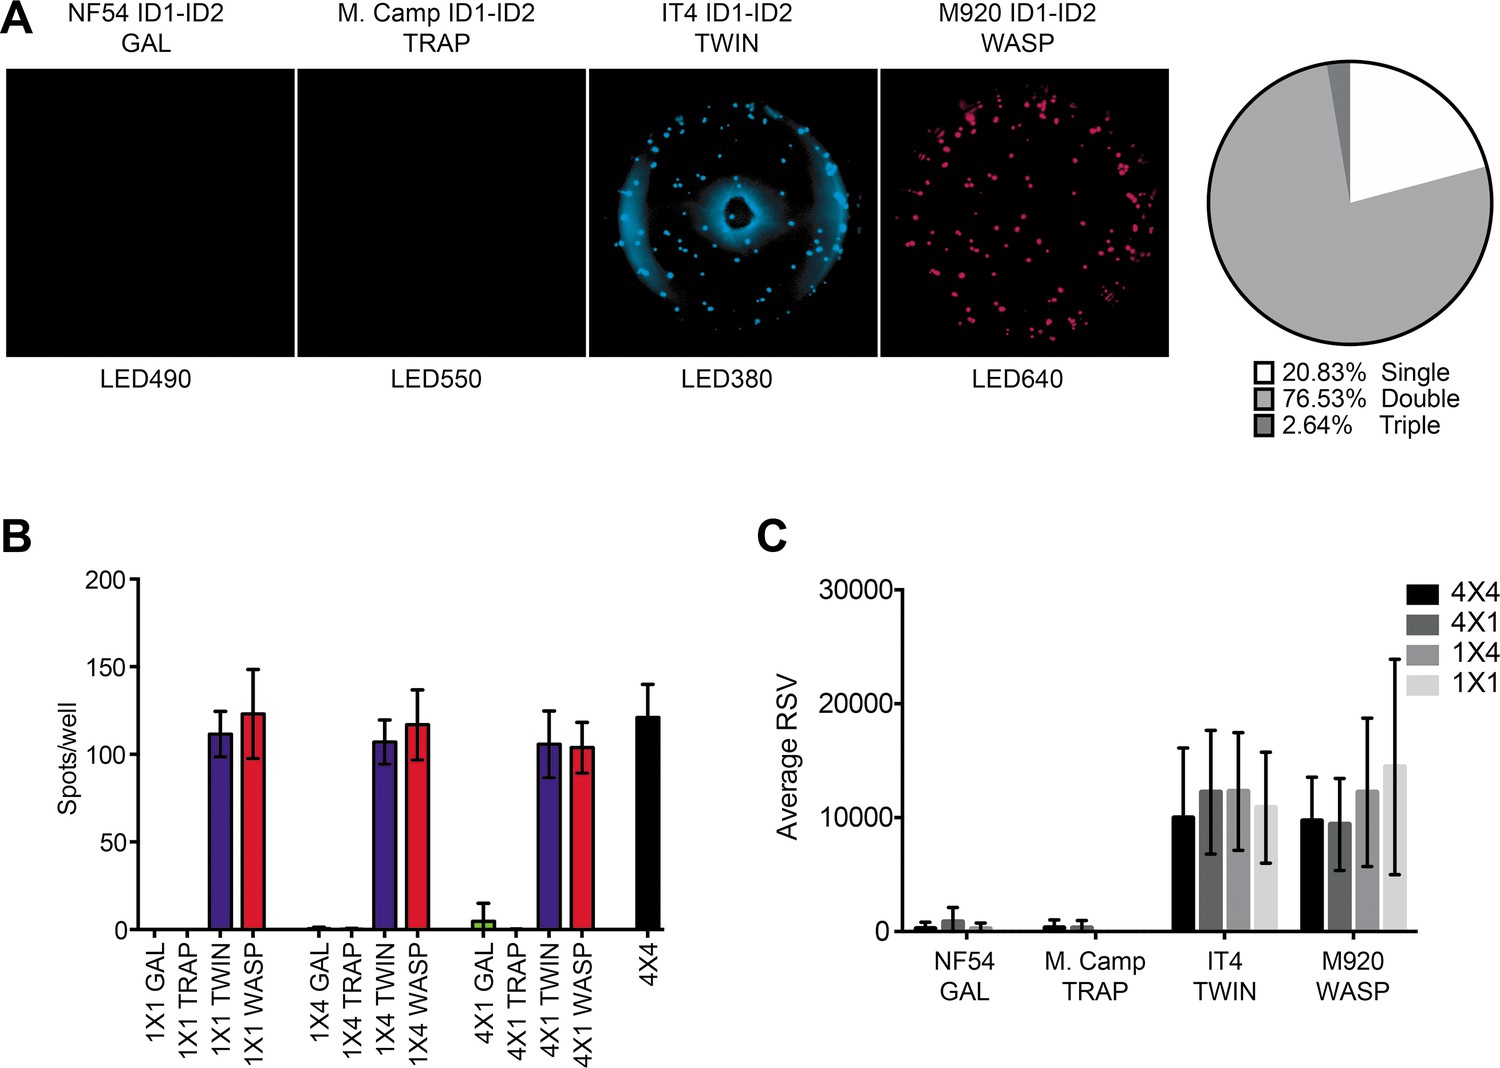
Captured antibodies secreted by 6E2 cells were incubated with peptide-tagged IT4 ID1-ID2 domains and detected using peptide-specific detection reagents. (A) Different antigen×detection reagent combinations were tested (1×1, 1×4, 4×1, and 4×4) and the number of spots/well were counted. (B) Images acquired in each detection channel corresponding to each detection reagent are presented (LED490, LED550, LED380, and LED640) for the spots detected in the 4×4 combination (black bar in (A)). Percentages of single, double, triple, and quadruple positive spots are also presented. (C) Average relative spot volume (RSV) for all the positive spots per antigen was determined and compared between the assay combinations. Means and standard deviations of data from three independent experiments are shown.
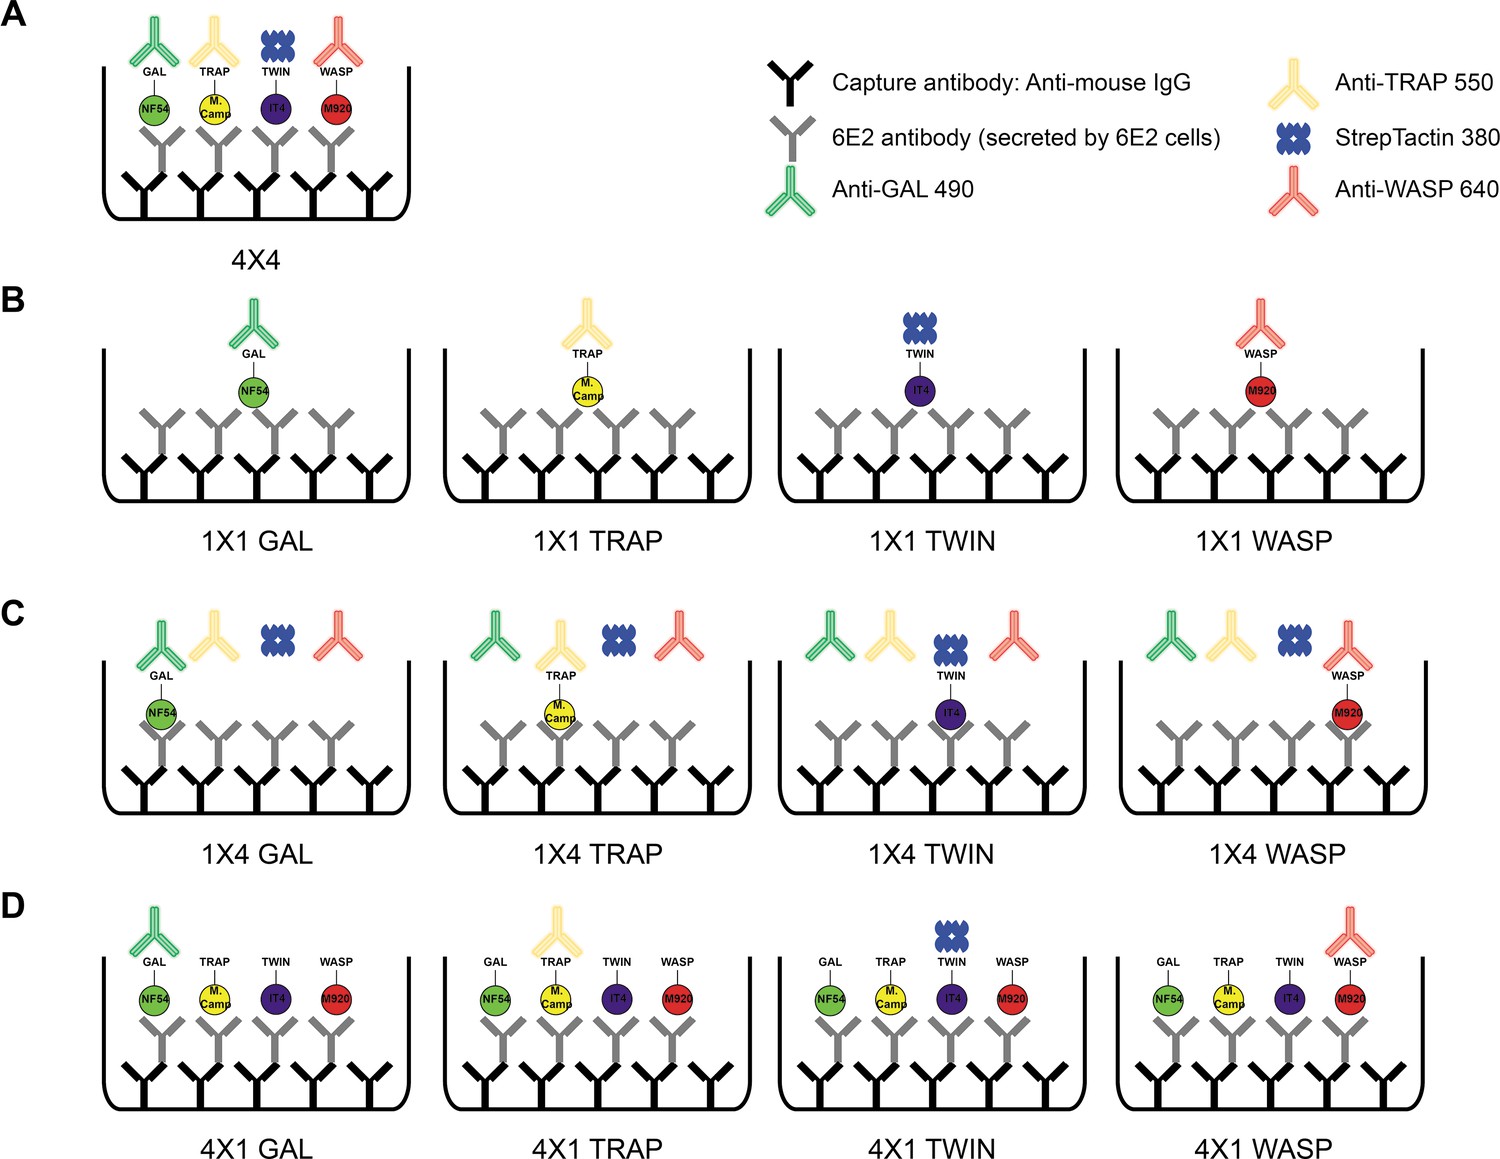
Figure 2—figure supplement 1
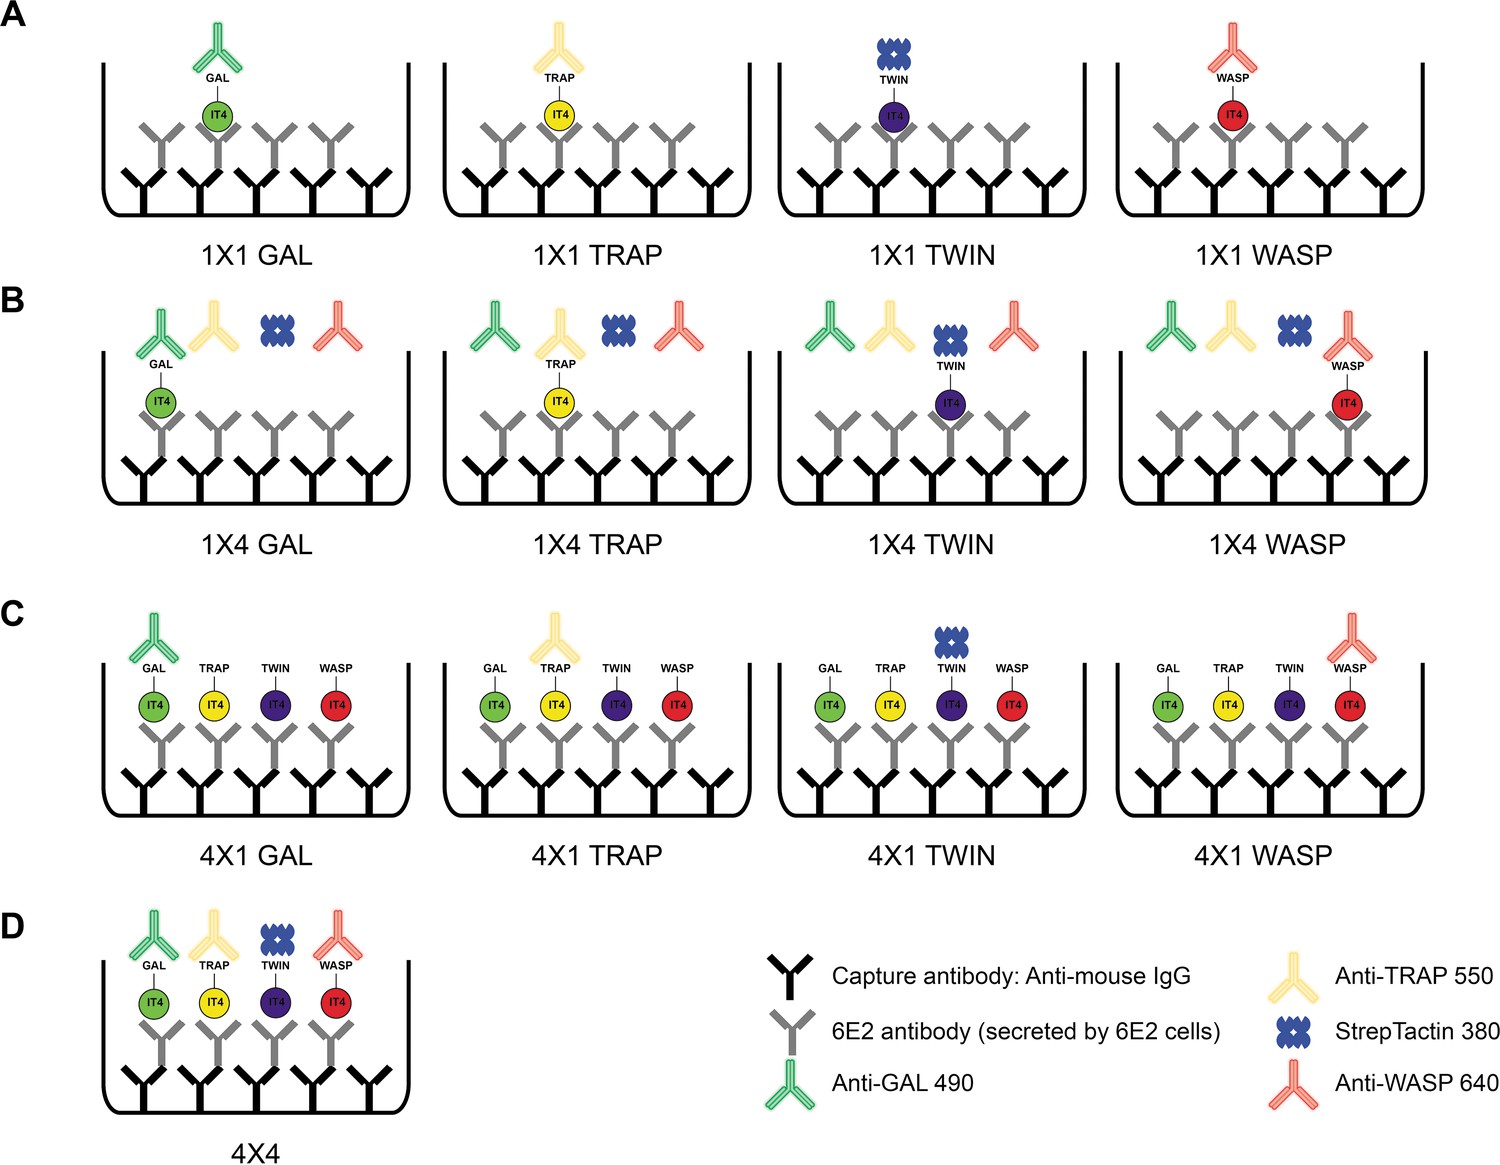
Schematic showing the different antigen×detection reagent combinations tested, corresponding to the data presented in Figure 2.
(A) 1×1 (B) 1×4, (C) 4×1, and (D) 4×4.
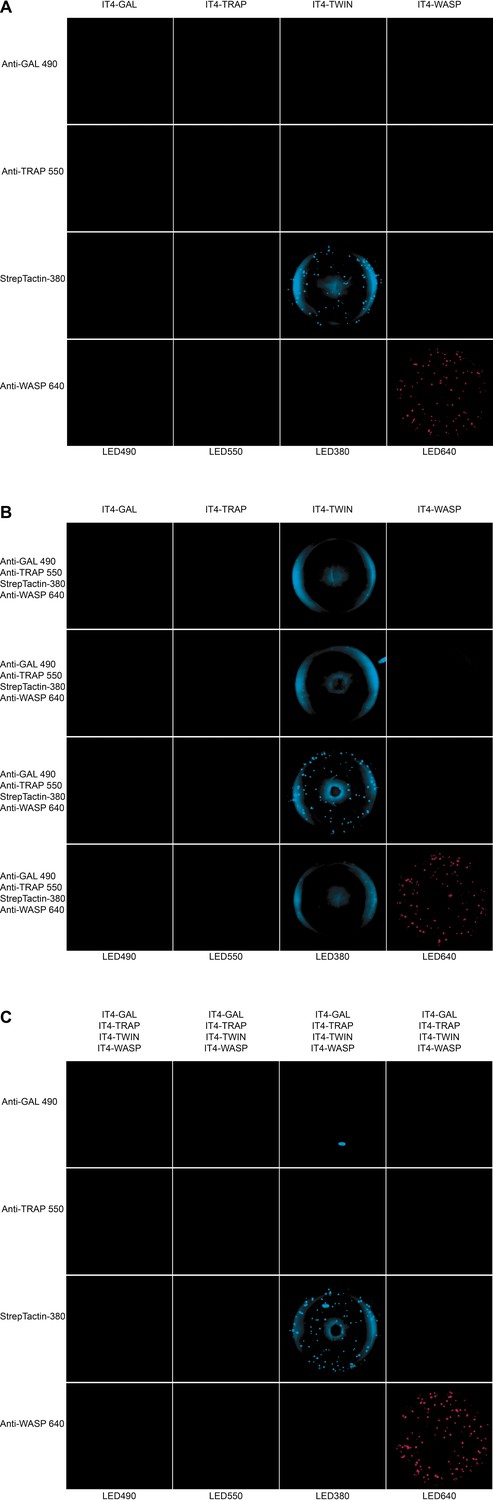
Figure 2—figure supplement 2
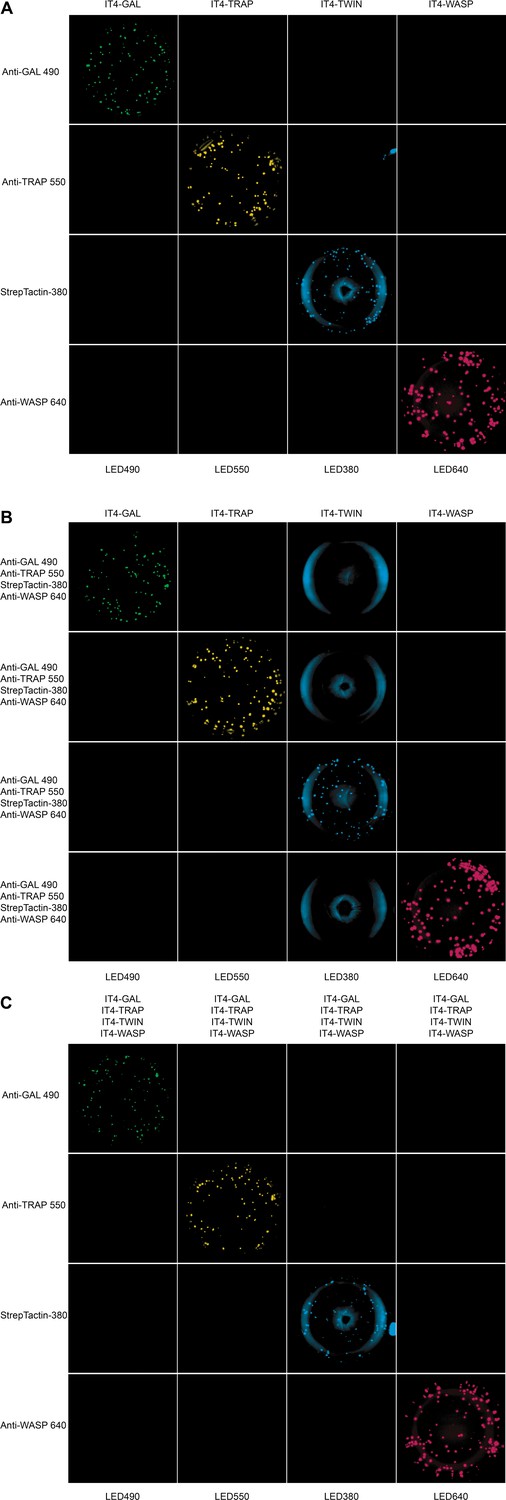
Well images for the different antigen×detection reagent combinations tested, corresponding to the schematic presented in Figure 2—figure supplement 1 and the data presented in Figure 2.
(A) 1×1, (B) 1×4, and (C) 4×1.
Figure 3 with 2 supplements
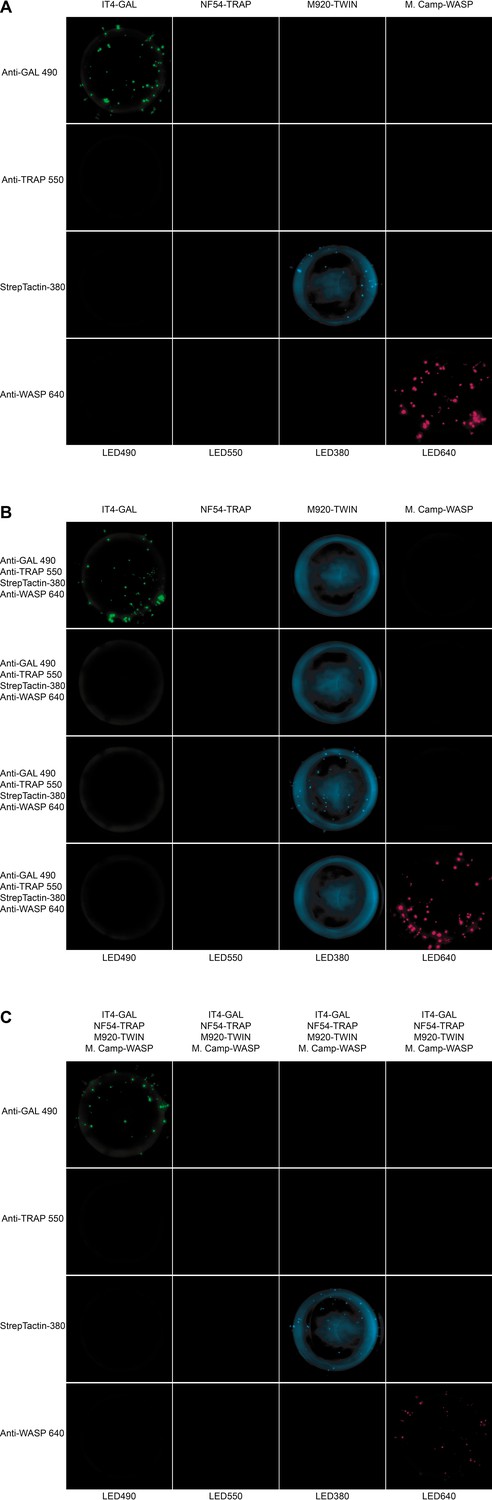
FluoroSpot analysis of the 6E2 monoclonal antibody against four peptide-tagged ID1-ID2 domain variants (NF54, M.Camp, IT4, and M920).
(A) Captured 6E2 antibodies secreted by 6E2 cells were incubated with all four peptide-tagged ID1-ID2 domain variants and detected using the four peptide-specific detection reagents (multiplex 4×4). Images acquired in each detection channel are presented (LED490, LED550, LED380, and LED640) together with the percentages of single, double, triple, and quadruple positive spots. (B) Different antigen ×detection reagent combinations were tested (1×1, 1×4, 4×1, and 4×4) and the number of spots/well were counted. (C) Average relative spot volume (RSV) for all the positive spots per antigen was determined and compared between the assay combinations. Means and standard deviations of data from three independent experiments are shown.
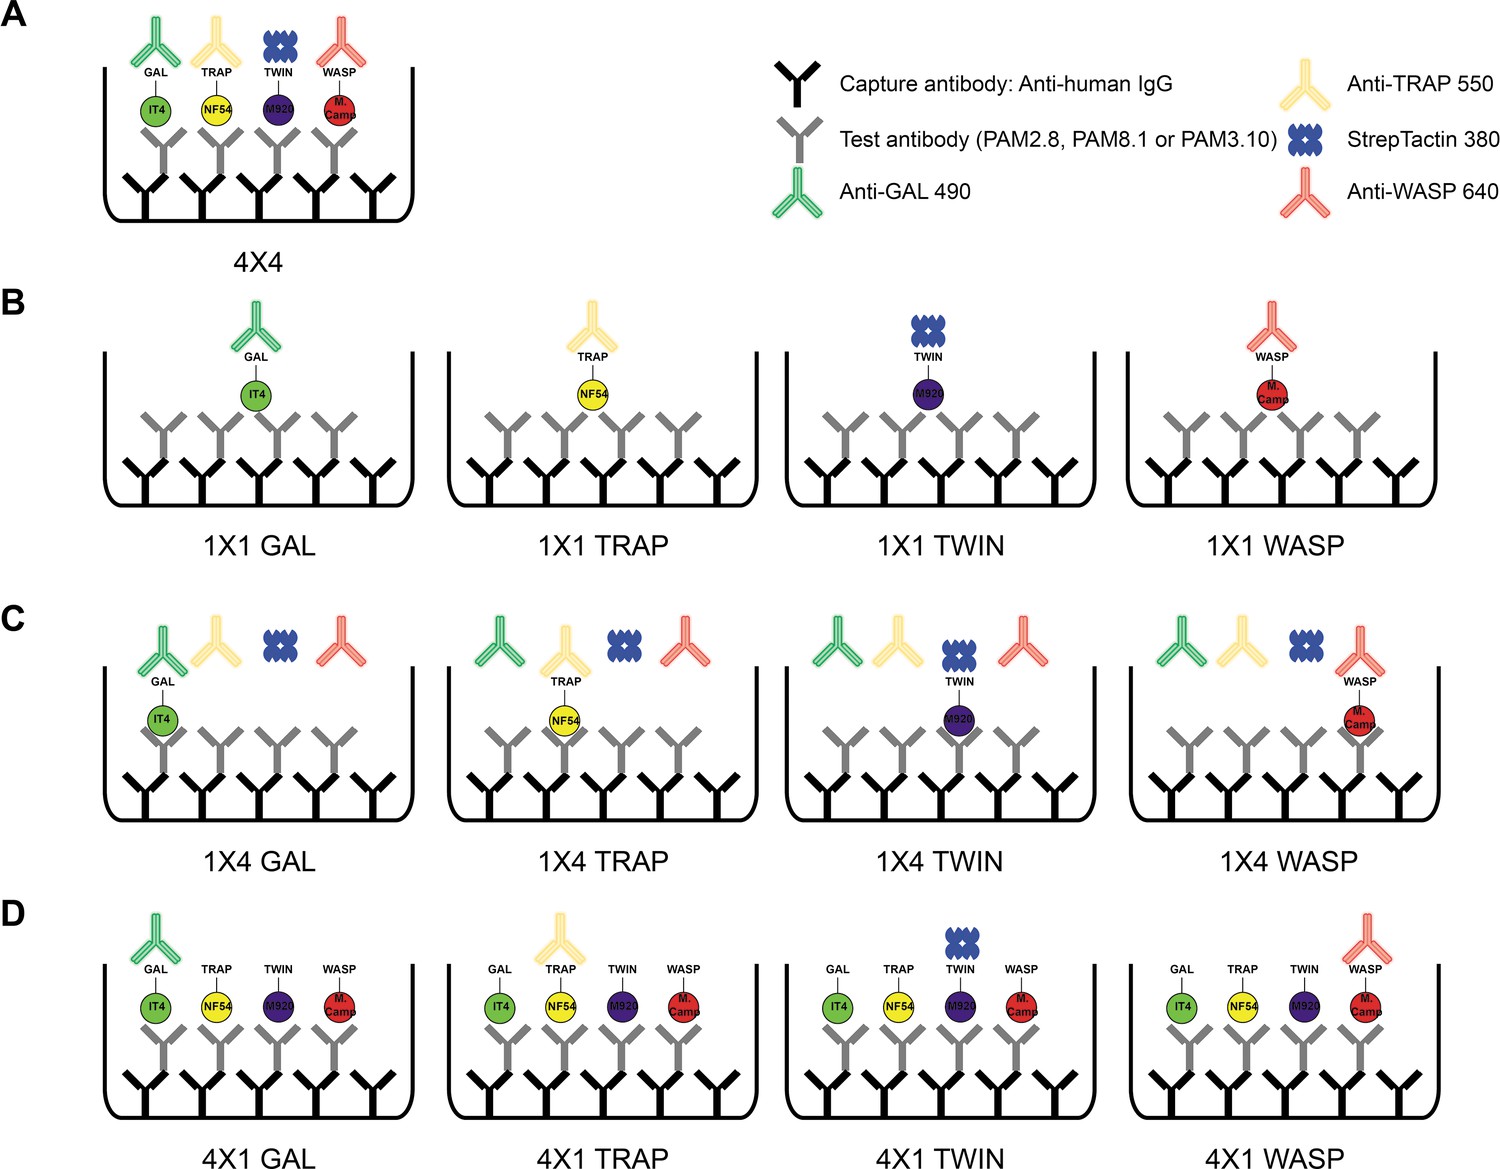
Figure 3—figure supplement 1
Schematic showing the different antigen×detection reagent combinations tested, corresponding to the data presented in Figure 3.
(A) 4×4, (B) 1×1, (C) 1×4, and (D) 4×1.
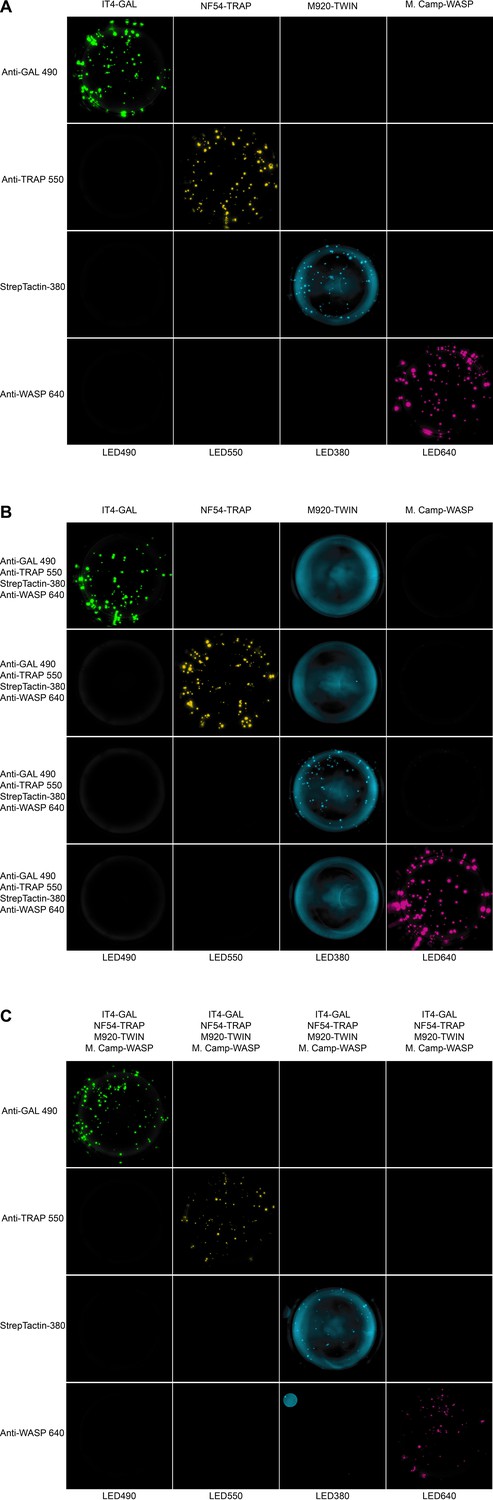
Figure 3—figure supplement 2
Well images for the different antigen×detection reagent combinations tested, corresponding to the schematic presented in Figure 3—figure supplement 1 and the data presented in Figure 3.
(A) 1×1, (B) 1×4, and (C) 4×1.
Figure 4 with 5 supplements

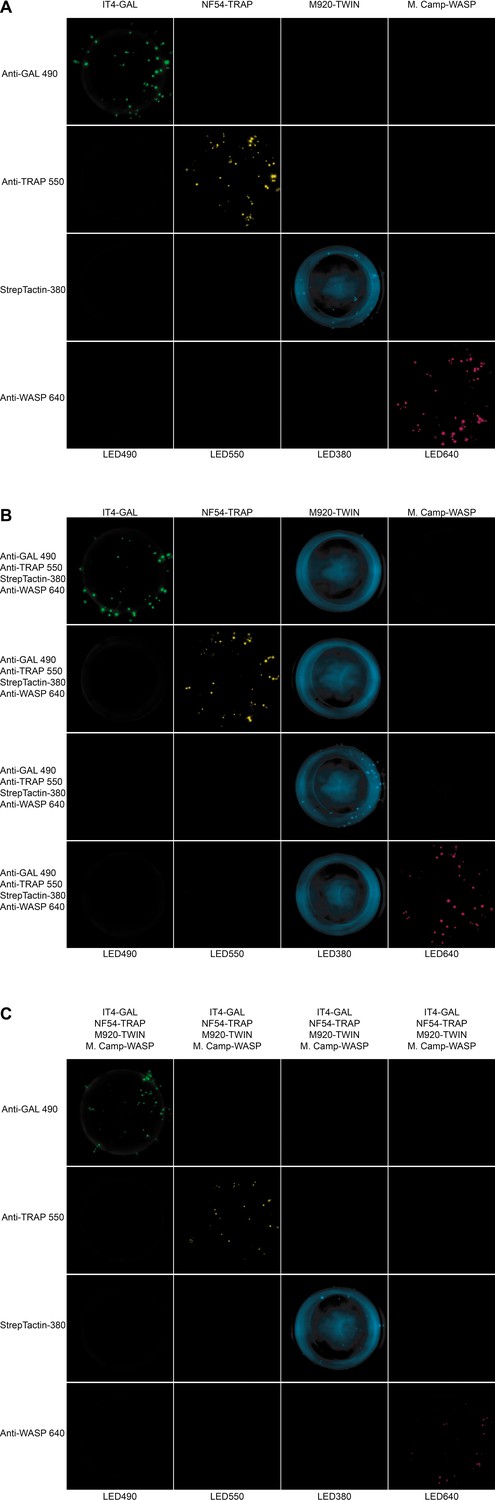
FluoroSpot analysis of the VAR2CSA specific antibodies PAM2.8, PAM8.1, and PAM3.10 against four peptide-tagged DBL3X and DBL5ε domain variants (IT4, NF54, M920, and M.Camp).
Captured antibodies secreted by the corresponding EBV-immortalized cell lines were incubated with all four peptide-tagged DBL3X (PAM2.8 and PAM8.1) or DBL5ε (PAM3.10) domain variants and detected using the four peptide-specific detection reagents (multiplex 4×4). (A) PAM2.8, (B) PAM8.1, and (C) PAM3.10. Images acquired in each detection channel are presented (LED490, LED550, LED380, and LED640) together with the percentages of single, double, triple, and quadruple positive spots.
Figure 4—figure supplement 1
Schematic showing the different antigen×detection reagent combinations tested (A) 4×4 (corresponding to the data presented in Figure 4), (B) 1×1, (C) 1×4, and (D) 4×1.
Figure 4—figure supplement 2
Well images for the different antigen×detection reagent combinations tested for PAM2.8, corresponding to the schematic presented in Figure 4—figure supplement 1.
(A) 1×1, (B) 1×4, and (C) 4×1.
Figure 4—figure supplement 3
Well images for the different antigen×detection reagent combinations tested for PAM8.1, corresponding to the schematic presented in Figure 4—figure supplement 1.
(A) 1×1, (B) 1×4, and (C) 4×1.
Figure 4—figure supplement 4
Well images for the different antigen×detection reagent combinations tested for PAM3.10, corresponding to the schematic presented in Figure 4—figure supplement 1.
(A) 1×1, (B) 1×4, and (C) 4×1.
Figure 4—figure supplement 5
Comparison of the average relative spot volume (RSV) for all the positive spots per antigen between the assay combinations for (A) PAM 2.8, (B) PAM8.1, and (C) PAM3.10.
Figure 5 with 2 supplements
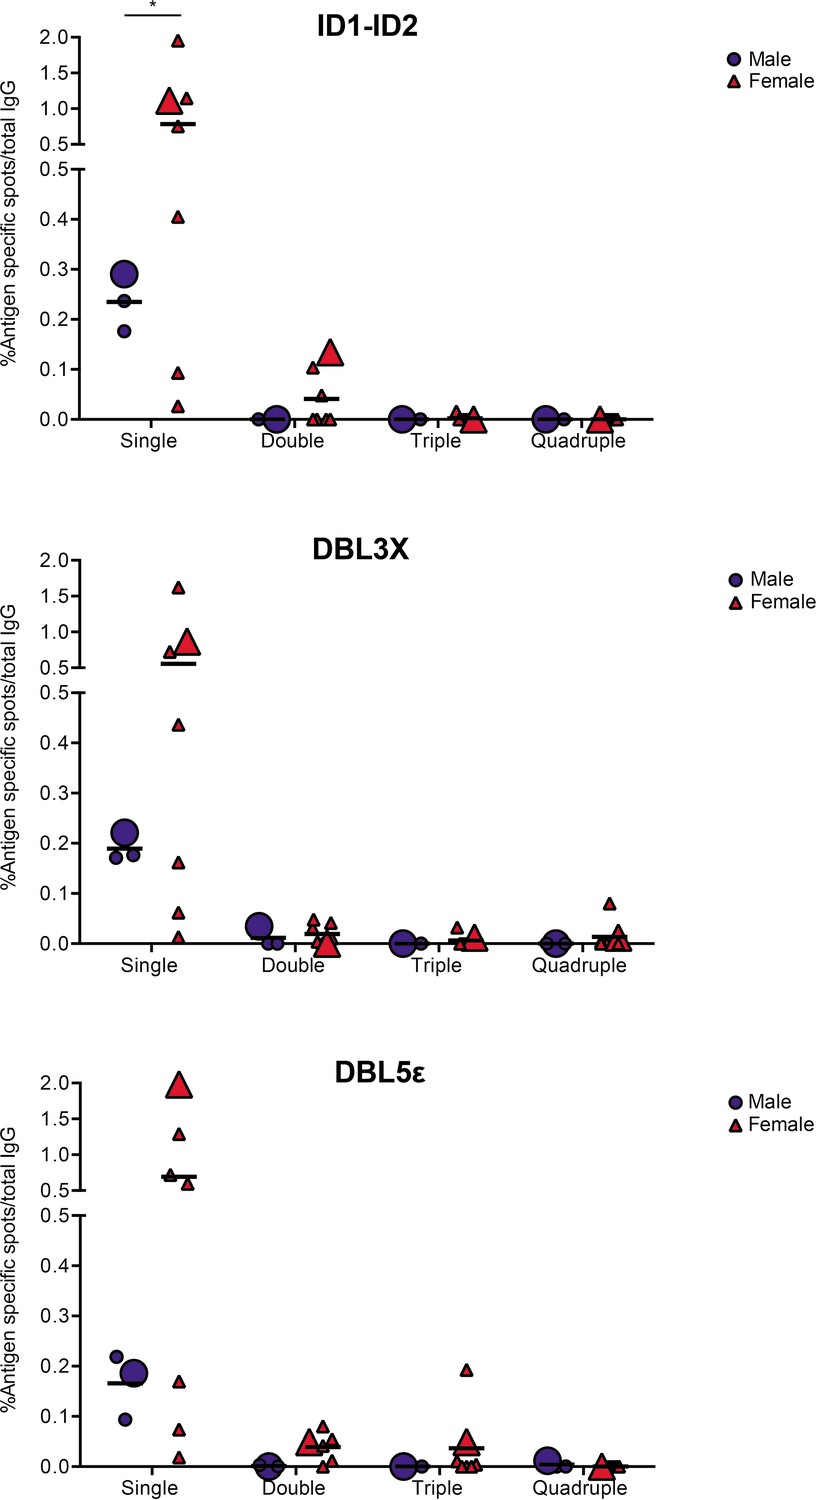
VAR2CSA specific responses in malaria-exposed Ghanaian donors against four ID1-ID2 (A), DBL3X (B), and DBL5ε (C) variants tested simultaneously.
The scatter dot plots depict the percentages of antigen specific spots/total IgG secreting cells for each individual donor tested discriminating variant specific (single-coloured) and cross-reactive (double-, triple-, and quadruple-positive) spots. Female and male donors are compared highlighting (with larger symbols) one representative donor for each group.
Figure 5—figure supplement 1
Images acquired in each detection channel are presented (LED490, LED550, LED380, and LED640) for the two representative donors highlighted in Figure 5.
DC19: malaria exposed male donor and MK601: malaria exposed female donor.
Figure 5—figure supplement 2
Comparison of number spots/well (A) and average RSV (B) for each of the four VAR2CSA variants and three domains tested, either in a 4×4 (circles) or a 1×1 (triangles) configuration.
RSV, relative spot volume.
Additional files
-
Supplementary file 1
List of primers used for VAR2CSA domain cloning.
- https://cdn.elifesciences.org/articles/79245/elife-79245-supp1-v1.xlsx
-
MDAR checklist
- https://cdn.elifesciences.org/articles/79245/elife-79245-mdarchecklist1-v1.docx
Download links
A two-part list of links to download the article, or parts of the article, in various formats.
Downloads (link to download the article as PDF)
Open citations (links to open the citations from this article in various online reference manager services)
Cite this article (links to download the citations from this article in formats compatible with various reference manager tools)
Analysis of allelic cross-reactivity of monoclonal IgG antibodies by a multiplexed reverse FluoroSpot assay
eLife 11:e79245.
https://doi.org/10.7554/eLife.79245


