Variable paralog expression underlies phenotype variation
- Department of Craniofacial Biology, University of Colorado Anschutz Medical Campus, United States
- Department of Surgery, University of Colorado Anschutz Medical Campus, United States
Figures
Figure 1 with 1 supplement
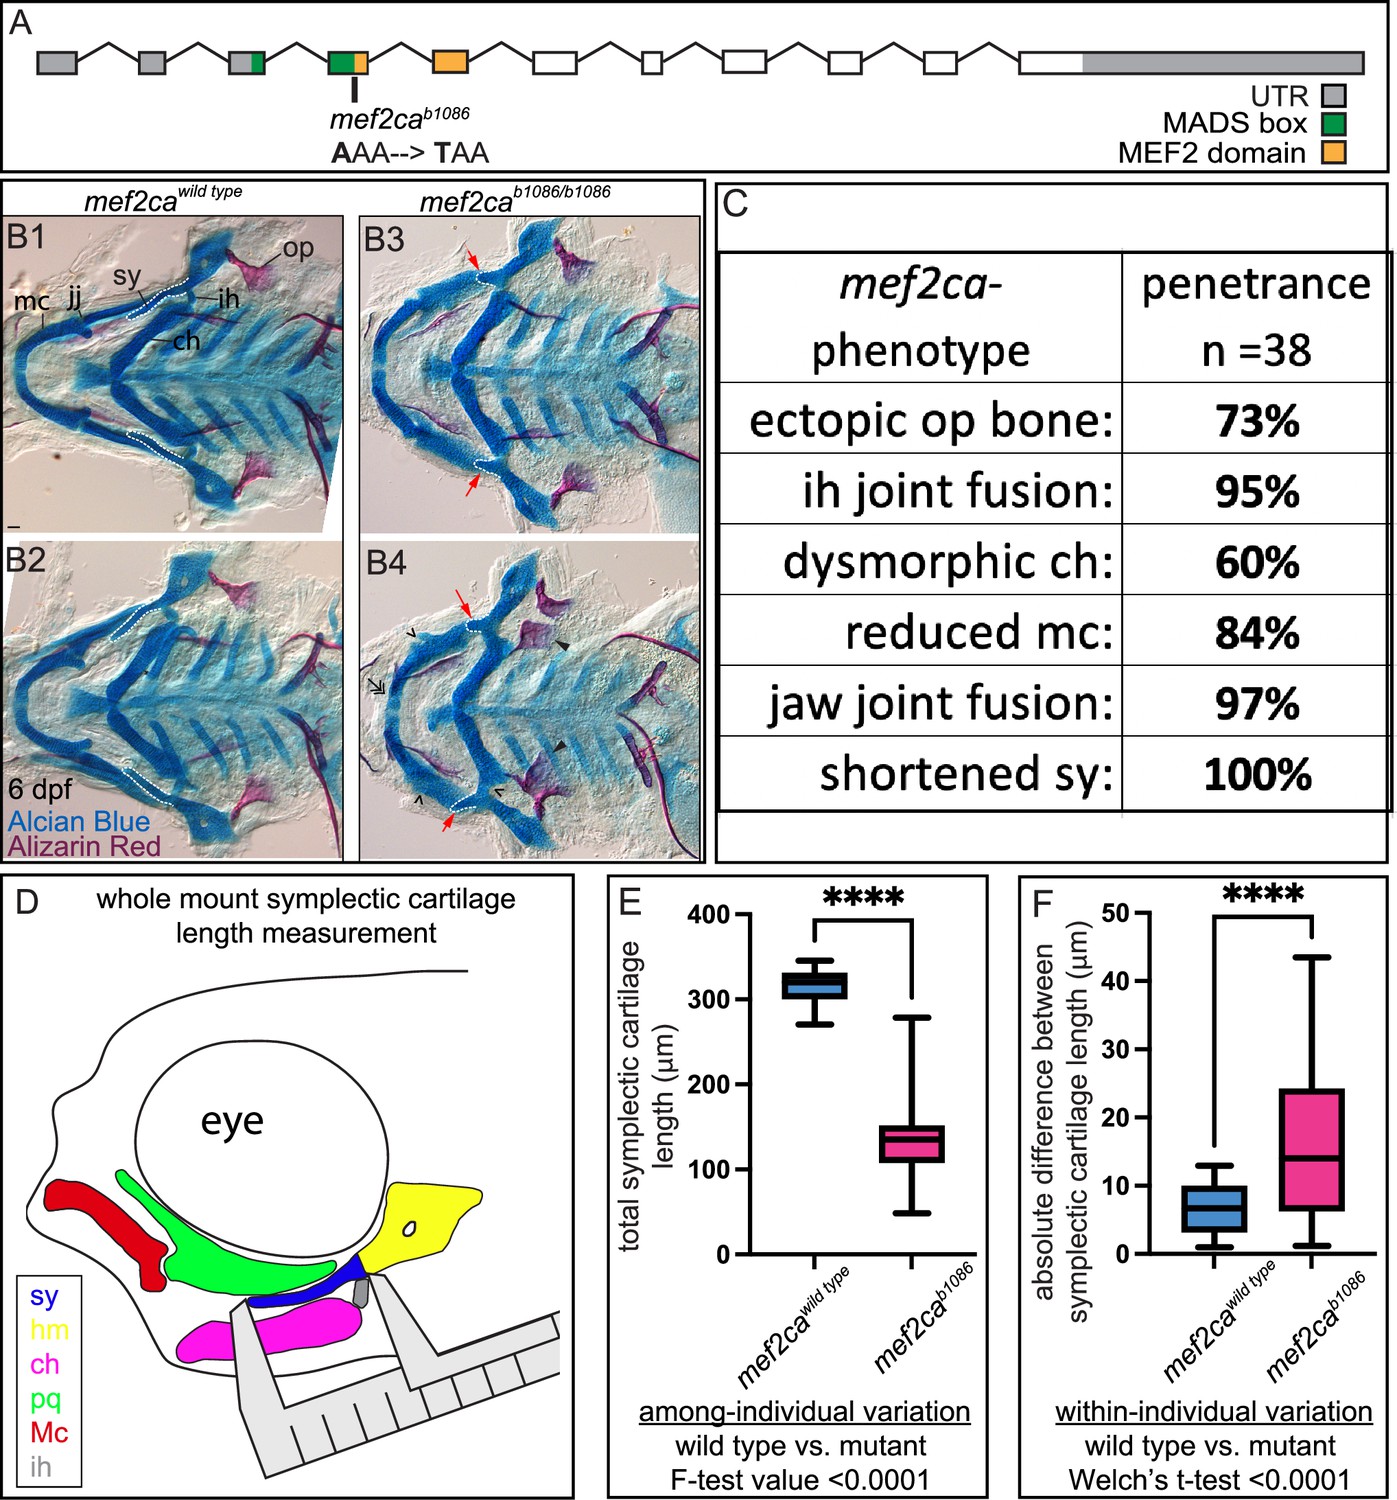
mef2ca mutant craniofacial phenotypes are more variable than wild types.
(A) Schematic of mef2ca exonic structure. The mef2cab1086 mutant allele used in this study and regions encoding known functional domains are annotated. (B1–B4) Zebrafish heterozygous for mef2ca were pairwise intercrossed, and 6 days post fertilization (dpf), larvae were stained with Alcian blue and Alizarin red to label cartilage and bone. The individuals were then genotyped, flat mounted, and imaged. Two examples (upper and lower) are provided for each genotype. The following craniofacial skeletal elements are indicated in a wild-type individual: opercle bone (op), branchiostegal ray (br), Meckel’s (mc), ceratohyal (ch), symplectic (sy) cartilages, interhyal (ih), and jaw (jj) joints. Indicated phenotypes associated with mef2ca mutants include: ectopic bone (arrowheads), interhyal and jaw-joint fusions (^), reduced mc (double arrowhead), and a shortened sy (red arrows). Dashed outline indicates symplectic cartilage. Scale bar: 50 μm. (C) The penetrance of mef2ca mutant-associated phenotypes observed in 6 dpf homozygous mutant larvae is indicated. (D) Schematic indicating how the symplectic cartilage length was measured in this study. (E) Symplectic cartilage length was measured from 6 dpf wild type or homozygous mutant larvae. The p-value from a Welch’s t-test is indicated (****≤0.0001). F-test value testing for significant differences in variation between genotypes is indicated. (F) Symplectic cartilage length on left and right sides of 6 dpf zebrafish was measured to determine fluctuating asymmetry, or the absolute difference between left and right, for wild type or mutant larvae. The p-value from a Welch’s t-test is indicated (****≤0.0001). For box and whisker plots, the box extends from the 25th to 75th percentiles. The line in the middle of the box is plotted at the median, and the bars are minimum and maximum values. For E and F, n=22 for wild types and 44 for mutants.
-
Figure 1—source data 1
Penetrance data and raw symplectic cartilage length measurements.
- https://cdn.elifesciences.org/articles/79247/elife-79247-fig1-data1-v2.xlsx
Figure 1—figure supplement 1
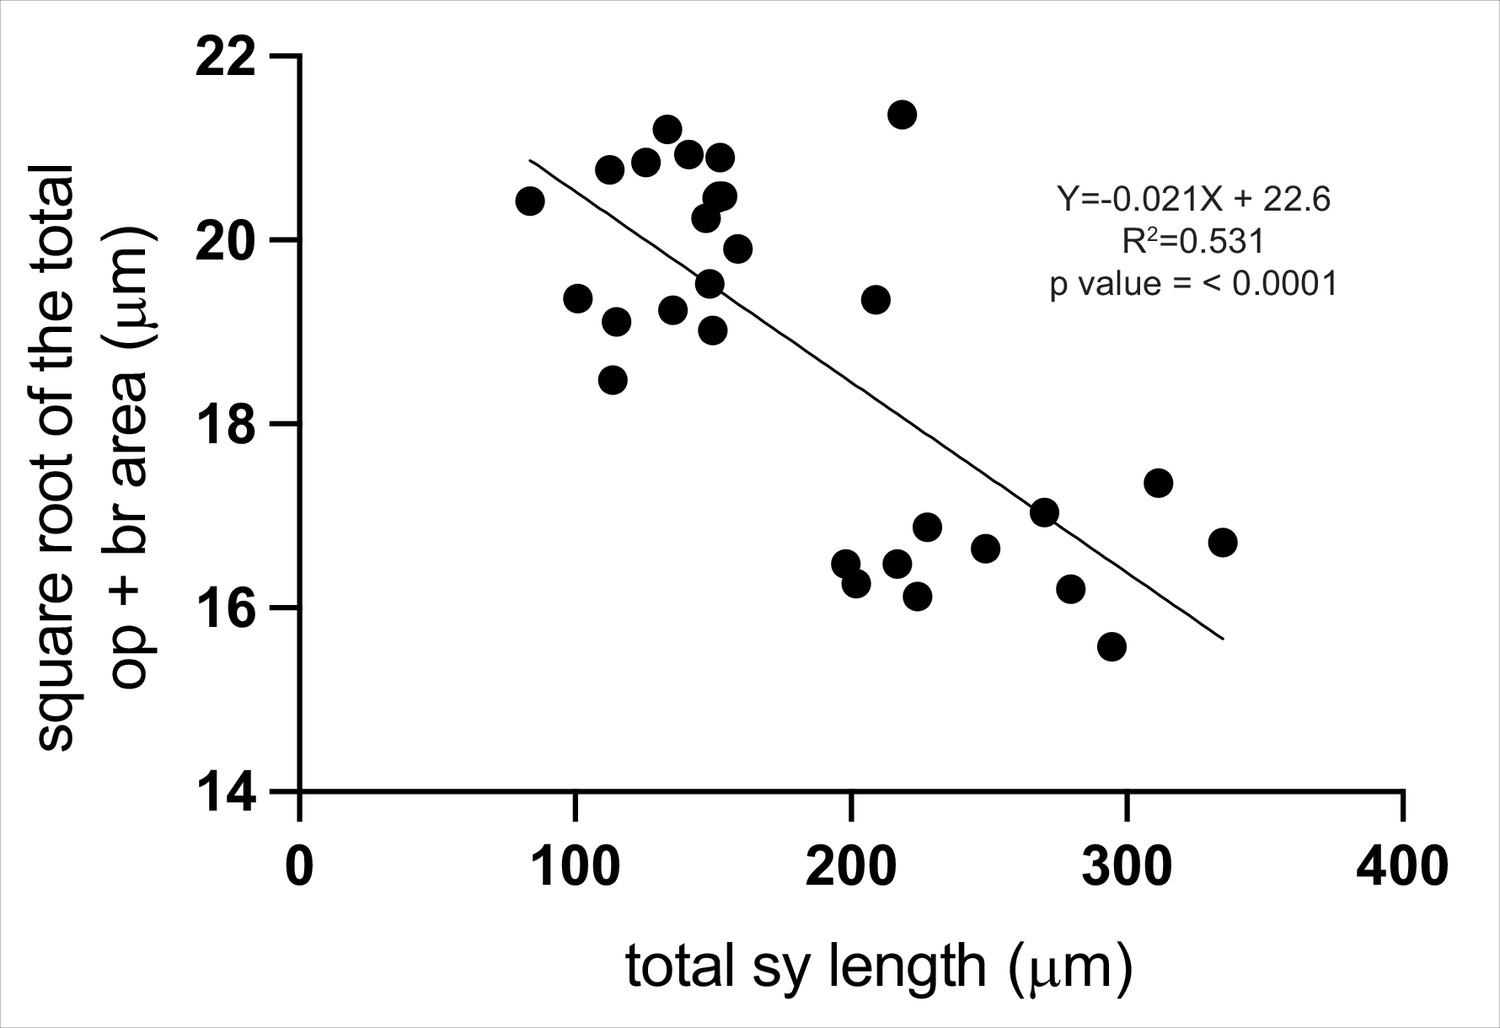
Symplectic cartilage length is a good proxy for other craniofacial phenotypes.
We measured symplectic cartilage length and the area of opercle and branchiostegal ray bone from multiple wild type and mutant individuals. We find that the symplectic cartilage length is significantly correlated with bone area. Animals with shorter symplectic cartilage length tend to have more bone expansion. This correlation indicates that measuring the symplectic cartilage length is a good proxy for other mef2ca-associated craniofacial phenotypes.
Figure 2
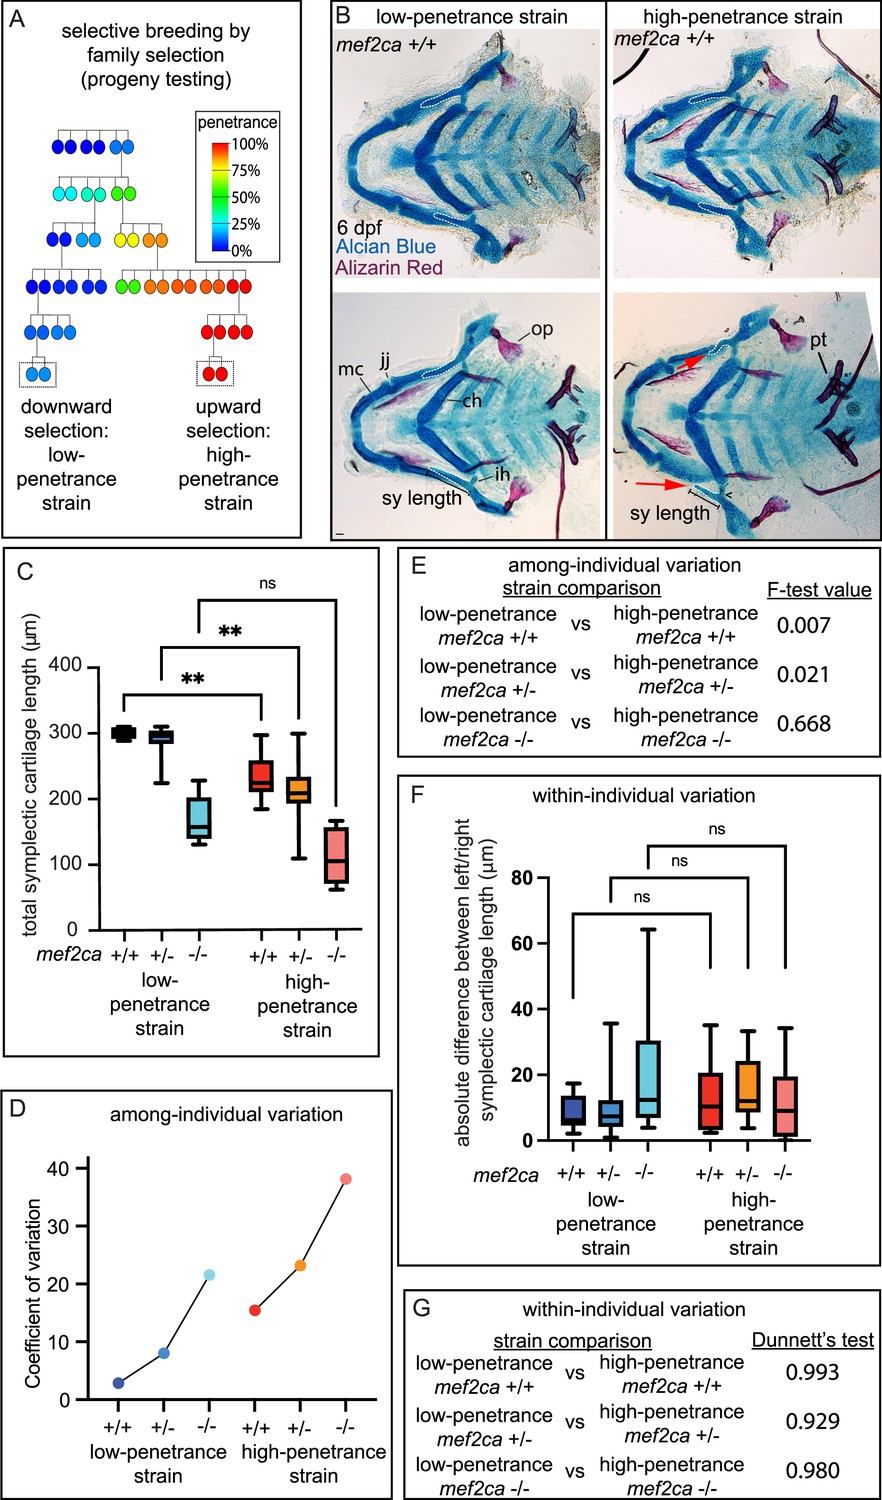
Selective breeding affects mef2ca-associated phenotype severity and variation in mef2ca wild types, heterozygotes, and homozygous mutants.
(A) Selective breeding pedigree illustrating ectopic bone phenotype penetrance inheritance. Dashed boxes indicate families used in this study. Six generations of full-sibling inbreeding produced the animals used here, a more complete pedigree extending back >10 generations can be found in our previous publication (Sucharov et al., 2019). (B) Alcian blue- and Alizarin red-stained animals from the low- and high-penetrance strains were genotyped, and mef2ca homozygous wild types were flat mounted and imaged. The following craniofacial skeletal elements are indicated in a wild-type individual from the low-penetrance strain: opercle bone (op), Meckel’s (mc), ceratohyal (ch), symplectic (sy) cartilages, interhyal (ih), and jaw (jj) joints. Phenotypes normally associated with mef2ca homozygous mutants are present in some wild types from the low-penetrance strain including: ih joint fusions (^) and shortened sy (red arrows). Bars indicating sy length are presented to illustrate the shortened symplectic phenotype present in some high-penetrance wild types but not low-penetrance wild types. A stage-appropriate complement of ankylosed of pharyngeal teeth (pt) are present, and normal sized op bones are present in the individual with shortened sy, indicating the phenotypes we discovered in high-penetrance mef2ca+/+ are not due to general delay. Dashed outline indicates symplectic cartilage. Scale bar: 50 μm (C) Symplectic cartilage length was measured from 6 days post fertilization (dpf) larvae from wild types, heterozygotes, and homozygous mutants from both the low- and high-penetrance strains. p-Values from a Dunnet’s T3 test are indicated (**≤0.01). (D) The coefficient of variation for symplectic length in all three genotypes from both strains was plotted (E) Table listing F-test values testing for significant differences in variation between strains comparing the same genotype. (F) Symplectic cartilage length on left and right sides of 6 dpf zebrafish was measured to determine fluctuating asymmetry or the absolute difference between left and right for all three genotypes from both strains. (G) Table listing the Dunnett’s test for significant differences in fluctuating asymmetry between all three genotypes from both strains. For box and whisker plots, the box extends from the 25th to 75th percentiles. The line in the middle of the box is plotted at the median, and the bars are minimum and maximum values.
-
Figure 2—source data 1
Symplectic cartilage length measurements from selectively bred strains.
- https://cdn.elifesciences.org/articles/79247/elife-79247-fig2-data1-v2.xlsx
Figure 3 with 1 supplement
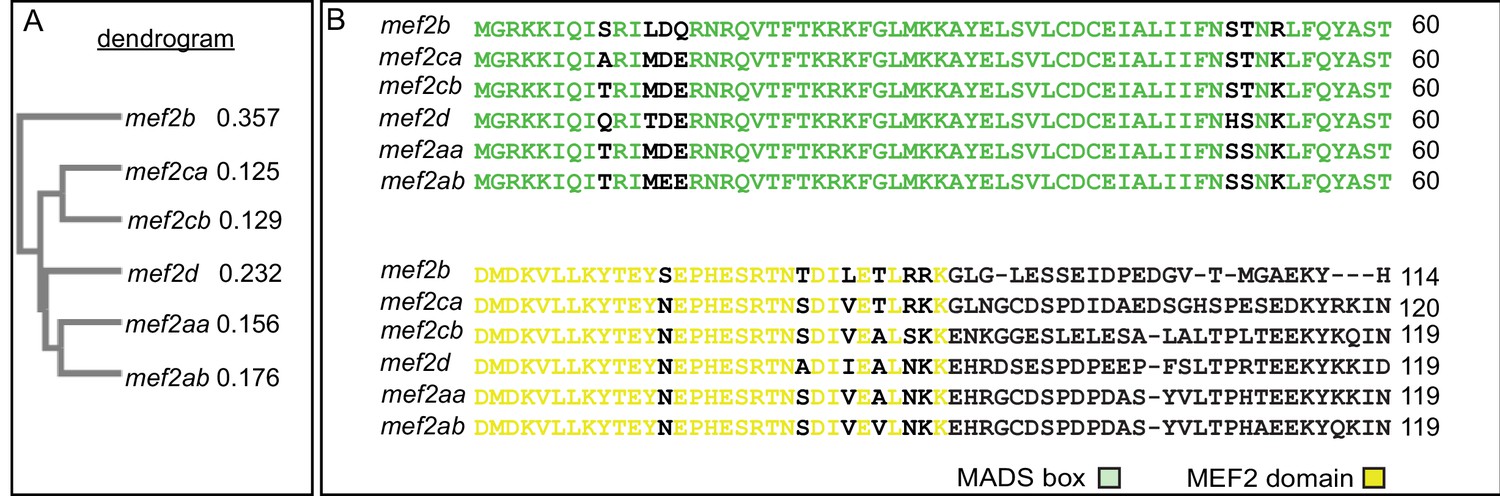
Zebrafish mef2 paralogs encode highly conserved MADS box (MCM1, agamous, deficiens, and SRF) and MEF2 domains.
(A) Neighbor joining tree generated by Clustal Omega Multiple Sequence Alignment tool depicts the evolutionary relationships between the different zebrafish mef2 paralogs. The distance values (branch length) are indicated, which represent the evolutionary distance between the individual amino acid sequences and a consensus sequence. (B) mef2-encoded protein sequence alignment reveals high conservation of MADS box (green) and MEF2 (yellow) domains among all six paralogs. These domains are responsible for DNA binding, dimerization, and cofactor interactions. Transcript IDs used for alignment using the HHalign algorithm are listed in the Materials and methods.
Figure 3—figure supplement 1
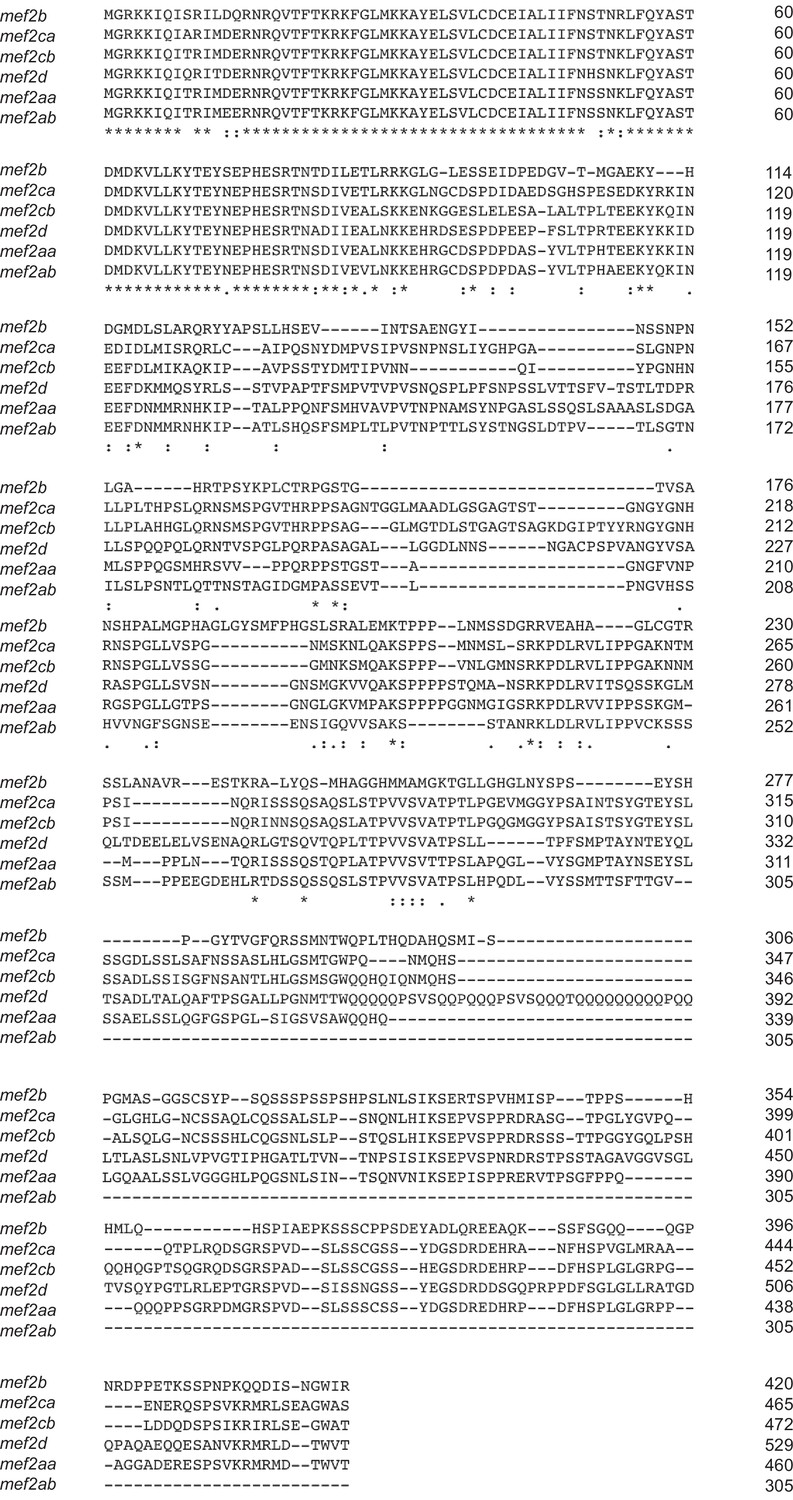
Zebrafish mef2 paralogs encode highly conserved N-terminal MADS box (MCM1, agamous, deficiens, and SRF) and MEF2 domains but divergent C-terminal domains.
mef2-encoded protein sequence alignment reveals high conservation of MADS box and MEF2 domains among all six paralogs. However, the rest of the proteins encoded by these genes are poorly conserved. Transcript IDs used for alignment using the HHalign algorithm are listed in the Materials and methods.
Figure 4 with 1 supplement
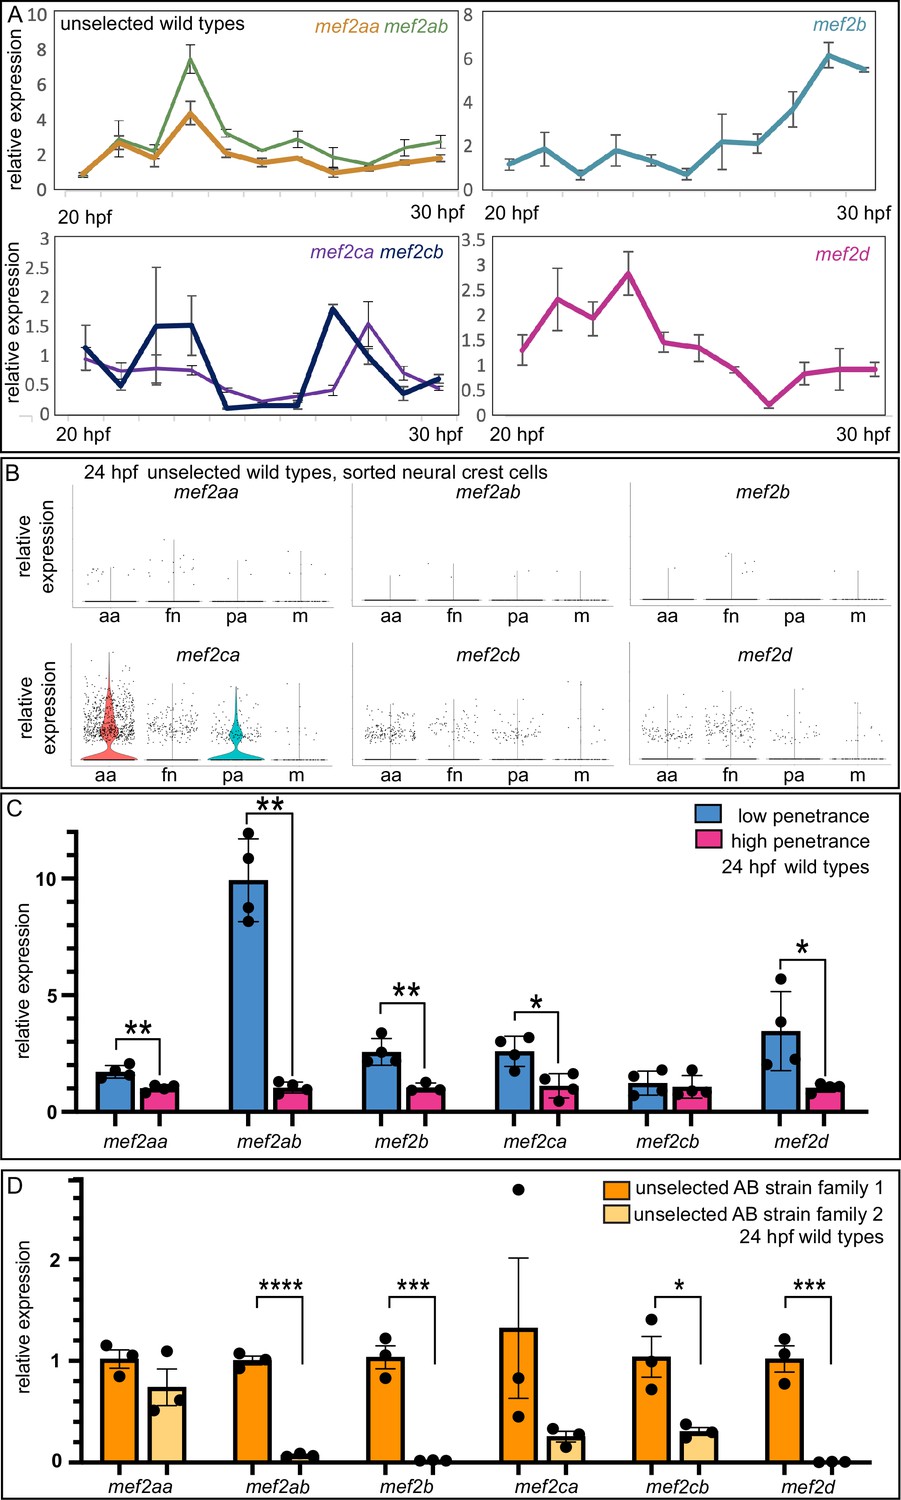
Wild-type gene expression studies reveal mef2 paralog expression dynamics, strain-specific expression levels, and standing paralog expression variation.
(A) Wild-type head expression of all mef2 paralogs was quantified by RT-quantitative PCR (qPCR) at 1 hr intervals from 20 to 30 hpf. Expression of each paralog was normalized to rps18. Error bars are SD. (B) Expression of each paralog in cranial neural crest cells at 24 hpf was determined by single cell RNA-sequencing on sorted cells. Seurat-based clustering subdivided the cells into four populations as described (Mitchell et al., 2021): anterior arches (aa), frontonasal (fn), posterior arches (pa), and a satellite population containing melanocyte lineage cells (m). (C) Wild-type head expression of all mef2 paralogs was quantified by RT-qPCR at 24 hpf to compare paralog expression levels between the low- and high-penetrance strains. Expression of each paralog was normalized to rps18. Asterisks indicate significant difference (*≤0.05 and **≤0.01). Error bars are SD. (D) Wild-type head expression of all mef2 paralogs was quantified by RT-qPCR at 24 hpf to compare paralog expression levels between two families from the unselected AB strain. Expression of each paralog was normalized to rps18. Asterisks indicate significant difference (*≤0.05, ***≤0.001, and ****≤0.0001). Error bars are SEM.
-
Figure 4—source data 1
qPCR raw values.
- https://cdn.elifesciences.org/articles/79247/elife-79247-fig4-data1-v2.xlsx
-
Figure 4—source data 2
qPCR raw values.
- https://cdn.elifesciences.org/articles/79247/elife-79247-fig4-data2-v2.xlsx
-
Figure 4—source data 3
qPCR raw values.
- https://cdn.elifesciences.org/articles/79247/elife-79247-fig4-data3-v2.xlsx
-
Figure 4—source data 4
qPCR raw values.
- https://cdn.elifesciences.org/articles/79247/elife-79247-fig4-data4-v2.xlsx
Figure 4—figure supplement 1
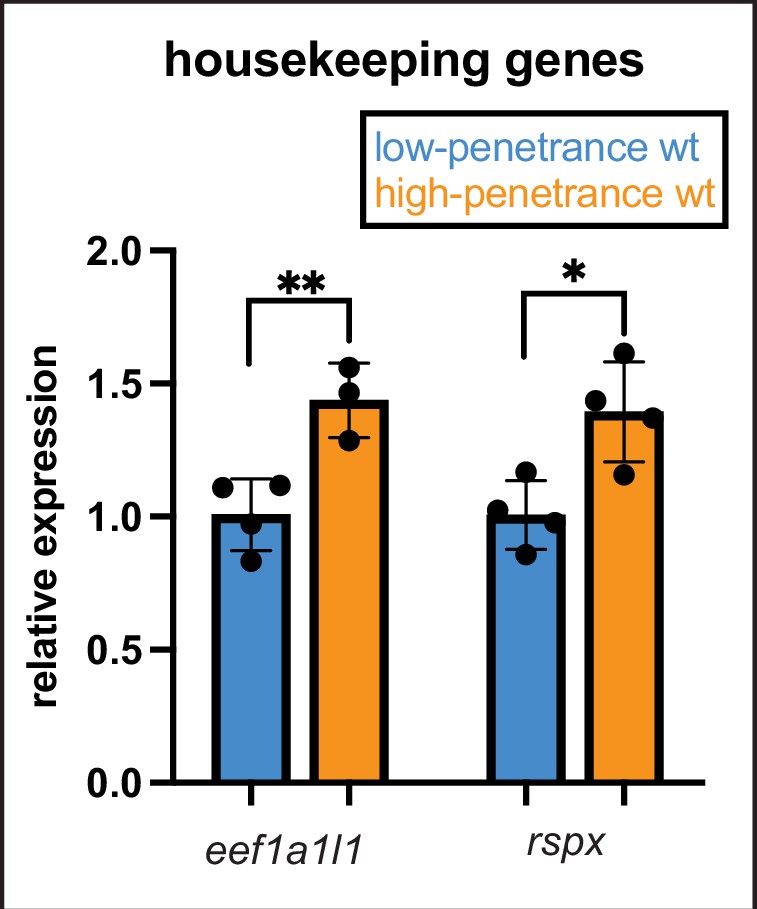
Overall transcription is not increased in the low-penetrance strain.
We observed increased expression of many mef2 paralogs in wild types from the low-penetrance strain compared with high-penetrance strain wild types. To determine if overall gene expression is generally upregulated in the low-penetrance strain, we quantified two housekeeping genes by RT-quantitative PCR (qPCR) at 24 hpf to compare expression levels between strains. Expression of each gene was normalized to rps18, the same normalization gene we used for comparing paralogs. In contrast to the mef2 paralogs, neither housekeeping gene is significantly upregulated in the low-penetrance strain. In fact, expression of these housekeeping genes was higher in the high- versus low-penetrance strain wild types. Error bars are SD, p-values (**≤0.01 and *≤0.05).
Figure 5 with 2 supplements
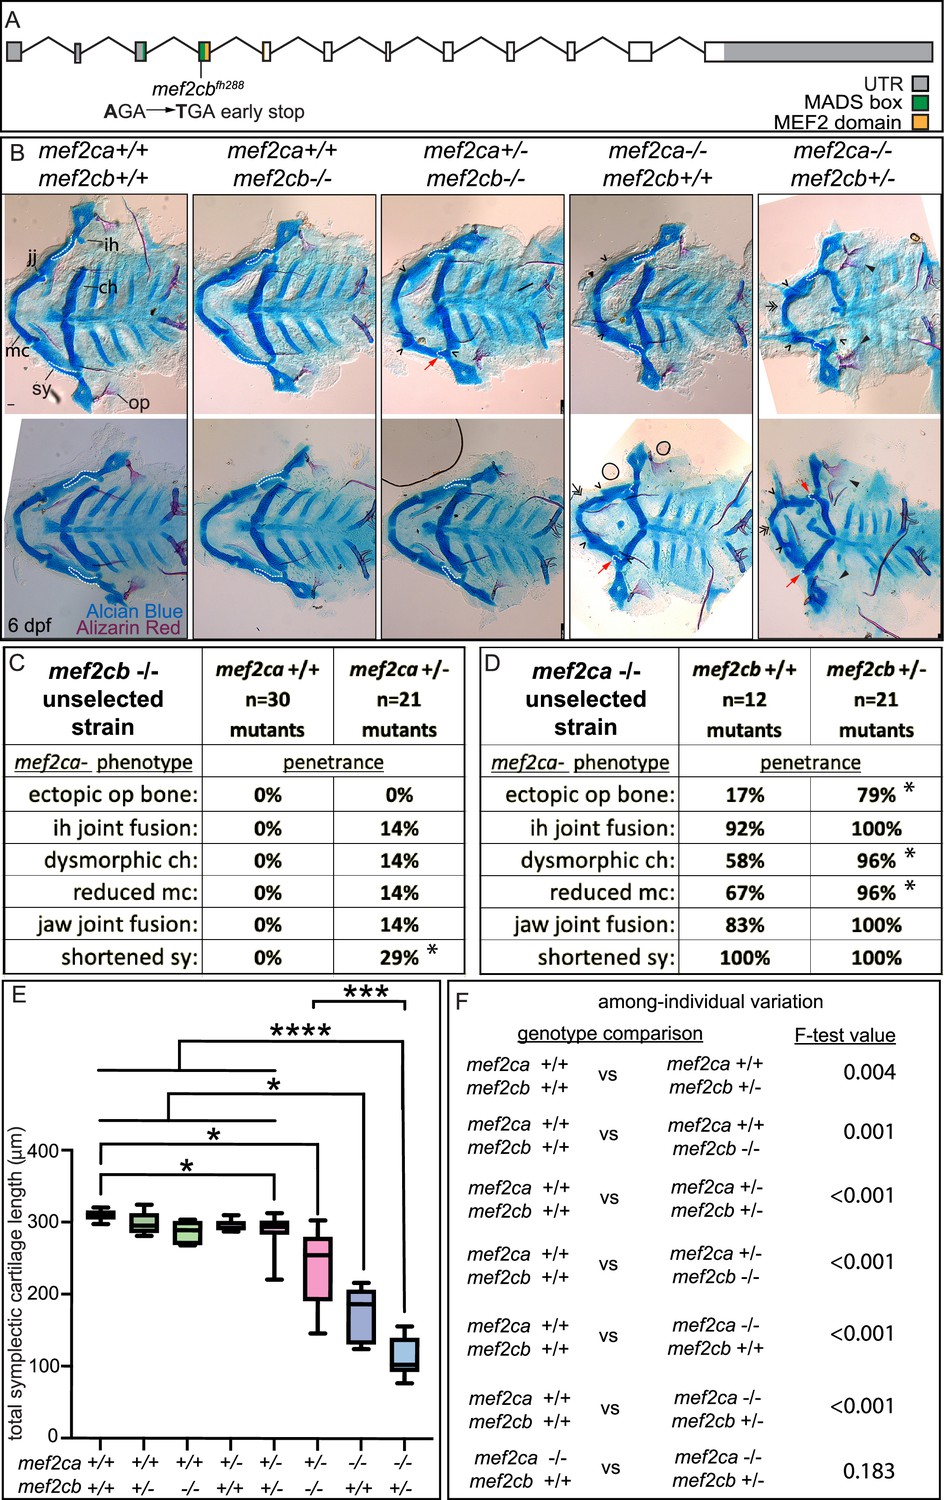
mef2cb function buffers against mef2ca loss.
(A) Schematic of mef2cb exonic structure, mutant allele used in this study, and regions encoding proposed functional domains are annotated. (B) Zebrafish heterozygous for both mef2cab1086 and mef2cb were pairwise intercrossed. 6 days post fertilization (dpf) larvae were stained with Alcian blue and Alizarin red to label cartilage and bone. Stained larvae were genotyped, flat mounted, and imaged. The following craniofacial skeletal elements are indicated in a wild-type individual: opercle bone (op), branchiostegal ray (br), Meckel’s (mc), ceratohyal (ch), symplectic (sy) cartilages, interhyal (ih), and jaw (jj) joints. Indicated phenotypes associated with mef2ca mutants include: ectopic bone (arrowheads), interhyal and jaw-joint fusions (^), dysmorphic ch (arrows), reduced mc (double arrowhead), and a shortened sy (red arrows). Dashed outline indicates symplectic cartilage. Scale bar: 50 μm (C and D) The penetrance of mef2ca mutant-associated phenotypes observed in 6 dpf larvae is indicated. Asterisk indicates significant difference in penetrance between the indicated genotypes by Fishers exact test. (E) Symplectic cartilage length was measured from 6 dpf larvae from the indicated genotypes. Asterisks indicate significant differences in symplectic length. The p-values from a Dunnet’s T3 test are indicated (*≤0.05, ***≤0.001, and ****≤0.0001) (F) Table listing F-test values for significant differences in variation between genotypes. For box and whisker plots, the box extends from the 25th to 75th percentiles. The line in the middle of the box is plotted at the median, and the bars are minimum and maximum values. N’s for all analyses are indicated in C and D.
-
Figure 5—source data 1
Symplectic length cartilage measurements.
- https://cdn.elifesciences.org/articles/79247/elife-79247-fig5-data1-v2.xlsx
Figure 5—figure supplement 1
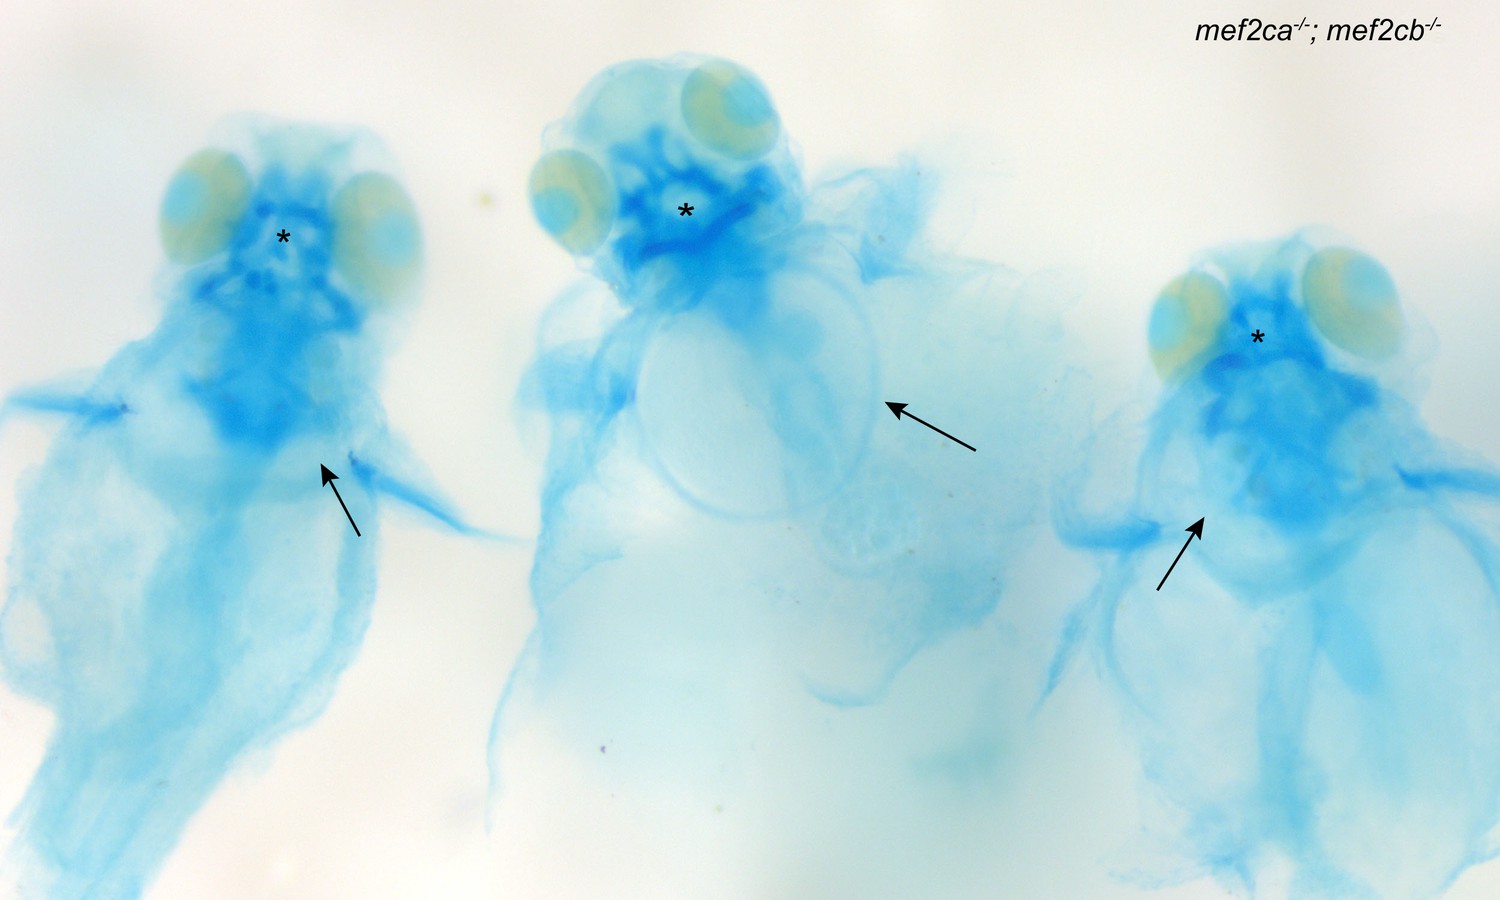
Zebrafish mef2ca;mef2cb double homozygous mutants develop nonspecific developmental defects.
Zebrafish double heterozygous for mef2cab1086 and mef2cb were intercrossed. Offspring were stained with Alcian blue and Alizarin red then genotyped for both genes. In whole-mount images of double homozygous mutants, severe edema (arrows) and craniofacial cartilage malformations (asterisks) are observed with 100% penetrance.
Figure 5—figure supplement 2
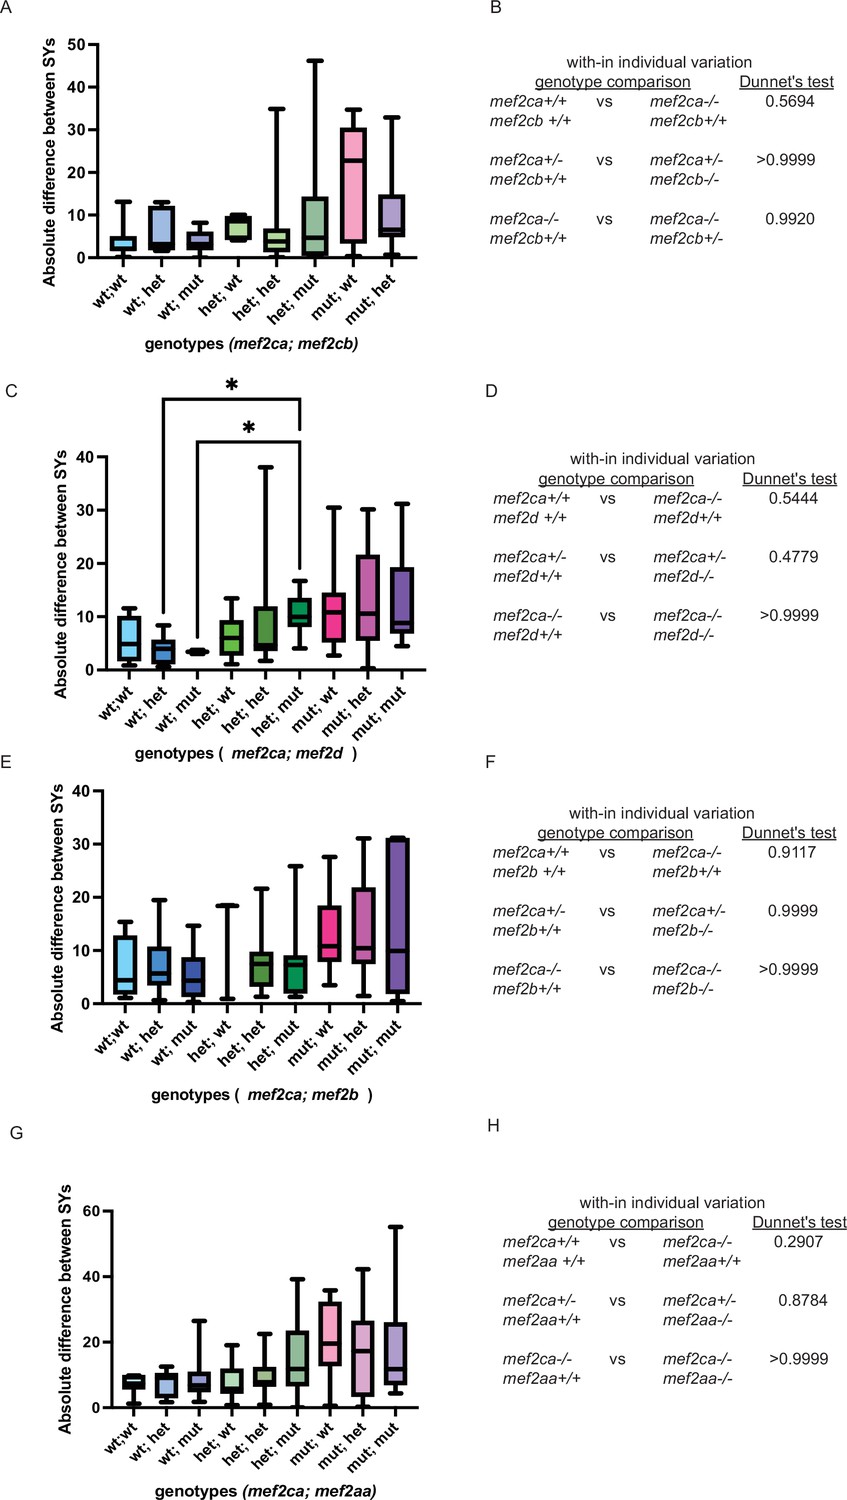
Increased severity is not associated with increased within-individual.
(A, C, E, and G) Symplectic cartilage length on left and right sides of 6 days post fertilization (dpf) zebrafish stained with Alcian blue and Alizarin red was measured to determine fluctuating asymmetry or the absolute difference between left and right for fish with the indicated genotypes. (B, D, F, and H) Table listing the Dunnett’s test values for significant differences in fluctuating asymmetry between fish with the indicated genotypes. For box and whisker plots, the box extends from the 25th to 75th percentiles. The line in the middle of the box is plotted at the median, and the bars are minimum and maximum values.
Figure 6
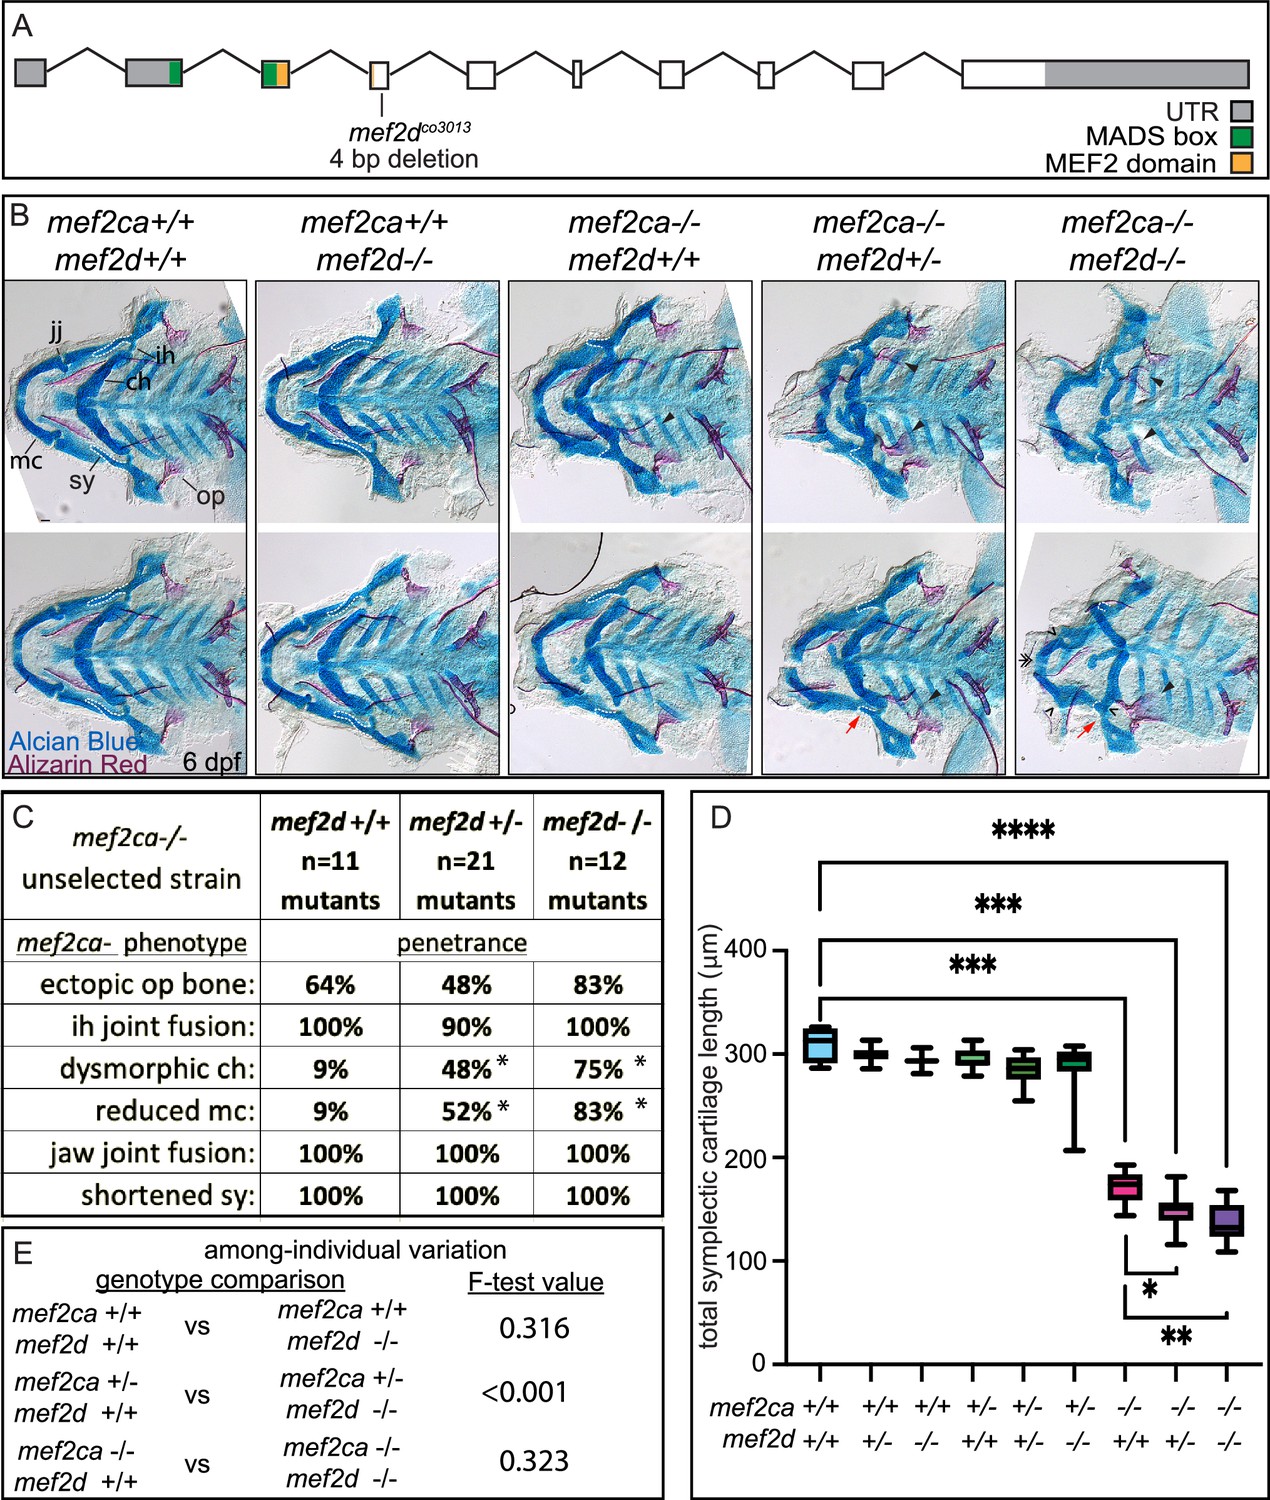
mef2d function buffers against mef2ca loss.
(A) Schematic of mef2d exonic structure, mutant allele used in this study, and regions encoding proposed functional domains are annotated. (B) Zebrafish heterozygous for both mef2ca b1086 and mef2d were pairwise intercrossed. 6 days post fertilization (dpf) larvae were stained with Alcian blue and Alizarin red to label cartilage and bone. Stained larvae were genotyped, flat mounted, and imaged. The following craniofacial skeletal elements are indicated in a wild-type individual: opercle bone (op), branchiostegal ray (br), Meckel’s (mc), ceratohyal (ch), symplectic (sy) cartilages, interhyal (ih), and jaw (jj) joints. Indicated phenotypes associated with mef2ca mutants include: ectopic bone (arrowheads), interhyal and jaw-joint fusions (^), dysmorphic ch (arrows), reduced mc (double arrowhead), and a shortened sy (red arrows). Dashed outline indicates symplectic cartilage. Scale bar: 50 μm (C) The penetrance of mef2ca mutant-associated phenotypes observed in 6 dpf larvae is indicated. Asterisk denotes significant difference in penetrance between the indicated genotypes by Fishers exact test. (D) Symplectic cartilage length was measured from 6 dpf larvae from the indicated genotypes, and asterisk indicates significant differences in symplectic length (*≤0.05, **≤0.01, and ***≤0.001). (E) Table listing F-test values testing for significant differences in variation between genotypes. For box and whisker plots, the box extends from the 25th to 75th percentiles. The line in the middle of the box is plotted at the median, and the bars are minimum and maximum values. N’s for all analyses are indicated in C.
-
Figure 6—source data 1
Symplectic cartilage length measurements.
- https://cdn.elifesciences.org/articles/79247/elife-79247-fig6-data1-v2.xlsx
Figure 7
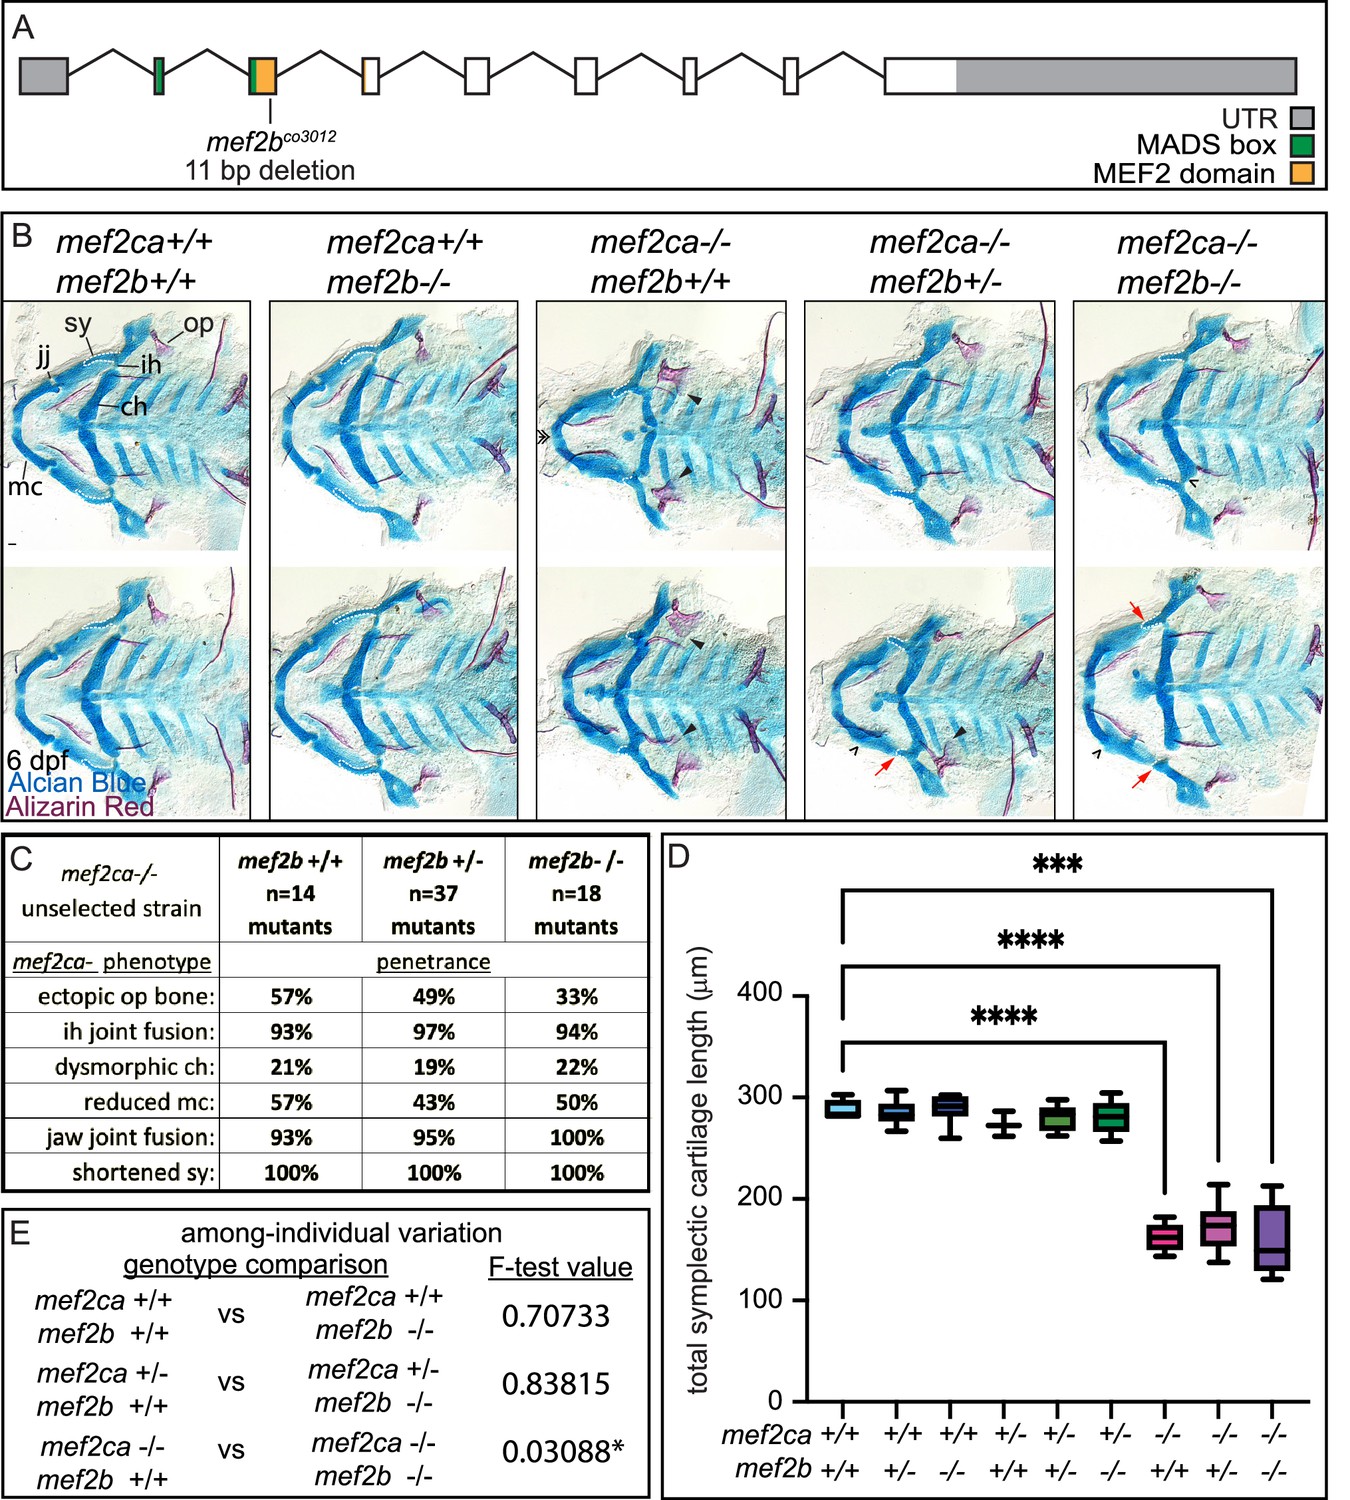
mef2b function buffers against mef2ca loss.
(A) Schematic of mef2b exonic structure, mutant allele used in this study, and regions encoding proposed functional domains are annotated. (B) Zebrafish heterozygous for both mef2ca b1086 and mef2b were pairwise intercrossed. 6 days post fertilization (dpf) larvae were stained with Alcian blue and Alizarin red to label cartilage and bone. Stained larvae were genotyped, flat mounted, and imaged. The following craniofacial skeletal elements are indicated in a wild-type individual: opercle bone (op), branchiostegal ray (br), Meckel’s (mc), ceratohyal (ch), symplectic (sy) cartilages, interhyal (ih), and jaw (jj) joints. Indicated phenotypes associated with mef2ca mutants include: ectopic bone (arrowheads), interhyal and jaw-joint fusions (^), dysmorphic ch (arrows), reduced mc (double arrowhead), and a shortened sy (red arrows). Scale bar: 50 μm. (C) The penetrance of mef2ca mutant-associated phenotypes observed in 6 dpf larvae is indicated. (D) Symplectic cartilage length was measured from 6 dpf larvae from the indicated genotypes, and asterisk indicates significant differences in symplectic length (***≤0.001 and ****≤0.0001). (E) Table listing F-test values testing for significant differences in variation between genotypes. For box and whisker plots, the box extends from the 25th to 75th percentiles. The line in the middle of the box is plotted at the median, and the bars are minimum and maximum values. N’s for all analyses are indicated in C.
-
Figure 7—source data 1
Symplectic cartilage length measurements.
- https://cdn.elifesciences.org/articles/79247/elife-79247-fig7-data1-v2.xlsx
Figure 8
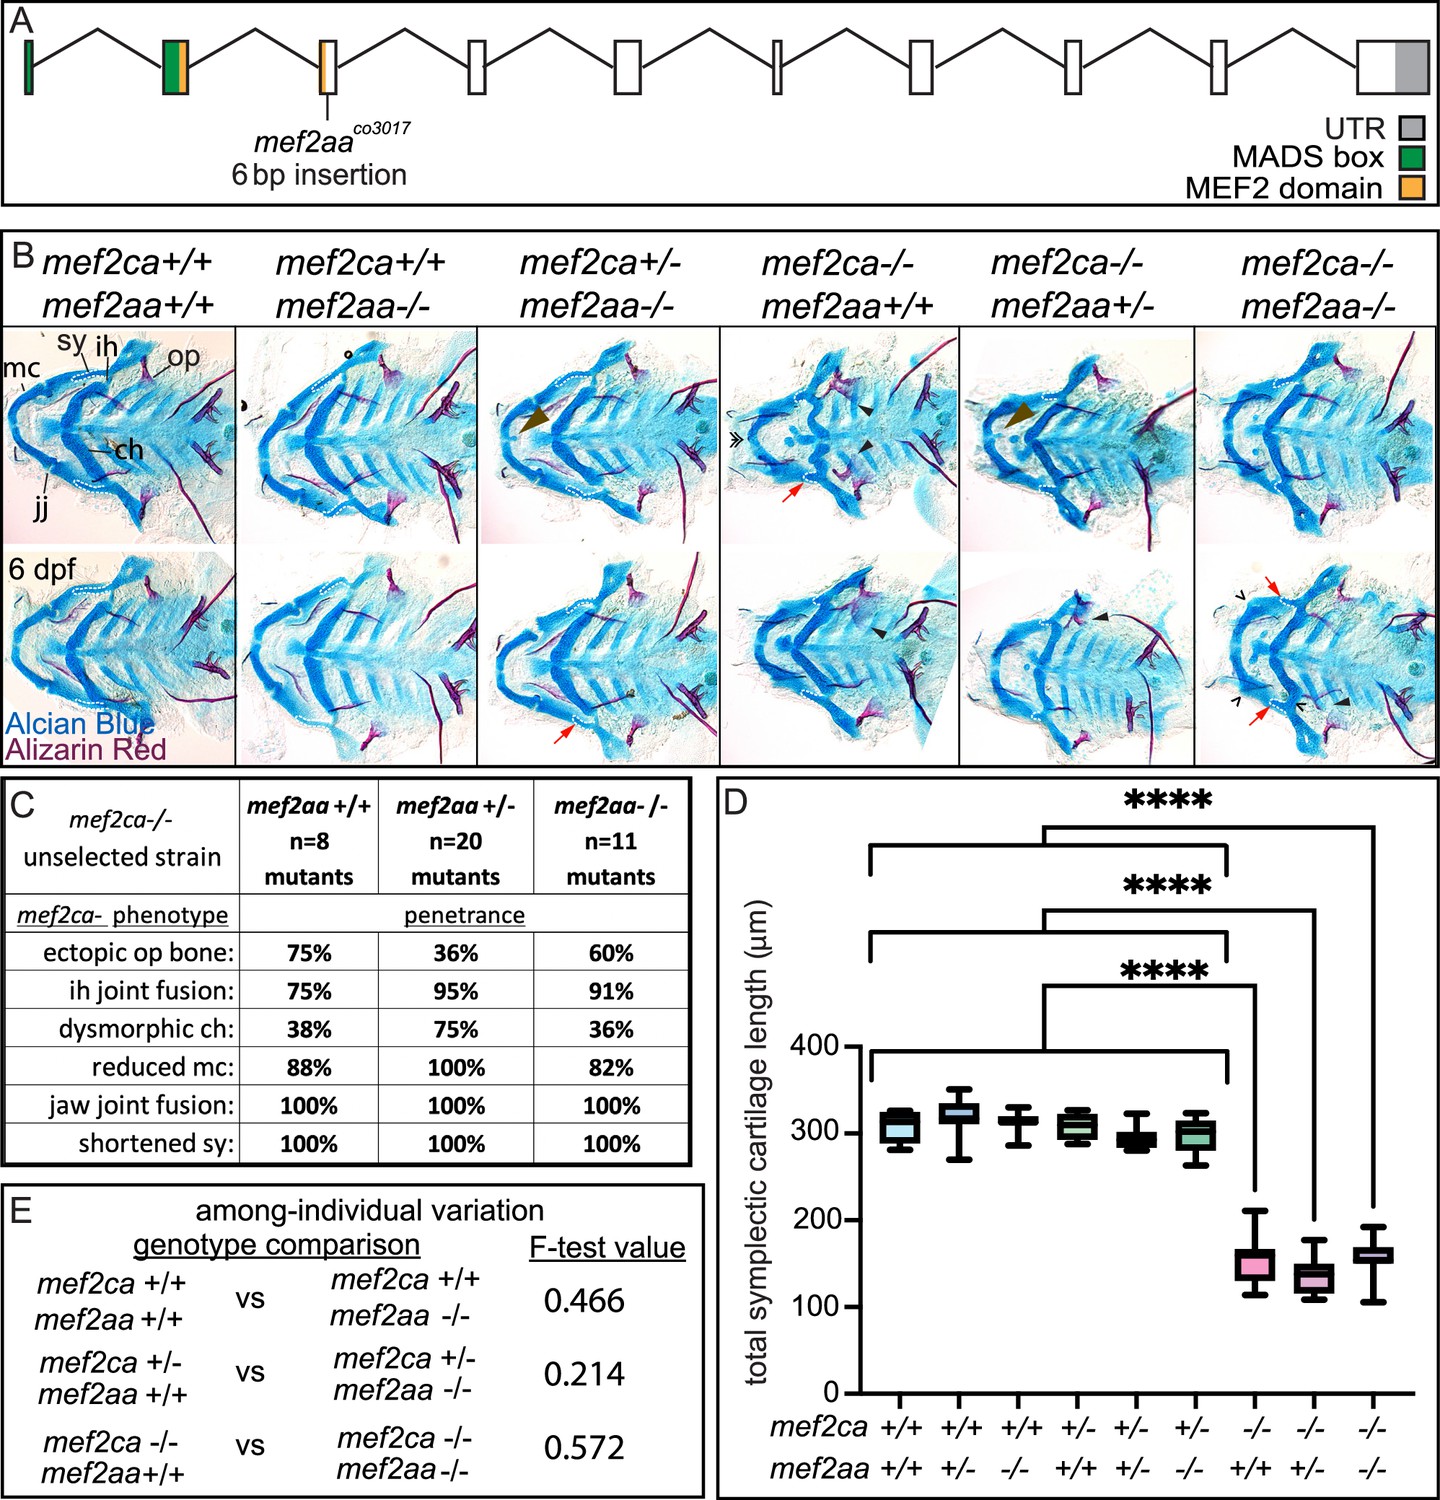
mef2aa function buffers against mef2ca partial loss.
(A) Schematic of mef2aa exonic structure, mutant allele used in this study, and regions encoding proposed functional domains are annotated. (B) Zebrafish heterozygous for both mef2ca b1086 and mef2aa were pairwise intercrossed. 6 days post fertilization (dpf) larvae were stained with Alcian blue and Alizarin red to label cartilage and bone. Stained larvae were genotyped, flat mounted, and imaged. The following craniofacial skeletal elements are indicated in a wild type: opercle bone (op), branchiostegal ray (br), Meckel’s (mc), ceratohyal (ch), symplectic (sy) cartilages, interhyal (ih), and jaw (jj) joints. Indicated phenotypes associated with mef2ca mutants include: cartilage nubbin fused to the mc symphysis (brown arrowhead), ectopic bone (black arrowheads), ih and jj fusions (^), dysmorphic ch (arrows), reduced mc (double arrowhead), and a shortened sy (red arrows). Scale bar: 50 μm. (C) The penetrance of mef2ca mutant-associated phenotypes observed in 6 dpf larvae is indicated. (D) Symplectic cartilage length was measured from 6 dpf larvae from the indicated genotypes, and asterisk indicates significant differences in symplectic length (****≤0.0001). (E) Table listing F-test values testing for significant differences in variation between genotypes. For box and whisker plots, the box extends from the 25th to 75th percentiles. The line in the middle of the box is plotted at the median, and the bars are minimum and maximum values. N’s for all analyses are indicated in C.
-
Figure 8—source data 1
Symplectic cartilage length measurements.
- https://cdn.elifesciences.org/articles/79247/elife-79247-fig8-data1-v2.xlsx
Figure 9
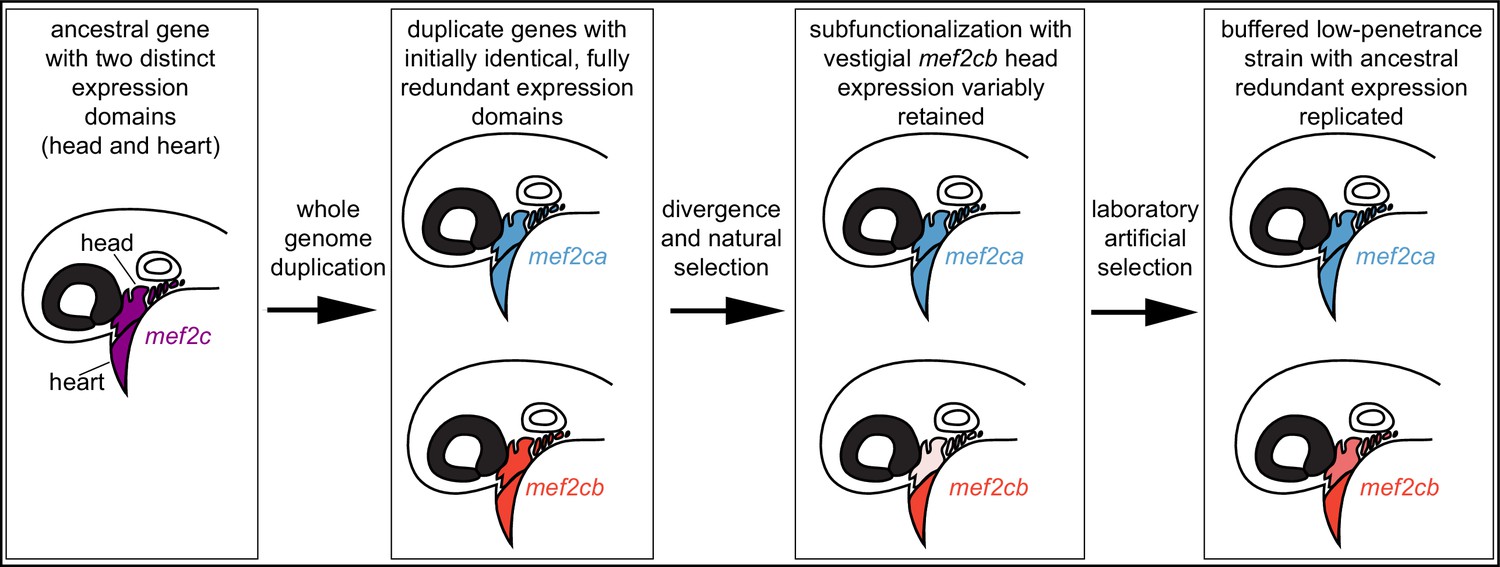
Model for mef2 gene duplicate evolution and replication of ancestral, redundant expression via selective breeding.
In our model, an ancestral mef2 gene existed with distinct expression domains. In this example, ancestral mef2c had expression in the head and the heart. Following whole genome duplication, initially the regulatory and coding sequences would be identical. Through divergence and natural selection, factors controlling gene regulation would acquire mutations that dampen, but do not eliminate, some expression domains. In this example, mef2cb expression is dampened in the head. These gene expression changes result in subfunctionalization but with vestigial retention of the original expression. mef2cb is no longer required for craniofacial development, yet traces of the original craniofacial expression remain. The amount of vestigial expression is variable among individuals, resulting in variable buffering against mef2ca mutant phenotypes across a population. Our selective breeding selected on this variable expression resulting in higher paralog expression in the low-penetrance strain compared with the high-penetrance strain. Thus, mef2 paralog expression in the low-penetrance strain resembles the ancestral condition following whole genome duplication, when both copies’ expression profiles were highly similar, and the genes were redundant for craniofacial development.
Additional files
Download links
A two-part list of links to download the article, or parts of the article, in various formats.
Downloads (link to download the article as PDF)
Open citations (links to open the citations from this article in various online reference manager services)
Cite this article (links to download the citations from this article in formats compatible with various reference manager tools)
Variable paralog expression underlies phenotype variation
eLife 11:e79247.
https://doi.org/10.7554/eLife.79247


