Insulin sensitivity is preserved in mice made obese by feeding a high starch diet
- School of Medical Sciences, University of Sydney, Australia
- Diabetes and Metabolism Division, Garvan Institute of Medical Research, Australia
- Department of Pharmacology, School of Medical Sciences, University of New South Wales, Australia
- School of Life and Environmental Sciences, Charles Perkins Centre, University of Sydney, Australia
- School of Mathematics and Statistics, Charles Perkins Centre, University of Sydney, Australia
- Institute for Physical Activity and Nutrition, School of Exercise and Nutrition Sciences, Deakin University, Australia
- Metabolic Research Unit, School of Medicine, Deakin University, Australia
Figures
Figure 1
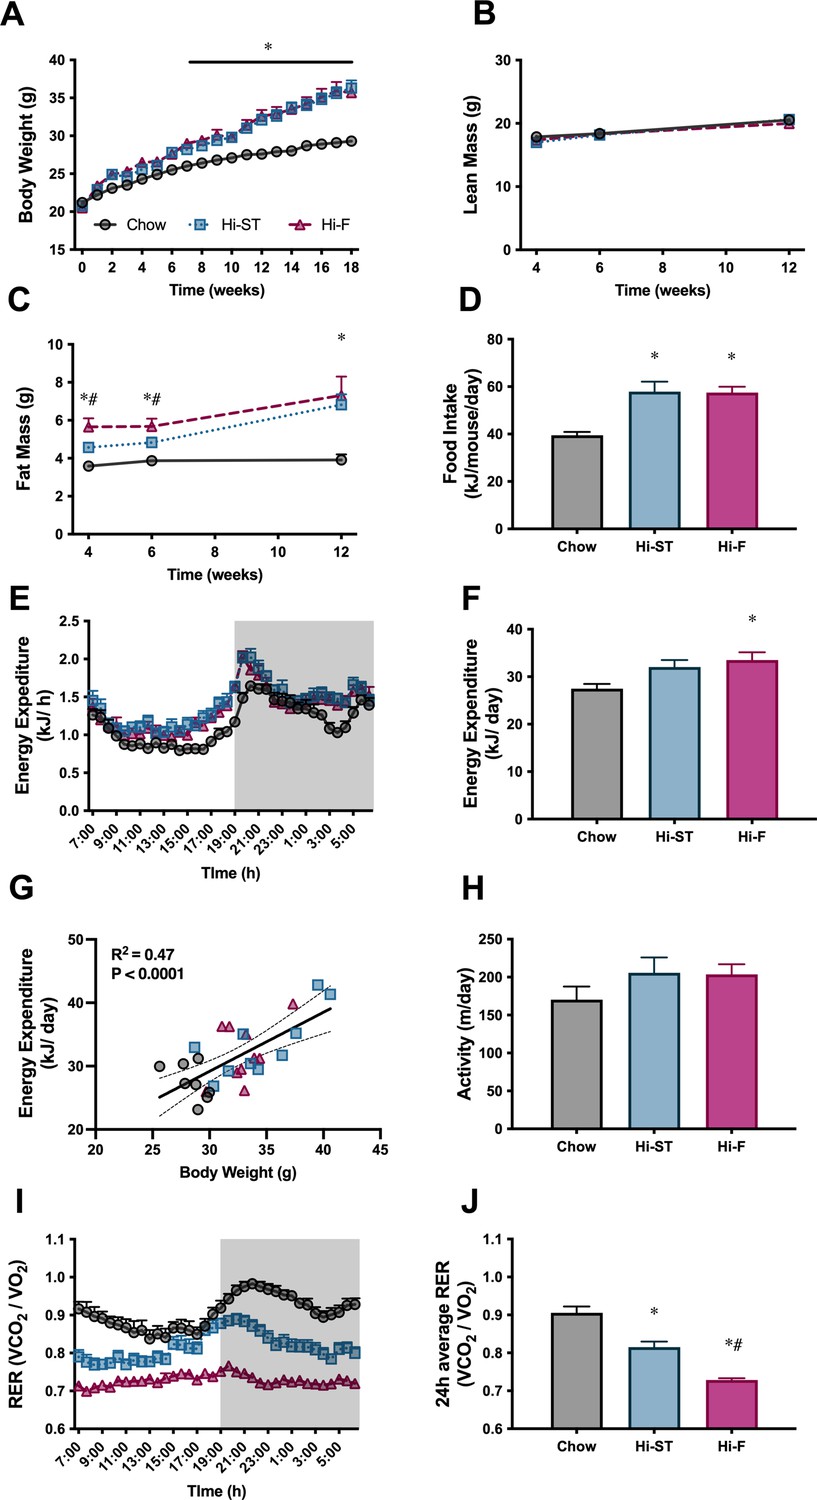
High starch (Hi-ST) and high fat (Hi-F) similarly increase body weight, fat mass, and food intake without changes in lean mass or energy expenditure.
(A) Body weight, n=18–20, (B) lean mass, (C) fat mass, n=8–10, (D) food intake, n=4 (averaged within cages), (E) energy expenditure, (F) 24 hr average of energy expenditure, (G) relationship between energy expenditure and body weight, (H) ambulatory activity, (I) respiratory exchange ratio (RER), (J) 24 hr average of RER, n=8–10. Grey – chow, blue – Hi-ST, pink – Hi-F. Data presented as mean ± SEM. Data analysed with a one-way ANOVA or two-way repeated measures ANOVA where appropriate. Panel G analysed by linear regression. *p<0.05 different to chow; #p<0.05 different to Hi-ST.
-
Figure 1—source data 1
Raw data for Figure 1.
- https://cdn.elifesciences.org/articles/79250/elife-79250-fig1-data1-v2.xlsx
Figure 2

Glucose tolerance of high starch (Hi-ST) mice is similar to chow despite increased adiposity and may be due to liver, but not β-cell, involvement.
(A) Oral glucose tolerance test (oGTT) after 4 weeks of feeding, (B) area under the curve for the oGTT after 4 weeks of feeding, n=45, (C) insulin released during the oGTT after 4 weeks of feeding, n=42–45. (D) oGTT after 12 weeks of feeding, (E) area under the curve for the oGTT after 12 weeks of feeding, (F) insulin released during the oGTT after 12 weeks of feeding, n=19–20. (G) oGTT with deuterated glucose after 14 weeks of feeding, n=10, (H) deuterated glucose enrichment curves, (I) endogenous glucose production during the oGTT, (J) endogenous glucose production as expressed as a change from baseline, n=10. (K) Glucose-stimulated insulin secretion, n=5–6, (L) insulin content of β-cell (53–60 islets). Grey – chow, blue – Hi-ST, pink – high fat (Hi-F). Data presented as mean ± SEM. Data analysed with a one-way ANOVA or two-way repeated measures ANOVA where appropriate. *p<0.05 different to chow; #p<0.05 different to Hi-ST; ‡p<0.05 different to 2.8 of the same dietary group.
-
Figure 2—source data 1
Raw data for Figure 2.
- https://cdn.elifesciences.org/articles/79250/elife-79250-fig2-data1-v2.xlsx
Figure 3
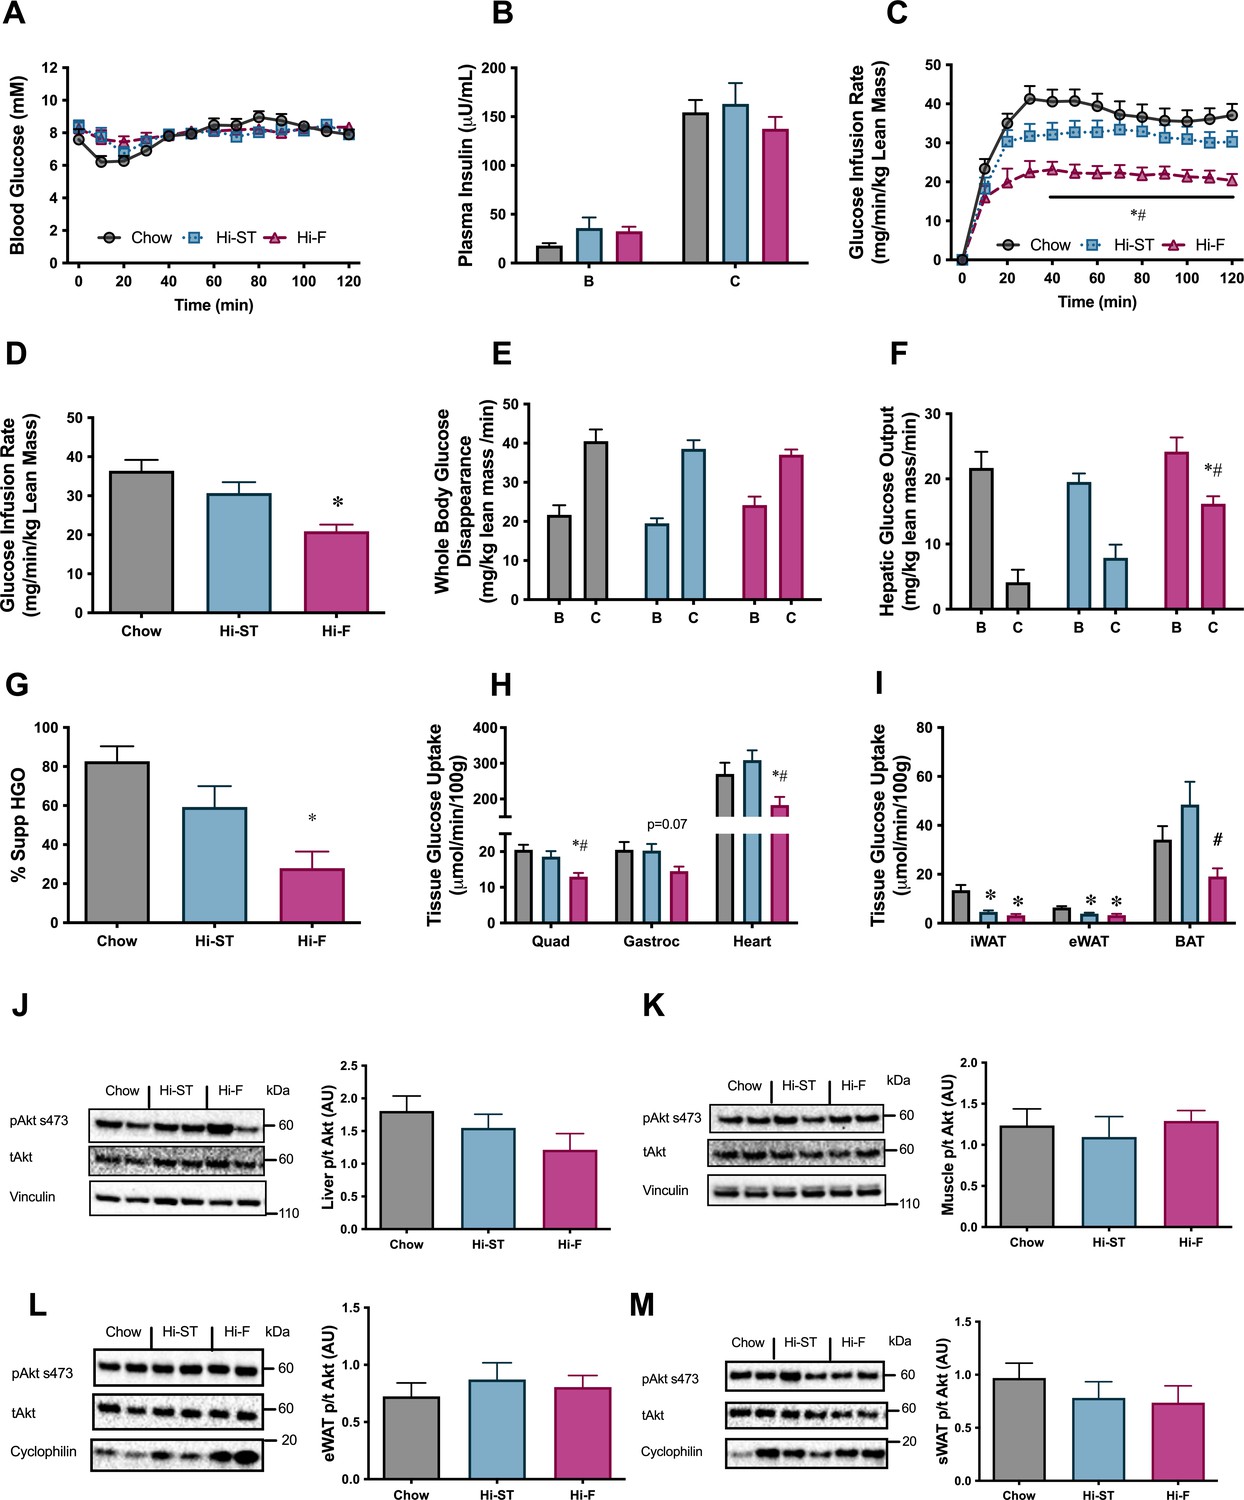
Euglycaemic-hyperinsulinaemic clamp parameters show preservation of whole body, liver and skeletal muscle insulin resistance.
(A) Blood glucose, (B) plasma insulin, (C) glucose infusion rate, (D) average glucose infusion rate of 90–120 min, (E) whole body glucose disappearance, (F) hepatic glucose output (HGO), (G) percent suppression of HGO, (H) muscle glucose uptake, (I) adipose tissue glucose uptake, (J) phosphorylation of Akt in liver after the clamp, (K) phosphorylation of Akt in quadriceps muscle after the clamp, (L) phosphorylation of Akt in epididymal white adipose tissue (eWAT) after the clamp, (M) phosphorylation of Akt in subcutaneous white adipose tissue (sWAT) after the clamp. B, basal state; C, clamped state. Grey – chow, blue – high starch (Hi-ST), pink – high fat (Hi-F). Data presented as mean ± SEM. Data analysed with a one-way ANOVA or two-way repeated measures ANOVA where appropriate. n=8–11. *p<0.05 different to chow; #p<0.05 different to Hi-ST.
-
Figure 3—source data 1
Raw data for Figure 3.
- https://cdn.elifesciences.org/articles/79250/elife-79250-fig3-data1-v2.xlsx
-
Figure 3—source data 2
Raw western blot images for Figure 3.
- https://cdn.elifesciences.org/articles/79250/elife-79250-fig3-data2-v2.zip
Figure 4
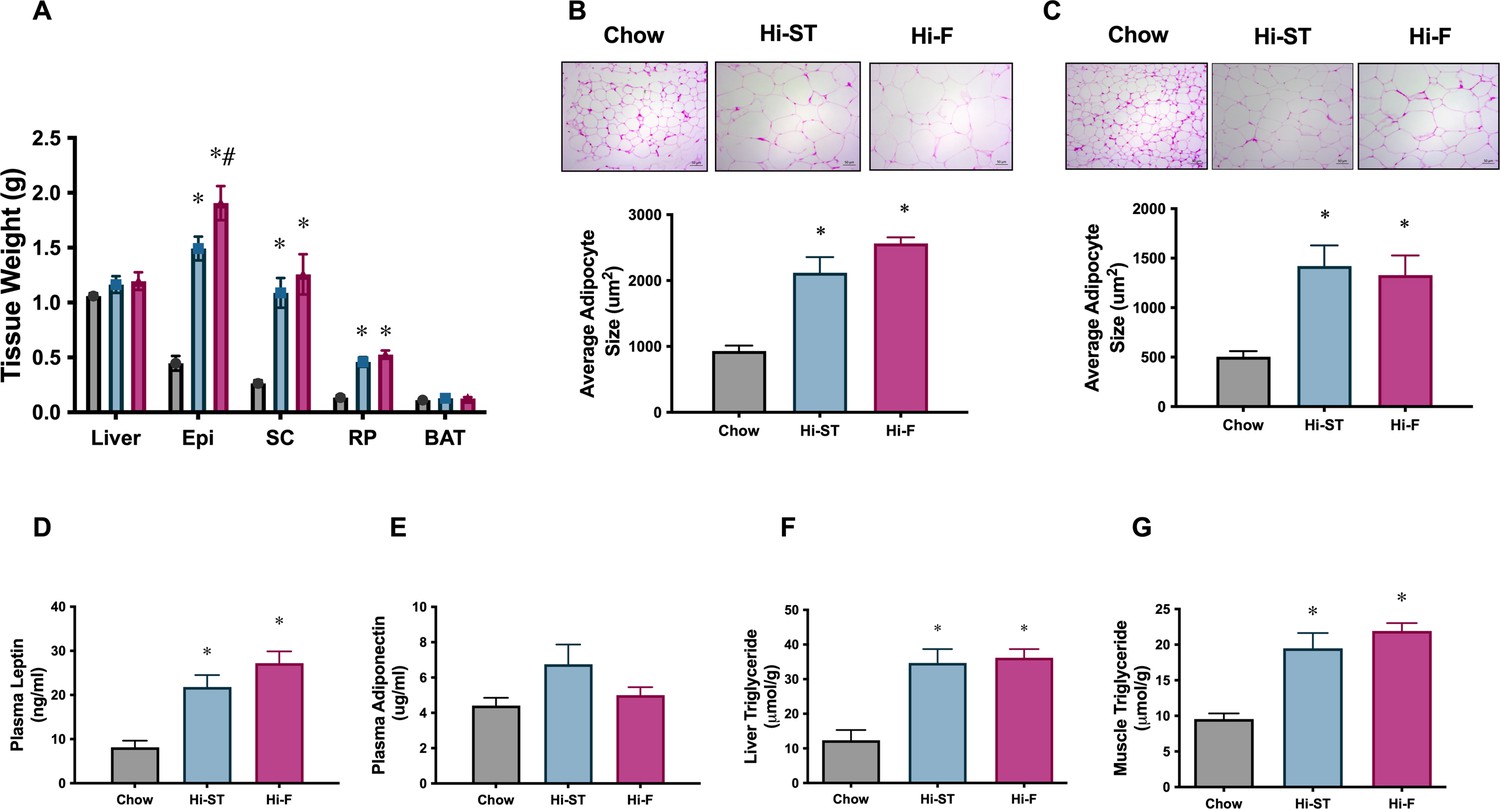
Adipose tissue weights, and adipocyte size, were increased to a similar extent in high starch (Hi-ST) and high fat (Hi-F) as were plasma leptin and the level of triglycerides in liver and muscle.
(A) Tissue weights, n=9–11, (B) average adipocyte size in epididymal white adipose tissue (WAT), (C) average adipocyte size in subcutaneous WAT, n=3–5, plasma levels of (D) leptin and (E) adiponectin, n=10–11. (F) Liver triglyceride levels, n=5–8, (G) quadriceps muscle triglyceride levels, n=9–12. Grey – chow, blue – Hi-ST, pink – Hi-F. Data presented as mean ± SEM. Data analysed with a one-way ANOVA. *p<0.05 different to chow; #p<0.05 different to Hi-ST.
-
Figure 4—source data 1
Raw data for Figure 4.
- https://cdn.elifesciences.org/articles/79250/elife-79250-fig4-data1-v2.xlsx
Figure 5

The increased liver triglycerides in the high starch (Hi-ST) mice was due to an upregulation of the de novo lipogenic pathway.
(A) Liver triglycerides, (B) liver lipogenic rate, (C) brown adipose tissue (BAT) lipogenic rate, (D) white adipose tissue (WAT) lipogenic rates, n=12–15, (E) western blots of acetyl CoA carboxylase (ACC), fatty acid synthase (FAS), and stearoyl-CoA desaturase-1 (SCD-1), (F) densitometry of protein levels of ACC, FAS, and SCD-1, (G) ATP citrate lysase (ACL) activity and (H) glucose-6-phosphate dehydrogenase (G6PDH) activity, n=9–10. Grey – chow, blue – Hi-ST, pink – high fat (Hi-F). Data presented as mean ± SEM. Data analysed with a one-way ANOVA. *p<0.05 different to chow; #p<0.05 different to Hi-ST.
-
Figure 5—source data 1
Raw data for Figure 5.
- https://cdn.elifesciences.org/articles/79250/elife-79250-fig5-data1-v2.xlsx
-
Figure 5—source data 2
Raw western blot images for Figure 5.
- https://cdn.elifesciences.org/articles/79250/elife-79250-fig5-data2-v2.zip
Figure 6 with 2 supplements

Reduction in total ceramide levels, as well as specific ceramide species that are correlated with insulin sensitivity, is found in the liver and quadriceps muscle of high starch (Hi-ST) fed mice.
(A) Total lipid levels, (B) diacylglycerol (DAG) species, (C) ceramide species, and (D) the relationship between insulin sensitivity and Cer18:0 levels in muscle. (E) Total lipid levels, (F) DAG species, (G) ceramide species, and (H) the relationship between insulin sensitivity and Cer22:0 levels in liver. Grey – chow, blue – Hi-ST, pink – high fat (Hi-F). Data presented as mean ± SEM. Data analysed with a Kruskal-Wallis test with pairwise Wilcoxon rank sum used for post hoc comparisons. Data were corrected for false discovery rate using the method of Benjamini-Hochberg. n=8–11. *p<0.05 different to chow; #p<0.05 different to Hi-ST.
-
Figure 6—source data 1
Raw data for Figure 6.
- https://cdn.elifesciences.org/articles/79250/elife-79250-fig6-data1-v2.xlsx
Figure 6—figure supplement 1
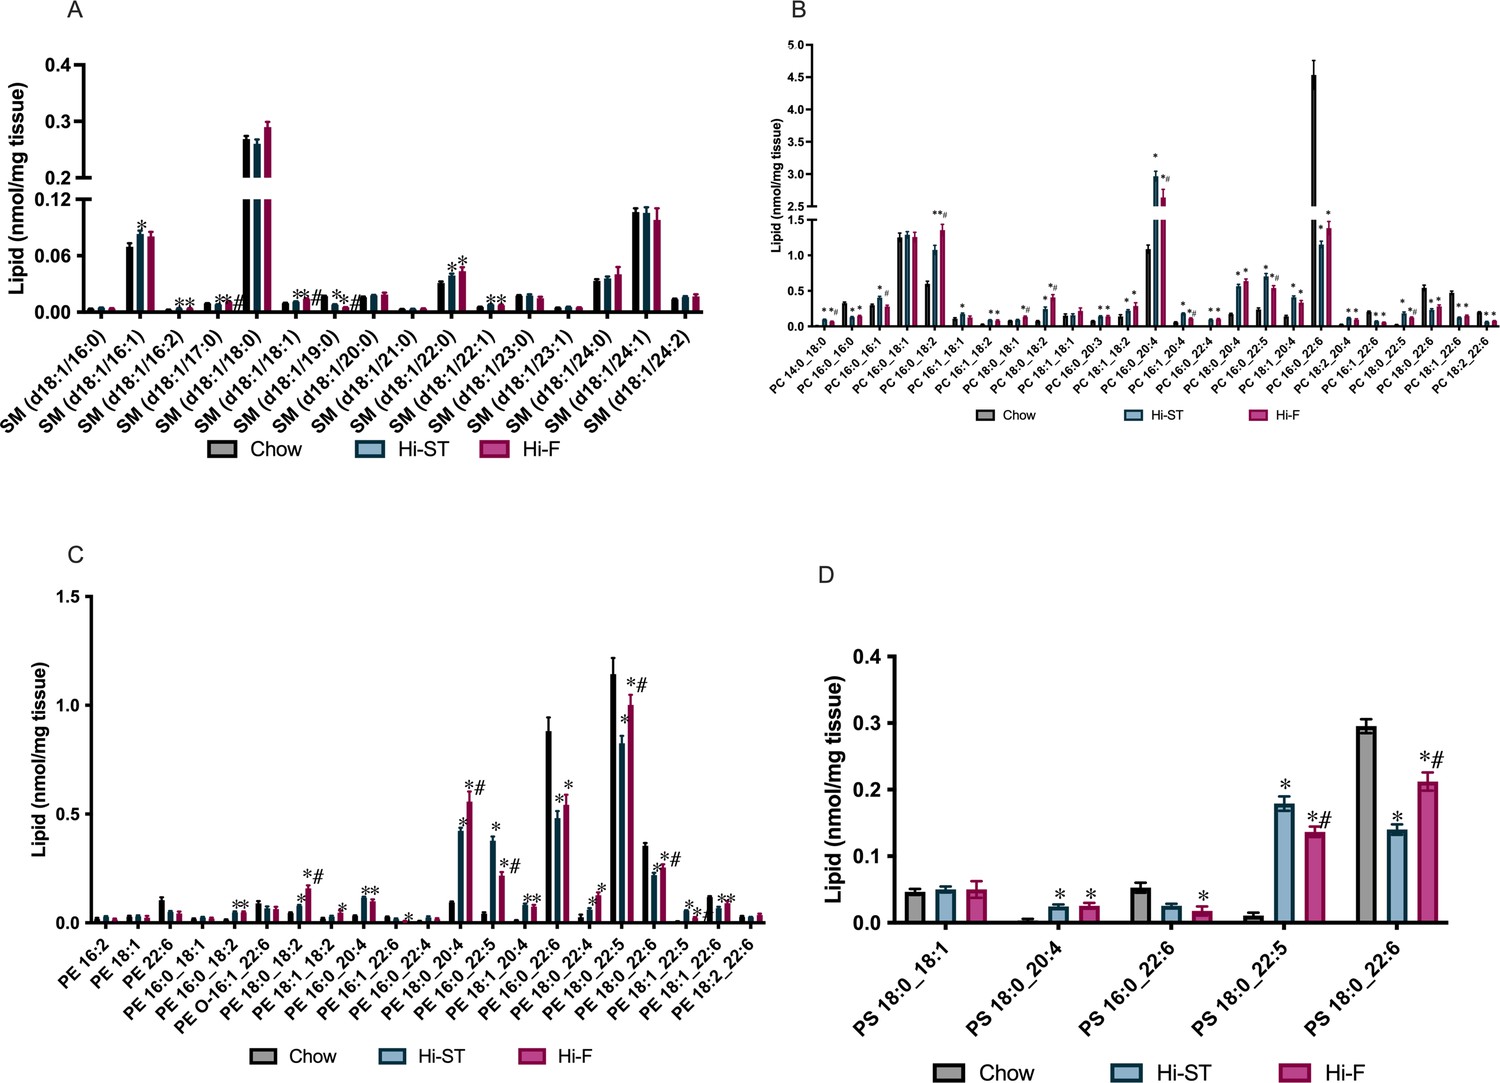
Levels of sphingomyelin (SM), phosphatidylcholine (PC), phosphatidylethanolamine (PE), or phosphatidylserine (PS) in muscle.
Grey – chow, blue – high starch (Hi-ST), pink – high fat (Hi-F). Data presented as mean ± SEM. Data analysed with a Kruskal-Wallis test with pairwise Wilcoxon rank sum used for post hoc comparisons. Data were corrected for false discovery rate using the method of Benjamini-Hochberg. n=9–11. *p<0.05 different to chow; #p<0.05 different to Hi-ST.
-
Figure 6—figure supplement 1—source data 1
Raw data for Figure 6—figure supplement 1.
- https://cdn.elifesciences.org/articles/79250/elife-79250-fig6-figsupp1-data1-v2.xlsx
Figure 6—figure supplement 2

Levels of sphingomyelin (SM), phosphatidylcholine (PC), phosphatidylethanolamine (PE), phosphatidylserine (PS), and cholesterol esters (CE) in liver.
Grey – chow, blue – high starch (Hi-ST), pink – high fat (Hi-F). Data presented as mean ± SEM. Data analysed with a Kruskal-Wallis test with pairwise Wilcoxon rank sum used for post hoc comparisons. Data were corrected for false discovery rate using the method of Benjamini-Hochberg. n=9–11. *p<0.05 different to chow; #p<0.05 different to Hi-ST.
-
Figure 6—figure supplement 2—source data 1
Raw data for Figure 6—figure supplement 2.
- https://cdn.elifesciences.org/articles/79250/elife-79250-fig6-figsupp2-data1-v2.xlsx
Tables
Table 1
Enzyme activities in liver and muscle.
| Enzyme activityμmol/min/g protein | Chow | Hi-ST | Hi-F |
|---|---|---|---|
| Liver | |||
| Citrate synthase | 110.8±7.3 | 140.1±3.0* | 119.9±6.1 |
| βHAD | 100.4±5.2 | 117.0±2.1 | 122.7±7.0* |
| Succinate dehydrogenase | 14.1±0.6 | 15.1±0.4 | 15.1±1.2 |
| Pyruvate dehydrogenase | 0.90±0.21 | 0.73±0.33 | 0.36±0.07 |
| Quadriceps muscle | |||
| Citrate synthase | 188.7±5.1 | 208.0±6.0* | 223.1±3.7* |
| βHAD | 23.9±1.2 | 28.4±1.4* | 35.4±1.2*# |
| Succinate dehydrogenase | 2.7±0.1 | 2.7±0.1 | 2.5±0.2 |
| Pyruvate dehydrogenase | 0.46±0.08 | 0.33±0.10 | 0.15±0.04* |
-
Data expressed as mean ± SEM. n=7–10. *p<0.05 compared to chow; #p<0.05 compared to Hi-ST.
-
Table 1—source data 1
Raw data for Table 1.
- https://cdn.elifesciences.org/articles/79250/elife-79250-table1-data1-v2.xlsx
Additional files
-
Supplementary file 1
Tables showing (a) muscle metabolomics, (b) liver metabolomics, and (c) diet composition.
- https://cdn.elifesciences.org/articles/79250/elife-79250-supp1-v2.docx
-
MDAR checklist
- https://cdn.elifesciences.org/articles/79250/elife-79250-mdarchecklist1-v2.docx
-
Source data 1
Raw data for Supplementary file 1a.
- https://cdn.elifesciences.org/articles/79250/elife-79250-data1-v2.xlsx
-
Source data 2
Raw data for Supplementary file 1b.
- https://cdn.elifesciences.org/articles/79250/elife-79250-data2-v2.xlsx
Download links
A two-part list of links to download the article, or parts of the article, in various formats.
Downloads (link to download the article as PDF)
Open citations (links to open the citations from this article in various online reference manager services)
Cite this article (links to download the citations from this article in formats compatible with various reference manager tools)
Insulin sensitivity is preserved in mice made obese by feeding a high starch diet
eLife 11:e79250.
https://doi.org/10.7554/eLife.79250


