Memory persistence and differentiation into antibody-secreting cells accompanied by positive selection in longitudinal BCR repertoires
- Skolkovo Institute of Science and Technology, Russian Federation
- Shemyakin-Ovchinnikov Institute of Bioorganic Chemistry, Russian Federation
- Institute of Translational Medicine, Pirogov Russian National Research Medical University, Russian Federation
- A.A. Kharkevich Institute for Information Transmission Problems of the Russian Academy of Sciences, Russian Federation
Figures
Figure 1 with 4 supplements
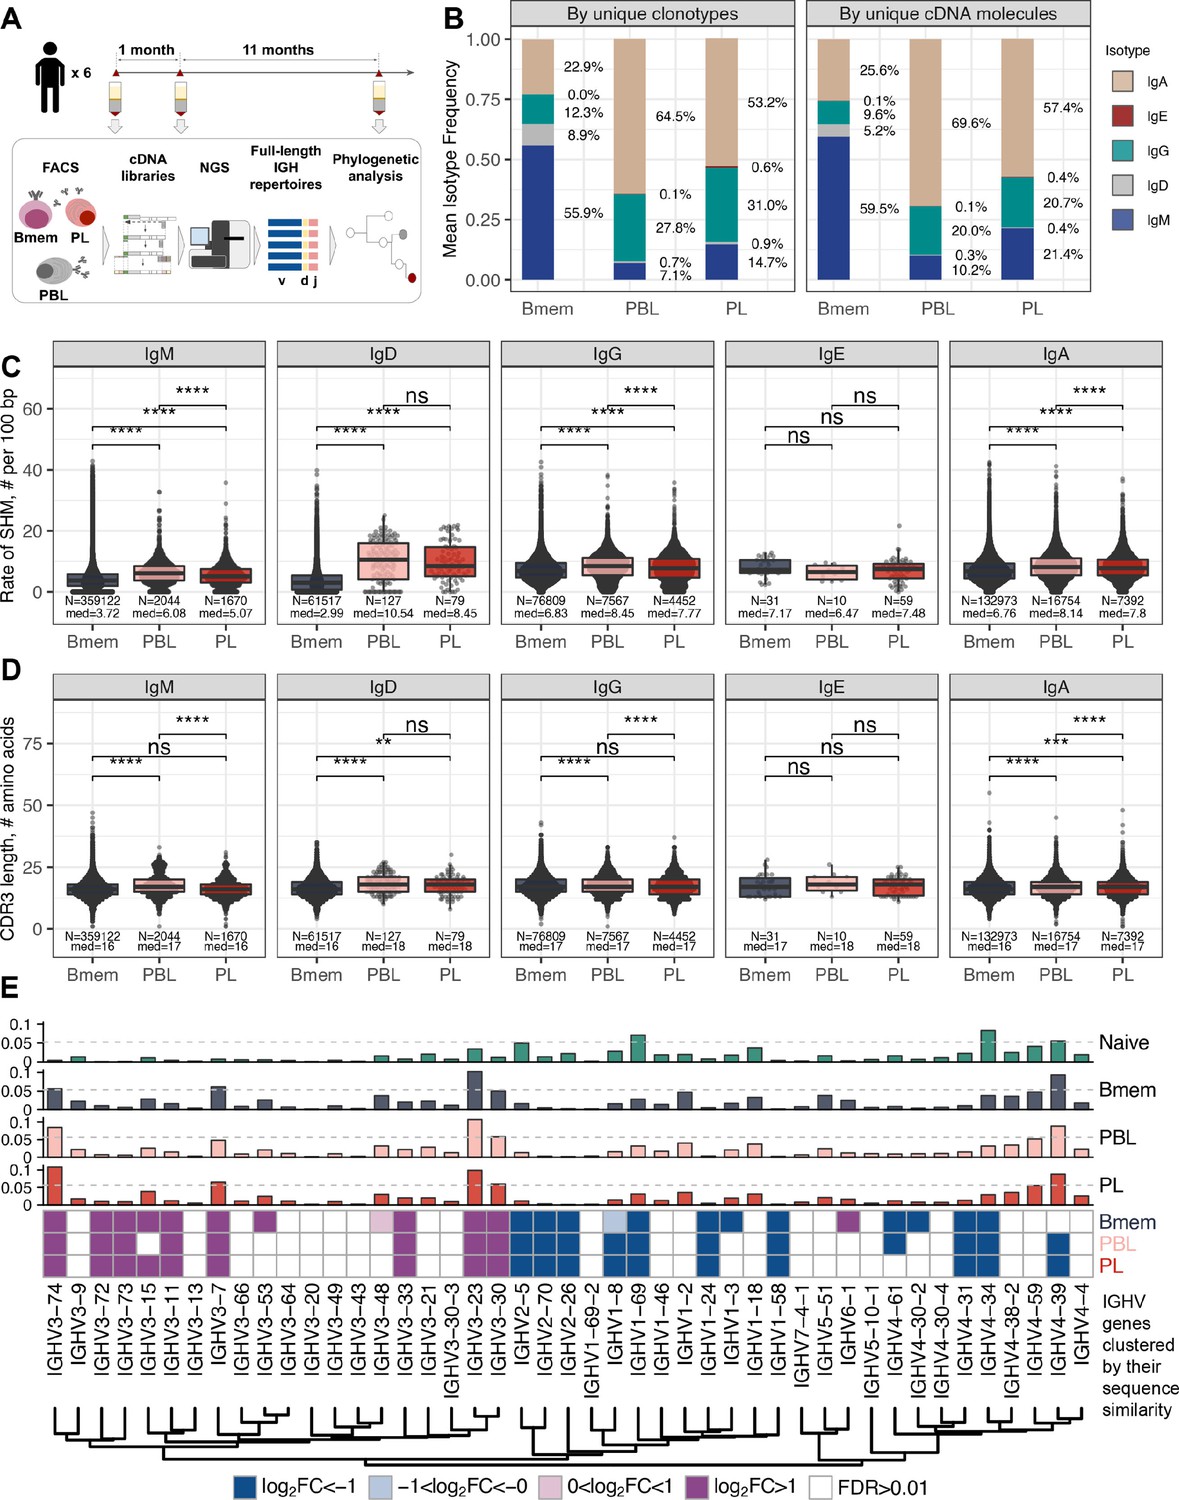
General characteristics of IGH repertoires in differentiated B cell lineage subsets.
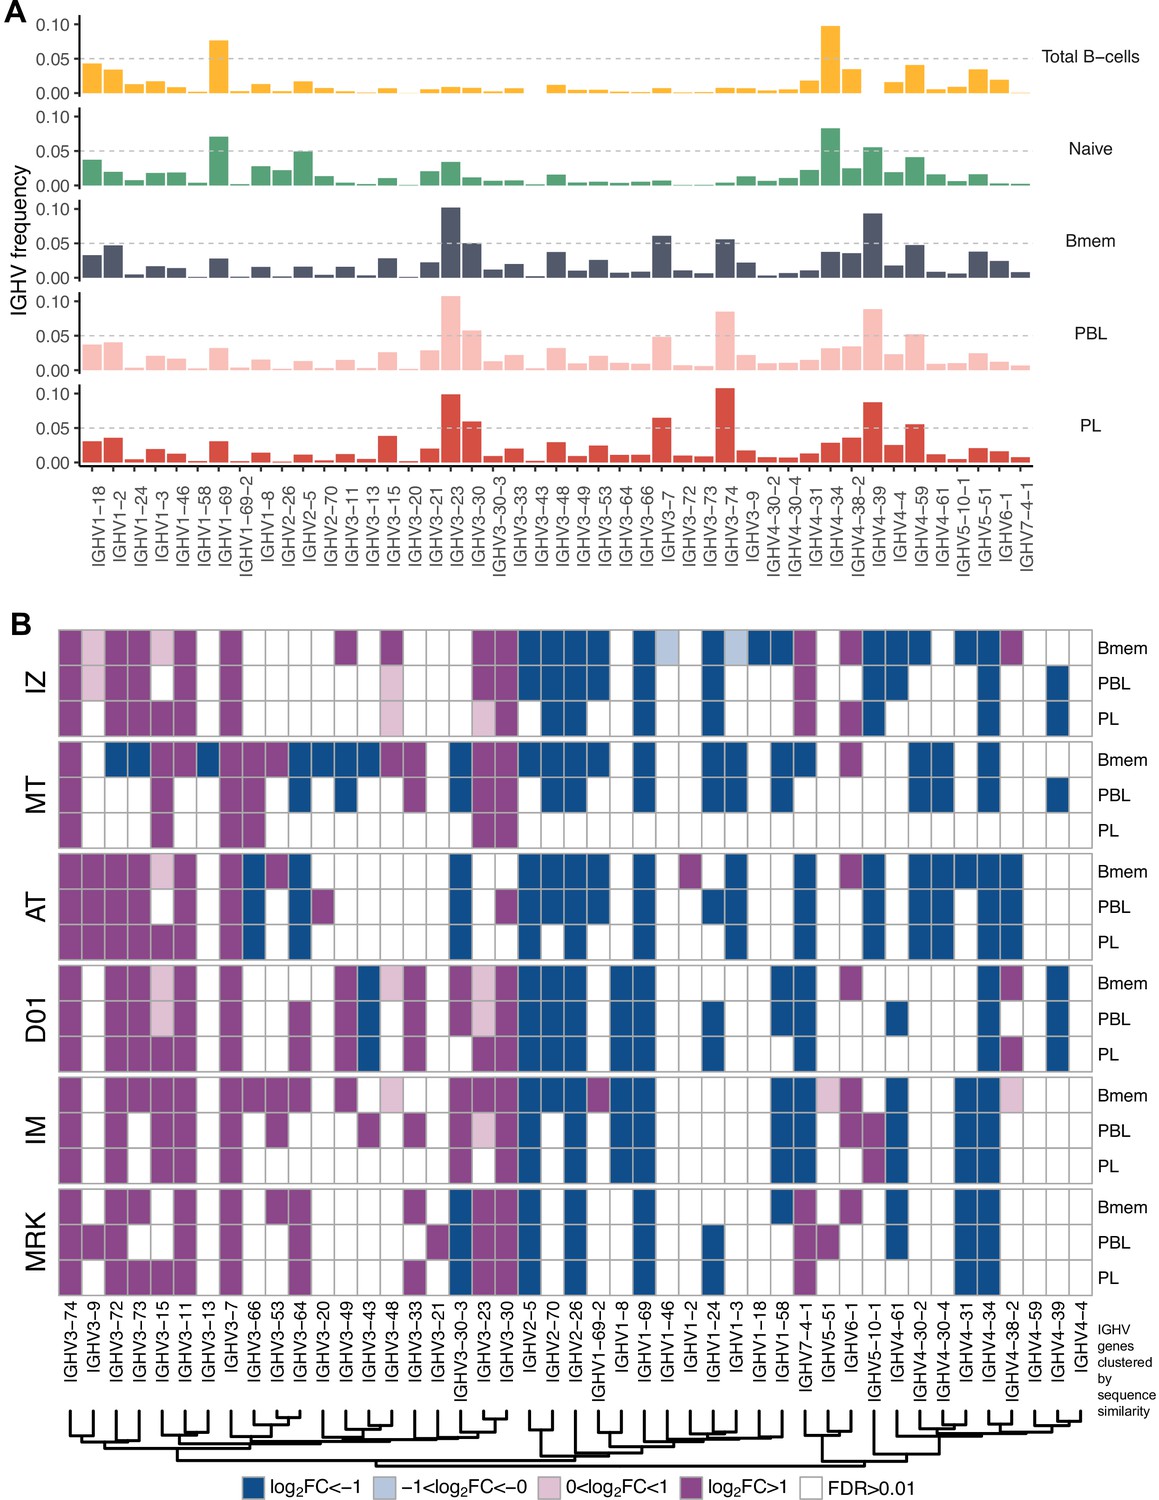
(A) Study design. Peripheral blood from six donors was sampled at three time points: T1 – initial time point, T2 – 1 month, and T3 – 12 months after the start of the study. At each time point, we isolated peripheral blood mononuclear cells (PBMCs) and sorted memory B cells (Bmem: CD19+ CD20+ CD27+), plasmablasts (PBL: CD19low/+ CD20- CD27high CD138-), and plasma cells (PL: CD19low/+ CD20- CD27high CD138+) in two replicates using fluorescence-activated cell sorting (FACS). For each cell sample, we obtained IGH clonal repertoires by sequencing respective cDNA libraries covering full-length IGH variable domain. (B) Proportion of isotypes in studied cell subsets averaged across all obtained repertoires. Left, frequency of unique IGH clonotypes with each particular isotype. Right, frequency of each isotype based on IGH cDNA molecules detected in a sample. (C) Distribution of the number of somatic hypermutations identified per 100 bp length of IGHV segment for clonotypes within each particular isotype. (D) Distribution of CDR3 length of clonotypes in each cell subset by isotype. (E) Distributions of average IGHV gene frequencies based on number of clonotypes in naive B cells (data from Gidoni et al., 2019), Bmem, PBL, and PL repertoires are shown at the top. Colored squares on heatmap indicate significantly different (false discovery rate, FDR < 0.01) frequencies for IGHV gene segments in corresponding B cell subsets compared to naive B cell repertoires. Color intensity reflects the magnitude of the difference (FC = fold change). Only V genes represented by more than two clonotypes on average are shown, data normalization was performed using trimmed mean of M values method (Robinson and Oshlack, 2010). IGHV gene segments are clustered based on the similarity of their amino acid sequence, as indicated by the dendrogram at the bottom. In C and D, the numbers at the bottom of the plots represent the number of clonotypes in the corresponding group, pooled from all donors, and the median measurements from each cell type. Comparisons between subsets were performed with two-sided Mann-Whitney U test. *=p ≤ 0.05, **=p ≤ 0.01, ***=p ≤ 10–3, ****=p ≤ 10–4.
-
Figure 1—source data 1
Reperoire sequencing statistics for cell samples.
- https://cdn.elifesciences.org/articles/79254/elife-79254-fig1-data1-v3.xlsx
-
Figure 1—source data 2
Isotype frequencies per cell sample.
- https://cdn.elifesciences.org/articles/79254/elife-79254-fig1-data2-v3.xlsx
Figure 1—figure supplement 1
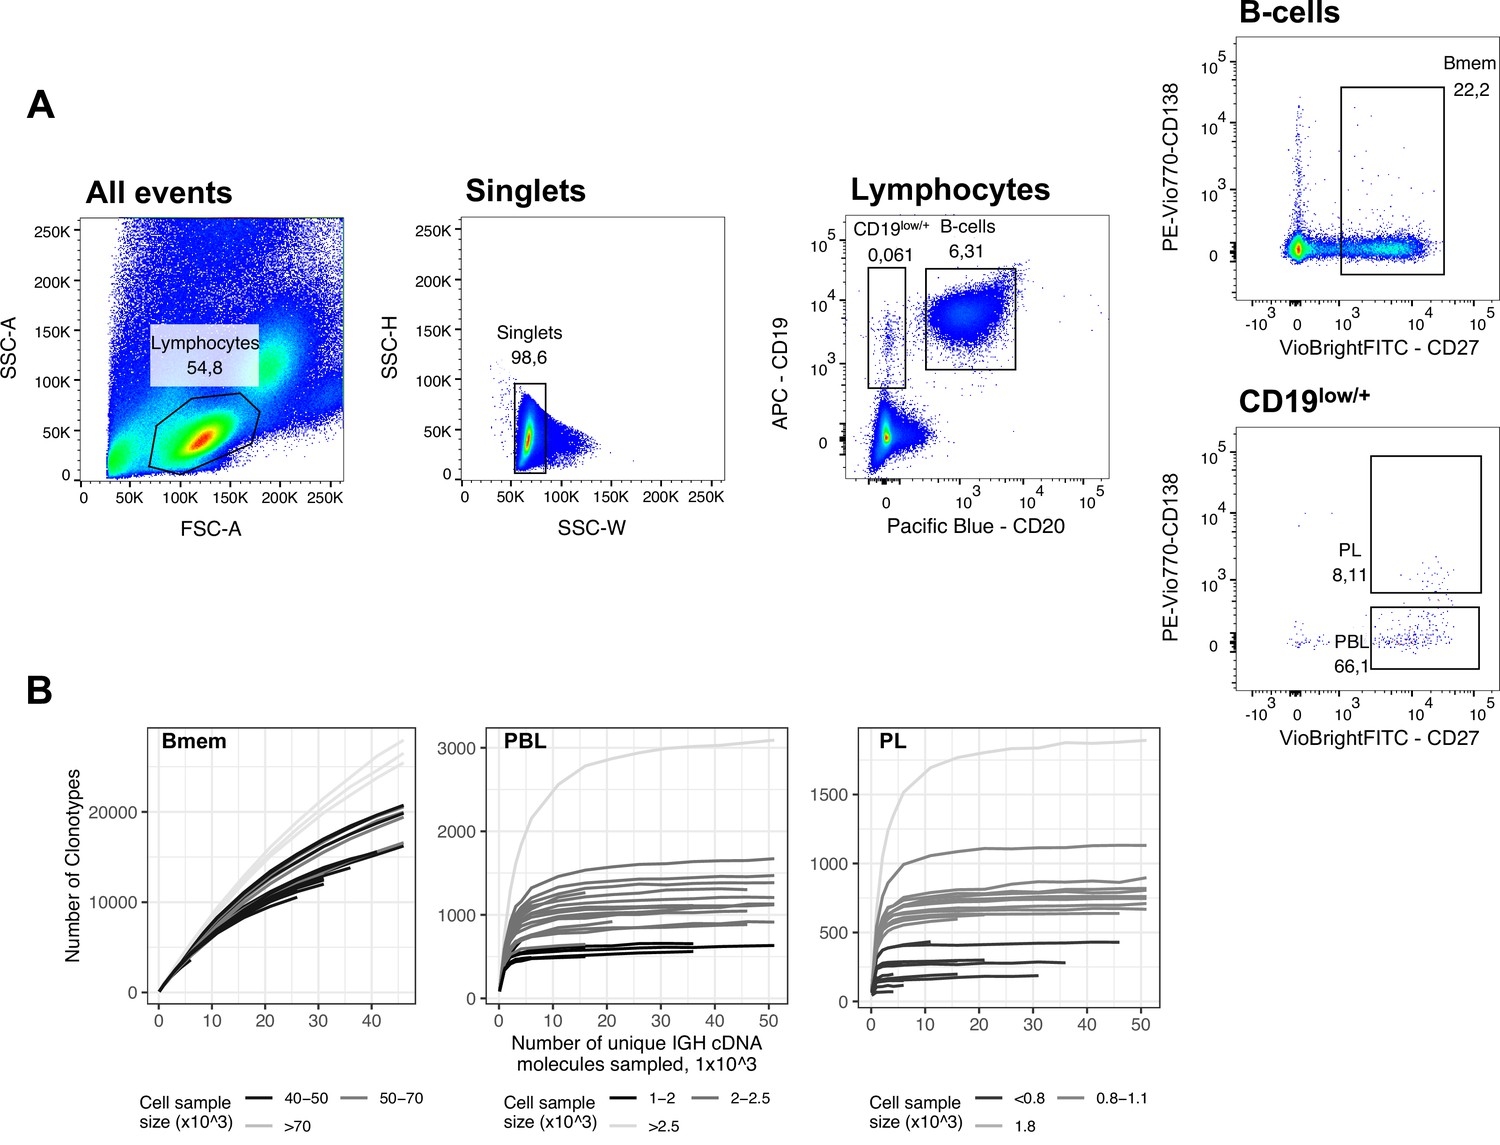
FACS gating strategy and rarefaction analysis of clonal diversity for memory B cells, plasmablasts and plasma cells.
(A) Fluorescence-activated cell sorting (FACS) gating strategy and frequencies of the following studied cell subsets for a representative peripheral blood sample (donor IZ, time point T3): Memory B cells (Bmem: CD19+ CD20+ CD27+), plasmablasts (PBL: CD19low/+ CD20- CD27high CD138-), and plasma cells (PL: CD19low/+ CD20- CD27high CD138+). (B) Rarefaction curves for IGH cDNA molecules. From each repertoire, we sampled a defined number of unique IGH cDNA molecules and determined the number of unique IGH clonotypes. Each line represents a single sample. Shading of the lines indicates the number of cells sampled for each curve.
Figure 1—figure supplement 2
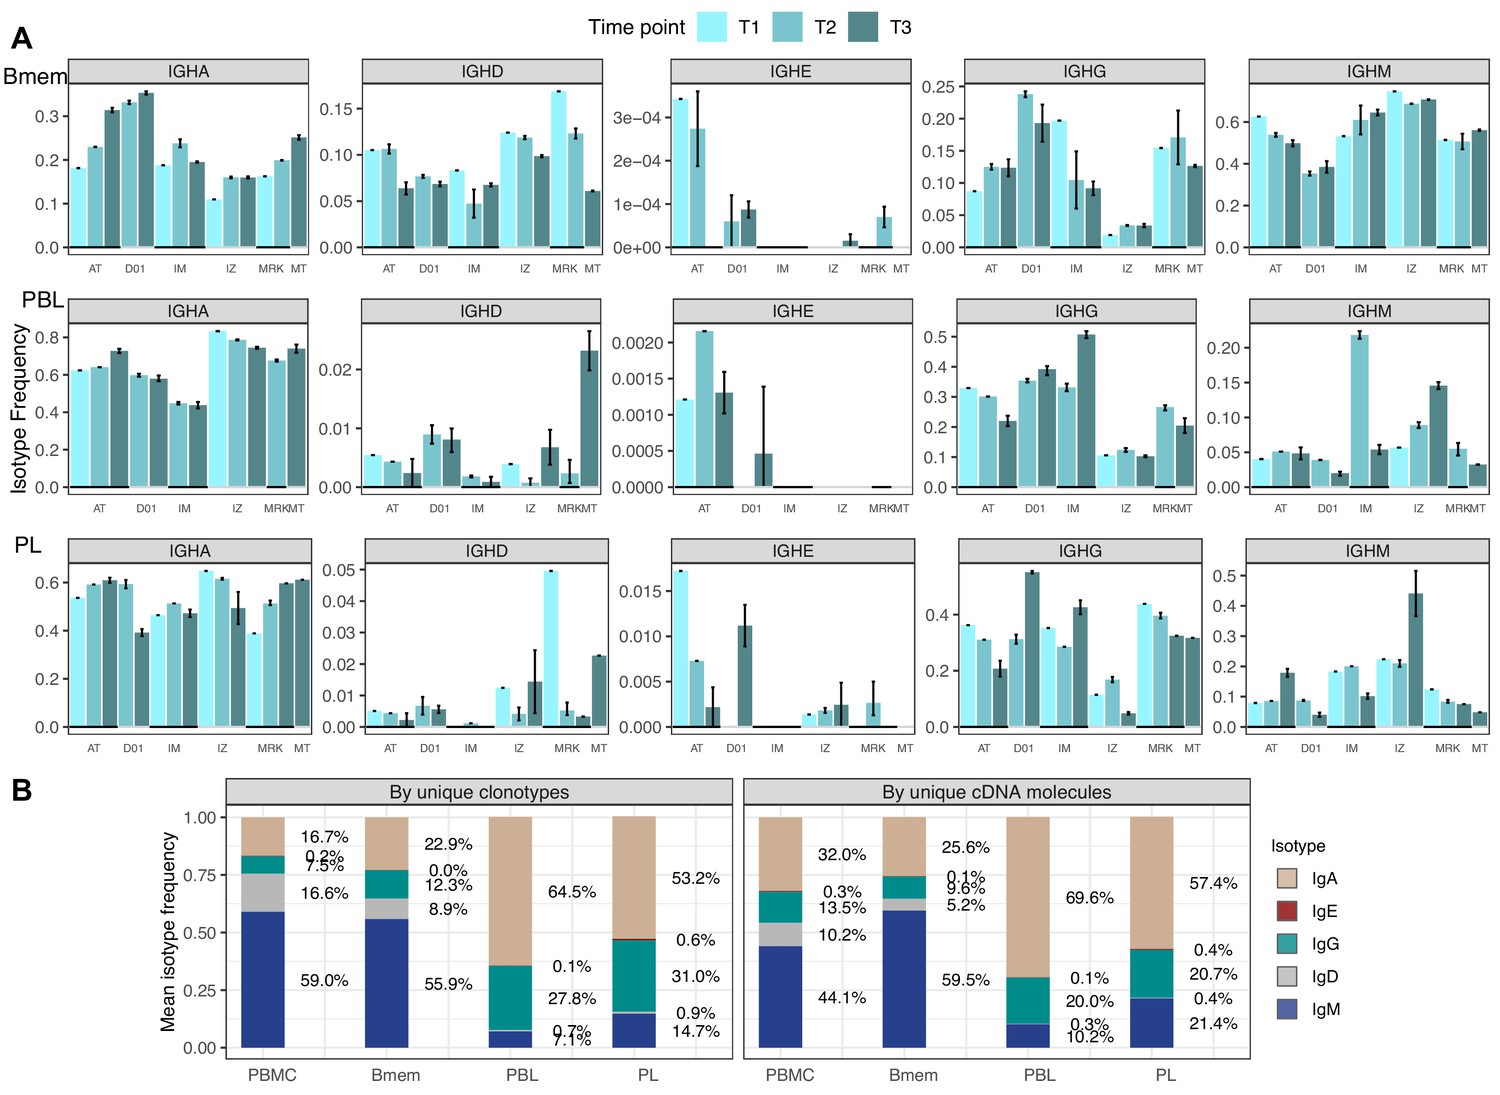
Isotype frequencies in studied subsets.
(A) Isotype frequencies in studied cell subsets and bulk peripheral blood mononuclear cells (PBMCs) averaged across all samples. Frequencies were calculated as the number of IGH clonotypes (unique nucleotide sequences covering the full-length VDJregion), with specific isotypes divided by total number of clonotypes (left), or as the number of cDNA molecules in each isotype divided by the total number of cDNA molecules. (B) Isotype frequencies based on unique clonotypes for different cell types in each individual donor sample. Whiskers illustrate minimal and maximal isotype frequencies for the group. Black and gray lines at the bottom of the plot indicate groups of bars corresponding to a particular donor.
Figure 1—figure supplement 3
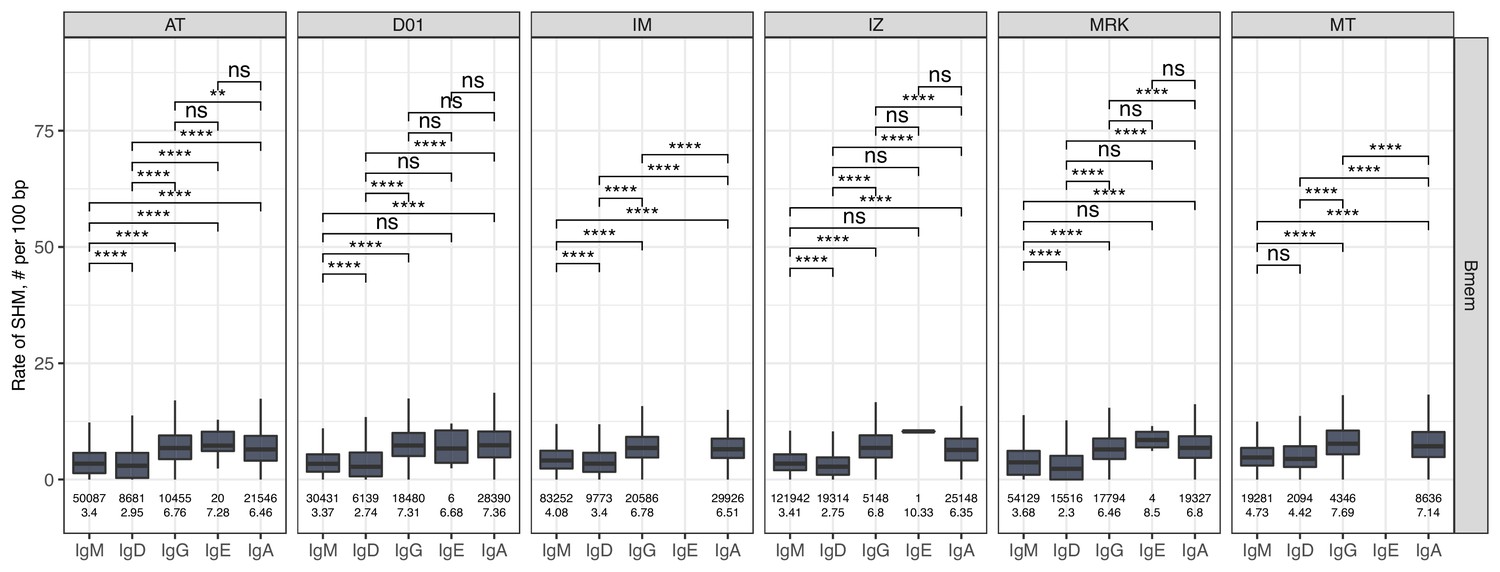
The level of SHM in isotypes.
Number of SHMs identified per 100 bp length of IGHV for clonotypes within each individual repertoire for particular isotype. Numbers below each box represent the number of observations (individual clonotypes) and median number of SHMs. Comparisons between isotypes were performed with two-sided Mann-Whitney U test. *=p ≤ 0.05, **=p ≤ 0.01, ***=p ≤ 10–3, ****=p ≤ 10–4.
Figure 1—figure supplement 4
IGHV gene frequencies in studied cell subsets.
(A) Distributions of average IGHV gene frequencies in repertoires of total B cells, naive B cells (from Gidoni et al., 2019), memory B (Bmem), plasmablasts (PBL), and plasma (PL) cells. (B) Heatmaps of IGHV frequencies for individual donors. Colored squares on heatmap indicate significantly different (false discovery rate [FDR] < 0.01) IGHV gene segment usage frequency in corresponding B cell subsets vs. publicly available naive B cell repertoires. Color intensity reflects magnitude difference (FC = fold change). Only V genes represented by more than two clonotypes on average are shown. IGHV gene segments are ordered by similarity of their amino acid sequence, as indicated by the dendrogram at the bottom.
Figure 2 with 1 supplement

Memory B cells (Bmem), plasmablasts (PBL), and plasma cells (PL) IGH repertoire stability over time and similarity between individuals.
(A) Distance between repertoires obtained at different time points from the same or different donors as calculated by Jensen-Shannon divergence index for IGHV gene frequency distribution. (B) Number of shared clonotypes between pairs of repertoires from the same or different donors and time points. For data normalization, we assessed the most abundant 14,000 Bmem, 600 PBL, and 300 PL clonotypes. (C) The average number of shared clonotypes between repertoires from pairs of unrelated donors for the most abundant Bmem clonotypes, randomly selected Bmem clonotypes, most abundant clonotypes from naive repertoires of unrelated donors (from Gidoni et al., 2019), or from synthetic repertoires generated with OLGA software; each repertoire in comparison was represented by a fixed number of clonotypes (5000), either most abundant, randomly selected, or generated where indicated. (D) Inter-individual distance between distributions of V genes in repertoires, calculated as Jensen-Shannon divergence indices for the pairs of repertoires depicted in C. (E) Fraction of persistent clonotypes detected at more than one time point among clonotypes detected in repertoires from only one donor (private) or in at least two donors (public). Each dot represents the fraction of persistent clonotypes from one donor. In all plots, clonotypes are defined as having identical CDR3 amino acid sequences and the same IGHV gene segment and isotype. For A–D, each dot represents a pair of repertoires of the corresponding type; N indicates the number of pairs of repertoires in the group. Comparisons in all panels were performed with two-sided Mann-Whitney U test. *=p ≤ 0.05, **=p ≤ 0.01, ***=p ≤ 10–3, ****=p ≤ 10–4.
Figure 2—figure supplement 1
IGH repertoire similarity within B cell lineage subpopulations.
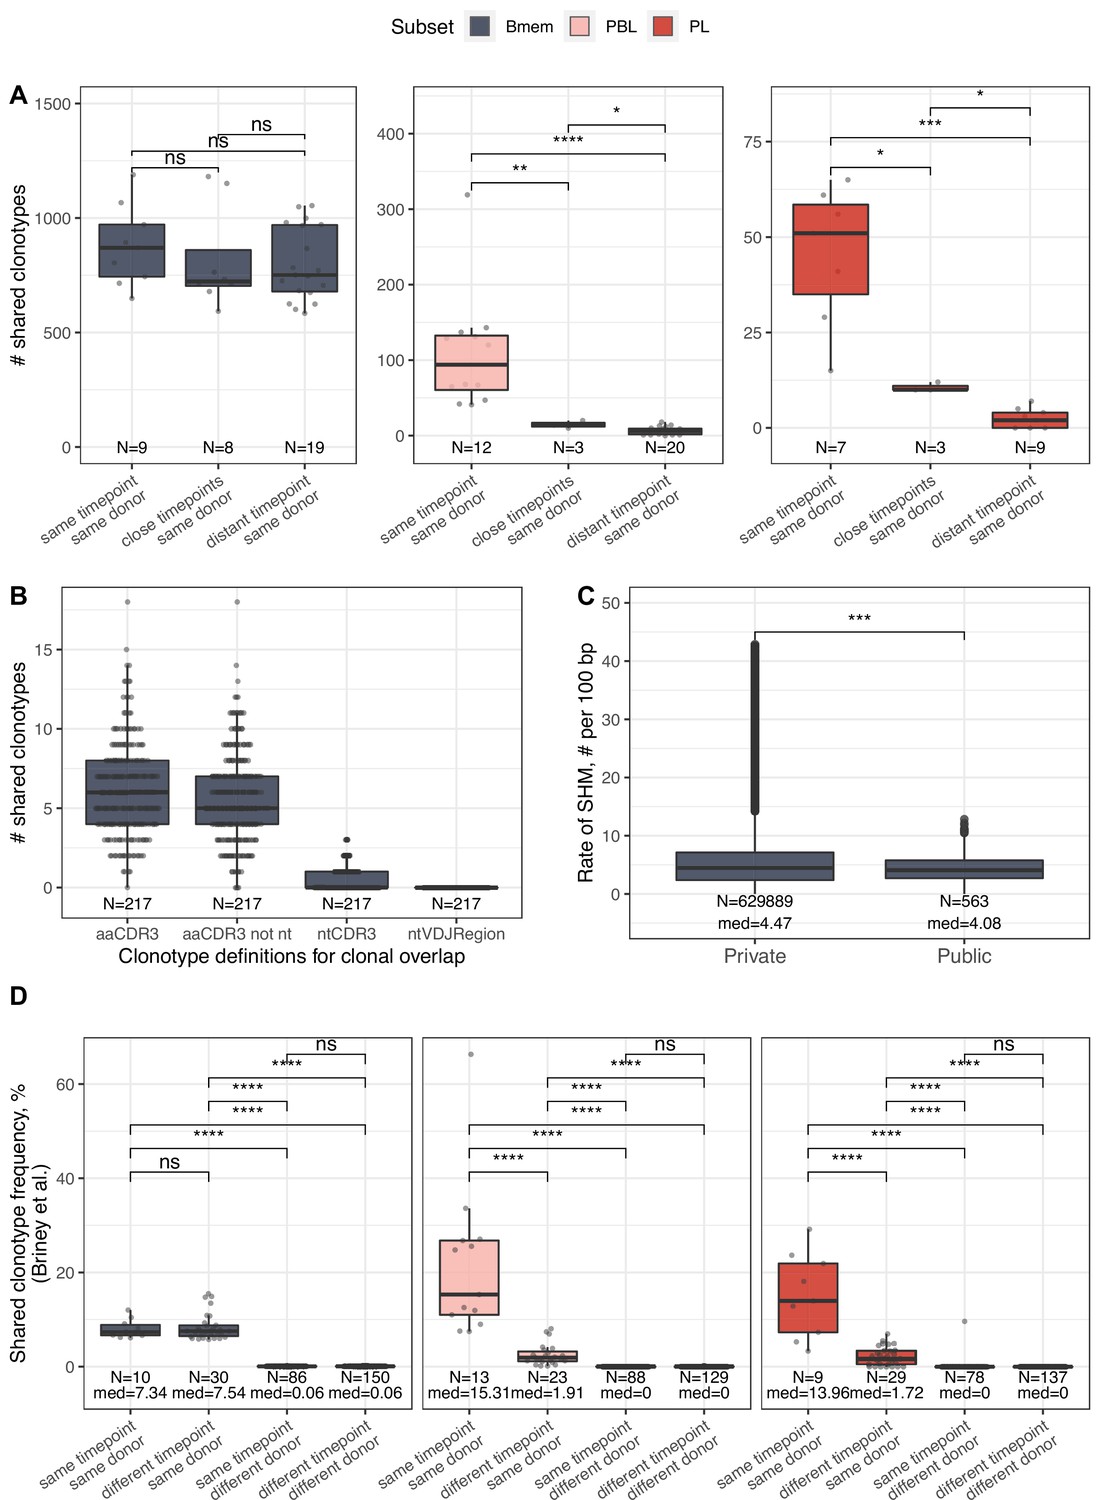
(A) Number of shared clonotypes from each B cell subset between repertoires from a given donor at various time points. ‘Same’ represents replicate samples from the same blood draw, ‘close’ samples were collected within ~1-month interval of each other, and ‘distant’ samples were separated by an ~11- to 12-month interval. (B) Number of shared clonotypes between pairs of repertoires from different donors with different clonotype definitions used to calculate overlap: aaCDR3=amino acid CDR3 sequence and V gene label; aaCDR3 not nt = amino acid CDR3 sequence and V gene label, excluding clonotypes with identical CDR3 nucleotide sequence; ntCDR3=nucleotide CDR3 sequence and V gene label; ntVDJRegion = full nucleotide sequence from the beginning of the IGH Framework 1 region to the end of the IGH Framework 4 region. (C) Distribution of the number of somatic hypermutations identified per 100 bp length of IGHV segment for clonotypes detected either in only one donor (private) or in at least two donors (public). (D) Shared clonotype frequency between pairs of repertoires, calculated as in Briney et al., 2019. For normalization purposes, we considered the 14,000 most abundant Bmem clonotypes, the 600 most abundant PBL clonotypes, and the 300 most abundant PL clonotypes. Dots in each plot represent pairs of repertoires of corresponding type. N=the number of pairs of repertoires in the group, and med = the median value. Comparisons in all panels were performed with Mann-Whitney test. *=p ≤ 0.05, **=p ≤ 0.01, ***=p ≤ 10–3, ****=p ≤ 10–4.
Figure 3 with 2 supplements

Temporal dynamics and composition of clonal lineages.
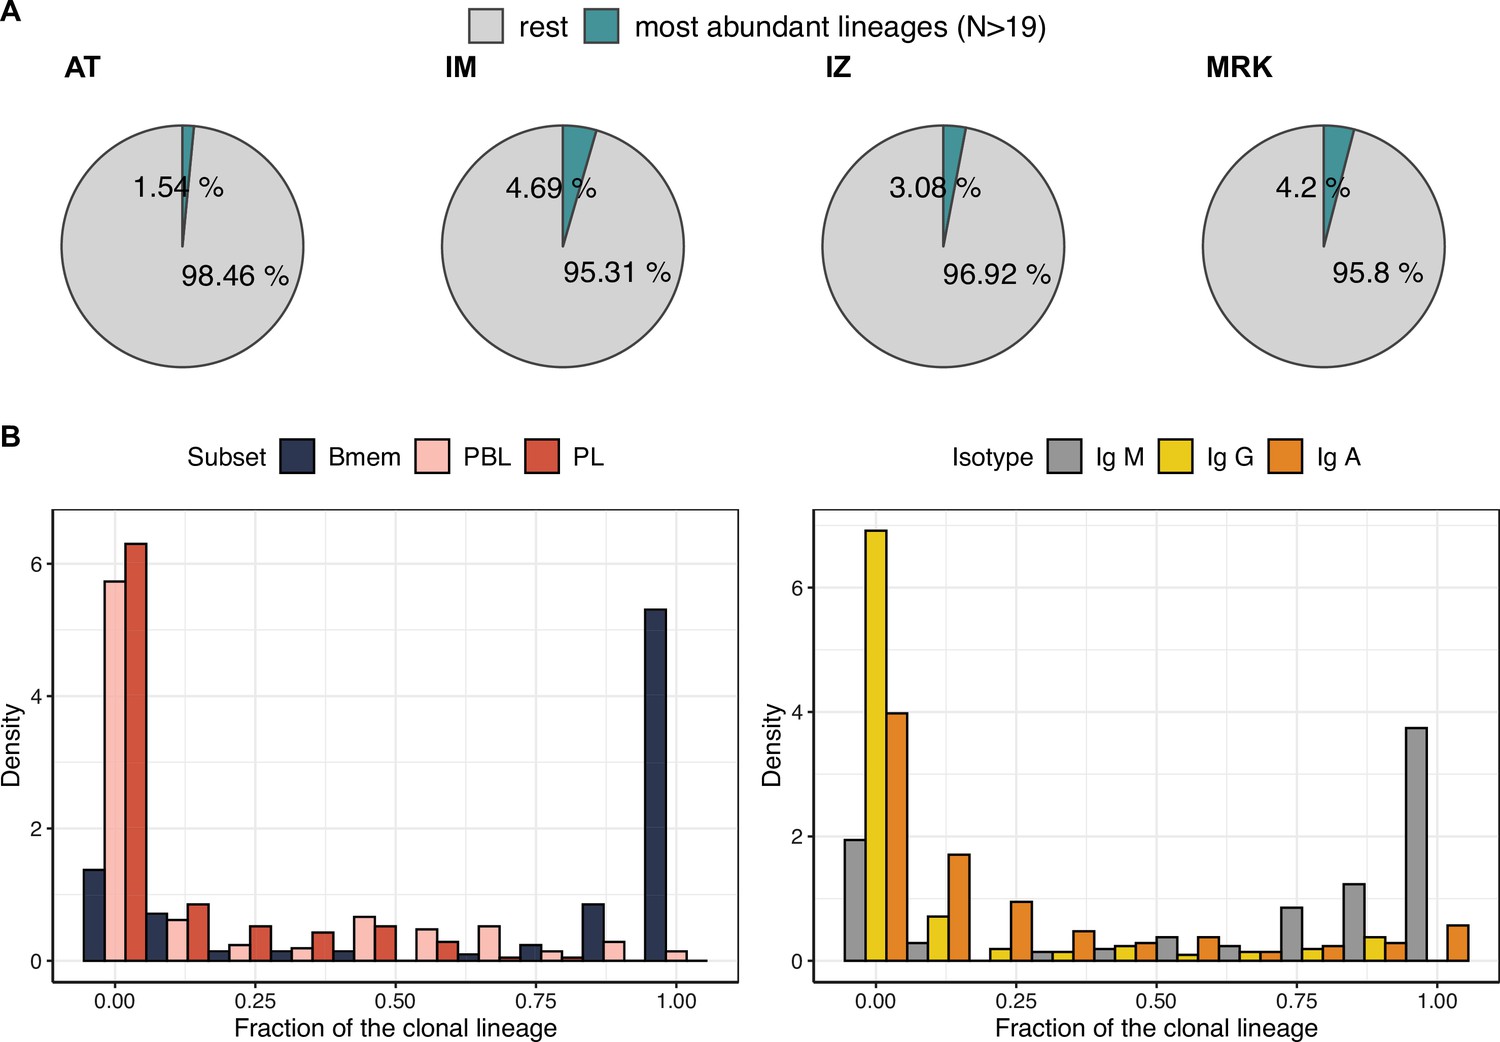
(A) Principal component analysis (PCA) of clonal lineage composition: proportions of memory B (Bmem), plasmablasts (PBL), and plasma (PL) cells as well as proportions of isotypes. Arrows represent projections of the corresponding variables onto the two-dimensional PCA plane, with lengths reflecting how well the variable explains the variance of the data. The two principal components (PC1 and PC2) cumulatively explain 90.9% of the variance. Clonal lineages are colored according to the clusters they were assigned to by the k-means algorithm. (B) Proportion of clonotypes from the various cell subset or isotypes in clonal lineages falling into the HBmem or LBmem clusters. (C) Dynamics of clonal lineage frequency, defined as the number of clonotypes in a lineage divided by the total number of clonotypes detected at a given time point. Each line connects points representing a unique clonal lineage (N=190). (D) Schematic representation of how we calculated clonal lineage persistence. is the maximum clonal lineage frequency among the three time points, and are the frequencies at the remaining two time points. (E) Spearman’s correlation between persistence of a clonal lineage and proportions of its clonotypes associated with a given B cell subset or isotype. (F) Comparison of persistence between HBmem and LBmem. (G) Fraction of public clonal lineages in the two clusters. Statistical significance for B, F, and G is calculated by the two-sided Mann-Whitney test. *=p ≤ 0.05, **=p ≤ 0.01, ***=p ≤ 10–3, ****=p ≤ 10–4.
Figure 3—figure supplement 1
Characteristics of the most abundant clonal lineages.
(A) Proportion of IGH clonotype diversity occupied by the most abundant clonal lineages (>19 unique clonotypes). (B) Distributions of fractions of cellular subtypes and isotypes in most abundant clonal lineages.
Figure 3—figure supplement 2
Size, reproducibility and dynamics of HBmem and LBmem clonal lineages.
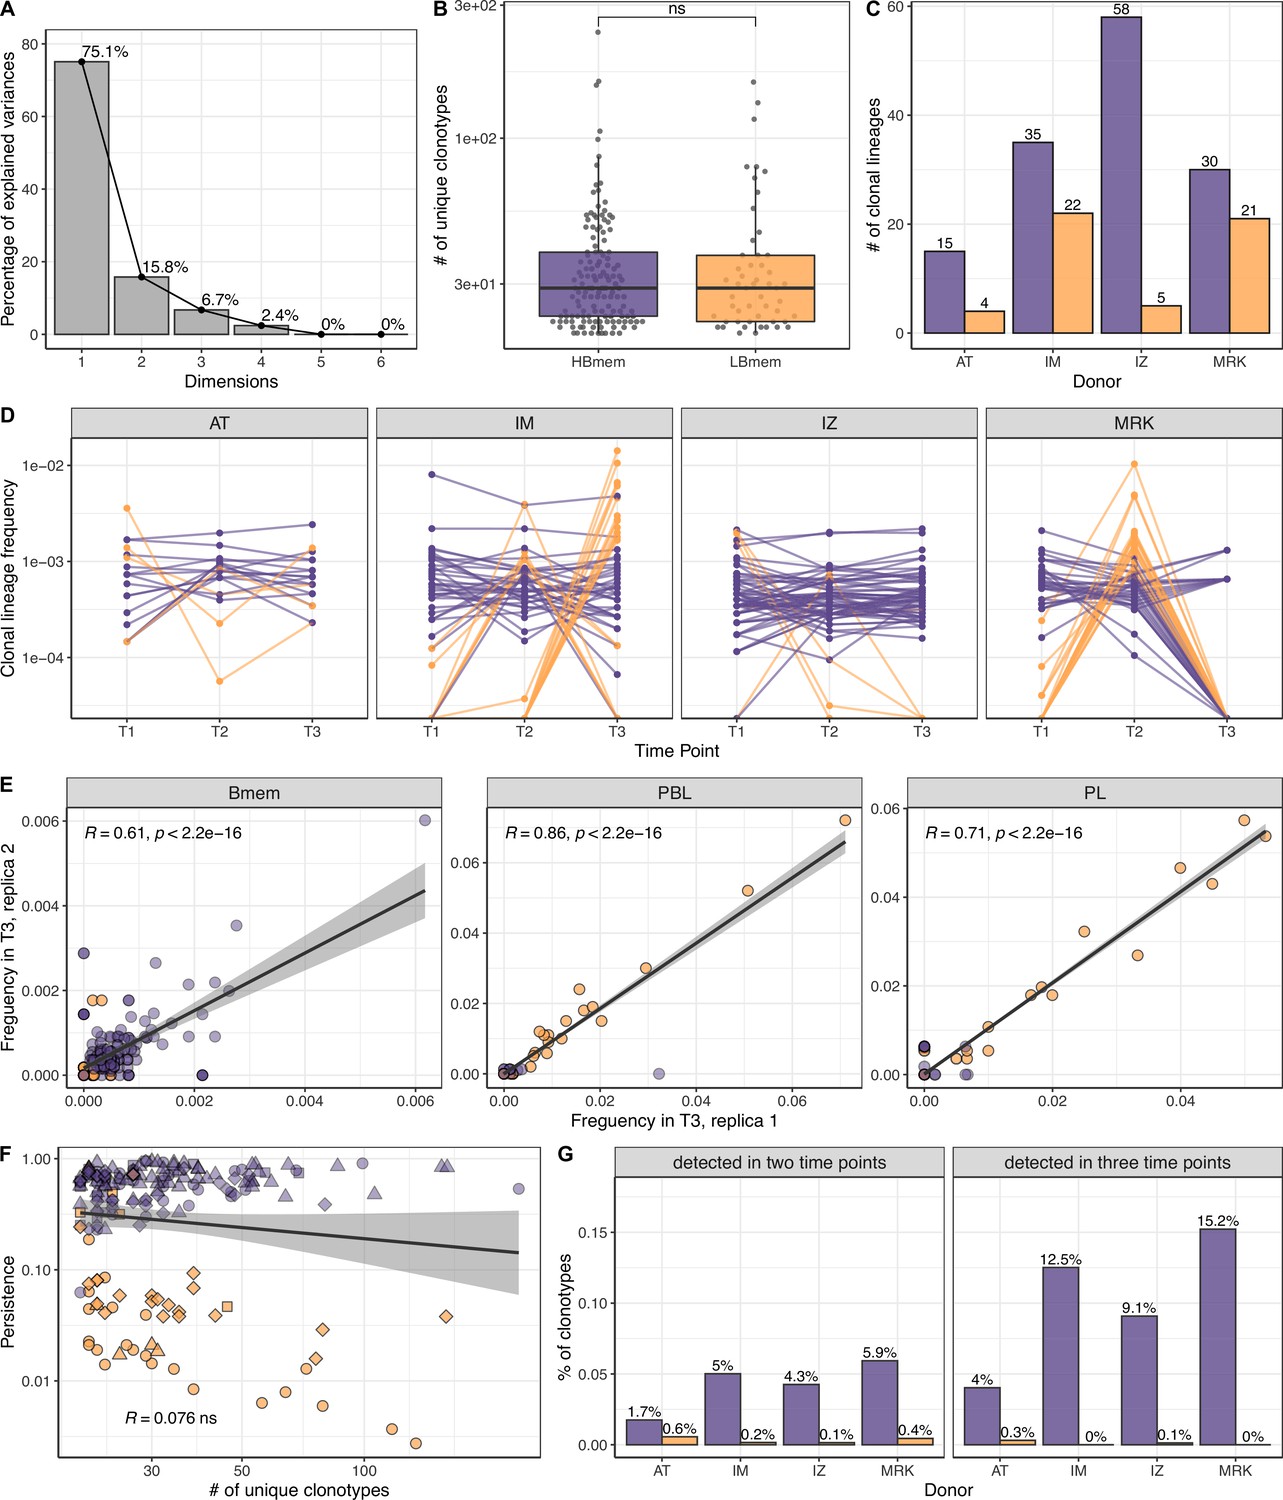
(A) Scree plot for the principal component analysis (PCA) from Figure 3A of the composition of clonal lineages, where fractions of memory B (Bmem), plasmablasts (PBL), plasma (PL) cells, and fractions of IgM, IgG, and IgA were used as variables. (B) Distribution of the number of unique clonotypes in a lineage for HBmem and LBmem. (C) The number of clonal lineages belonging to HBmem or LBmem clusters in each donor. (D) Dynamics of clonal lineage frequency from Figure 3C in individual donors.
Lineage frequency is defined as the number of clonotypes in a lineage divided by the total number of clonotypes detected at a given time point. Each line connects points representing a unique clonal lineage. (E) Spearman’s correlation between frequencies of clonal lineages in two replicates of time point 3 (T3) samples. Only clonal lineages sampled with at least one replica at this time point were included in the analysis. (F) Spearman’s correlation between the size of a clonal lineage and its persistence. (G) Fraction of clonotypes in HBmem or LBmem clonal lineages detected at two or three time points.
Figure 4 with 1 supplement
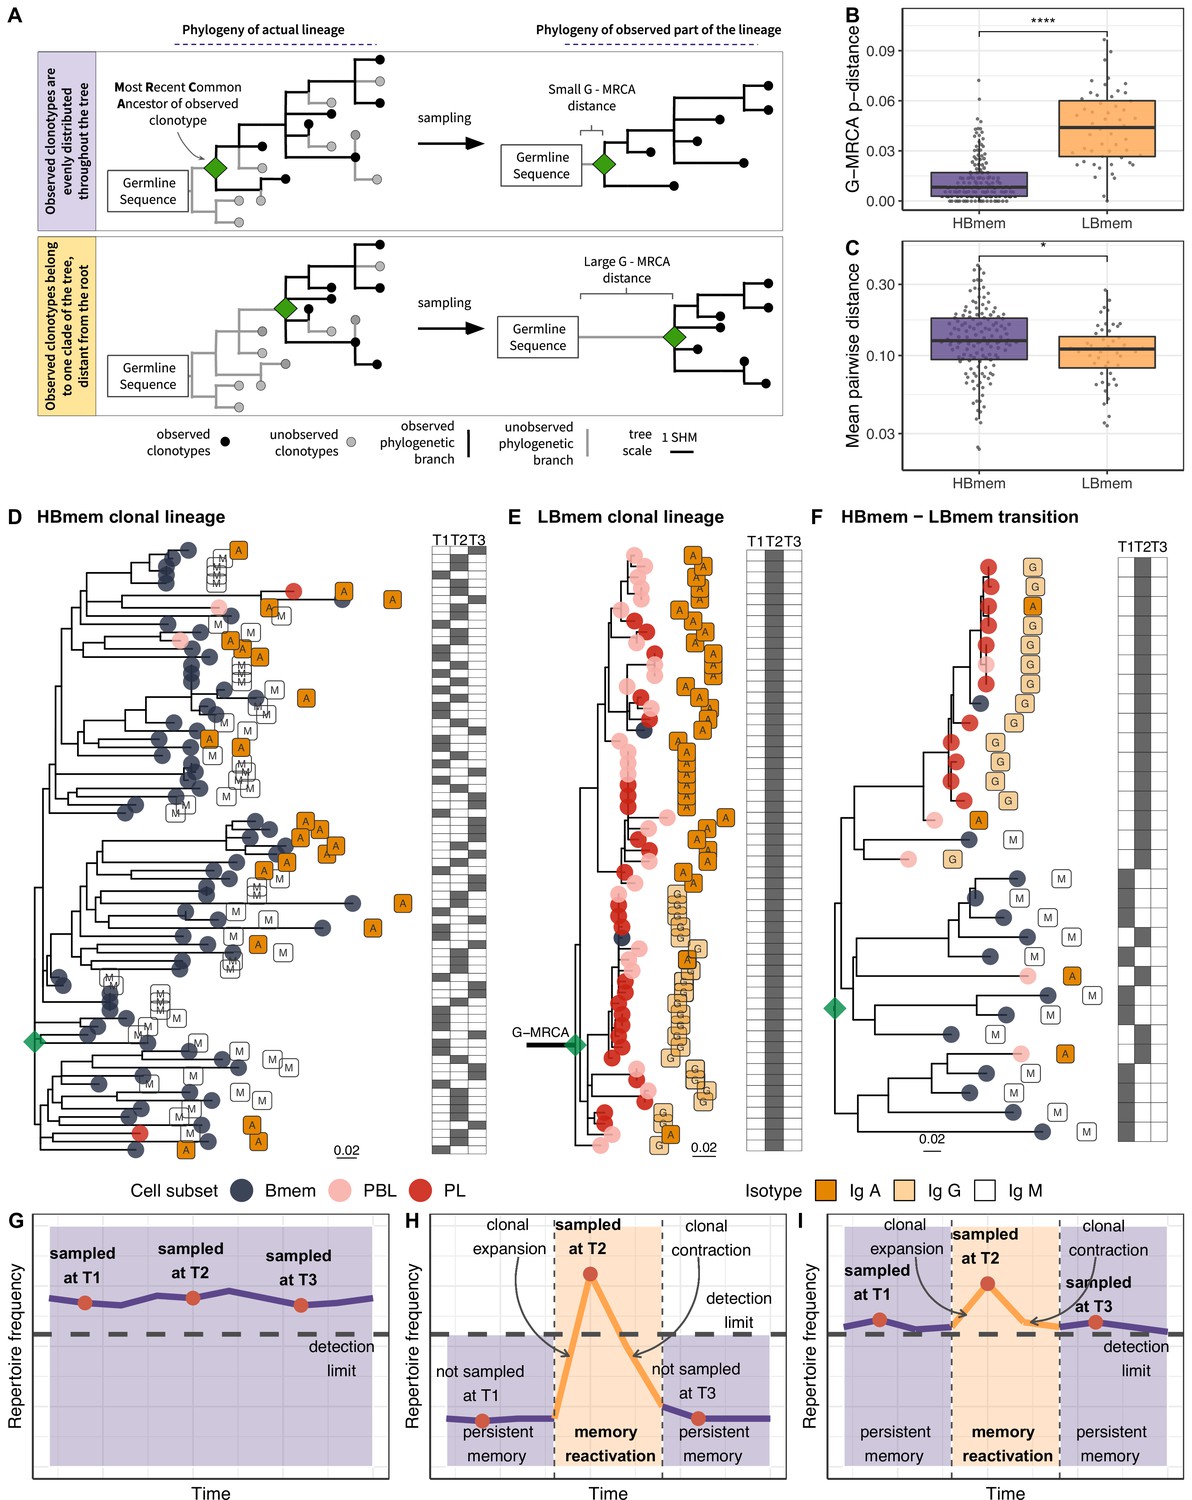
Phylogenetic history of HBmem and LBmem clonal lineages.
(A) A schematic illustration of how the distances between the germline sequence and the most recent common ancestor (MRCA) of a clonal lineage (G-MRCA distance) vary depending on which subset of clonotypes is sampled: a sample uniform with regard to the position on the tree (top panel), or only those belonging to a particular clade of the tree (bottom panel). (B) Comparison of G-MRCA p-distance (i.e., the fraction of differing nucleotides) for HBmem and LBmem lineages. (C) Mean pairwise phylogenetic distance (i.e., the distance along the tree) between clonotypes of the same lineage for HBmem and LBmem clusters. (D–F) Representative phylogenetic trees for clonal lineages belonging to HBmem (D), LBmem (E), and an example of HBmem-LBmem transition (F). The LBmem sublineage in F is nested deep in the phylogeny of the memory clonotypes, and is not characterized by a particularly long ancestral branch, indicating that it is not an artifact of clonal lineage assignment. Circles correspond to individual clonotypes, with the cellular subset indicated by color, and the isotype by label. Tables at right indicate the presence or absence of the corresponding clonotype at each time point. The G-MRCA distance is indicated with a thick line. (G–I) Schematic representation of the hypothetical dynamics of relative size for clonal lineages represented in D, E, and F, respectively. Significance for B and C was obtained by the two-sided Mann-Whitney test. *=p ≤ 0.05, **=p ≤ 0.01, ***=p ≤ 10–3, ****=p ≤ 10–4.
Figure 4—figure supplement 1
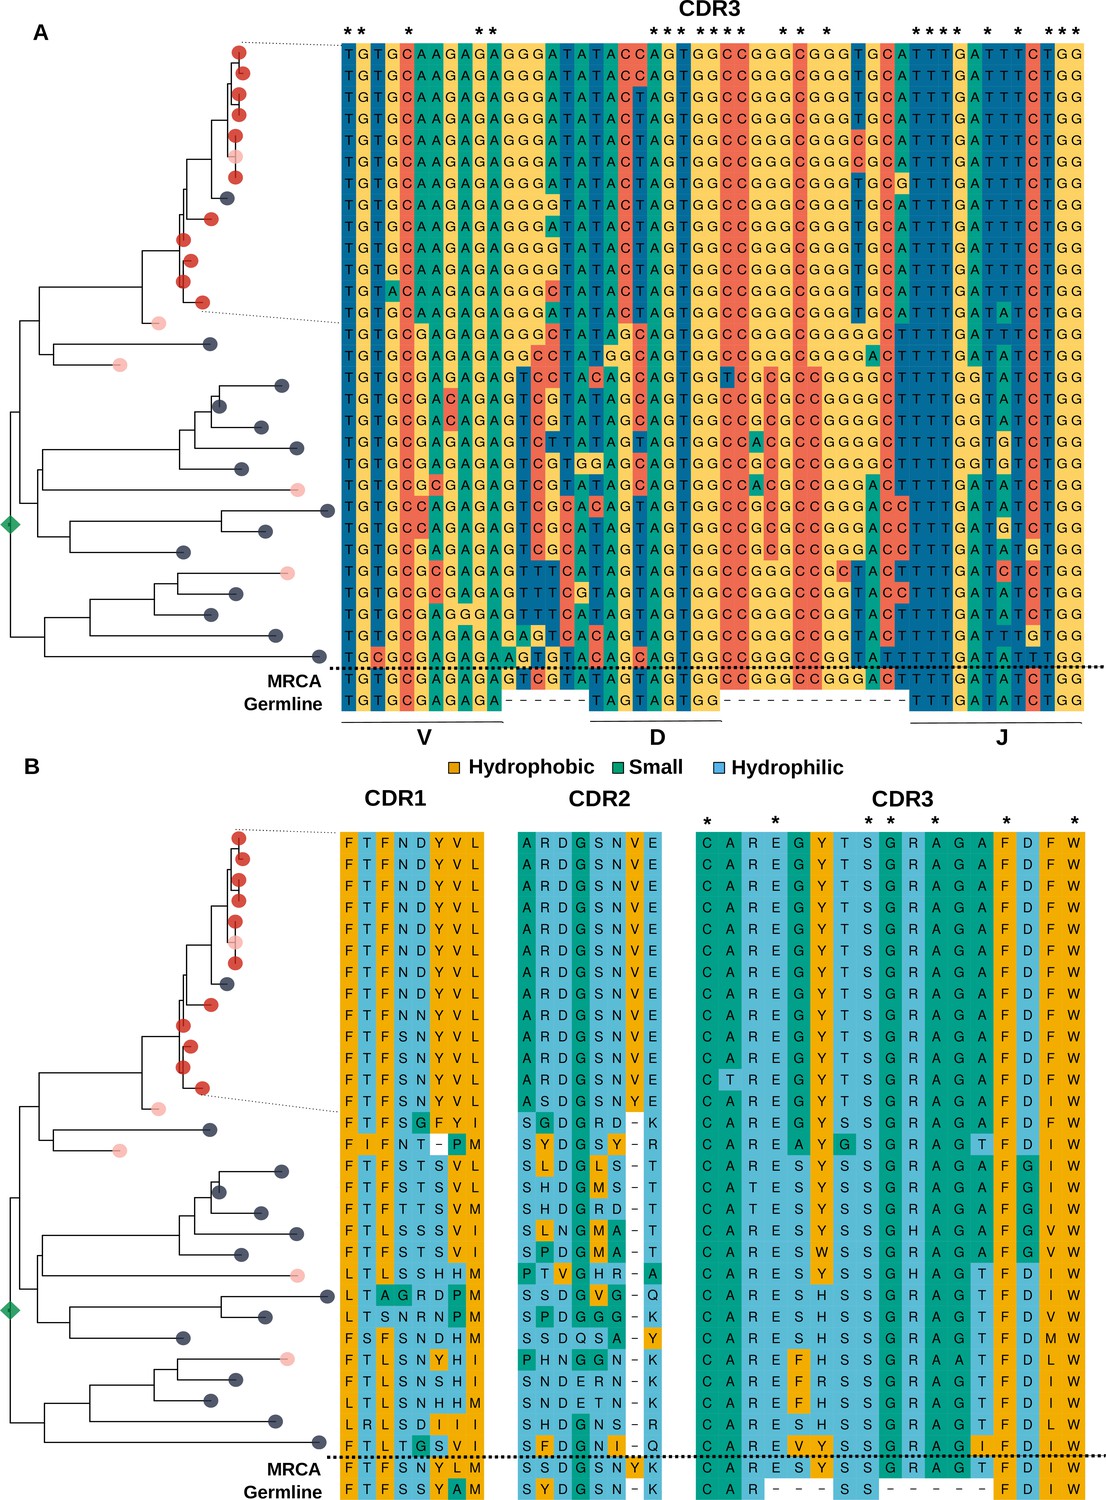
Analysis of the sequence of clonotypes comprising the lineage with HBmem-LBmem the transition.
Phylogenetic tree and nucleotide (A) and amino acid (B) alignments of CDR regions of clonal lineage with example of HBmem-LBmem transition from Figure 4F. The order of rows in the alignment corresponds to the order of clonotypes on the phylogenetic tree. Rows of the alignment, corresponding to the LBmem-like clade, are indicated by dotted lines. On panel B amino acid residues are colored according to their physicochemical properties. Asterisks indicate conservative positions among all clonotypes of the lineage.
Figure 5
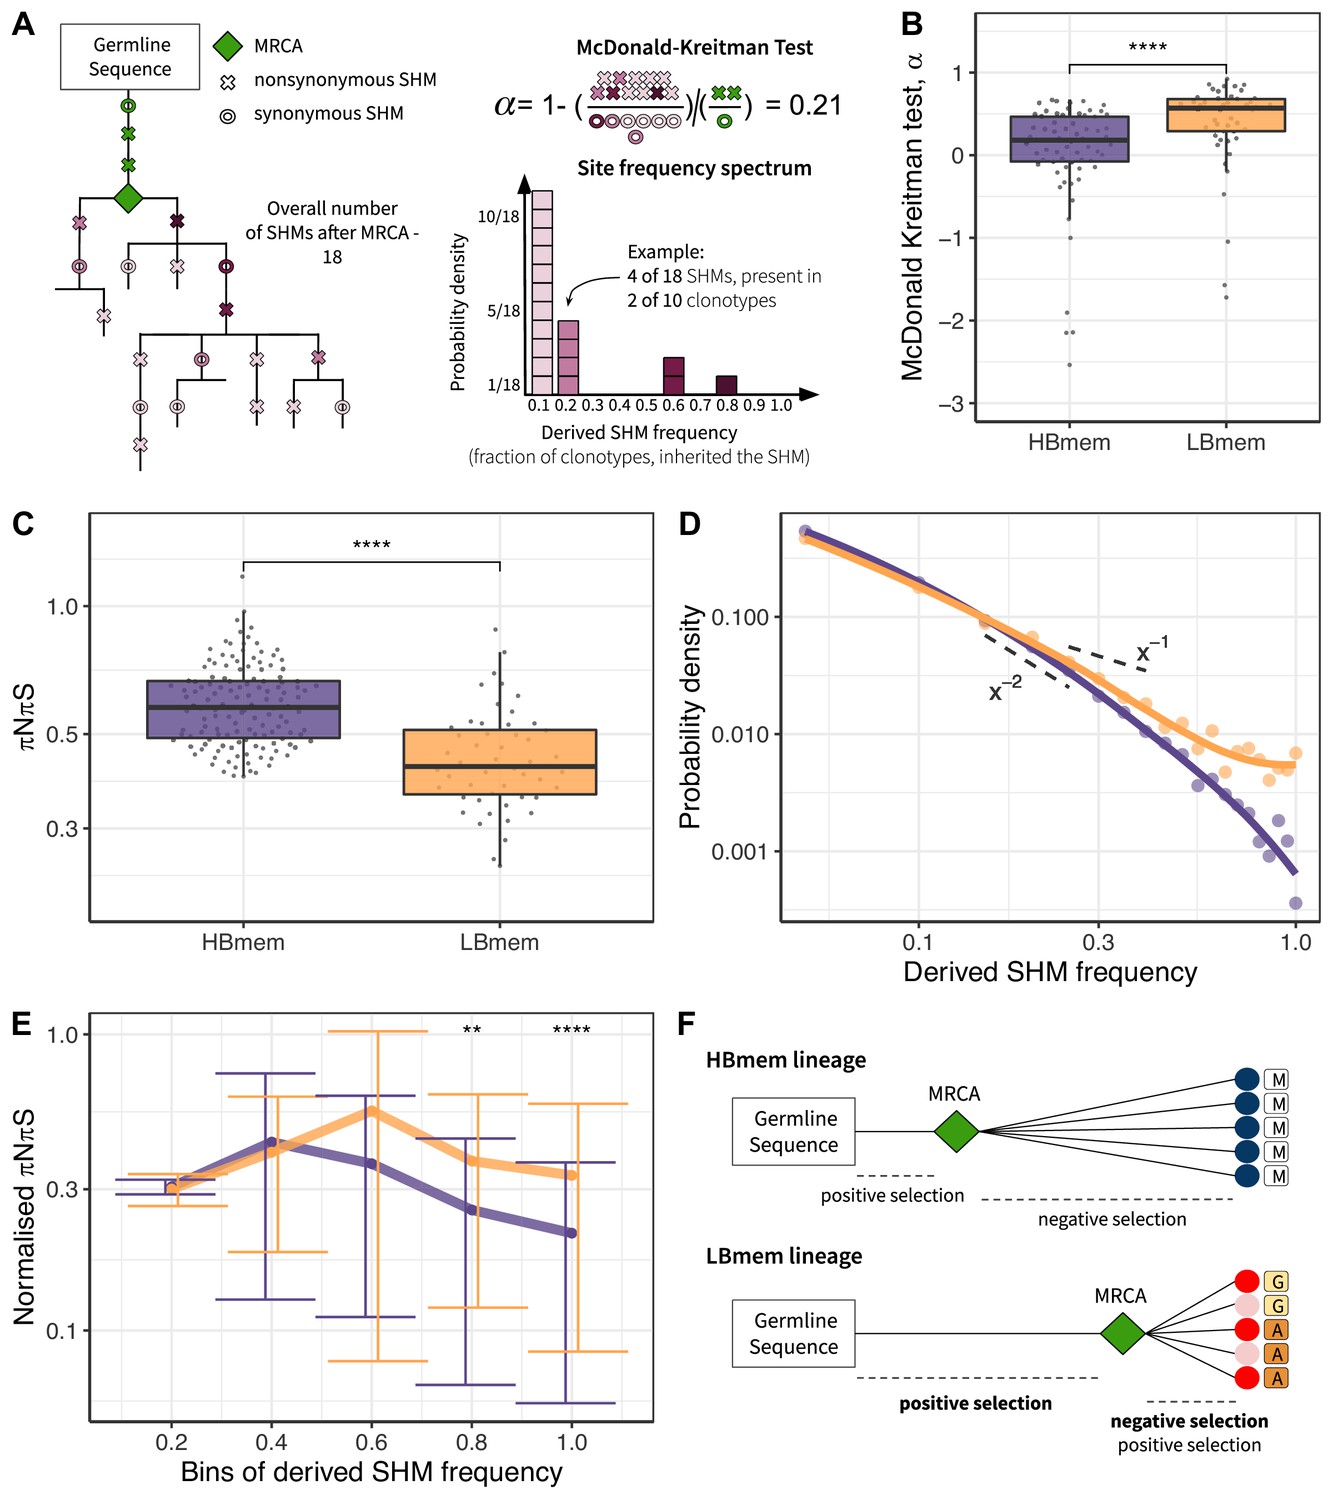
Signatures of positive and negative selection in HBmem and LBmem clusters.
(A) Schematic of the McDonald-Kreitman (MK) test and site frequency spectrum (SFS) concept. (B) MK estimate of the fraction of adaptive nonsynonymous changes (α) between germline and most recent common ancestor (MRCA) in HBmem and LBmem clonal lineages. Only lineages with nonzero G-MRCA distance are included. N=68 for HBmem, 49 for LBmem, see Figure 5—source data 2. (C) Comparison of mean pairwise πNπS of HBmem and LBmem lineages. (D) Averaged SFS for HBmem and LBmem clonal lineages. The two dashed lines correspond to f(x)=x–1, which is the expected neutral SFS under Kingman’s coalescent model (Kingman 1982), and f(x)=x–2. (E) Comparison of normalized πNπS for HBmem and LBmem clonal lineages in various SHM frequency bins. The number of polymorphisms in each bin is normalized to the overall number of polymorphisms in a corresponding clonal lineage. (F) Scheme summarizing features of HBmem and LBmem clonal lineages. Comparisons in B, C, and E were performed by two-sided Mann-Whitney test, with Bonferroni-Holm multiple testing correction in E. *=p ≤ 0.05, **=p ≤ 0.01, ***=p ≤ 10–3, ****=p ≤ 10–4.
-
Figure 5—source data 1
Examples of divergent and polymorphic sites as calculated for the McDonald-Kreitman test.
- https://cdn.elifesciences.org/articles/79254/elife-79254-fig5-data1-v3.docx
-
Figure 5—source data 2
MK test results under different inclusion criterion for clonal lineages from HBmem and LBmem clusters.
- https://cdn.elifesciences.org/articles/79254/elife-79254-fig5-data2-v3.docx
Appendix 1—figure 1
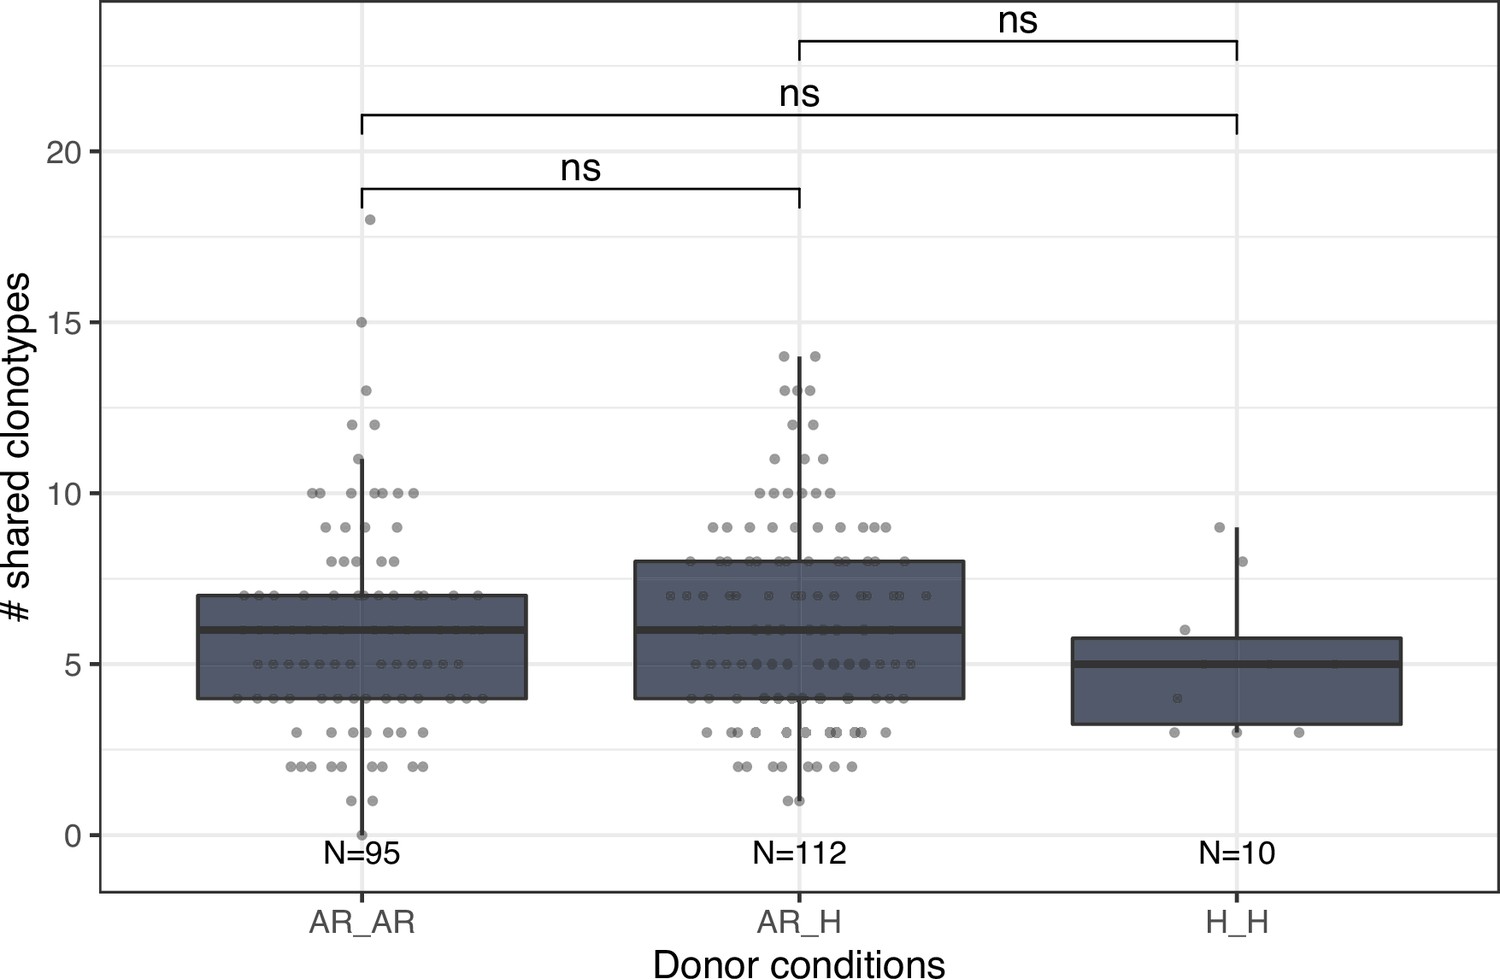
Number of shared clonotypes between repertoires of donors without (H) or with allergic rhinitis (AR).
Each dot represents the number of shared clonotypes between a pair of donors. Comparison between groups was performed using the Mann-Whitney U test. ns corresponds to p ≥ 0.05.
Appendix 1—figure 2

Correlation plot of average IGHV gene segment frequencies of memory B cell subset.
Down-left part: the dot plots of the average IGHV gene segment frequencies for each pair of donors (axes represent average frequencies, each dot represents a particular IGHV segment for corresponding donors). Top right: Pearson correlation of average frequencies of IGHV gene segment in memory B cell subset between donors, notation of the level of significance is as follows: *=p ≤ 0.05, **=p ≤ 0.01, ***=p ≤ 10–3.
Appendix 1—figure 3

Correlation plot of average IGHV gene segment frequencies of the plasmablast subset.
Down-left part: the dot plots of the average IGHV gene segment frequencies for each pair of donors (axes represent average frequencies, each dot represents a particular IGHV segment for corresponding donors). Top right: Pearson correlation of average frequencies of IGHV gene segment in plasmablast subset between donors, notation of the level of significance is as follows: *=p ≤ 0.05, **=p ≤ 0.01, ***=p ≤ 10–3.
Appendix 1—figure 4
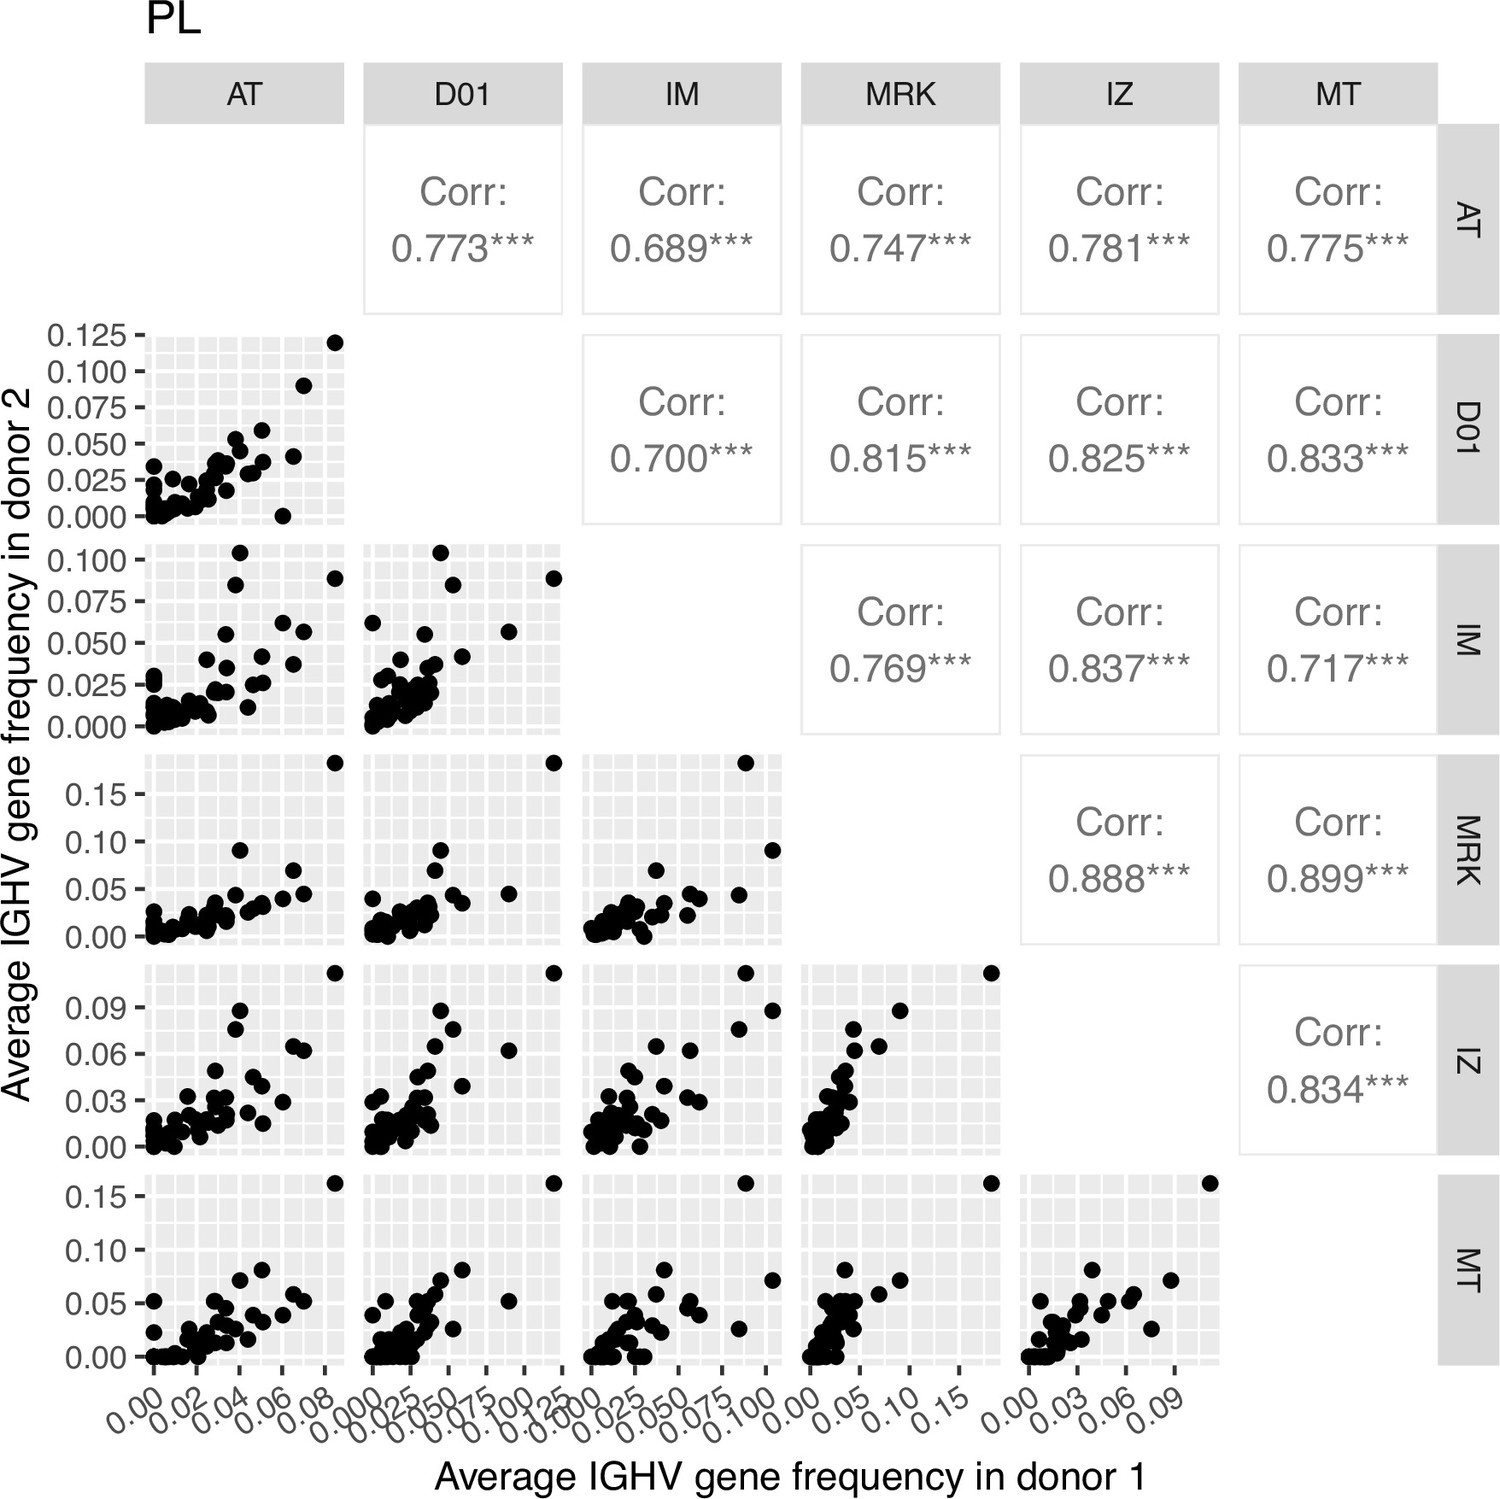
Correlation plot of average IGHV gene segment frequencies of plasma cell subset.
Down-left part: the dot plots of the average IGHV gene segment frequencies for each pair of donors (axes represent average frequencies, each dot represents a particular IGHV segment for corresponding donors). Top right: Pearson correlation of average frequencies of IGHV gene segment in plasma cell subset between donors, notation of the level of significance is as follows: *=p ≤ 0.05, **=p ≤ 0.01, ***=p ≤ 10–3.
Tables
Table 1
Donor demographics and cell sample sizes.
Multiple values in a cell separated by a semicolon represent replicates collected for the corresponding donor, time point, or cellular subset. AR – allergic rhinitis; FA – food allergy; HD – healthy donor.
| Time point: | Number of cells per sample | |||||||||||
|---|---|---|---|---|---|---|---|---|---|---|---|---|
| T1 | T2 | T3 | ||||||||||
| Donor ID | Age | Sex | Status | Bmem | PBL | PL | Bmem | PBL | PL | Bmem | PBL | PL |
| D01 | 27 | F | AR | n/a | n/a | n/a | 50,300; 55,400 | 2100; 2100 | 1020; 1010 | 50,000; 50,000 | 1000; 1000 | 500; 500 |
| IM | 39 | M | AR,FA | 186,572 | 2200 | 129 | 69,900; 68,400 | 2000; 2486 | 920 | 50,000; 50,000 | 2000; 2000 | 1000; 1000 |
| MRK | 27 | M | AR | 143,162 | 5336 | 251 | 51,700; 50,600 | 2130; 2020 | 1000; 1035 | 50,000; 50,000 | 1000; 1000 | 400; 200 |
| AT | 23 | M | AR,FA | 101,400 | 7200 | 1,800 | 50,600; 57,400 | 2520 | 800 | 50000; 40800 | 1000; 1000 | 400; 200 |
| IZ | 33 | M | HD | 101,800 | 3900 | 850 | 50,500; 56,300 | 1140; 1840 | 1050; 625 | 50,000; 50,000 | 2000; 2000 | 200; 200 |
| MT | 33 | F | HD | n/a | n/a | n/a | n/a | n/a | n/a | 50,000; 50,000 | 1000; 1000 | 400 |
Key resources table
| Reagent type (species) or resource | Designation | Source or reference | Identifiers | Additional information |
|---|---|---|---|---|
| Antibody | Anti-CD19-APC (mouse monoclonal) | Miltenyi Biotec | clone: LT19, cat. #:130-091-248 | FACS (2 µl per test) |
| Antibody | Anti-CD20-VioBlue (mouse monoclonal) | Miltenyi Biotec | clone: LT20, cat. #:130-094-167 | FACS (2 µl per test) |
| Antibody | Anti-CD27-VioBright FITC (mouse monoclonal) | Miltenyi Biotec | clone: M-T271, cat. #:130-104-845 | FACS (2 µl per test) |
| Antibody | Anti-CD138-PE-Vio770 (mouse monoclonal) | Miltenyi Biotec | clone: 44F9, cat. #:130-099-292 | FACS (2 µl per test) |
| Software, algorithm | MIGEC | Shugay et al., 2014 | v1.2.7 | |
| Software, algorithm | MiXCR | Bolotin et al., 2015 | v3.0.10 | |
| Software, algorithm | TIgGER | Gadala-Maria et al., 2015 | v3.0.10 | |
| Software, algorithm | Change-O | Gupta et al., 2015 | v0.4.4 | |
| Software, algorithm | edgeR | Robinson et al., 2010 | v0.4.4 | |
| Software, algorithm | MUSCLE | Edgar, 2004 | v3.8.31 | |
| Software, algorithm | RAxML | Stamatakis, 2014 | v8.2.11 | |
| Software, algorithm | R language | R Development Core Team, 2018 | v4.0.0 | |
| Software, algorithm | ggplot2 | Ginestet, 2011 | v3.3.2 | |
| Software, algorithm | ggtree | Yu et al., 2017 | v2.2.4 |
Additional files
Download links
A two-part list of links to download the article, or parts of the article, in various formats.
Downloads (link to download the article as PDF)
Open citations (links to open the citations from this article in various online reference manager services)
Cite this article (links to download the citations from this article in formats compatible with various reference manager tools)
Memory persistence and differentiation into antibody-secreting cells accompanied by positive selection in longitudinal BCR repertoires
eLife 11:e79254.
https://doi.org/10.7554/eLife.79254


