Pathogenic variants of sphingomyelin synthase SMS2 disrupt lipid landscapes in the secretory pathway
- Molecular Cell Biology Division, Department of Biology and Center of Cellular Nanoanalytics, Osnabrück University, Germany
- Cell Death and Metabolism Group, Center for Autophagy, Recycling and Disease, Danish Cancer Society Research Center, Denmark
- Laboratoire de Bioimagerie et Pathologies, Université de Strasbourg, France
- Biophysics Division, Department of Biology and Center of Cellular Nanoanalytics, Osnabrück University, Germany
- Division of Medical Genetics, Department of Pediatrics, University of Utah, United States
- Department of Genetics, University Medical Center Utrecht, Netherlands
- Children’s Hospital, University of Helsinki and Helsinki University Hospital, Finland
- Department of Cell Biology, Yale School of Medicine, United States
Figures
Figure 1
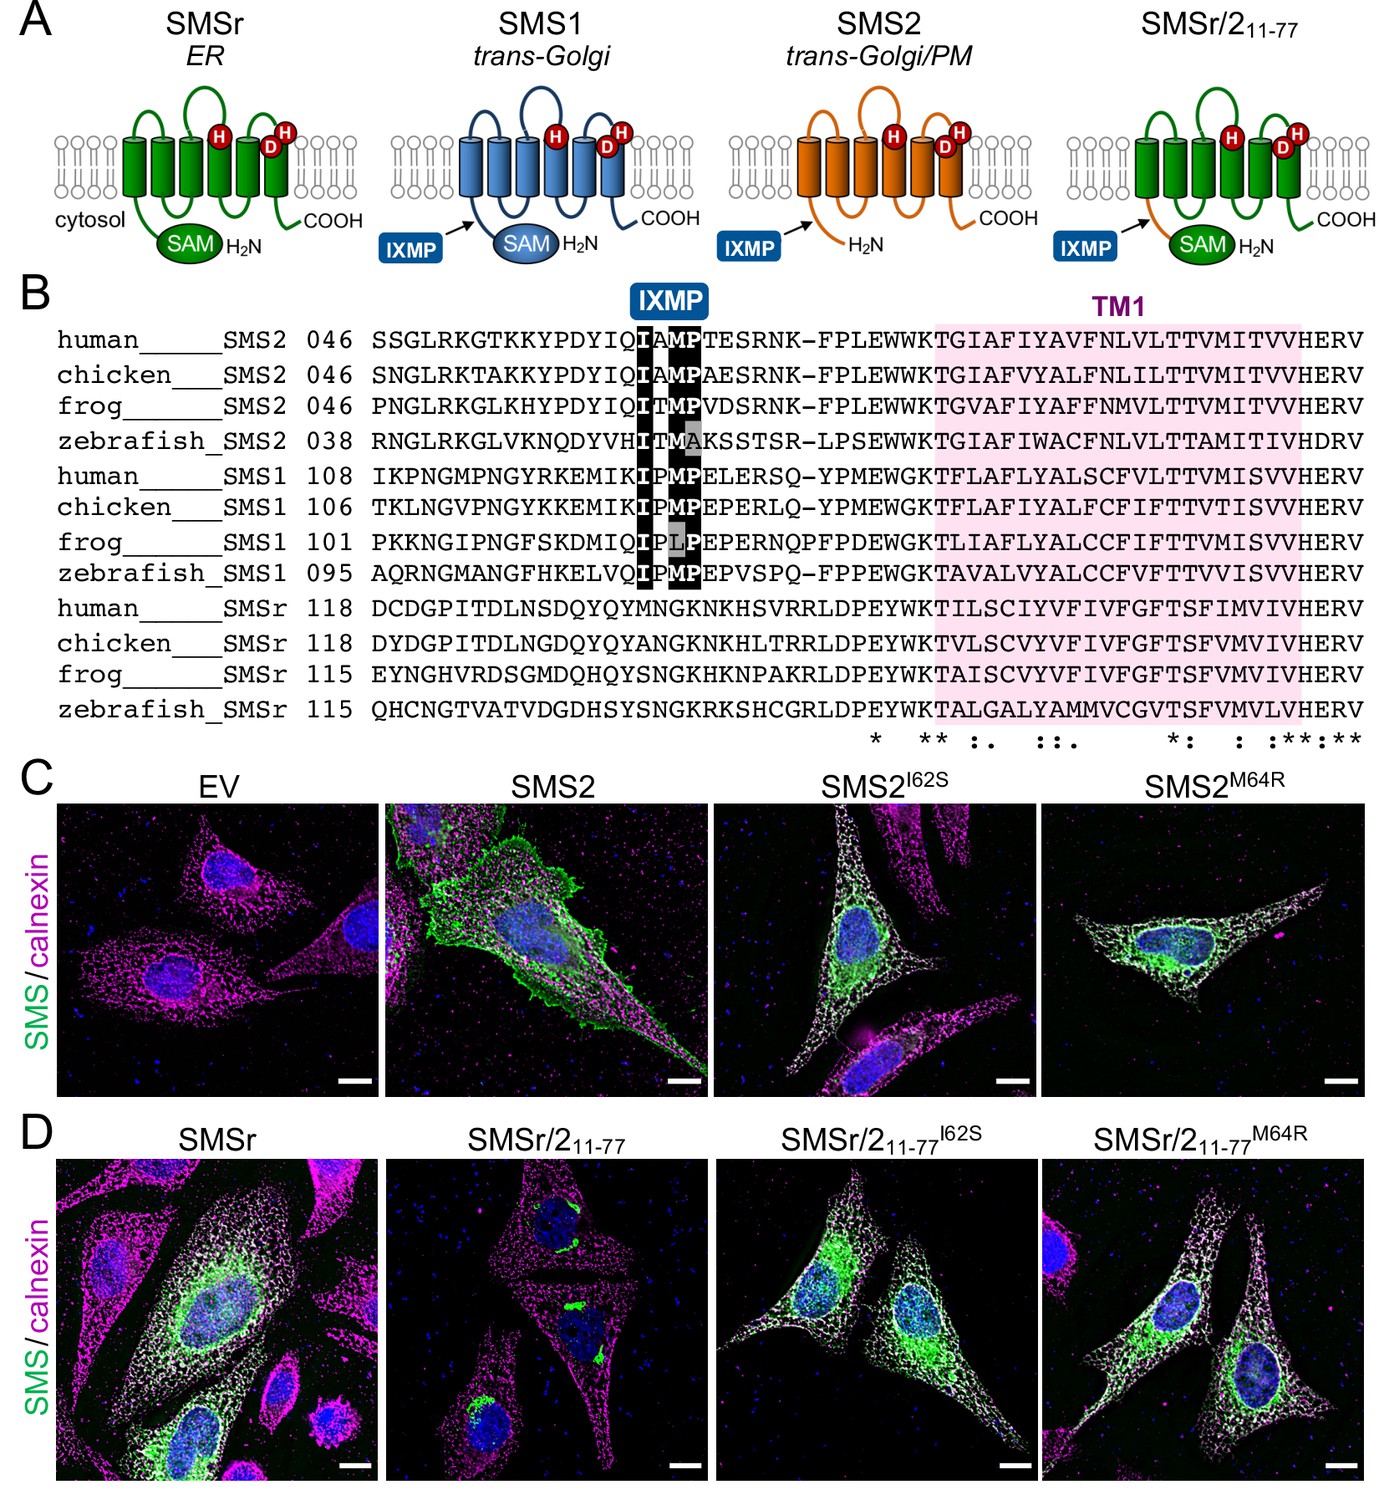
SMS2 contains an autonomous ER export signal.
(A) Membrane topology of SMS family members and chimeric protein SMSr/211-77. Active site residues are marked in red. The position of a conserved IXMP sequence motif is marked by an arrow. (B) Sequence alignment of the region immediately upstream of the first membrane span (TM1) in vertebrate SMS family members. Note that human SMS2 residues Ile62 and Met64 are part of the IXMP sequence motif, which is conserved in SMS1 and SMS2, but not SMSr, across different vertebrate species. (C) HeLa cells transfected with empty vector (EV) or FLAG-tagged SMS2, SMS2I62S, or SMS2M64R were fixed, immunostained with α-FLAG (green) and α-calnexin (magenta) antibodies, counterstained with DAPI (blue) and imaged by DeltaVision microscopy. (D) HeLa cells transfected with FLAG-tagged SMSr, SMSr/211-77, SMSr/211-77I62S or SMSr/211-77M64R were fixed, immunostained with α-FLAG (green) and α-calnexin (magenta) antibodies, counterstained with DAPI (blue) and imaged by DeltaVision microscopy. Scale bar, 10 μm.
Figure 2
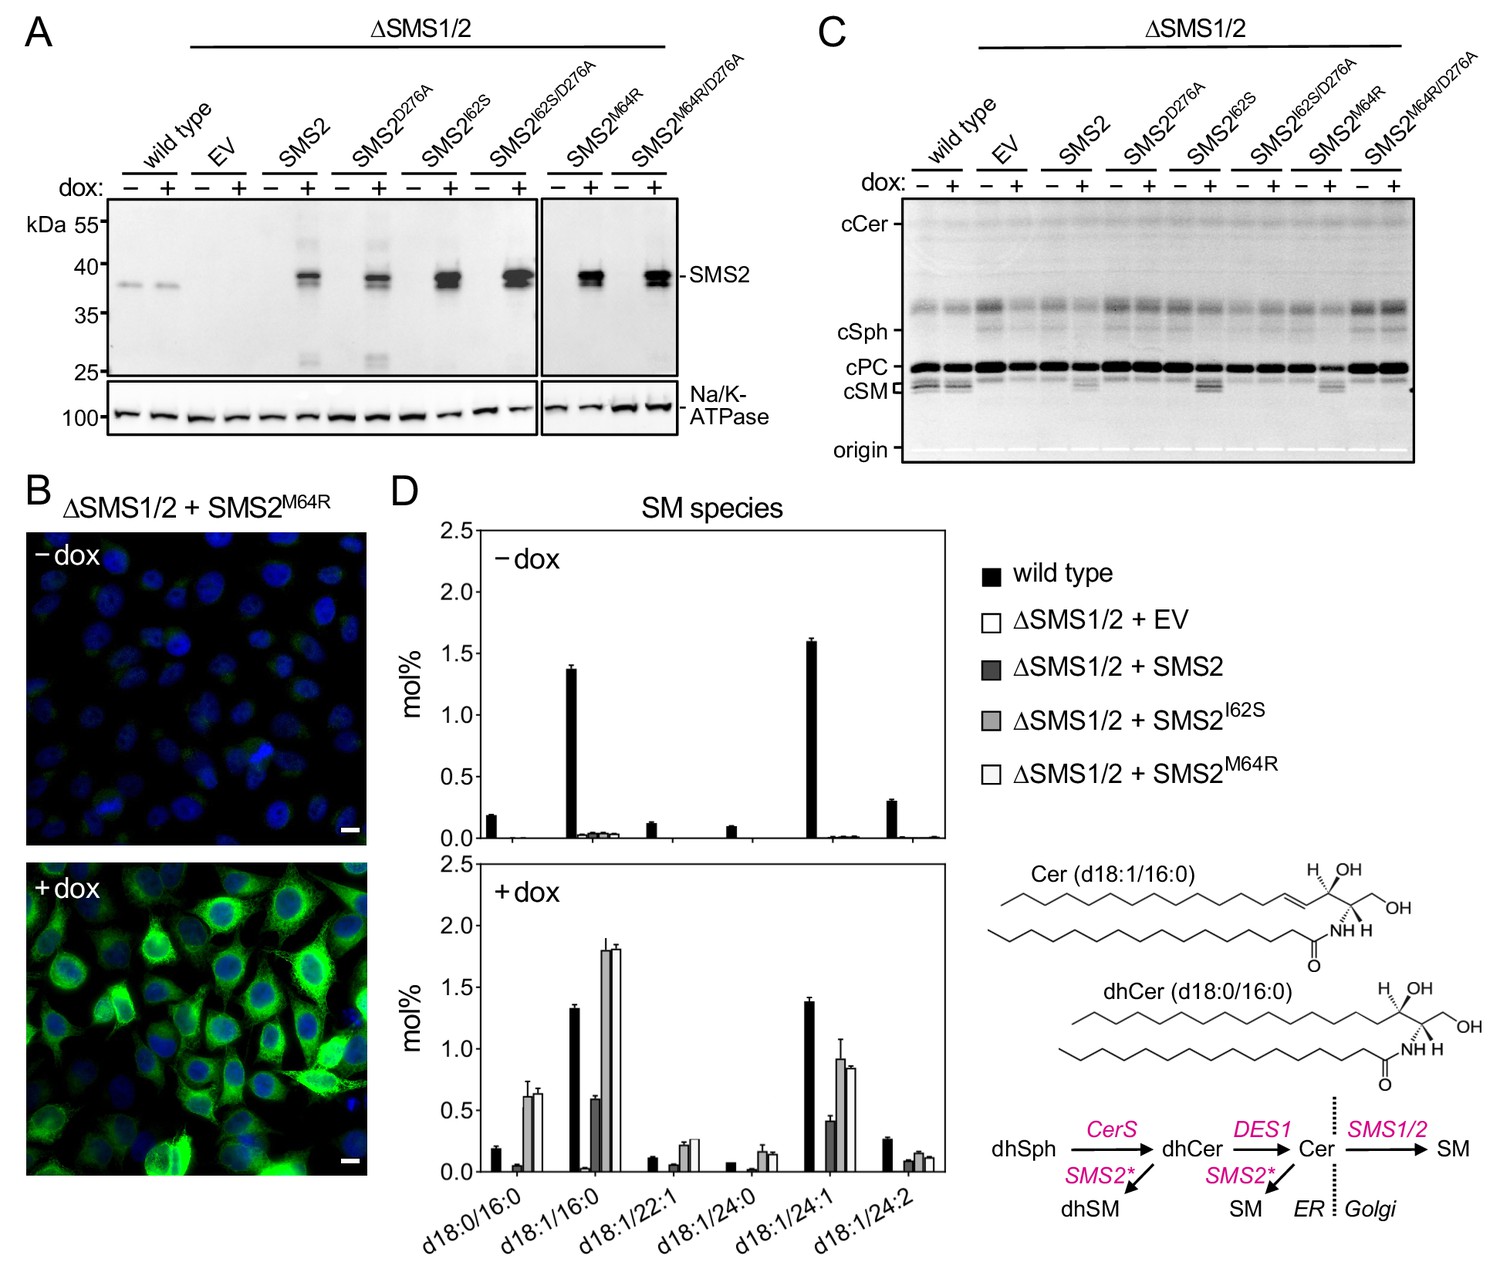
Pathogenic SMS2 variants support bulk production of SM in the ER.
(A) HeLa SMS1/2 double KO (ΔSMS1/2) cells transduced with doxycycline-inducible constructs encoding FLAG-tagged SMS2, SMS2I62S, SMS2M64R or their enzyme-dead isoforms (D276A) were grown for 16 hr in the absence or presence of 1 μg/ml doxycycline and then subjected to immunoblot analysis using α-SMS2 and α-Na/K-ATPase antibodies. Wildtype HeLa cells served as control. (B) ΔSMS1/2 cells transduced with doxycycline-inducible FLAG-tagged SMS2M64R were treated as in (A), fixed, immunostained with α-FLAG antibody (green), counterstained with DAPI (blue) and imaged by conventional fluorescence microscopy. Scale bar, 10 μm. (C) Cells treated as in (A) were metabolically labeled with a clickable sphingosine analogue for 16 h, subjected to total lipid extraction, click reacted with the fluorogenic dye 3-azido-7-hydroxycoumarin and analyzed by TLC. (D) SM species in total lipid extracts of cells treated as in (A) were quantified by LC-MS/MS and expressed as mol% of total phospholipid analyzed. Note that the rise in dihydroSM (dhSM, d18:0/16:0) in ΔSMS1/2 cells expressing SMS2I62S or SMS2M64R (SMS2*) is likely due to competition between ER-resident ceramide desaturase (DES1) and SMS2* for dihydroceramide (dhCer, d18:0/16:0), which is synthesized de novo by ceramide synthase (CerS) from dihydrosphingosine (dhSph). Data are average ± SD of three technical triplicates.
-
Figure 2—source data 1
Unprocessed and uncropped image files of the immunoblots.
- https://cdn.elifesciences.org/articles/79278/elife-79278-fig2-data1-v2.pdf
-
Figure 2—source data 2
Raw data of the quantitative analysis of SM species.
- https://cdn.elifesciences.org/articles/79278/elife-79278-fig2-data2-v2.xlsx
Figure 3

Cells expressing pathogenic variant SMS2M64R accumulate SM in the ER.
(A) Workflow for affinity purification of the ER from HeLa cells expressing wildtype or pathogenic SMS2 variants. (B) HeLa wildtype (WT) or ΔSMS1/2 cells transduced with empty vector (EV) or doxycycline-inducible SMS2 or SMS2M64R were treated with doxycycline (1 μg/ml, 16 hr), lysed and used to purify the ER as in (A). Whole cell lysates (WC) and purified ER were subjected to immunoblot analysis using antibodies against SMS2 and various organellar markers. Samples were loaded on an equivalents basis. (C) Lipid composition of whole cell lysates (WC) and ER purified from HeLa wildtype cells (WT) was determined by mass spectrometry-based shotgun lipidomics. Levels of the different lipid classes are expressed as mol% of total identified lipids. CE, cholesteryl esters. (D) Lipid composition of whole cell lysates (WC) and ER purified from cells as in (B) was determined as in (C). (E) Comparative analysis of PC unsaturation and chain length in ER purified from ΔSMS1/2 cells expressing SMS2 or SMS2M64R. The graphs show total numbers of double bonds (left) or carbon atoms (right) in the two acyl chains. All data are average ± SD, n=4. *p<0.05, **p<0.01, ***p<0.001, ****p<0.0001 by paired t test.
-
Figure 3—source data 1
Unprocessed and uncropped image files of the immunoblots.
- https://cdn.elifesciences.org/articles/79278/elife-79278-fig3-data1-v2.pdf
-
Figure 3—source data 2
Raw data of the quantitative analysis of lipid species in whole cells or isolated ER.
- https://cdn.elifesciences.org/articles/79278/elife-79278-fig3-data2-v2.xlsx
Figure 4
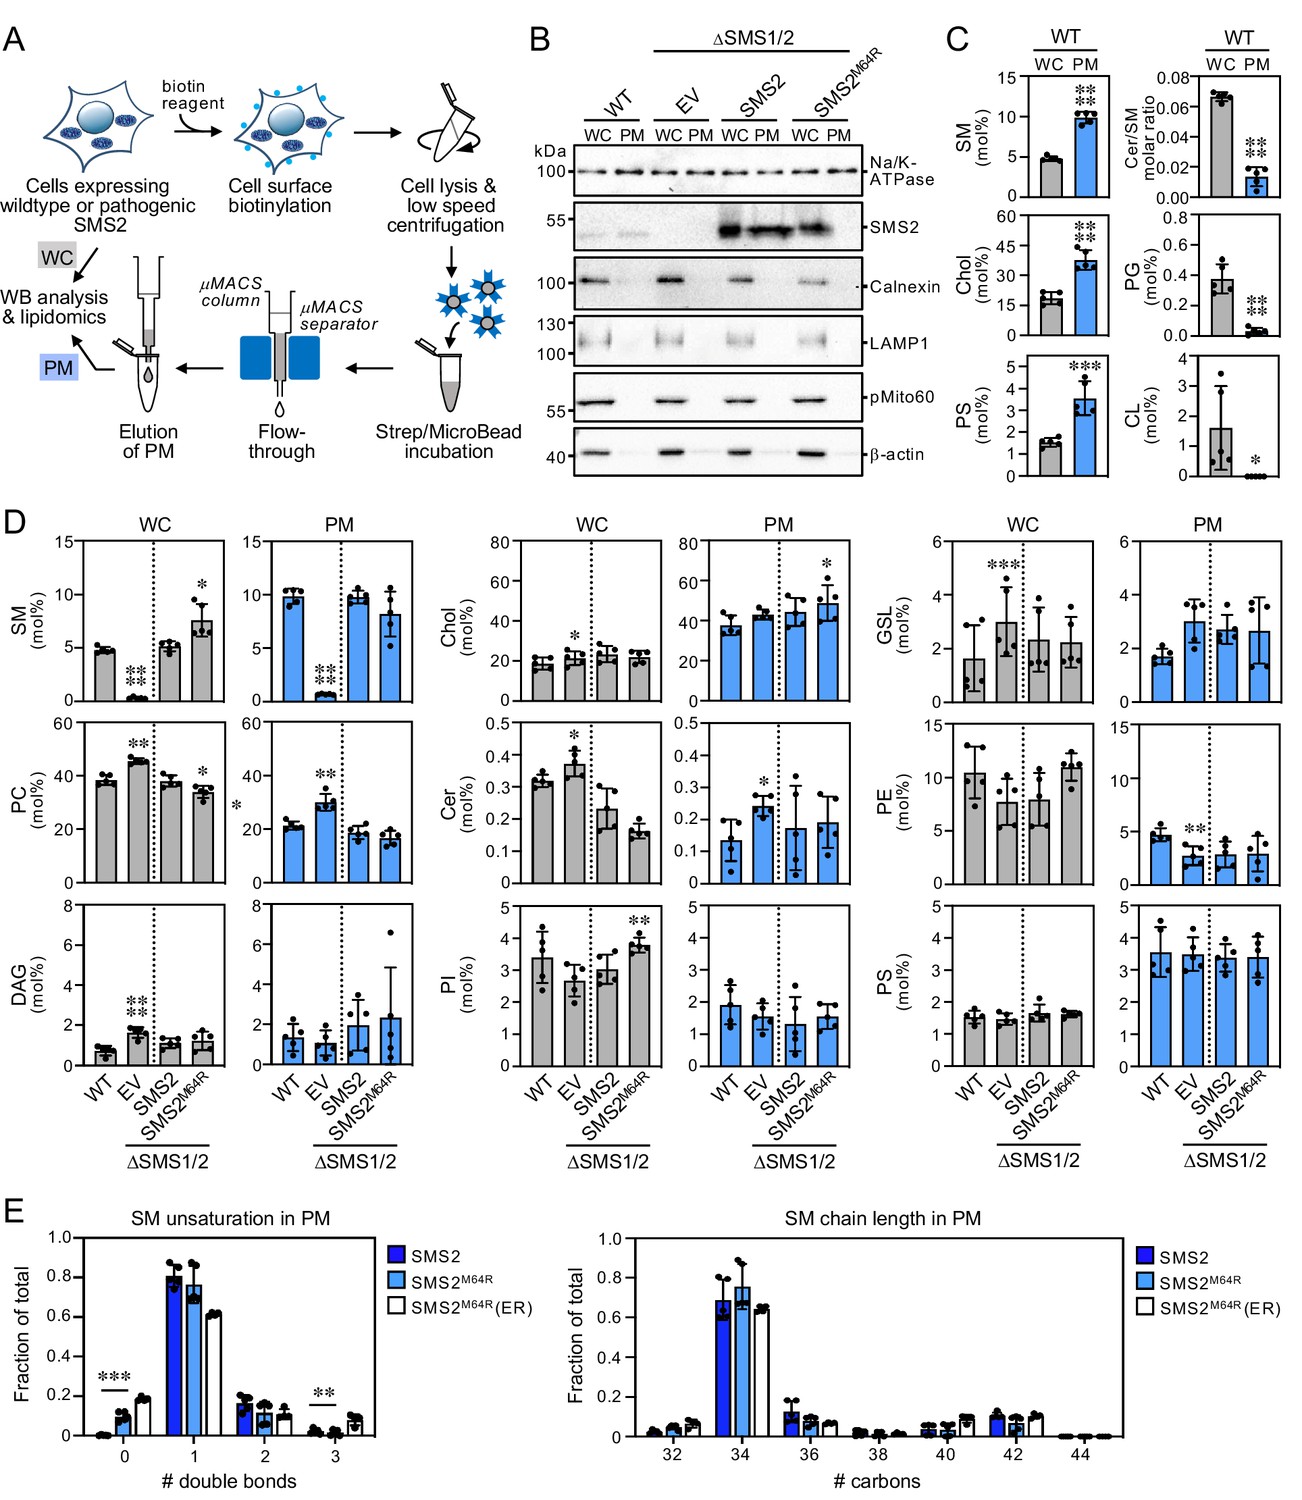
Lipid composition of the PM of cells expressing wildtype or pathogenic SMS2 variants.
(A) Workflow for affinity purification of the PM from HeLa cells expressing wildtype or pathogenic SMS2 variants. (B) HeLa wildtype (WT) or ΔSMS1/2 cells transduced with empty vector (EV) or doxycycline-inducible SMS2 or SMS2M64R were treated with doxycycline (1 μg/ml, 16 h), lysed and used to purify the PM as in (A). Whole cell lysates (WC) and purified PM were subjected to immunoblot analysis using antibodies against SMS2 and various organellar markers. Samples were loaded on an equivalents basis. (C) Lipid composition of whole cell lysates (WC) and PM purified from HeLa wildtype cells (WT) was determined by mass spectrometry-based shotgun lipidomics. Levels of the different lipid classes are expressed as mol% of total identified lipids. (D) Lipid composition of whole cell lysates (WC) and PM purified from cells as in (B) was determined as in (C). All data are average ± SD, n=5. (E) Comparative analysis of SM unsaturation and chain length in PM purified from ΔSMS1/2 cells expressing SMS2 or SMS2M64R. Data on SM unsaturation and chain length in ER purified from ΔSMS1/2 cells expressing SMS2M64R are included as reference. The graphs show total numbers of double bonds (left) or carbon atoms (right) in the sphingoid base and acyl chain. All data are average ± SD, n=5. *p<0.05, **p<0.01, ***p<0.001, ****p<0.0001 by paired t test.
-
Figure 4—source data 1
Unprocessed and uncropped image files of the immunoblots.
- https://cdn.elifesciences.org/articles/79278/elife-79278-fig4-data1-v2.pdf
-
Figure 4—source data 2
Raw data of the quantitative analysis of lipid species in whole cells or isolated PM.
- https://cdn.elifesciences.org/articles/79278/elife-79278-fig4-data2-v2.xlsx
Figure 5

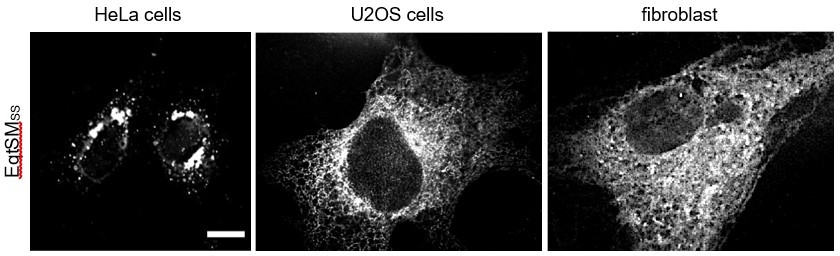
Luminal SM reporter EqtSMSS enables visualization of an ER-resident SM pool in SMS2M64R-expressing cells.
(A) Human osteosarcoma U2OS cells co-transfected with mCherry-tagged VAPA (ER, magenta) and empty vector (control), SMS2M64R or SMS2M64R/D276A and luminal GFP-tagged SM reporter EqtSMSS or its SM binding-defective derivative, EqtSolSS (Eqt, green), were incubated in isotonic medium (100% Optimem) for 5 min and imaged by spinning disc confocal microscopy. (B) Cells treated as in (A) were incubated in hypotonic medium (1% Optimem) for 5 min and then imaged by spinning disc confocal microscopy. Scale bar, 10 μm.
Figure 6
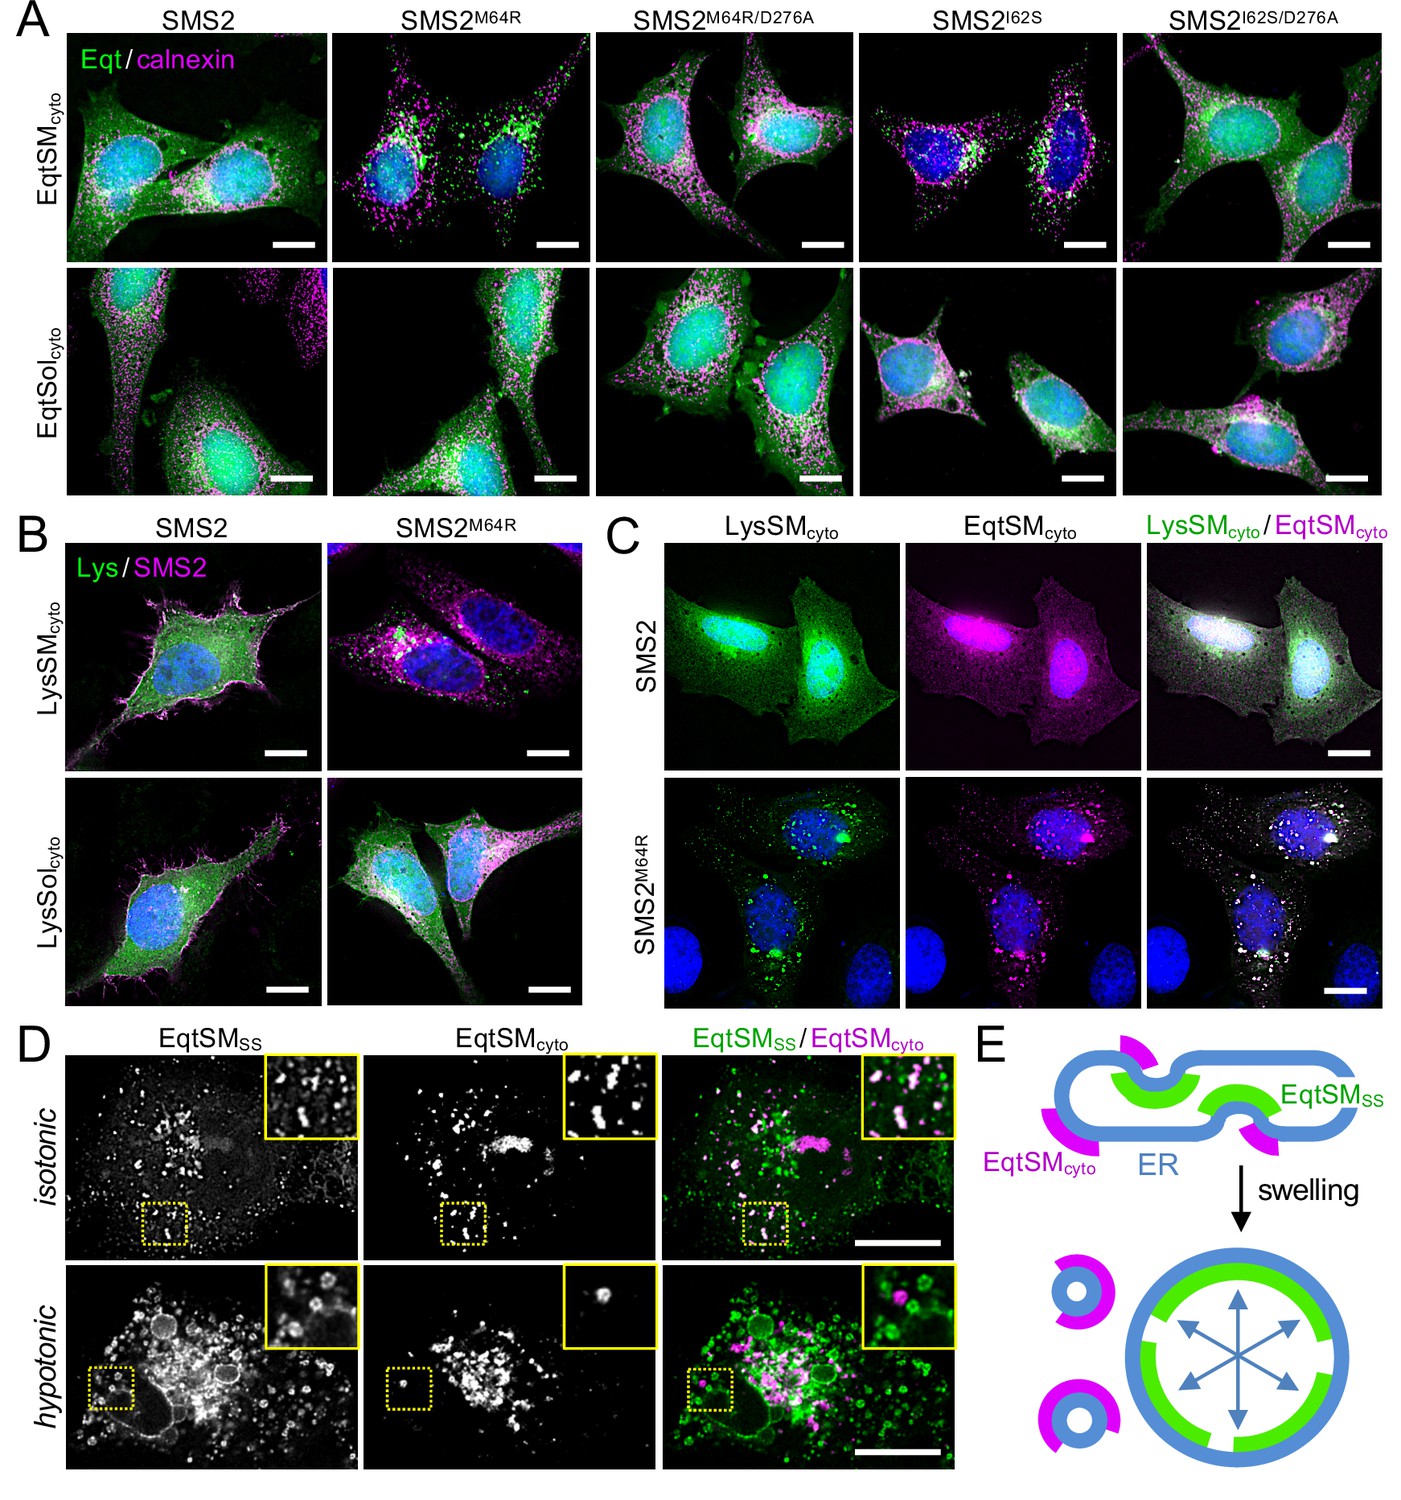
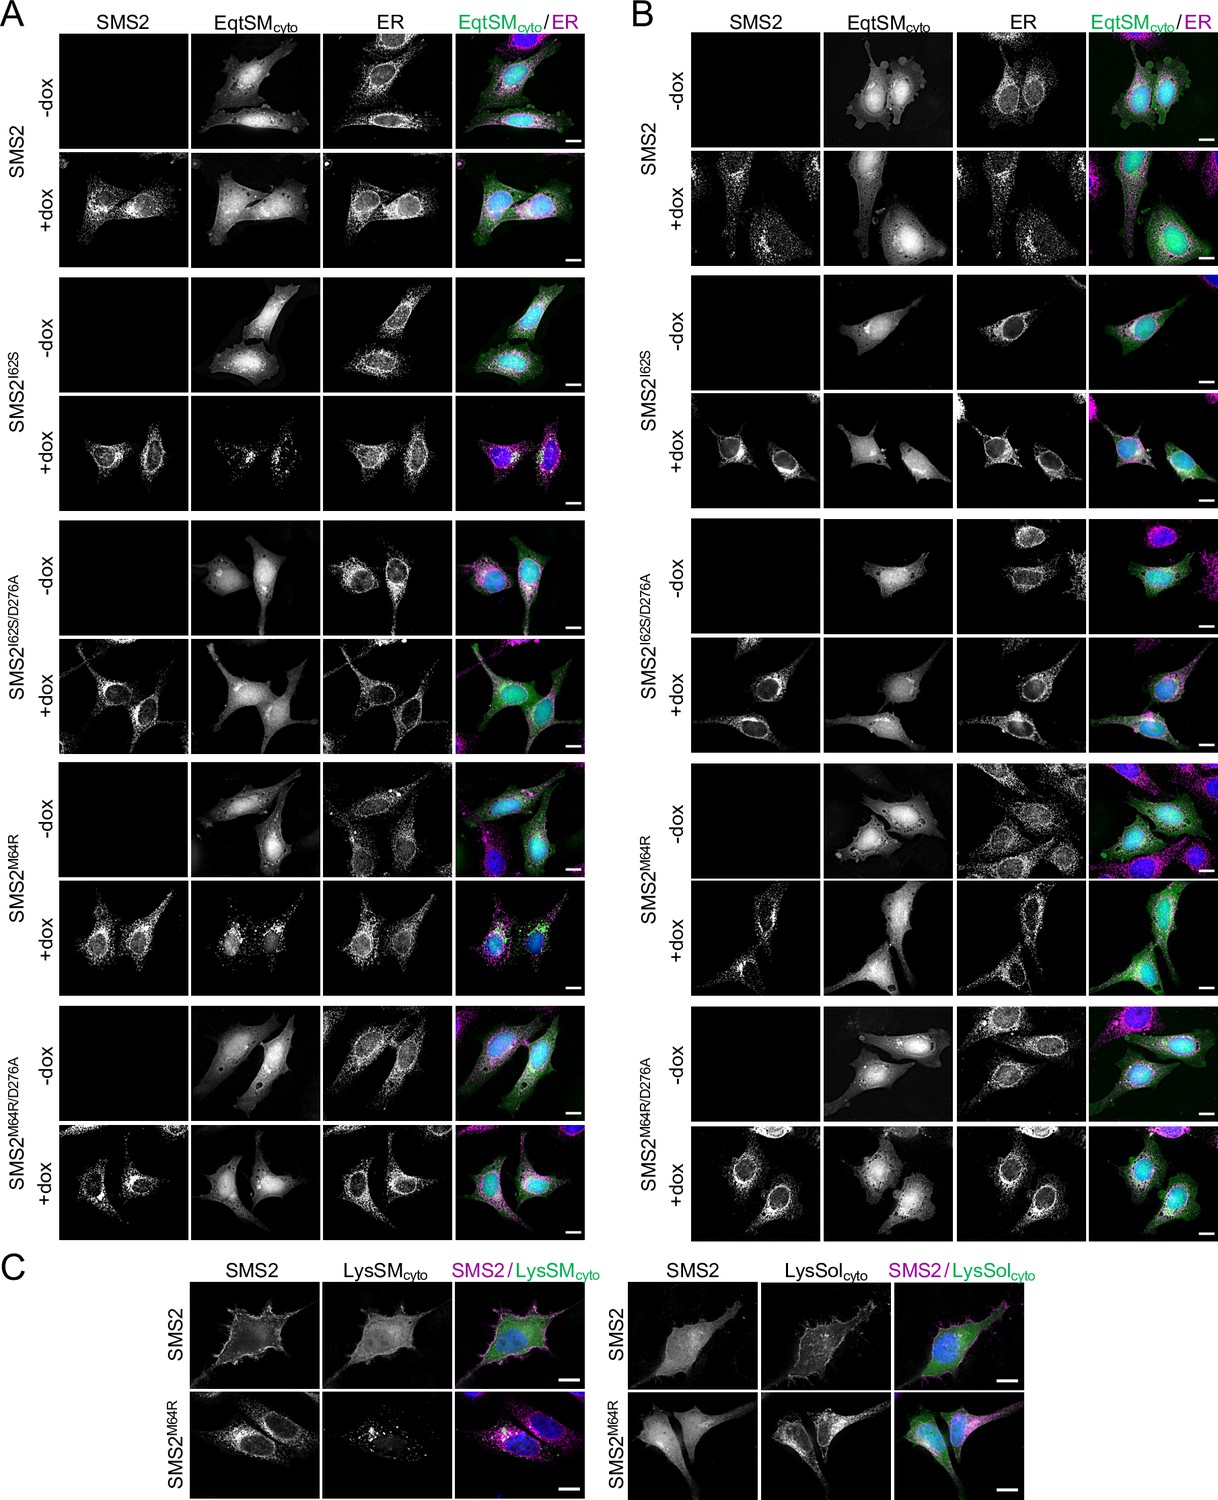
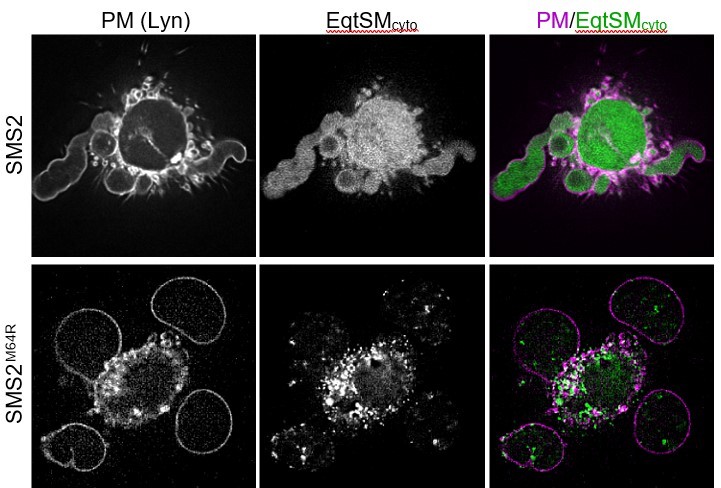
Pathogenic SMS2 variants disrupt transbilayer SM asymmetry.
(A) HeLa ΔSMS1/2 cells transduced with doxycycline-inducible SMS2, SMS2M64R, SMS2I62S or their enzyme-dead isoforms (D276A) were transfected with cytosolic GFP-tagged SM reporter EqtSMcyto or its SM binding-defective derivative, EqtSolcyto (Eqt, green). After treatment with doxycycline (1 μg/ml, 16 h), cells were fixed, immunostained with α-calnexin antibodies (magenta), counterstained with DAPI (blue) and imaged by DeltaVision microscopy. (B) HeLa ΔSMS1/2 cells transduced with doxycycline-inducible SMS2 or SMS2M64R were transfected with cytosolic GFP-tagged SM reporter LysSMcyto (green) or its SM binding-defective derivative, LysSolcyto (Lys, green). After treatment with doxycycline (1 μg/ml, 16 hr), cells were fixed, immunostained with anti-FLAG antibodies (SMS2, magenta), counterstained with DAPI (blue) and imaged by DeltaVision microscopy. Scale bar, 10 μm. (C) HeLa ΔSMS1/2 cells transduced with doxycycline-inducible SMS2 or SMS2M64R were co-transfected with GFP-tagged LysSMcyto (green) and mKate-tagged EqtSMcyto (magenta). After treatment with doxycycline (1 μg/ml, 16 hr), cells were fixed, counterstained with DAPI (blue) and imaged by DeltaVision microscopy. Scale bar, 10 μm. (D) U2OS cells co-transfected with SMS2M64R, luminal GFP-tagged EqtSMSS (green) and cytosolic mKate-tagged EqtSMcyto (magenta) were incubated in isotonic (100% Optimen) or hypotonic media (1% Optimem) for 5 min, and then imaged by spinning disc confocal microscopy. Scale bar, 10 μm. (E) Graphic illustration of the data shown in (D). See text for details.
Figure 7
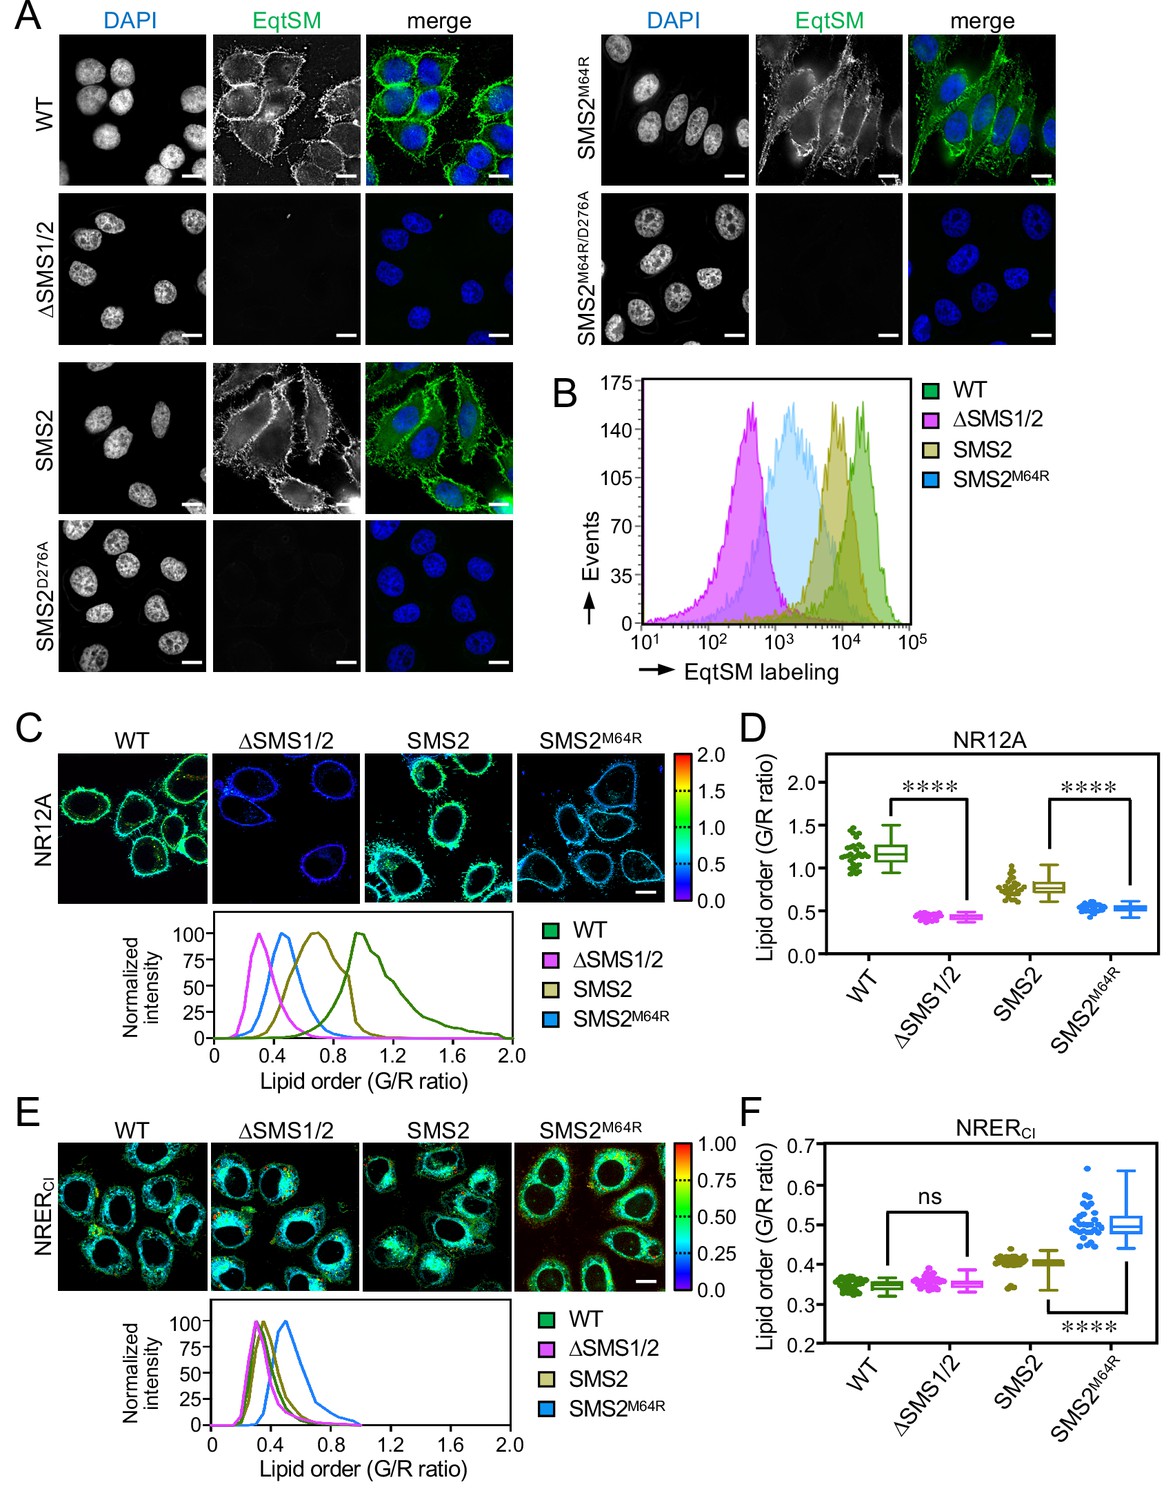
SMS2M64R-expressing cells fail to concentrate SM on their surface and exhibit imbalances in lipid order.
(A) HeLa wildtype (WT) or ΔSMS1/2 cells transduced with doxycycline-inducible SMS2, SMS2M64R or their enzyme-dead isoforms (D276A) were treated with doxycycline (1 μg/ml, 16 h), incubated with FLAG-tagged EqtSM, fixed, co-stained with α-FLAG antibody (green) and DAPI (blue), and imaged by DeltaVision microscopy. (B) Cells treated as in (A) were analyzed by flow cytometry to quantitatively assess EqtSM labeling of their surface. (C) Cells treated as in (A) were stained with 0.2 μM NR12A for 10 min and analyzed by ratiometric fluorescence microscopy to probe the lipid order in the outer PM leaflet. Warmer colors reflect a higher lipid order. (D) Quantitative assessment of changes in lipid order in the outer PM leaflet of cells treated as in (C). n=30 cells per condition over two biologically independent experiments. (E) Cells treated as in (A) were stained with 0.2 μM NRERCl for 10 min and analyzed by ratiometric fluorescence microscopy to probe lipid order in the ER. Warmer colors reflect a higher lipid order. (F) Quantitative assessment of changes in lipid order in the ER of cells treated as in (E). n=30 cells per condition over two biologically independent experiments. All p values calculated by unpaired t-test. Scale bar, 10 μm.
-
Figure 7—source data 1
Raw data of the quantitative analysis of ratiometric fluorescence microscopy images captured under the conditions indicated.
- https://cdn.elifesciences.org/articles/79278/elife-79278-fig7-data1-v2.xlsx
Figure 8
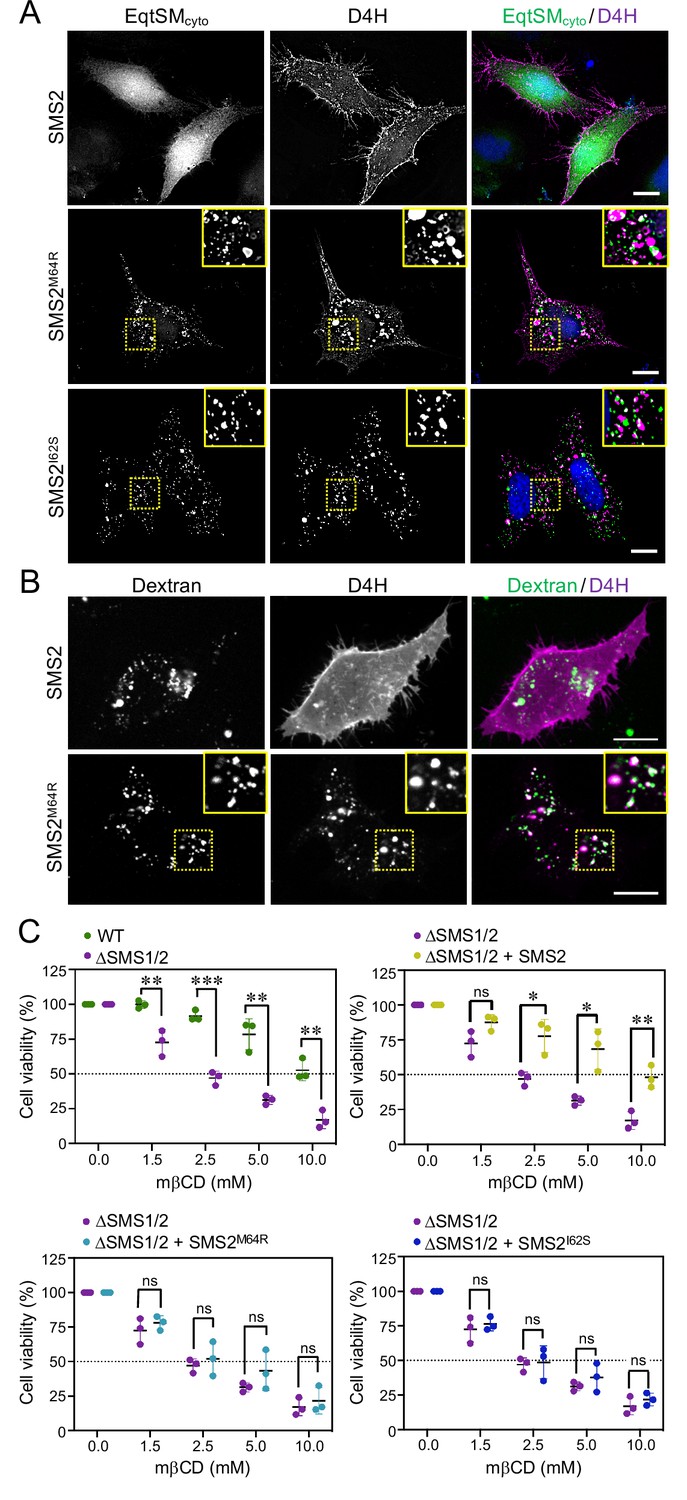
Pathogenic SMS2 variants perturb subcellular cholesterol pools.
(A) HeLa ΔSMS1/2 cells transduced with doxycycline-inducible SMS2, SMS2M64R or SMS2I62S were co-transfected with GFP-tagged EqtSMcyto (green) and mCherry-tagged cytosolic sterol reporter D4H (red). Next, cells were treated with 1 μg/ml doxycycline for 16 hr, fixed, counterstained with DAPI (blue) and visualized by DeltaVision microscopy. (B) HeLa ΔSMS1/2 cells stably transduced with FLAG-tagged SMS2 or SMS2M64R were transfected with mCherry-tagged D4H (red), labeled with fluorescein-conjugated dextran (green) in the presence of 1 μg/ml doxycycline for 16 hr and then imaged by spinning disc confocal microscopy. (C) HeLa wildtype (WT) or ΔSMS1/2 cells stably transduced with SMS2, SMS2M64R or SMS2I62S were treated with 1 μg/ml doxycycline for 16 hr. Next, cells were exposed to the indicated concentration of methyl β-cyclodextrin (mβCD) for 1 hr and cell viability was assessed using Prestoblue reagent. Data shown are averages of four technical replicates from n=3 biological replicates. *p<0.05, **p<0.01, ***p<0.001 by paired t test. Scale bar, 10 μm.
-
Figure 8—source data 1
Raw data of the quantitative analysis of cell viability under the conditions indicated.
- https://cdn.elifesciences.org/articles/79278/elife-79278-fig8-data1-v2.xlsx
Figure 9

Patient-derived fibroblasts display perturbations in SM distribution and lipid order.
(A) Control (WT) or patient-derived human skin fibroblasts carrying heterozygous missense variants c.185T>G (p.I62S) or c.191T>G (p.M64R) in SGMS2 were co-transfected with mCherry-tagged VAPA (ER, magenta) and GFP-tagged EqtSMSS (green). Co-transfections with GFP-tagged EqtSolSS served as control. After 16 hr, cells were incubated in hypotonic medium (1% Optimem) for 5 min and imaged by spinning disc confocal microscopy. (B) Fibroblasts as in (A) were transfected with GFP-tagged EqtSMcyto. After 16 hr, cells were fixed, immunostained with α-calnexin antibodies (ER, magenta), counterstained with DAPI (blue) and imaged by DeltaVision microscopy. (C) Fibriblasts as in (A) were stained with 0.2 μM NR12A for 10 min and analyzed by ratiometric fluorescence microscopy to quantitatively access lipid order in the outer PM leaflet. Warmer colors reflect a higher lipid order. n=30 cells per condition analyzed over two biologically independent experiments. (D) Fibroblasts as in (A) were stained with 0.2 μM NRERCl for 10 min and analyzed by ratiometric fluorescence microscopy to quantitatively access lipid order in the ER. Warmer colors reflect a higher lipid order. n=27 cells per condition analyzed over two biologically independent experiments. All p values calculated by unpaired t-test. Scale bar, 10 μm. (E) Graphic illustration of how pathogenic SMS2 variants affect the subcellular SM distribution, promote translocation of EqtSMcyto to cytosolic puncta, and influence cholesterol organization at the PM. See text for details.
-
Figure 9—source data 1
Raw data of the quantitative analysis of ratiometric fluorescence microscopy images captured under the conditions indicated.
- https://cdn.elifesciences.org/articles/79278/elife-79278-fig9-data1-v2.xlsx
Appendix 1—figure 1
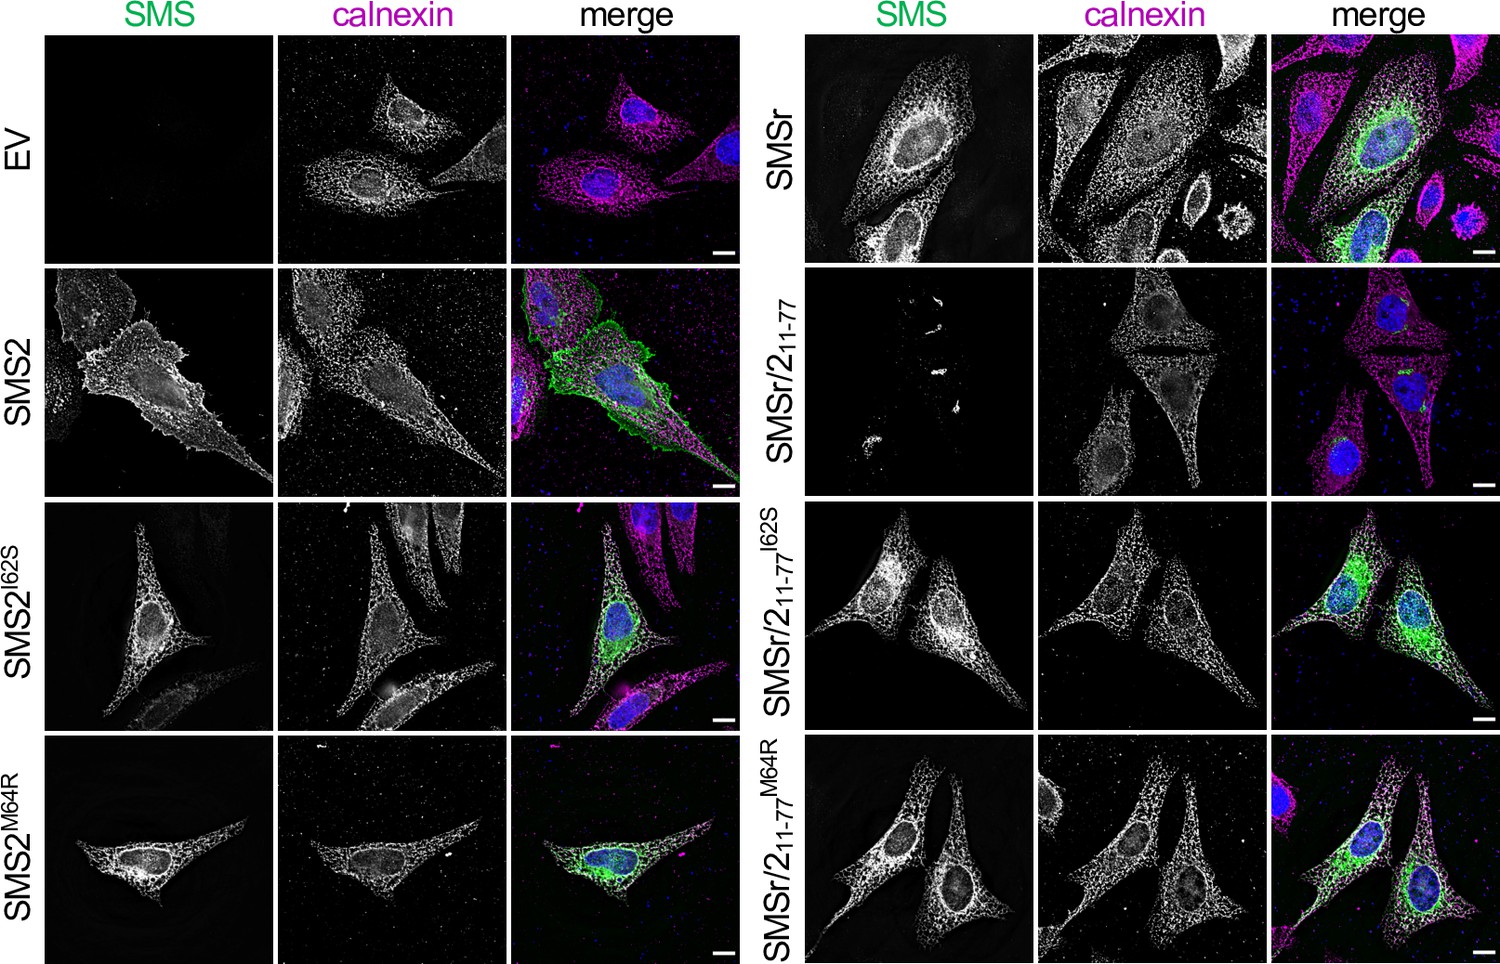
SMS2 contains an autonomous ER export signal.
HeLa cells transfected with empty vector (EV) or FLAG-tagged SMS2, SMS2I62S, SMS2M64R, SMSr, SMSr/211-77, SMSr/211-77I62S or SMSr/211-77M64R were fixed, immunostained with a-FLAG (green) andα-calnexin (magenta) antibodies, counterstained with DAPI (blue) and imaged by DeltaVision microscopy. Scale bar, 10 μm.
Appendix 1—figure 2
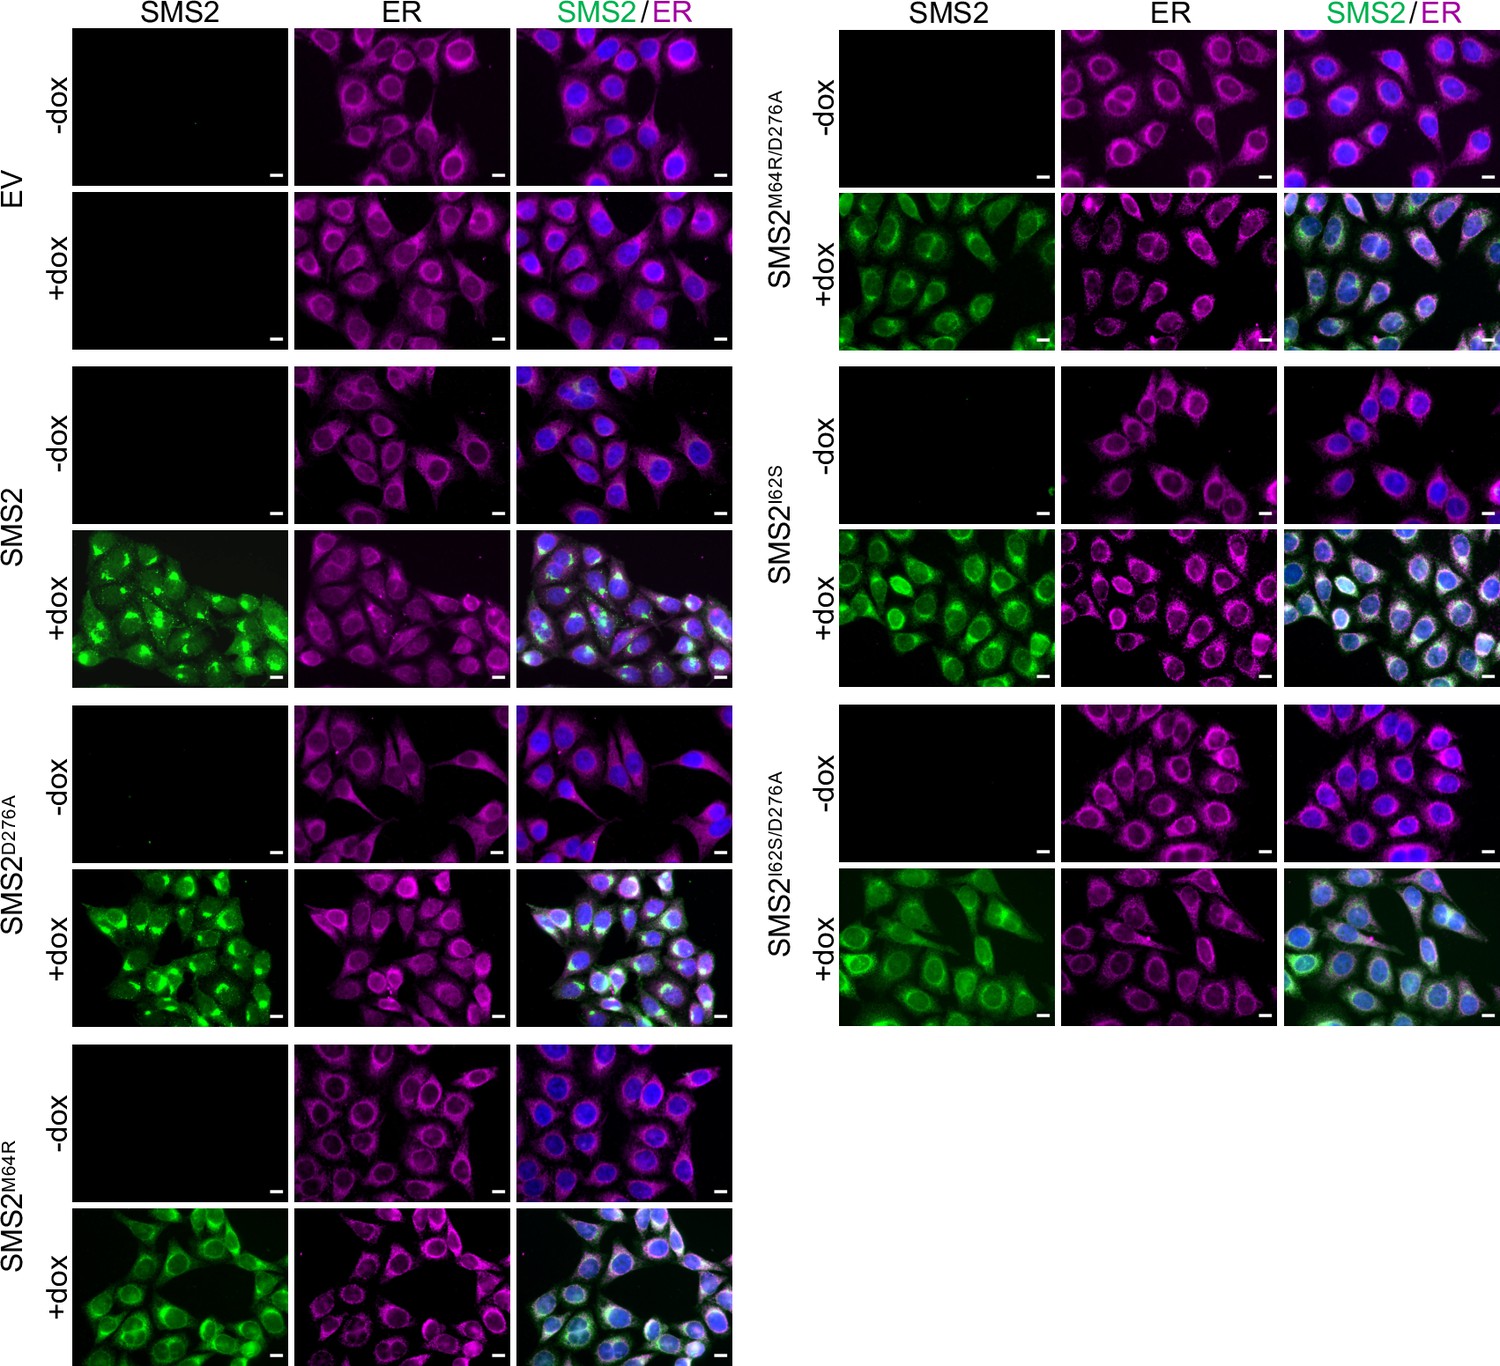
Doxycycline-induced expression of SMS2 variants in stably transduced HeLa cells.
HeLa ΔSMS1/2 cells transduced with doxycycline-inducible Flag-tagged SMS2, SMS2I62S, SMS2M64R or their enzyme-dead isoforms (D276A) were grown for 16 h in the absence or presence of 1 μg/ml doxycycline. Next, cells were fixed, immunostained withα-FLAG (green) and α-calnexin (magenta) antibodies, counterstained with DAPI (blue) and imaged by conventional fluorescence microscopy. Scale bar, 10 μm.
Appendix 1—figure 3
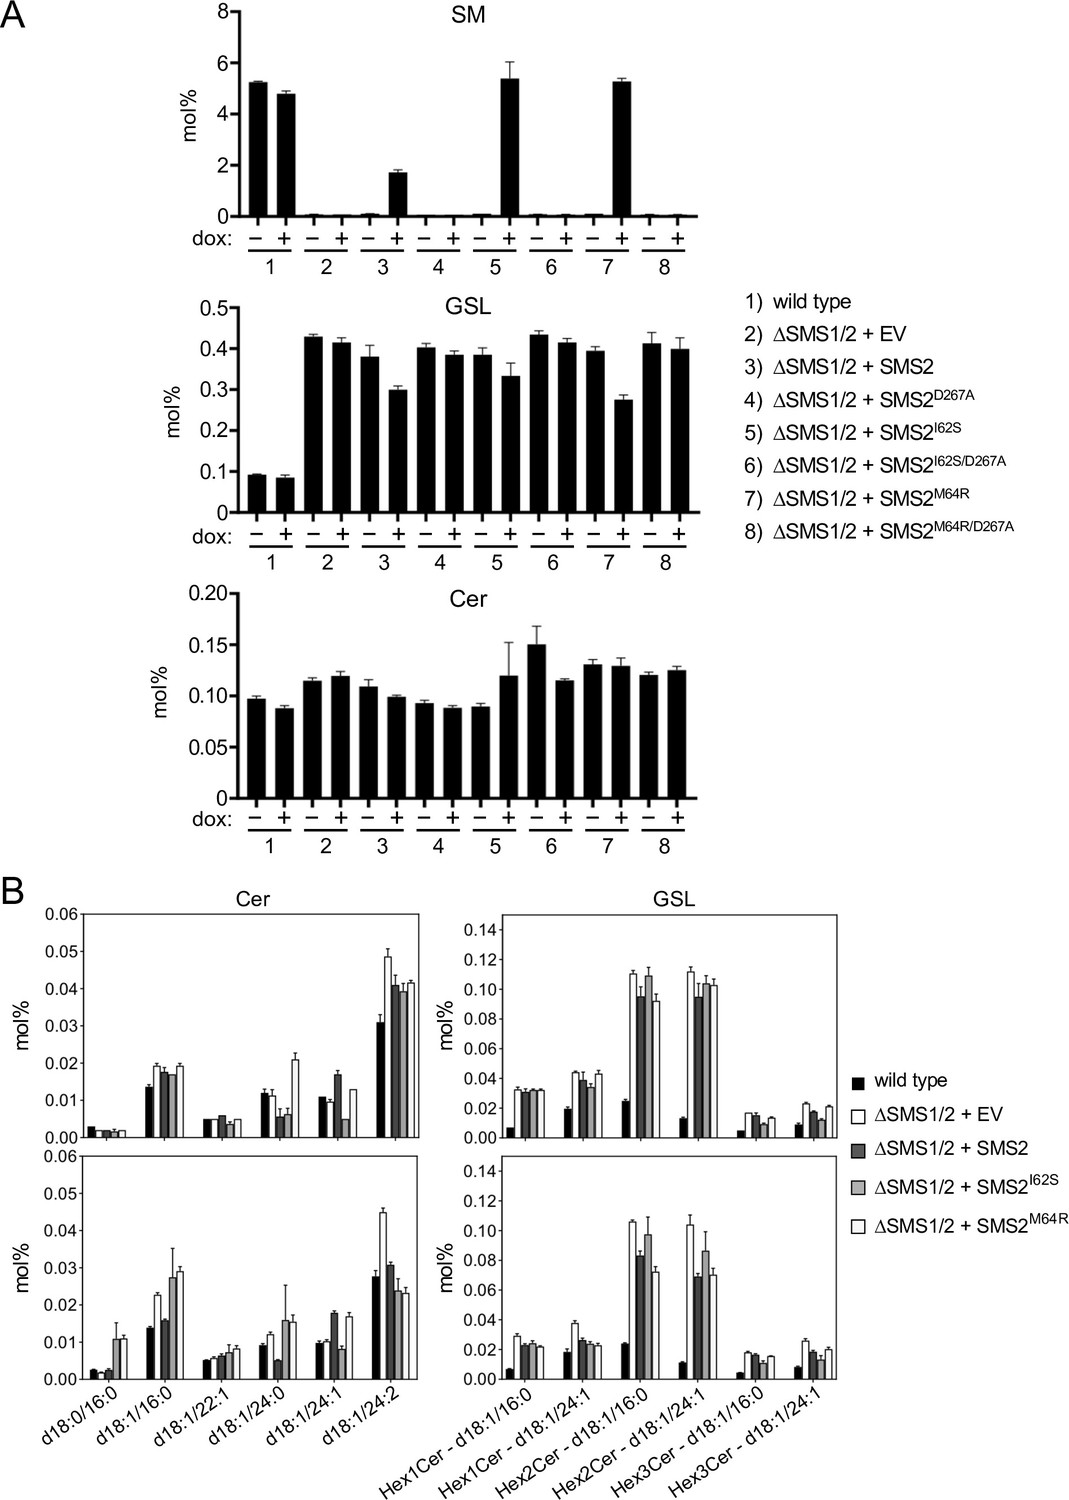
Pathogenic SMS2 variants support bulk production of SM in the ER.
(A) HeLa ΔSMS1/2 cells transduced with doxycycline-inducible FLAG-tagged SMS2, SMS2I62S, SMS2M64R or their enzyme-dead isoforms (D276A) were grown for 16 h in the absence or presence of 1 μg/ml doxycycline and subjected to total lipid extraction. Cellular SM, glycosphingolipid (HexCer) and ceramide (Cer) levels were quantified by LC-MS/MS and expressed as mol% of total phospholipid analyzed. (B) Ceramide and HexCer species in total lipid extracts of cells treated as in (A) were quantified by LC-MS/MS and expressed as mol% of total phospholipid analyzed. All data are average ± SD of technical triplicates.
-
Appendix 1—figure 3—source data 1
Raw data of the quantitative analysis of lipid species under the conditions indicated.
- https://cdn.elifesciences.org/articles/79278/elife-79278-app1-fig3-data1-v2.xlsx
Appendix 1—figure 4
Mobilization of EqtSMcyto and LysSMcyto by pathogenic SMS2 variants.
(A) HeLa ΔSMS1/2 cells transduced with FLAG-tagged SMS2, SMS2I62S, SMS2M64R or their enzyme-dead isoforms (D276A) were transfected with GFP-tagged EqtSMcyto (green) and grown for 16 h in the absence or presence of 1 μg/ml doxycycline. Next, cells were fixed, immunostained withα-FLAG (SMS2, red) and α-calnexin (ER, magenta) antibodies, counterstained with DAPI (blue) and imaged by DeltaVision microscopy. (B) Cells as in (A) were transfected with GFP-tagged EqtSolcyto (green) and grown for 16 h in the absence or presence of 1 μg/ml doxycycline. Next, cells were fixed, immunostained withα-FLAG (SMS2, red) and α-calnexin (ER, magenta) antibodies, counterstained with DAPI (blue) and imaged by DeltaVision microscopy. (C) Cells as in (A) were transfected with GFP-tagged LysSMcyto or LysSolcyto (green) and grown for 16 h in the presence of 1 μg/ml doxycycline. Next, cells were fixed, immunostained withα-FLAG (SMS2, magenta), counterstained with DAPI (blue) and imaged by DeltaVision microscopy. Scale bar, 10 μm.
Appendix 1—figure 5
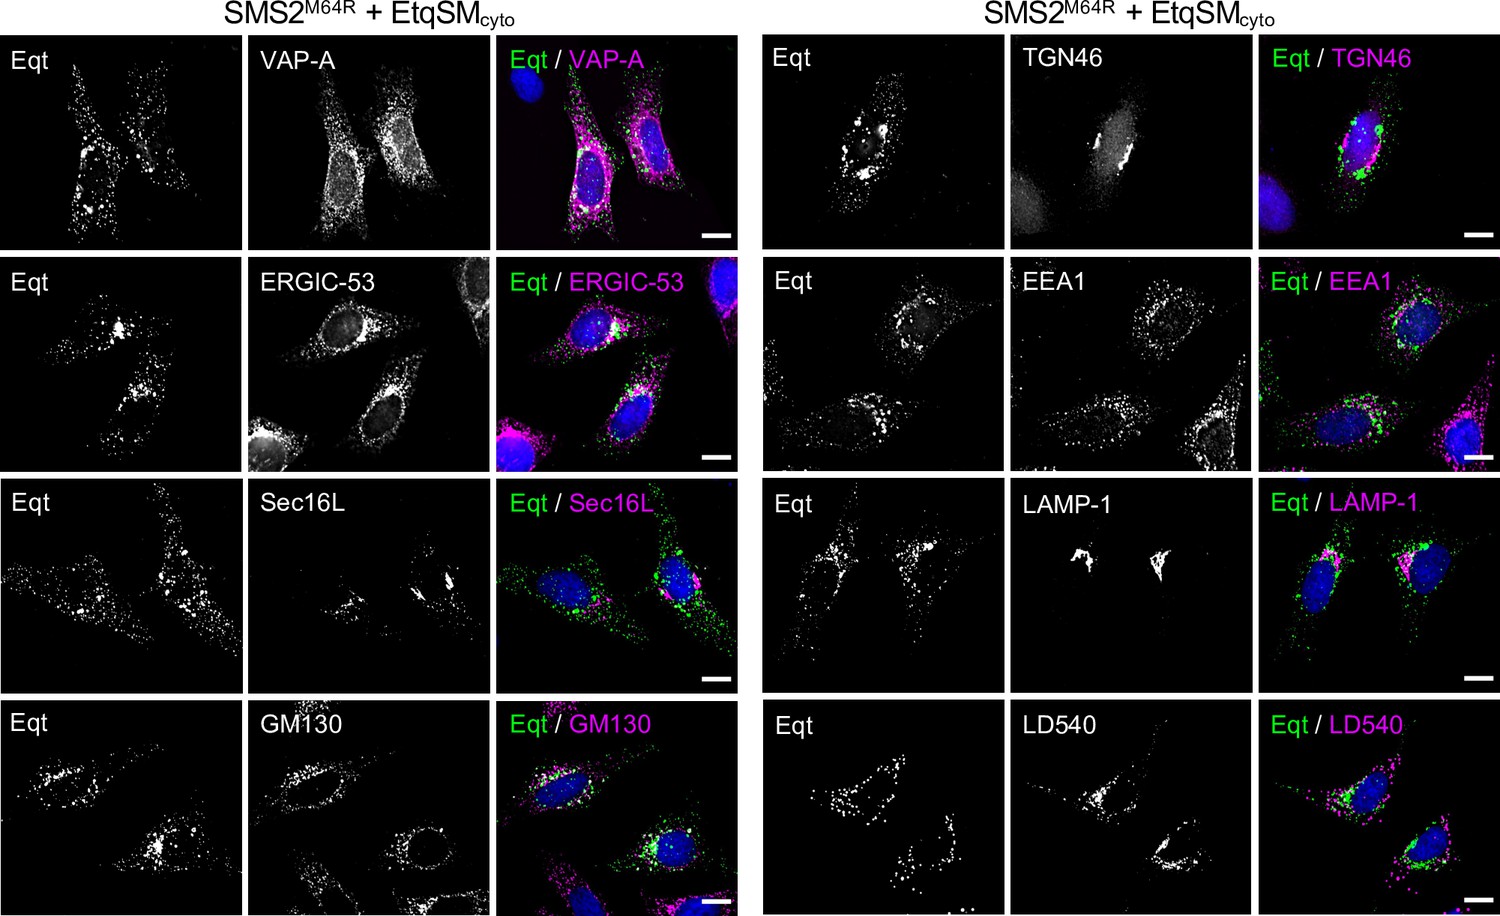
EqtSMcyto-positive puncta formed in cell expressing pathogenic SMS2 variants do not co-localize with a wide range of organellar markers.
HeLa ΔSMS1/2 cells transduced with doxycycline-inducible SMS2M64R were transfected with EqtSMcyto (green) and treated with 1 μg/ml doxycycline for 16 h. Next, cells were fixed, immunostained with antibodies against various organellar markers (magenta), counterstained with DAPI (blue) and imaged by DeltaVision microscopy. The ER was marked by co-transfection with mCherry-tagged VAPA while lipid droplets were labeled using the lipophilic dye LD540. Scale bar, 10 μm.
Appendix 1—figure 6
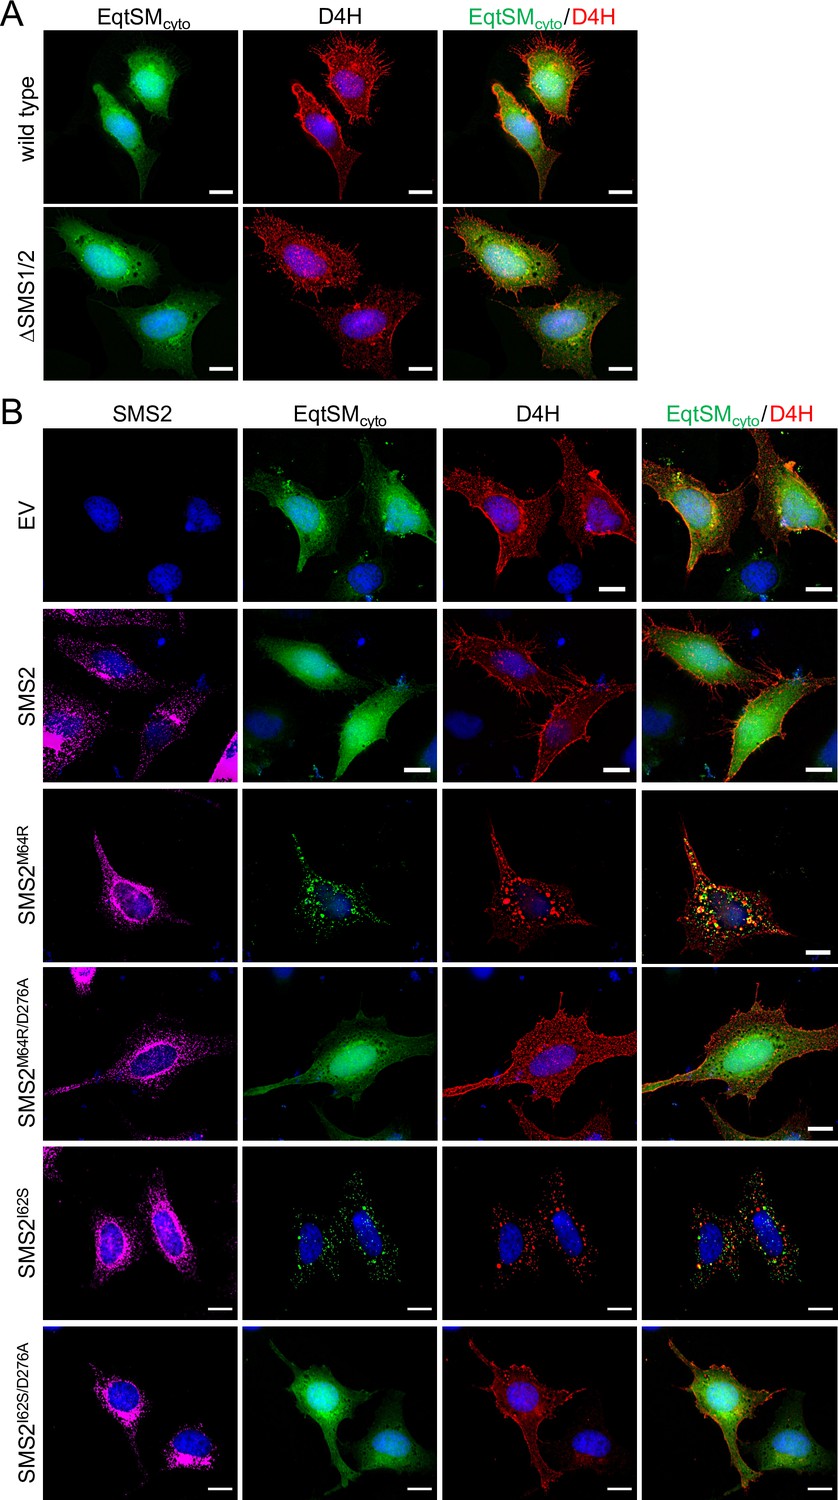
Pathogenic SMS2 variants perturb subcellular cholesterol pools.
(A) HeLa wildtype orΔSMS1/2 cells were co-transfected with GFP-tagged EqtSMcyto (green) and mCherry-tagged D4H (red). After 16 h, cells were fixed, counterstained with DAPI (blue) and imaged by DeltaVision microscopy. (B) HeLaΔSMS1/2 cells transduced with FLAG-tagged SMS2, SMS2I62S, SMS2M64R or their enzyme-dead isoforms (D276A) were co-transfected with GFP-tagged EqtSMcyto (green) and mCherry-tagged D4H (red) and then grown for 16 h in the presence of 1 μg/ml doxycycline. Next, cells were fixed, immunostained withα-FLAG antibodies (SMS2, magenta), counterstained with DAPI (blue) and imaged by DeltaVision microscopy. Scale bar, 10 μm.
Appendix 1—figure 7
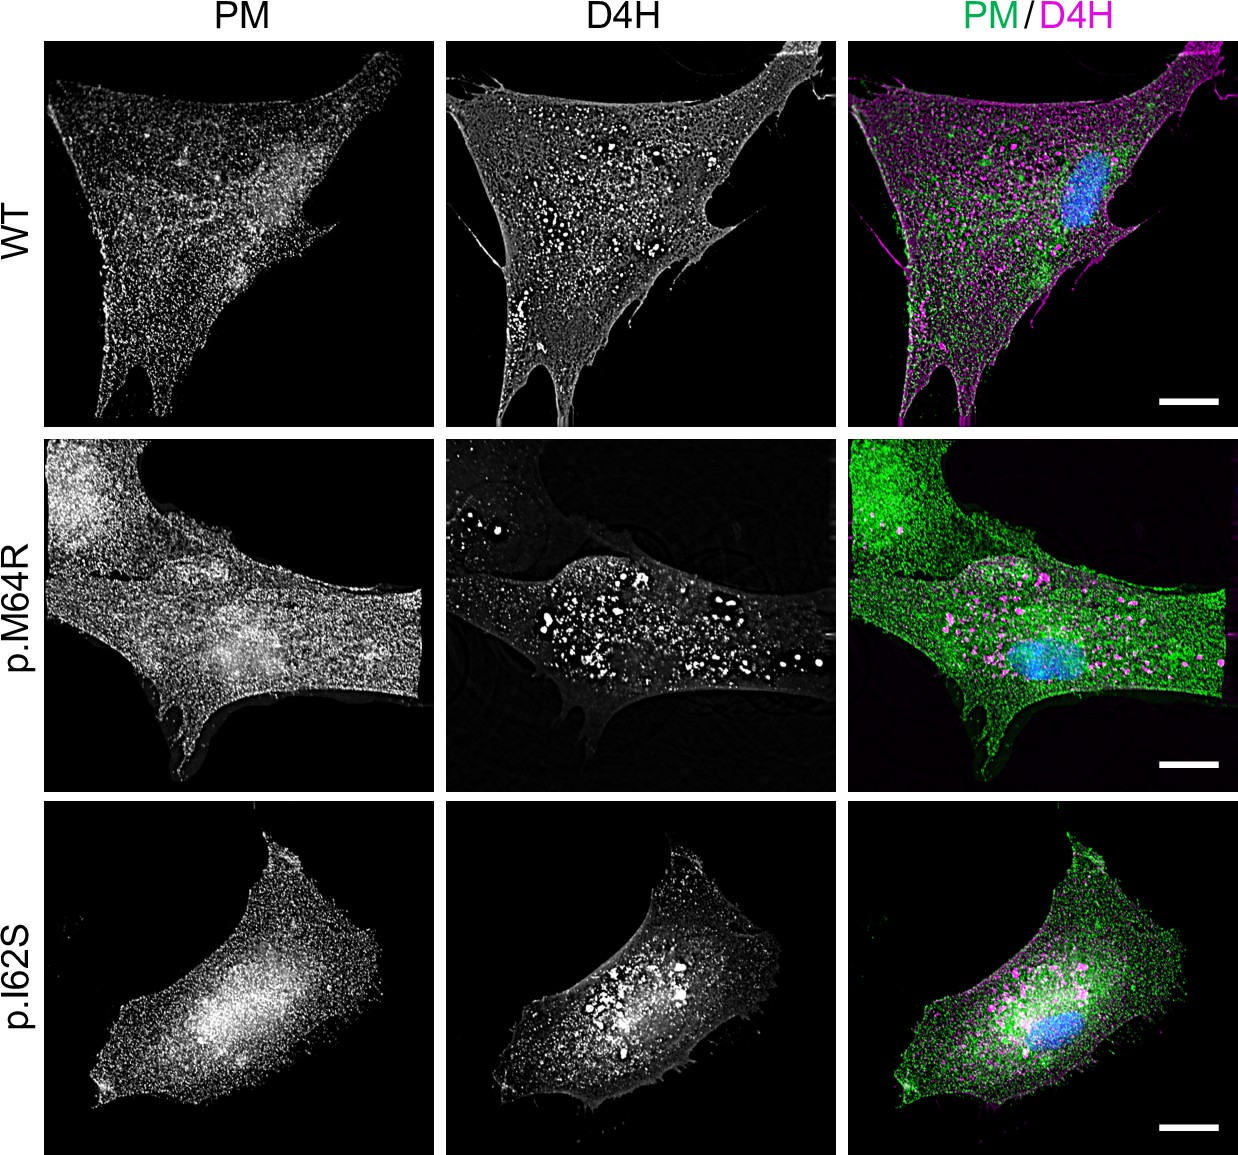
Patient-derived fibroblasts display perturbations in subcellular cholesterol pools.
Control (WT) or patient-derived human skin fibroblasts carrying heterozygous missense variants c.185T>G (p.I62S) or c.191T>G (p.M64R) in SGMS2 were transfected with mCherry-tagged D4H (magenta), fixed, immunostained withα-Na/K-ATPase antibodies (PM, green) and imaged by Deltavision microscopy. Scale bar, 10 μm.
Author response image 1
Author response image 2
Tables
Appendix 1—table 1
Primers used for site-directed mutagenesis of SMS2.
| Primer name | Sequence |
|---|---|
| SMS2(I62S)-F | 5’-CGGACTATATCCAAAGTGCTATGCCCACTGAATC-3’ |
| SMS2(I62S)-R | 5’-GATTCAGTGGGCATAGCACTTTGGATATAGTCCG-3’ |
| SMS2(M64R)-F | 5’-CTATATCCAAATTGCTAGGCCCACTGAATCAAGG-3’ |
| SMS2(M64R)-R | 5’-CCTTGATTCAGTGGGCCTAGCAATTTGGATATAG-3’ |
| SMS2(D276A)-F | 5’-CGAACACTACACTATCGCTGTGATCATTGC-3’ |
| SMS2(D276A)-R | 5’-GCAATGATCACAGCGATAGTGTAGTGTTCG-3’ |
Additional files
-
Transparent reporting form
- https://cdn.elifesciences.org/articles/79278/elife-79278-transrepform1-v2.pdf
-
Appendix 1—figure 3—source data 1
Raw data of the quantitative analysis of lipid species under the conditions indicated.
- https://cdn.elifesciences.org/articles/79278/elife-79278-app1-fig3-data1-v2.xlsx
Download links
A two-part list of links to download the article, or parts of the article, in various formats.
Downloads (link to download the article as PDF)
Open citations (links to open the citations from this article in various online reference manager services)
Cite this article (links to download the citations from this article in formats compatible with various reference manager tools)
Pathogenic variants of sphingomyelin synthase SMS2 disrupt lipid landscapes in the secretory pathway
eLife 11:e79278.
https://doi.org/10.7554/eLife.79278


