Regulatory T cells suppress the formation of potent KLRK1 and IL-7R expressing effector CD8 T cells by limiting IL-2
- Laboratory of Adaptive Immunity, Institute of Molecular Genetics of the Czech Academy of Sciences, Czech Republic
- Faculty of Science, Charles University, Czech Republic
- Institute of Microbiology of the Czech Academy of Sciences, Czech Republic
- Department of Biomedicine, University Hospital of Basel, Switzerland
Figures
Figure 1 with 1 supplement
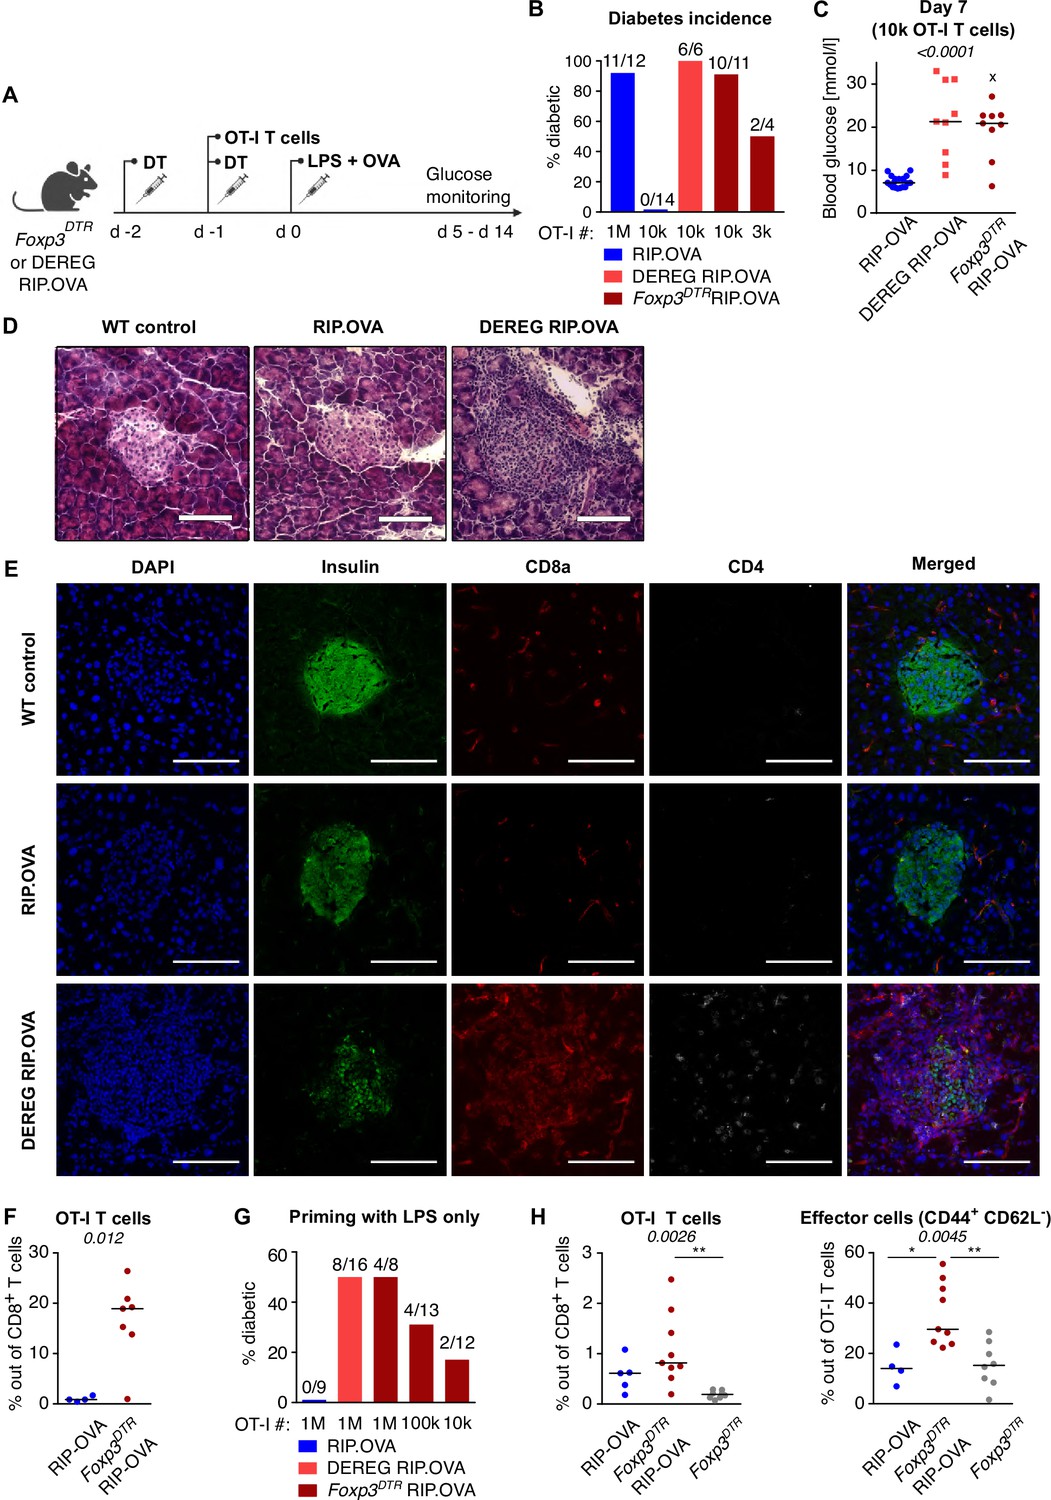
Depletion of Tregs decreases the quorum of self-reactive CD8+ T cells required for diabetes induction.
(A) Scheme of RIP. OVA diabetes model. OT-I T cells were transferred into Foxp3DTR RIP.OVA or DEREG RIP.OVA mice (Treg-depleted with DT) and RIP.OVA controls (Treg-replete). The next day, mice were immunized with OVA peptide and LPS. Urine glucose levels were monitored on a daily basis for 14 days. (B–H) Diabetes was induced in RIP.OVA mice as described in (A). (B) Percentage of diabetic mice is shown. Number of diabetic mice and total number of mice per group is indicated on top of each column. Number of transferred OT-I T cells is indicated for each group. (C) Glucose concentration in blood on day 7 post-immunization is shown. RIP.OVA n = 19, DEREG RIP.OVA n = 9, Foxp3DTR RIP.OVA n = 9. One mouse from Foxp3DTR RIP.OVA group died before the measurement (shown as 'x'). (D, E) Histological analysis of pancreas tissue sections from C57Bl/6J (n = 2), RIP.OVA (n = 4), and DEREG RIP.OVA (n = 4) mice on a day 4 post immunization. Representative images are shown. Two independent experiments were performed. Scale bar 200 μm. (D) Hematoxylin and eosin staining. A pancreatic islets is in the center of each image. (E) Immunofluorescence staining of nuclei (DAPI) and indicated markers with antibodies. (F) Diabetes was induced in RIP.OVA (Ly5.1/Ly5.2, n = 4) and Foxp3DTR RIP.OVA (Ly5.1, n = 7) mice using 0.5 × 10⁶ OT-I T cells. Spleens were collected on day 5 and analyzed by flow cytometry. Percentage of OT-I T cells in CD8+ T-cell population is shown. (G, H) RIP.OVA (Ly5.1/Ly5.2), Foxp3DTR RIP.OVA (Ly5.1), DEREG RIP.OVA (Ly5.1/Ly5.2), and Foxp3DTR (Ly5.1) mice were treated as shown in (A), with the exception that on day 0, mice were stimulated with LPS only (without OVA peptide). (G) Percentage of diabetic mice is shown. Number of diabetic mice and total number of mice per group is indicated on top of each column. Number of transferred OT-I T cells is indicated for each group. (H) Diabetes was induced using 0.5 × 10⁶ OT-I T cells. Spleens were collected on day 5 and analyzed by flow cytometry. Left: percentage of OT-I T cells in CD8+ T-cell population is shown. RIP.OVA n = 5, Foxp3DTR RIP.OVA n = 9, Foxp3DTR n = 8. Right: percentage of effector cells defined as CD44+ CD62L- in OT-I T-cell population is shown. RIP.OVA n = 4, Foxp3DTR RIP.OVA n = 9, Foxp3DTR n = 8. Statistical significance was calculated by Kruskal–Wallis test (p-value is shown in italics) with Dunn’s post-test (*<0.05, **<0.01) for comparison of three groups (C, F), or two-tailed Mann–Whitney test for comparison of two groups (D, p-value shown in italics). Median is shown.
Figure 1—figure supplement 1
Suppression of self-reactive CD8+ T cells by Tregs.
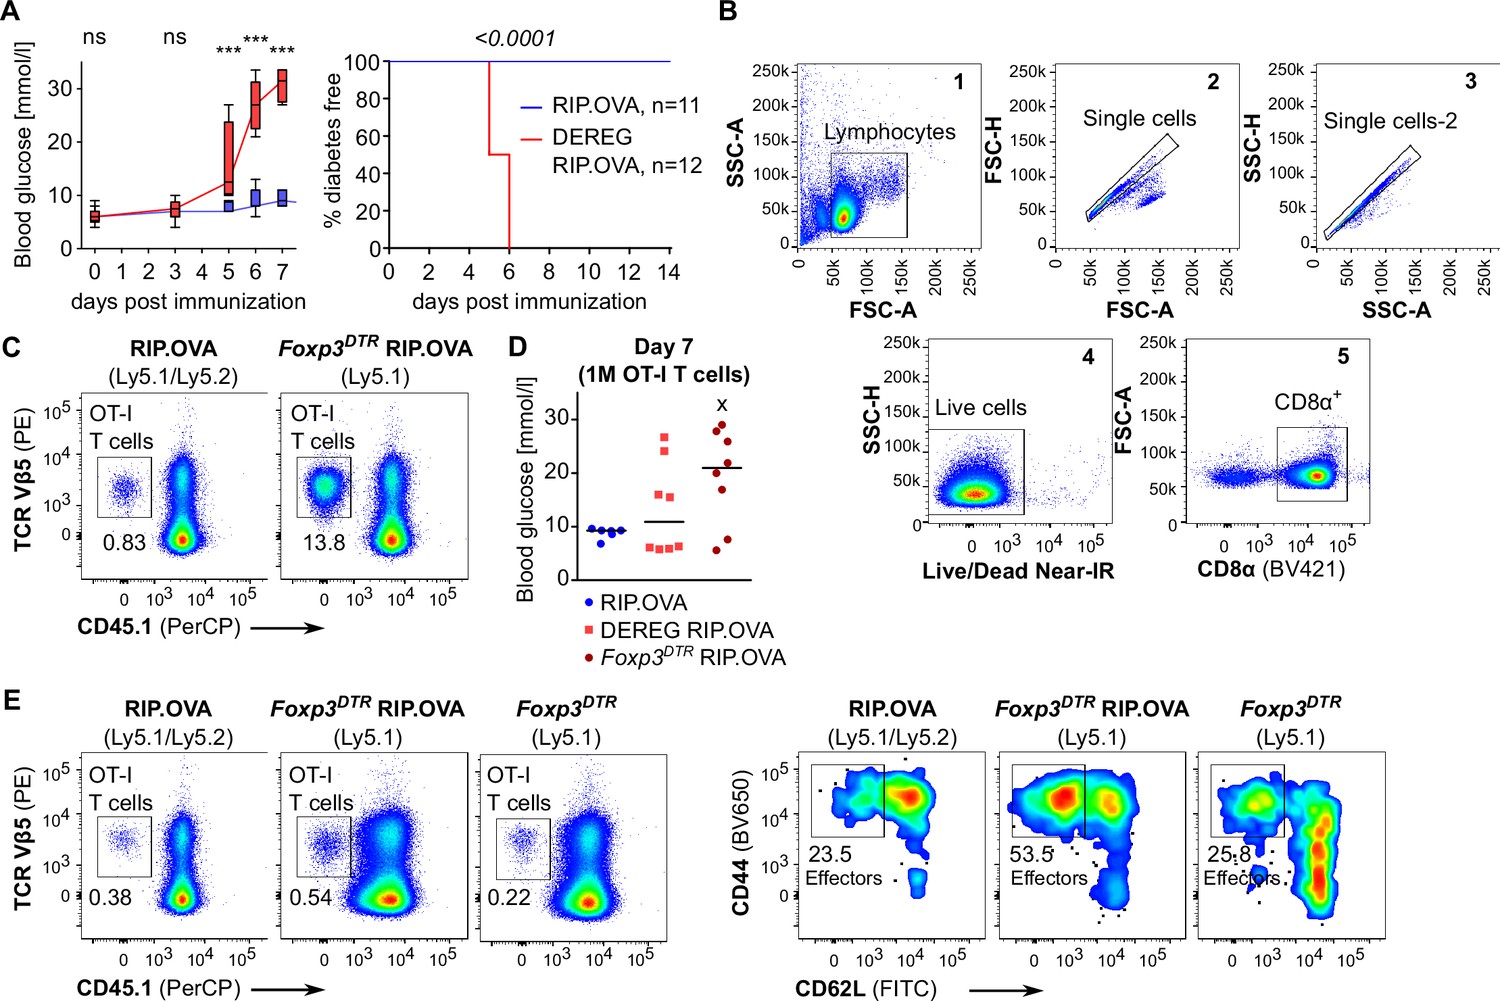
(A) Diabetes was induced as shown in Figure 1A–C with 1 × 10⁴ OT-I T cells in two independent experiments in RIP.OVA (n = 11, blue) and DEREG RIP.OVA mice (n = 12, red). Left: glucose concentration in blood was recorded on days 0, 3, 5, 6, 7 post OVA + LPS injection. Statistical significance was calculated by two-tailed Mann–Whitney test. p-value ***<0.001. Median, quartiles and range is shown. Right: glucose concentration in urine was monitored on a daily basis. Percentage of diabetes free mice in time is shown. Statistical significance was calculated by log-rank (Mantel–Cox) test, p-value is shown in italics. (B) Gating strategy for the experiment shown in Figure 1F. CD4+ T cells and B cells were depleted via magnetic bead separation prior to the analysis. (C) Representative dot plots for the experiment shown in Figure 1F. (D) Blood glucose concentration (day 7) in the experiment shown in Figure 1G (106 transferred OT-I T cells). RIP.OVA n = 6, DEREG RIP.OVA n = 8, Foxp3DTR RIP.OVA n = 8. One Foxp3DTR RIP.OVA mouse died before the measurement (shown as 'x'). Median is shown. (E) Representative dot plots for the experiment shown in Figure 1H.
Figure 2 with 1 supplement
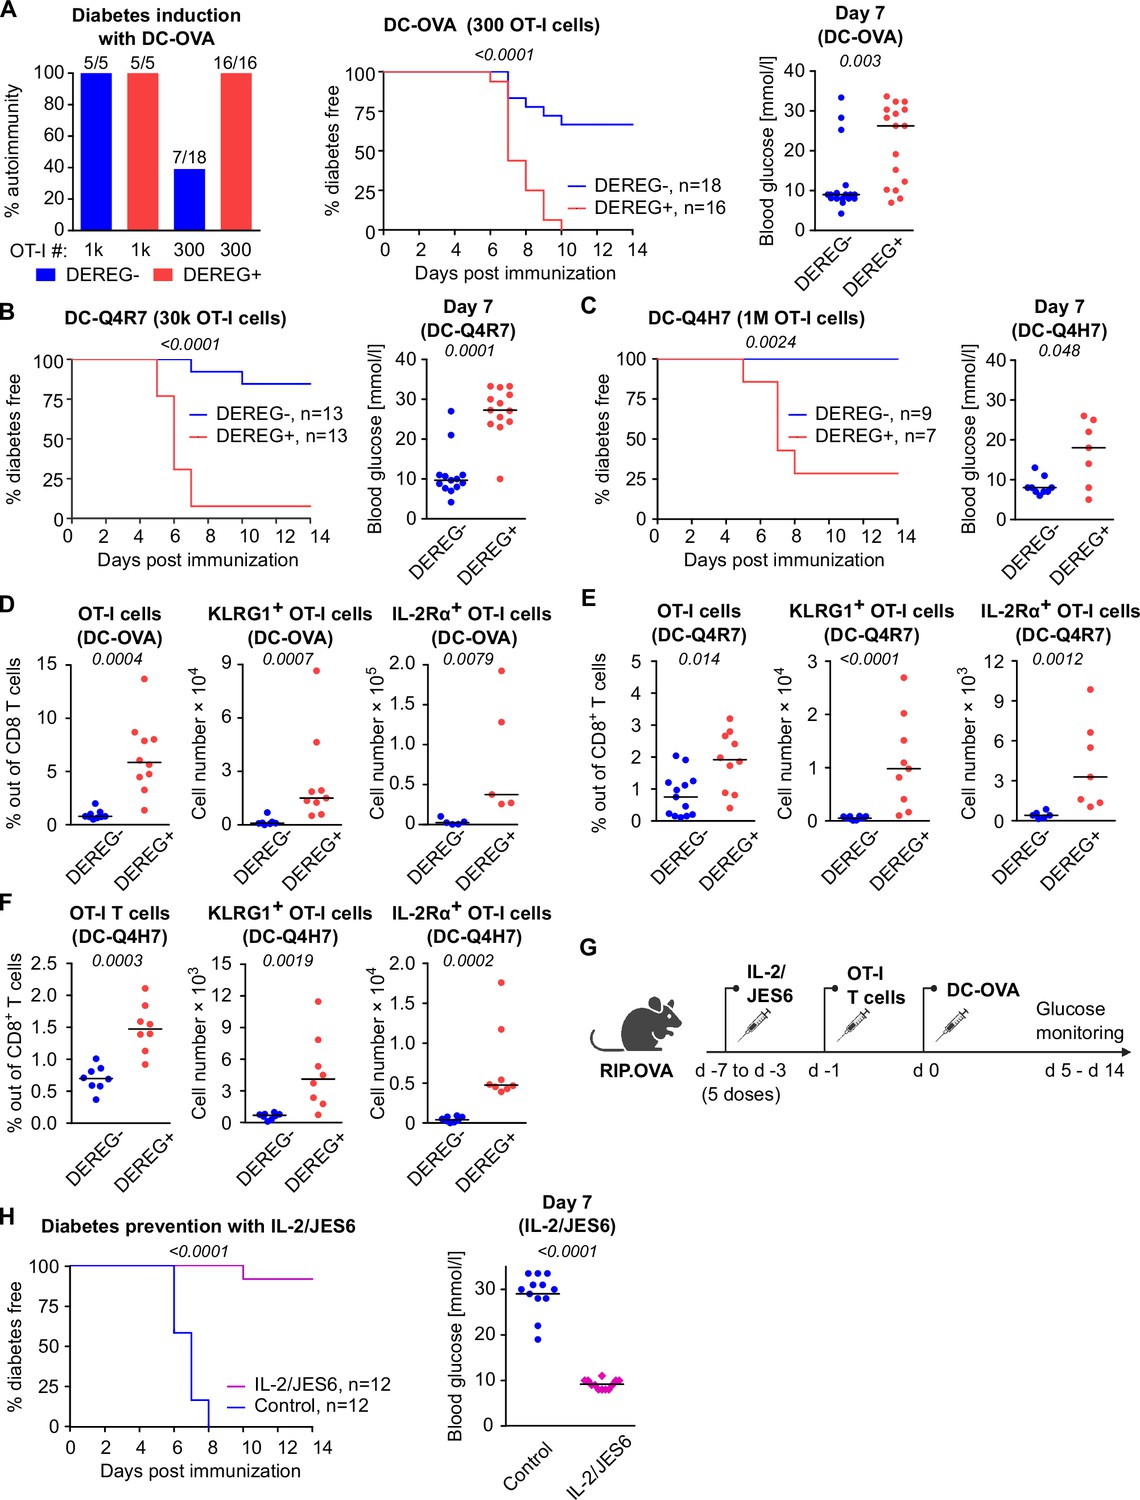
Both high-affinity and low-affinity self-reactive CD8+ T cells are controlled by Tregs.
(A–C) Treg-depleted DEREG+ RIP.OVA mice and control DEREG- RIP.OVA mice received indicated numbers of OT-I T cells (103 or 3 × 10² OT-I T cells in A, 3 × 10⁴ OT-I T cells in B, 106 OT-I T cells in C). The next day, mice were immunized with DC loaded with an indicated peptide (OVA in A, Q4R7 in B, Q4H7 in C). Urine glucose level was monitored on a daily basis for 14 days. (A) Left: percentage of diabetic mice is shown. Number of diabetic mice and total number of mice per group is indicated on top of each column. Middle: survival curve. Number of mice per group is indicated. Right: blood glucose concentration on day 7 post-immunization. (B, C) Left: survival curve. Number of mice per group is indicated. Right: blood glucose concentration on day 7 post-immunization. (D–F) Diabetes was induced in DEREG- RIP.OVA and DEREG+ RIP.OVA mice similarly to (A–C). On day 6, spleens were collected and analyzed by flow cytometry. Percentage of OT-I T cells among CD8+ T cells, count of KLRG1+ OT-I T cells, and count of IL-2Rα+ OT-I T cells are shown. (D) Diabetes was induced using DC-OVA and 103 OT-I T cells. Left: DEREG- n = 9, DEREG+ n = 10. Middle: DEREG- n = 7, DEREG+ n = 9. Right: n = 5 mice per group. (E) Diabetes was induced using DC-Q4R7 and 3 × 10⁴ OT-I T cells. Left: DEREG- n = 13, DEREG+ n = 10. Middle: DEREG- n = 10, DEREG+ n = 9. Right: DEREG- n = 6, DEREG+ n = 7. (F) Diabetes was induced using DC-Q4H7 and 106 OT-I T cells, n = 8 mice per group. (G, H) RIP.OVA mice were treated or not with IL-2/JES6 for five consecutive days. Two days after the last dose, the mice received 103 OT-I T cells, and the next day they were immunized with DC-OVA. Urine glucose level was monitored on a daily basis for 14 days. (G) Experimental scheme. (H) Left: survival curve. Right: blood glucose concentration on day 7 post-immunization. n = 12 mice per group. Statistical significance was calculated by log-rank (Mantel–Cox) test (survival) or two-tailed Mann–Whitney test (glucose concentration and flow cytometry analysis). p-value is shown in italics. Median is shown.
Figure 2—figure supplement 1
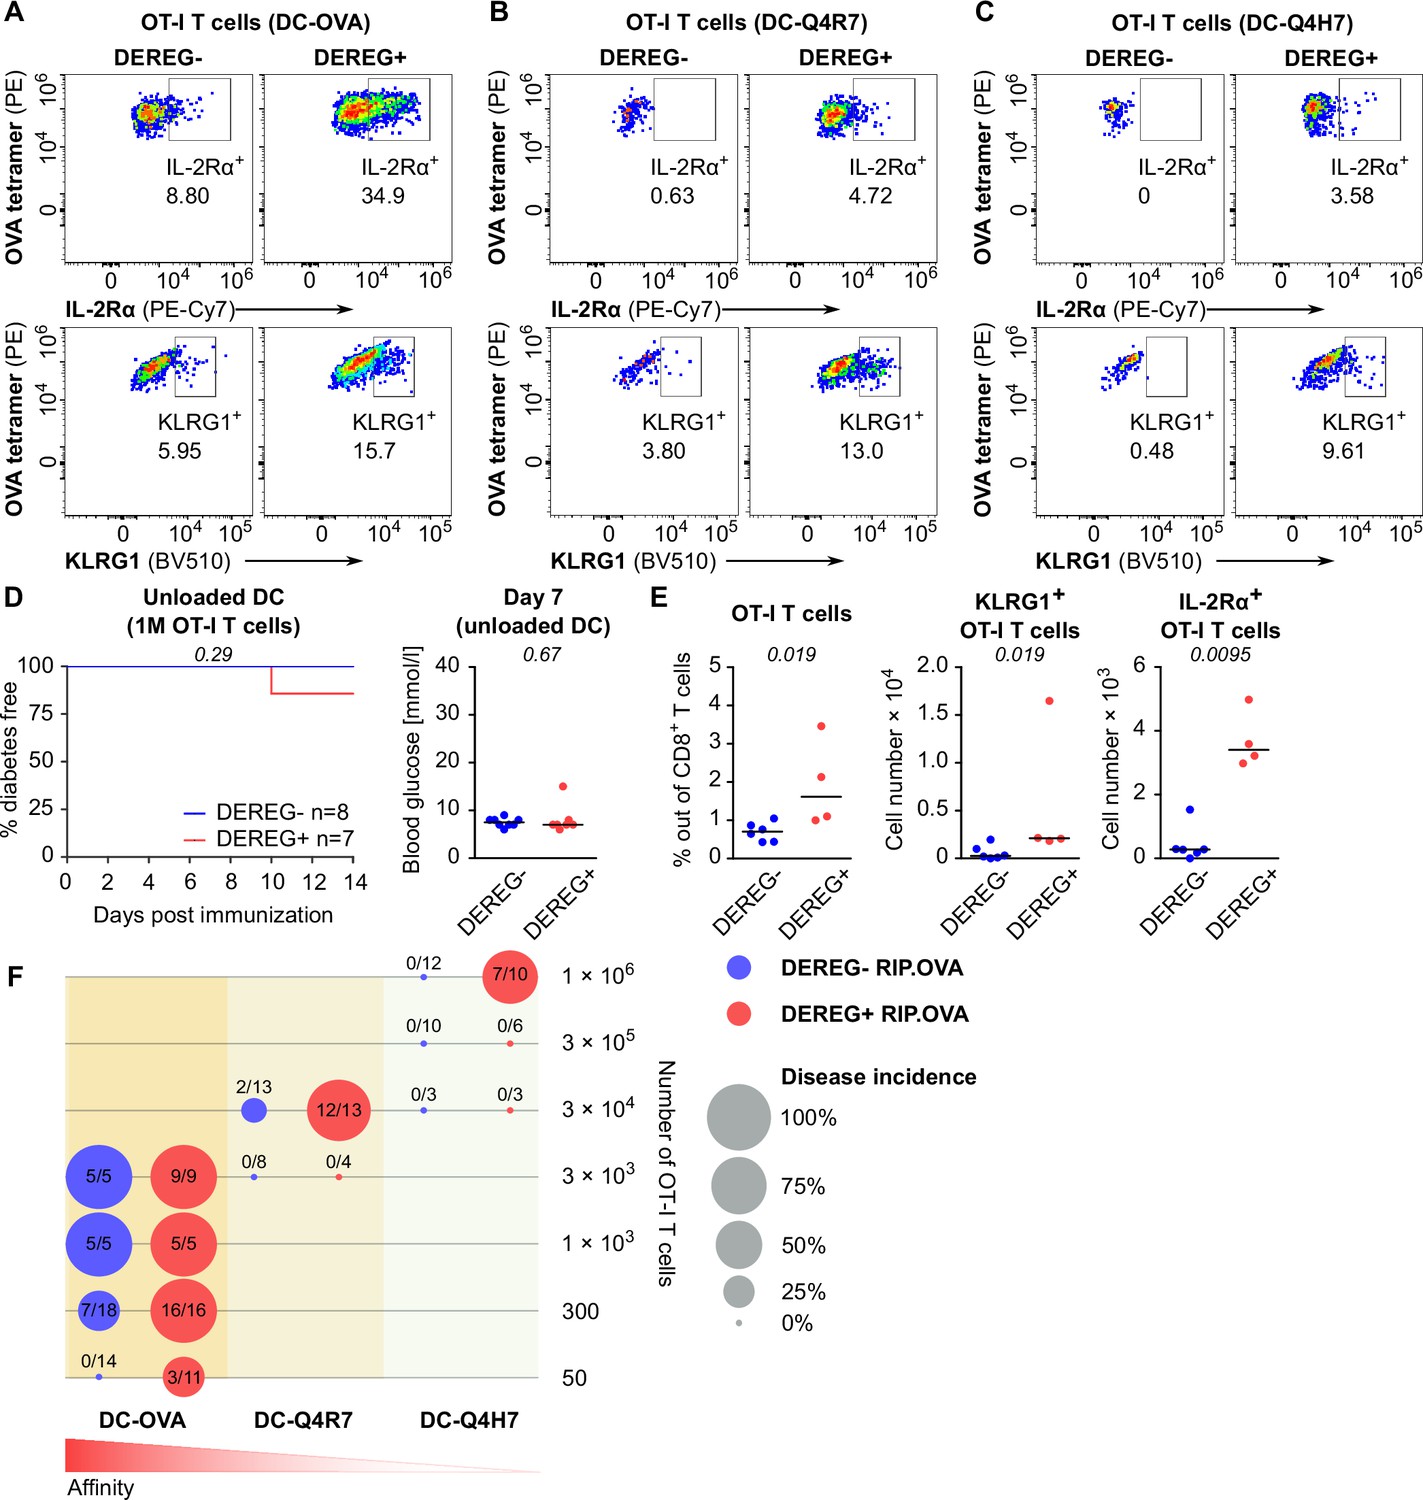
Treg-mediated suppression of CD8+ T cells with various affinities to the antigen.
(A) Representative dot plots for the experiment shown in Figure 2D. (B) Representative dot plots for the experiment shown in Figure 2E. (C) Representative dot plots for the experiment shown in Figure 2F. (D, E) Treg-depleted DEREG+ RIP.OVA mice and control DEREG- RIP.OVA mice received 106 OT-I T cells. The next day, mice were immunized with unloaded DC. (D) Urine glucose level was monitored on a daily basis. Left: percentage of diabetes-free mice. Number of mice per group is indicated. Right: blood glucose concentration on day 7 post-immunization. (E) On day 6 post-immunization, spleens were collected and analyzed by flow cytometry. Percentage of OT-I T cells among CD8+ T cells, count of KLRG1+ OT-I T cells, and count of IL-2Rα+ OT-I T cells are shown. DEREG- n = 6, DEREG+ n = 4. (F) Bubble chart illustrating diabetes incidence in DEREG+ RIP.OVA and DEREG- RIP.OVA mice immunized with DC loaded with indicated peptides vs. numbers of transferred OT-I T cells. Number of diabetic mice and total number of mice per group is indicated. Statistical significance was calculated by log-rank (Mantel–Cox) test (survival) or two-tailed Mann–Whitney test (glucose concentration and flow cytometry analysis), p-value is shown in italics. Median is shown.
Figure 3 with 1 supplement
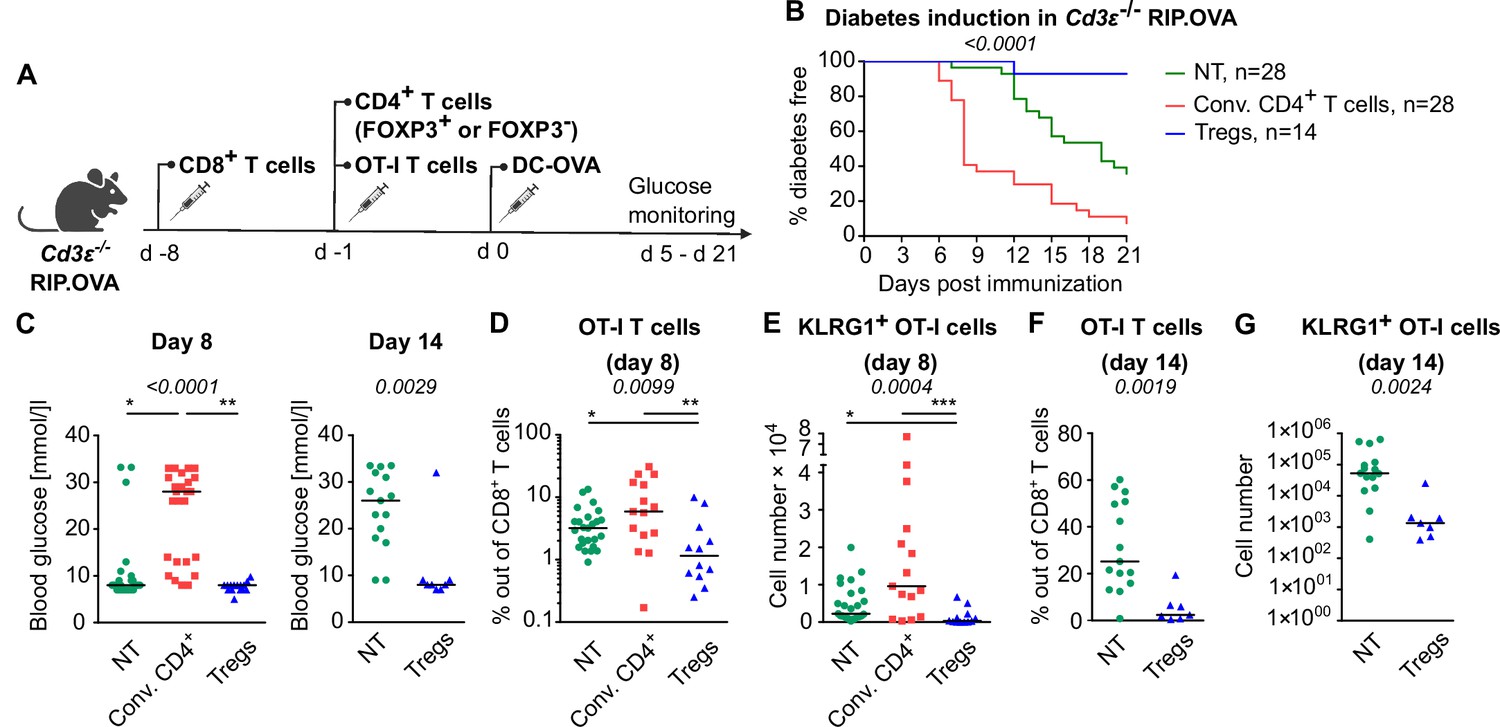
Tregs suppress self-reactive CD8+ T cells in the absence of conventional CD4+ T cells.
Cd3e-/- RIP.OVA mice received 106 polyclonal CD8+ T cells from Ly5.1 RIP.OVA mice. After 7 days, they received either 106 conventional CD4+ T cells (GFP-), or 0.4–1 × 10⁶ Tregs (GFP+) from DEREG+ RIP.OVA mice, or no CD4+ T cell transfer (NT). Next, 250 OT-I T cells were adoptively transferred to all the recipients. Next day, mice were immunized with DC-OVA. (A) Experimental scheme. (B, C) Urine glucose level was monitored on a daily basis until day 21 post-immunization. (B) Survival curve. Number of mice is indicated. (C) Blood glucose concentration on day 8 and day 14 post-immunization is shown. Day 8: NT n = 28, Conv.CD4+ n = 25, Tregs n = 15. Day 14: NT n = 15, Tregs n = 8. (D–G) On day 8 or day 14, spleens were collected and analyzed by flow cytometry. Percentage of OT-I T cells among CD8+ T cells (D, F), and count of KLRG1+ OT-I T cells (E, G) are shown. Day 8: NT n = 25, Conv.CD4+ n = 15, Tregs n = 12. Day 14: NT n = 15, Tregs n = 7. Statistical significance was calculated by Kruskal–Wallis test (p-value is shown in italics) with Dunn’s post-test (*<0.05, **<0.01, ***<0.001) for comparison of three groups, or two-tailed Mann–Whitney test for comparison of two groups (p-value is shown in italics). Median is shown.
Figure 3—figure supplement 1
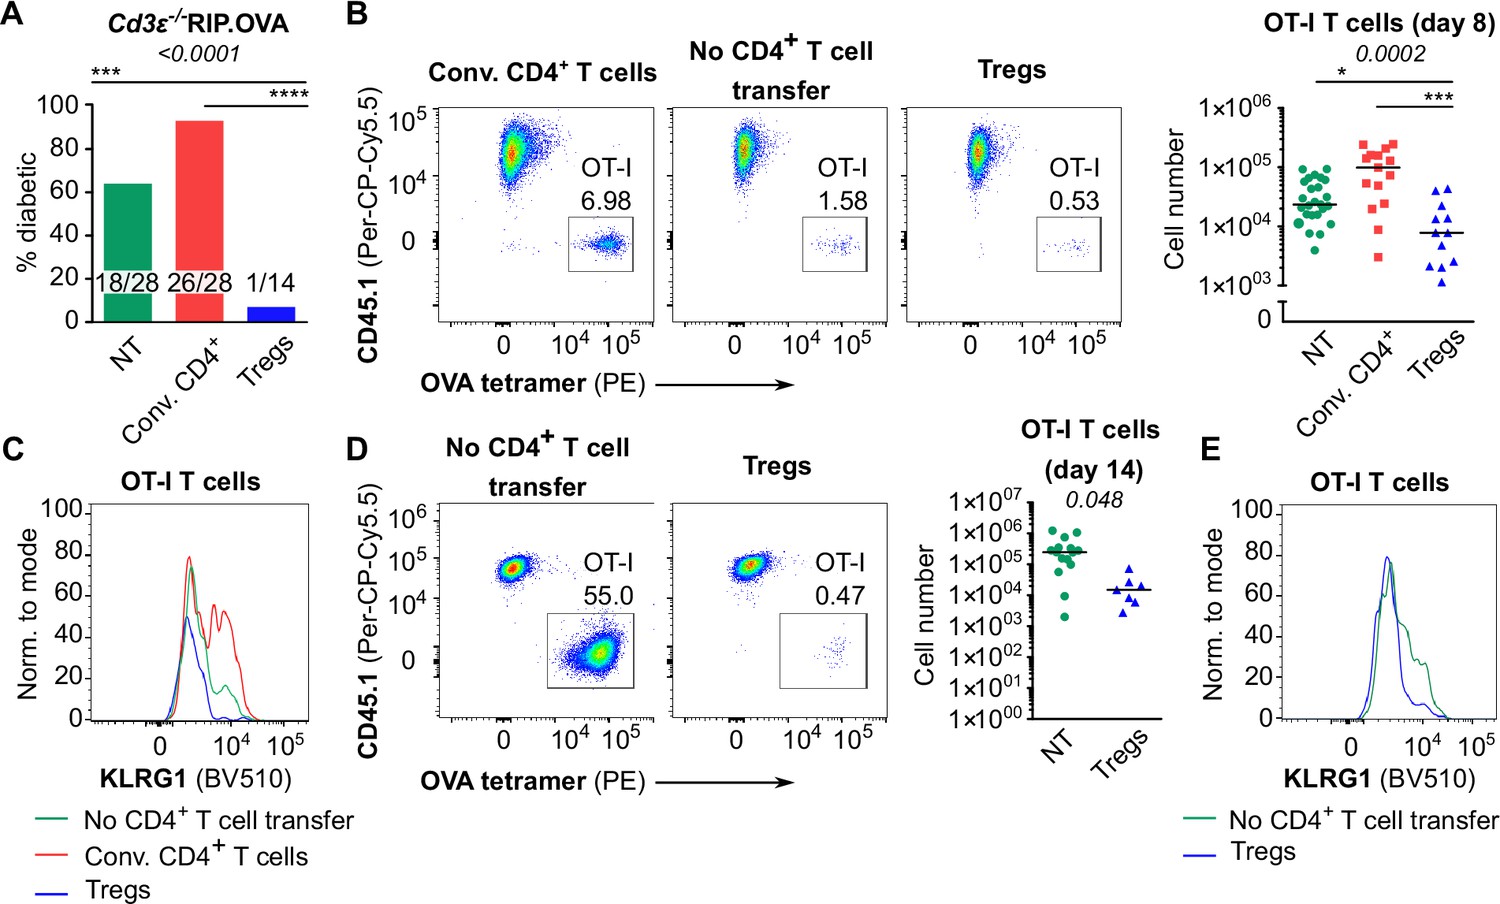
Suppression of CD8+ T cells by Tregs in the absence of conventional CD4+ T cells.
(A) Percentage of diabetic mice in individual groups in the experiment shown in Figure 3A. Number of diabetic mice and total number of mice per group is indicated. (B, C) In the experimental setup shown in Figure 3A, spleens were collected on day 8 post-immunization and analyzed by flow cytometry. (B) Left: percentage of OT-I T cells among CD8+ T cells. A representative experiment out of five in total. Right: number of OT-I T cells is shown. NT n = 25, Conv.CD4+ n = 15, Tregs n = 12. (C) KLRG1 expression on OT-I T cells on day 8, a representative histogram. (D, E) In the experimental setup shown in Figure 3A, spleens were collected on day 14 post-immunization and analyzed by flow cytometry. (D) Left: percentage of OT-I T cells among CD8+ T cells. Representative plots are shown. Right: number of OT-I T cells is shown. NT n = 15, Tregs n = 7. (E) KLRG1 expression on OT-I T cells on day 14. A representative experiment out of three in total. Statistical significance was calculated using chi-square test (p-value is shown in italics) and Fisher’s exact post-test (***<0.001, ****<0.0001) for comparison of two groups of the outcomes: diabetic mice vs. diabetes-free mice (A). Statistical significance for flow cytometry analysis was calculated by Kruskal–Wallis test (p-value is shown in italics) with Dunn’s post-test (*<0.05, ***<0.001, ****<0.0001) (B), or two-tailed Mann–Whitney test (D). Median is shown.
Figure 4 with 1 supplement
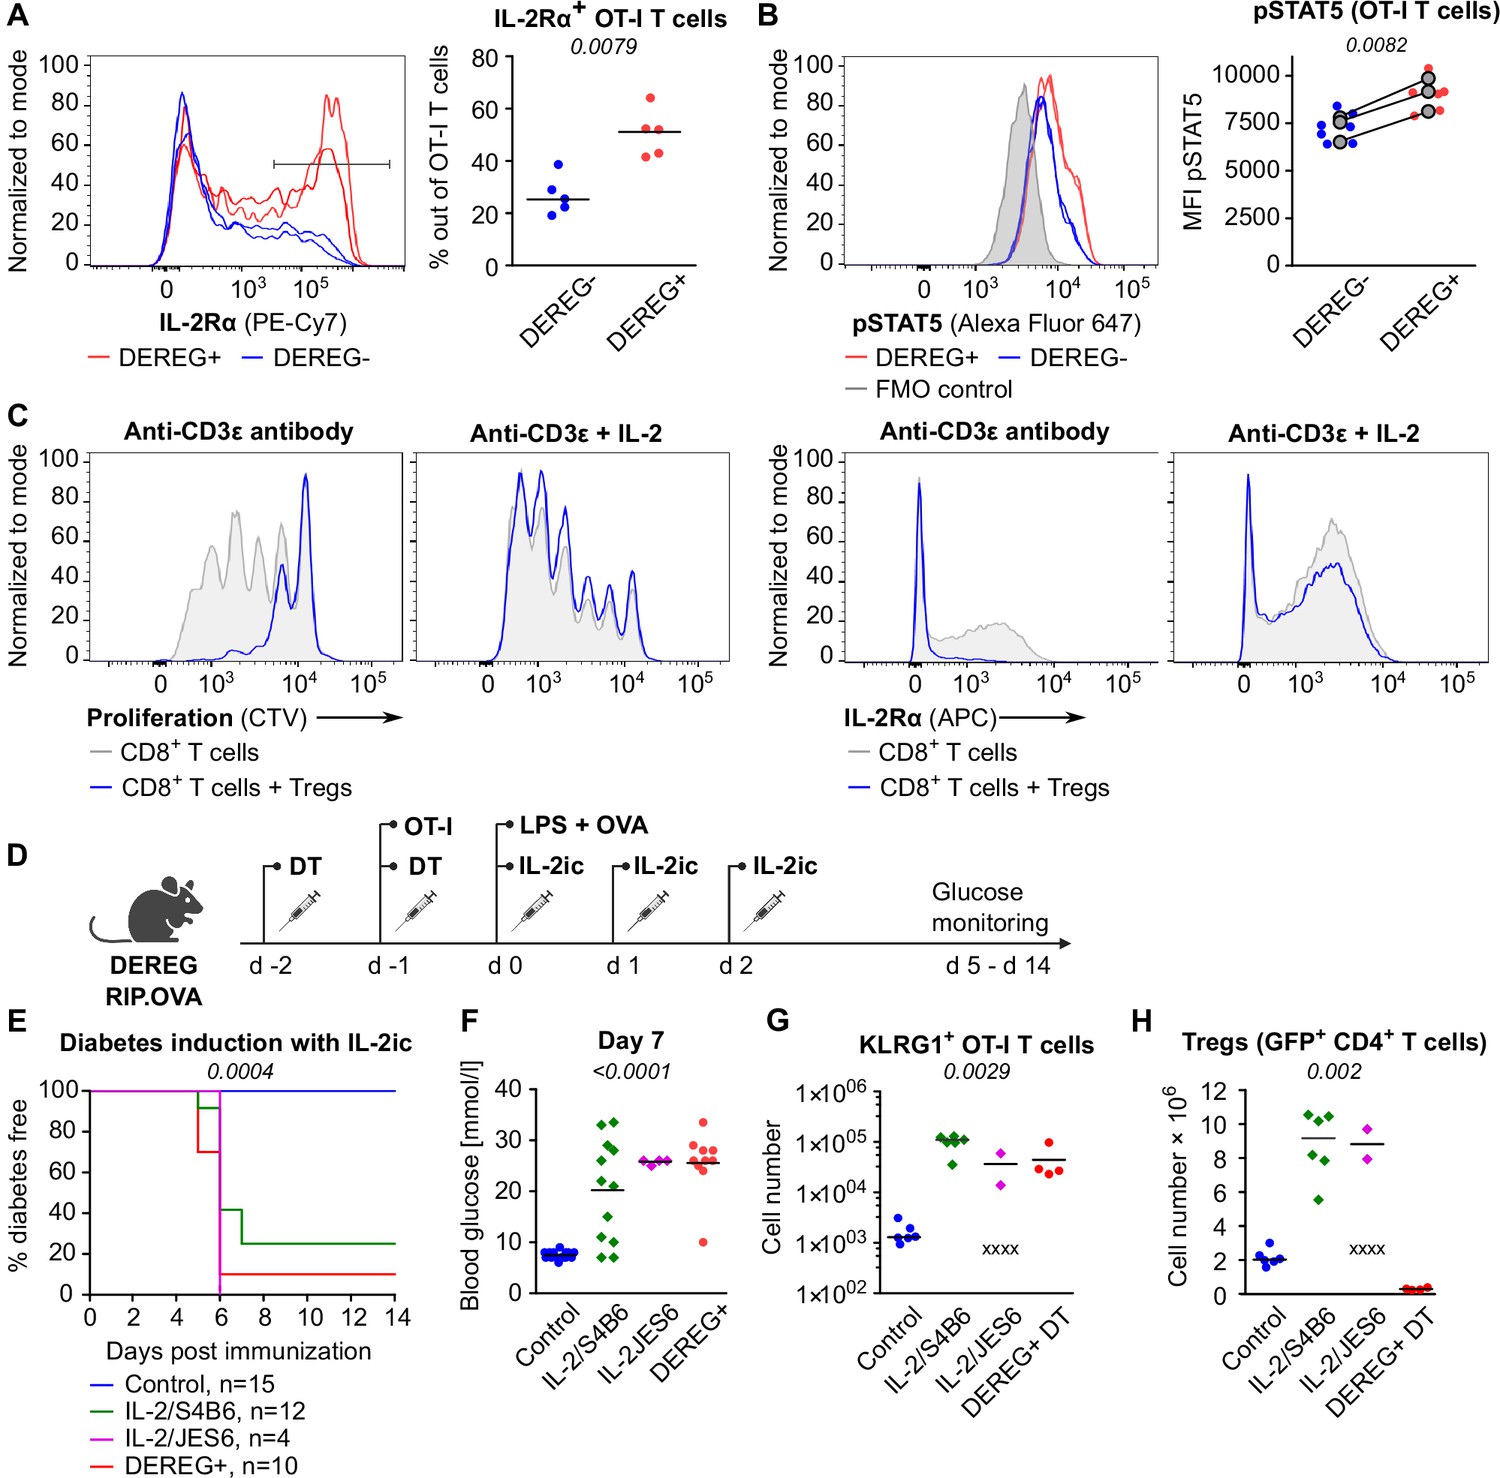
Tregs maintain tolerance of CD8+ T cells via limiting IL-2.
(A, B) OT-I T cells (5 × 10⁴) were transferred into Treg-depleted DEREG+ RIP.OVA mice and control DEREG- RIP.OVA mice. The next day, mice were immunized with DC-OVA. On day 3 post-immunization, spleens were collected and analyzed by flow cytometry. OT-I T cells were identified as OVA-tetramer and TCRVα2 double positive. (A) IL-2Rα expression on OT-I T cells. Left: a representative experiment out of three in total. Right: n = 5 mice per group. Median is shown. (B) pSTAT5 expression in OT-I T cells. Left: a representative experiment out of three in total. Right: geometric mean fluorescence intensity (MFI) of anti-pSTAT5-Alexa Fluor 647 in OT-I T cells. Mean of MFI values for each group per experiment are shown as a gray dots. Lines connect data from corresponding experiments. DEREG- n = 7, DEREG+ n = 6. (C) In vitro proliferation assay. CTV-labeled CD8+ T lymphocytes were stimulated with plate-bounded anti-CD3ɛ-antibody in the presence or absence of Tregs and/or recombinant IL-2. After 72 hr, cells were analyzed by flow cytometry. Left: proliferation is indicated by the CTV dilution. Right: IL-2Rα expression on CD8+ T cells. A representative experiment out of four in total. (D–F) Treg-depleted DEREG+ RIP.OVA mice and control DEREG- RIP.OVA mice received OT-I T cells, followed by the immunization with OVA peptide and LPS. On days 0, 1, and 2 post-immunization, RIP.OVA mice received IL-2ic (IL-2/S4B6 or IL-2/JES6). (D) Experimental scheme. (E) Urine glucose level was monitored on a daily basis for 14 days. Percentage of diabetes-free mice is shown. Number of mice is indicated. Four mice from IL-2/JES6 group died before day 5 and were excluded from the analysis. (F) Blood glucose concentration on day 7 post-immunization. Number of mice is indicated in (E). (G, H) Diabetes was induced in Treg-depleted DEREG+ RIP.OVA mice (with DT) or Treg-replete DEREG+ RIP.OVA mice (without DT), which later received IL-2ic (IL-2/S4B6 or IL-2/JES6), or were left untreated (control) (scheme D). On day 5 post-immunization, spleens were collected and analyzed by flow cytometry. Four mice from IL-2/JES6 group died before the analysis (shown as 'x'). Control n = 6, IL-2/S4B6 n = 6, IL-2/JES6 n = 2, DEREG+ DT n=4. (G) Number of KLRG1+ OT-I T cells. Median is shown. (H) Number of Tregs (defined as GFP+ CD4+ T cells). Median is shown. Statistical significance was calculated by two-tailed Mann–Whitney test (comparison of two groups), Kruskal–Wallis test (comparison of four groups), or log-rank (Mantel–Cox) test (survival), p-value is shown in italics.
Figure 4—figure supplement 1
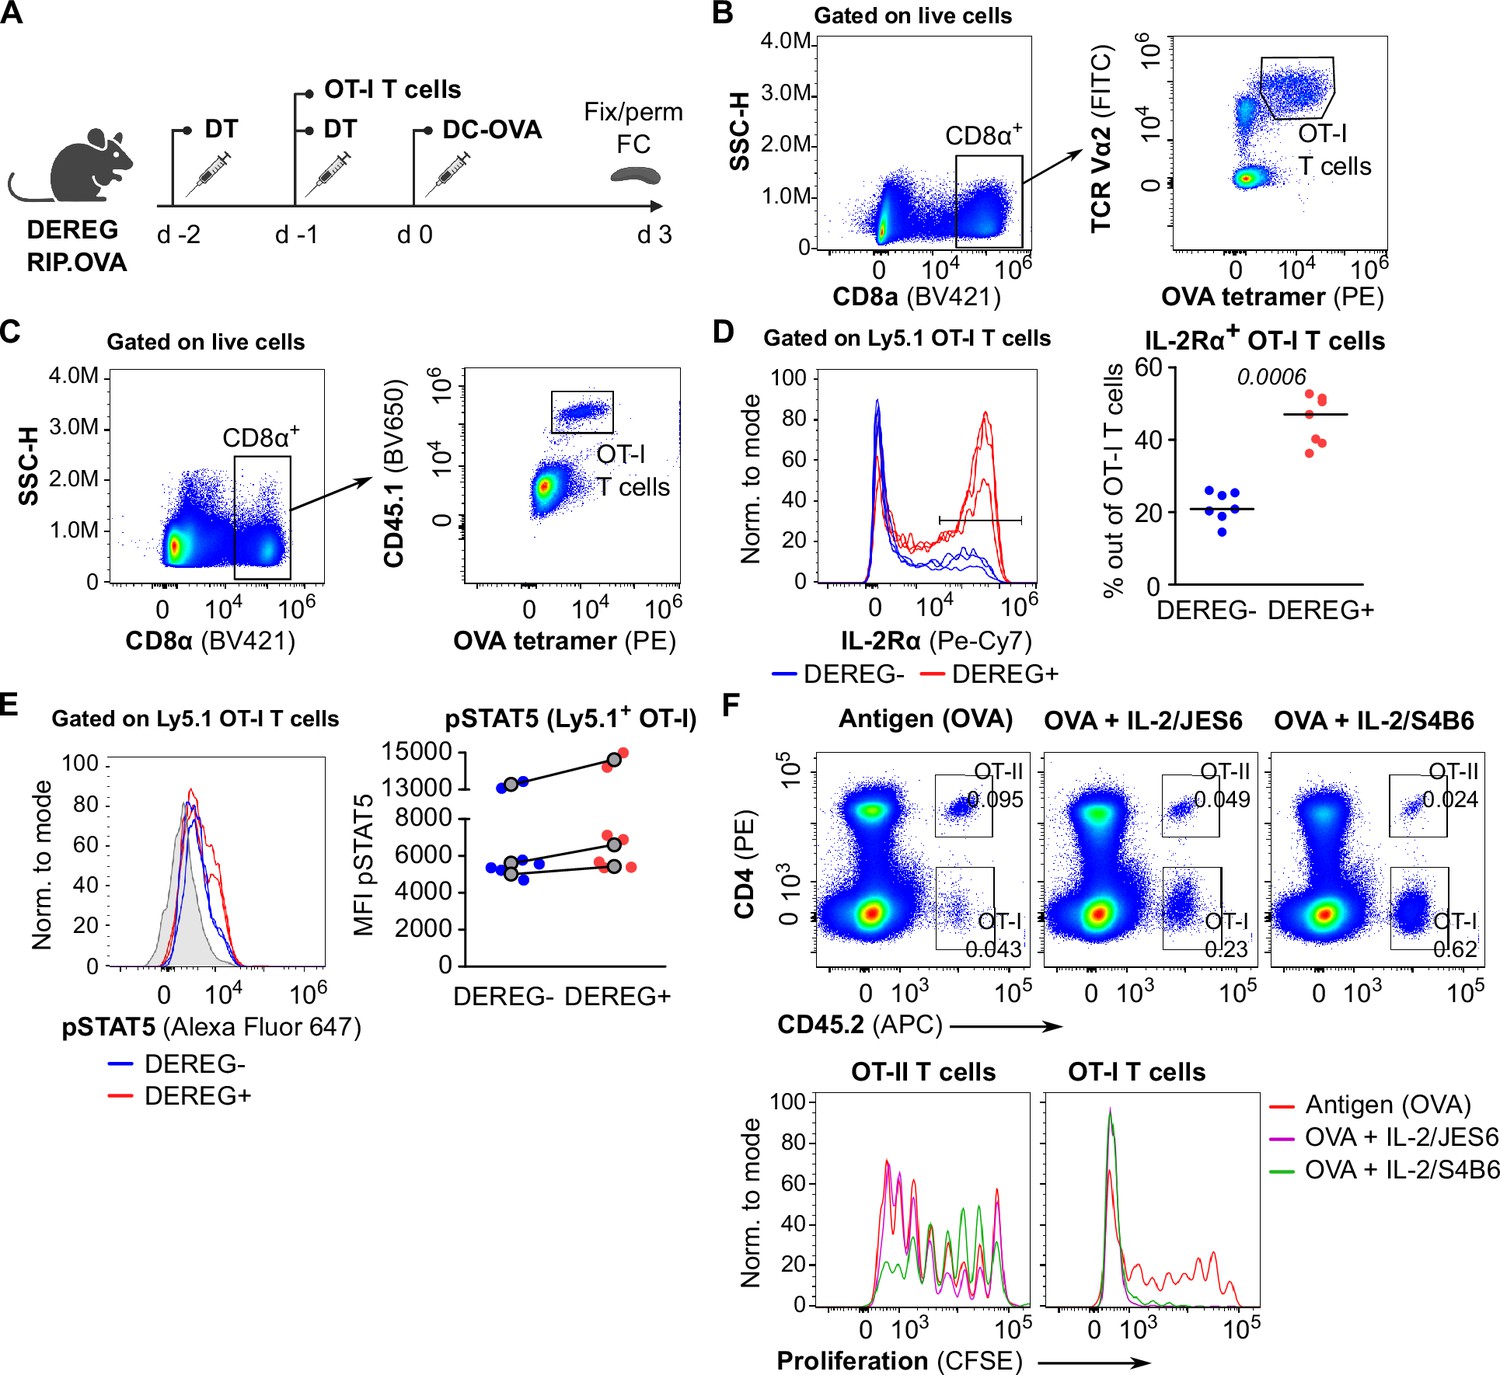
The role of IL-2 in the suppression of CD8+ T cells by Tregs.
(A) Scheme of the experiments described in Figure 4A–C and B-E. (B) Gating strategy for the experiment shown in Figure 4A. (C–E) The experiment described in Figure 4A was modified by using congenic Ly5.1 OT-I T cells for the adoptive transfer. (C) The gating strategy. (D) IL-2Rα expression on OT-I Ly5.1 T cells. Left: a representative experiment out of three in total. Right: percentage of IL-2Rα+ cells among OT-I Ly5.1 T cells, n = 7 mice per group. Statistical significance was calculated by two-tailed Mann–Whitney test, p-value is shown in italics. Median is shown. (E) pSTAT5 expression in OT-I Ly5.1 T cells. Left: a representative experiment out of three in total. Right: geometric mean fluorescence intensity (MFI) of anti-pSTAT5-Alexa Fluor 647 on Ly5.1 OT-I T cells. Mean of MFI values for each genotype per experiment are shown as a gray dots. Lines connect data from corresponding experiments. n = 7 mice per group. (F) OT-I CD8+ and OT-II CD4+ T cells (both Ly5.2) were labeled with CFSE and adoptively transferred into Ly5.1 mice as a mixture (0.75 × 10⁶ CD8+ OT-I+1.5 × 10⁶ CD4+ OT-II T cells), followed by the administration of OVA protein with or without IL-2ic (IL-2/S4B6 or IL-2/JES6). On day 5 post-immunization, spleens were collected and analyzed by flow cytometry. Top: representative staining showing CD45.2+ OT-I (CD4-) and OT-II (CD4+) T cells among viable cells. Bottom: proliferation is indicated by the CFSE dilution. Representative histograms for OT-I and OT-II T cells.
Figure 5 with 1 supplement
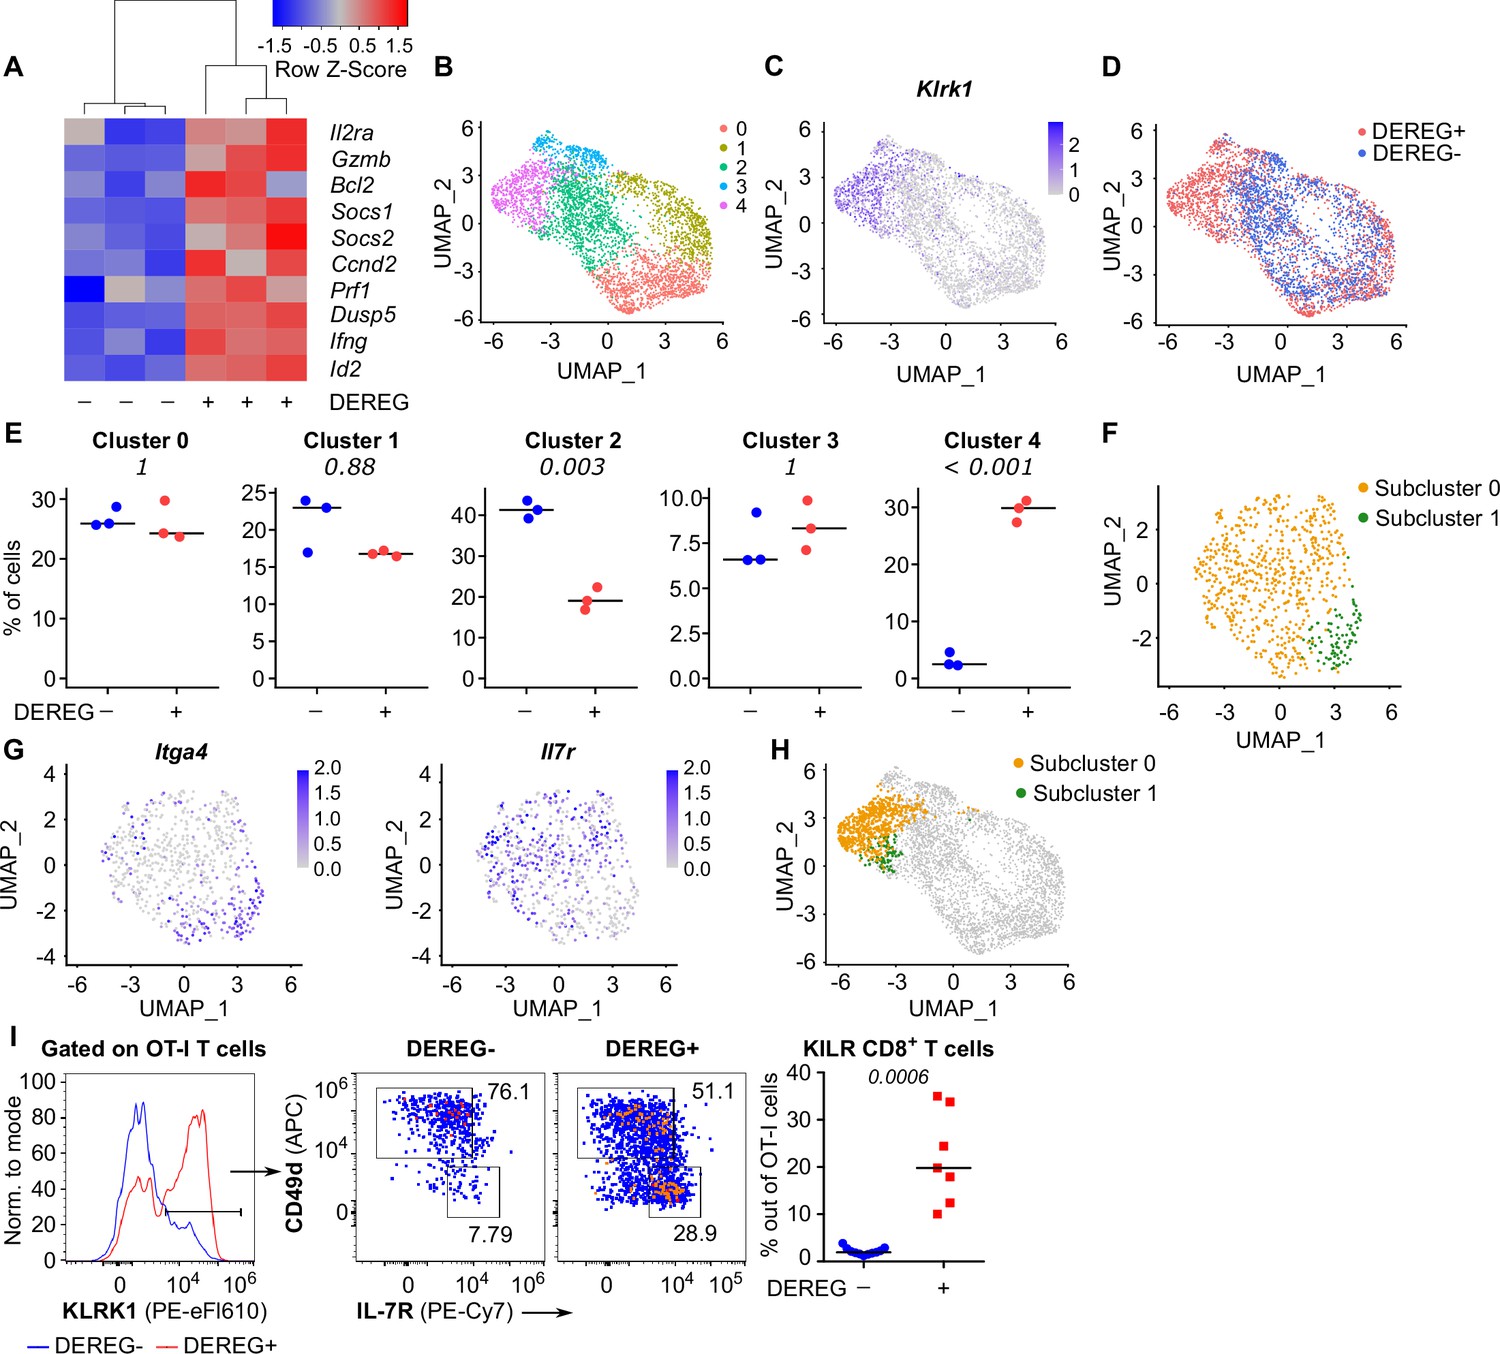
Tregs block the formation of KLRK1+ IL-7R+ cytotoxic T cells.
(A–E) Ly5.1 OT-I T cells were adoptively transferred into Treg-depleted DEREG+ RIP.OVA and control DEREG- RIP.OVA mice (n = 3 mice per group). The next day, mice were immunized with DC-OVA. On day 3 post-immunization, spleens were isolated and OT-I T cells were FACS sorted as Ly5.1+ CD8+ cells, and analyzed via scRNAseq. (A) A heat map showing the relative expression of canonical IL-2-responsive genes. Each column represents one mouse. (B–D) UMAP projection of the individual OT-I T cells based on their gene expression profile. (B) The colors indicate individual clusters revealed by unsupervised clustering. (C) The intensity of the blue color indicates the level of Klrk1 expression in individual cells. (D) The origin of the cells (DEREG+ or DEREG- mice) is indicated. (E) The percentage of cells assigned to specific clusters is shown for individual mice. Statistical significance was calculated by unpaired Student’s t-test with Bonferroni correction, p-value is shown in italics. Median is shown. (F–H) Cluster 4 was reanalyzed separately. (F) UMAP projection showing two subclusters identified by unsupervised clustering. (G) The intensity of the blue color indicates the level of expression of Itga4 or Il7r in individual cells. (H) Projection of subclusters 0 and 1 on the original UMAP plot. (I) Ly5.1 OT-I T cells (5× 10⁴) were adoptively transferred into Treg-depleted DEREG+ RIP.OVA mice (n = 7) or DEREG- RIP.OVA mice (n = 11). The next day, mice were immunized with DC-OVA. On day 3 post-immunization, spleens were collected and analyzed by flow cytometry. Left: a representative experiment out of three in total is shown. KLRK1+ subset of Ly5.1 OT-I T cells was divided into two gates based on their expression of CD49d and IL-7R. Percentage of KILR effector T cells, defined as KLRK1+ IL-7R+ CD49d- cells out of OT-I T cells is shown. Statistical significance was calculated by two-tailed Mann–Whitney test, p-value shown in italics. Median is shown.
Figure 5—figure supplement 1
The comparison of the differentiation of CD8+ T cells primed in the presence and absence of Tregs in vivo.
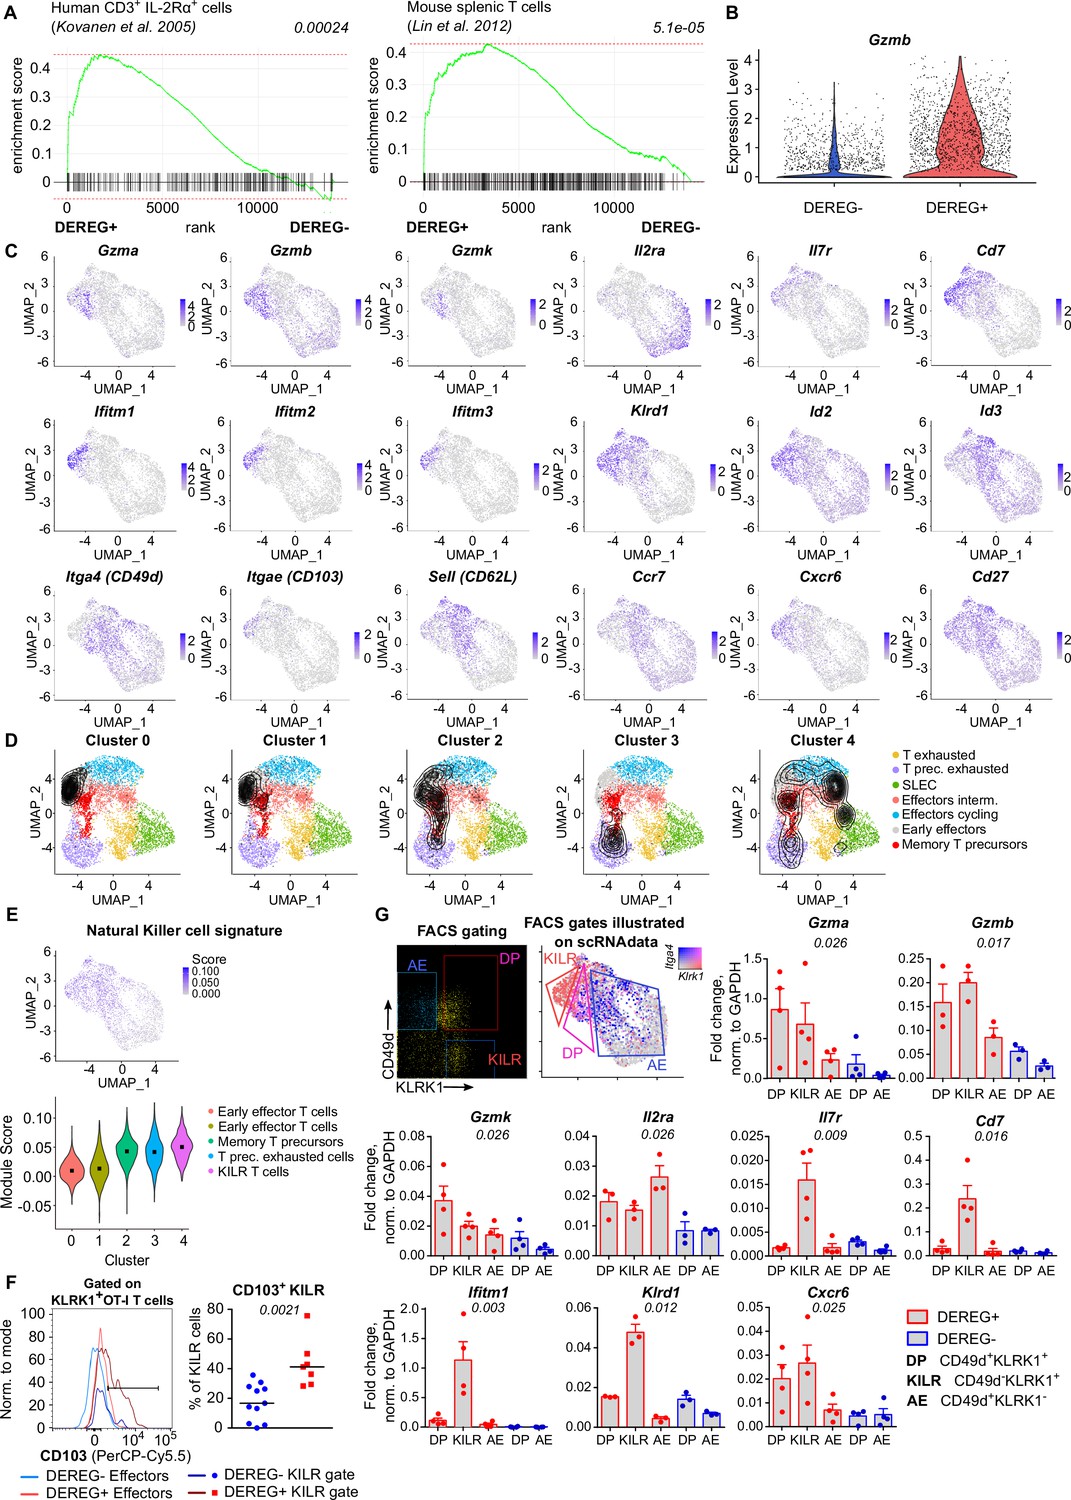
(A–E) Additional analysis for the scRNAseq experiment shown in Figure 5A–H. (A) Gene set enrichment analyses comparing the ranked expression of IL-2-induced genes in DEREG+ versus DEREG- OT-I T-cell samples. The list of IL-2-responsive genes is based on the indicated publications (Shinkai et al., 1992; Barnden et al., 1998). p-value (shown in italics) is estimated based on an adaptive multi-level split Monte Carlo scheme. (B) Violin plot indicating the expression of Gzmb in OT-I T cells primed in DEREG- and DEREG+ mice. (C) The intensity of the blue color indicates the level of expression of indicated genes in individual cells. (D) Projection of clusters of primed OT-I T cells (Figure 5B) on the UMAP visualization of CD8+ T cells subsets formed during an antiviral response using TILPRED algorithm. (E) NK cell signature was calculated for each cluster. Top: the intensity of the blue color indicates the level of expression of NK signature genes. Bottom: violin plot showing NK cell signature score calculated for each cluster. (F) Additional results of the experiments described in Figure 5I. CD103 expression on KLRK1+ CD49d+ IL-7R- T cells (Effector) and KLRK1+ CD49d- IL-7R+ T cells (KILR). Left: a representative histogram. Right: percentage of CD103+ cells among cells falling into KILR gate. DEREG- n = 11, DEREG+ n = 7. Median is shown. Statistical significance was calculated using two-tailed Mann–Whitney test, p-value is shown in italics. (G) Ly5.1 OT-I T cells (5 × 10⁴) were transferred into Treg-depleted DEREG+ RIP.OVA mice and DEREG- RIP.OVA mice. The next day, mice were immunized with DC-OVA. On day 3 post-immunization, three populations of splenic OT-I T cells (identified as Ly5.1+ CD8+) were FACS-sorted as indicated: CD49d+ KLRK1- antigen-experienced (AE), CD49d+ KLRK1+ double-positive (DP), and CD49d- KLRK1+ (KILR). The correspondence of the FACS gates to scRNAseq clusters is shown. Sorted cells were analyzed via RT-qPCR. The expression of indicated genes was normalized to Gapdh. Mean + SEM is indicated. Four independent experiments. Statistical significance was calculated by Kruskal–Wallis test, p-value is shown in italics.
Figure 6 with 1 supplement
KILR CD8+ T cells induced by the stimulation with the cognate antigen and high levels of IL-2 show superior cytotoxicity.
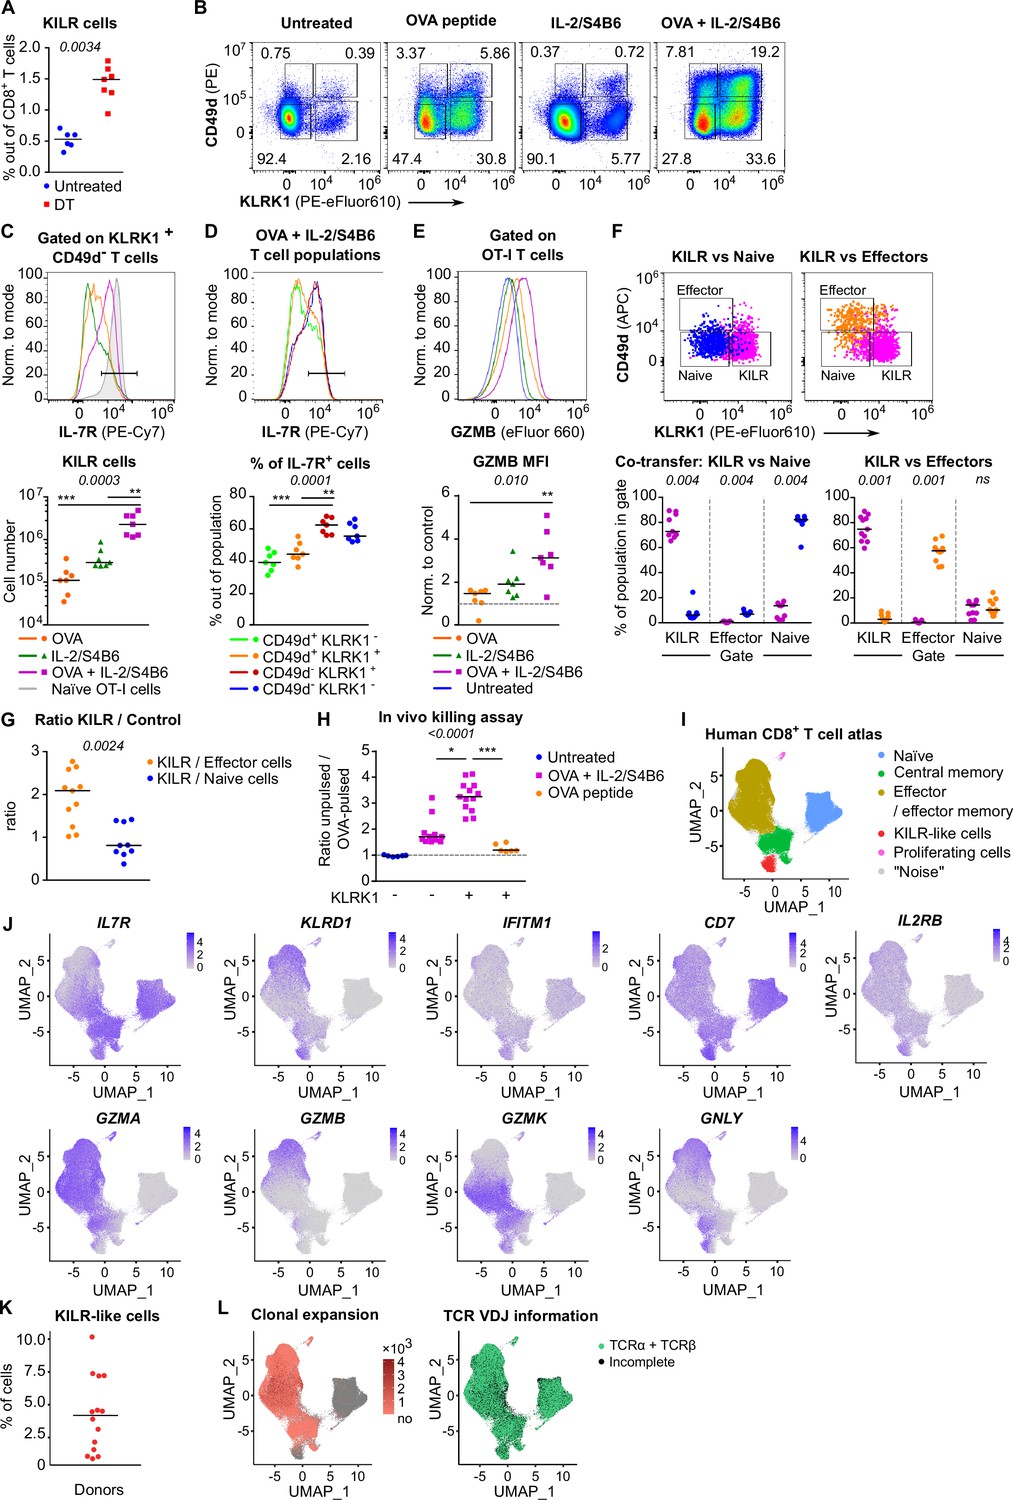
(A) DEREG+ RIP.OVA mice were treated with DT in order to deplete Tregs on days 0 and 1. On day 3, spleens were collected and analyzed by flow cytometry. Percentage of KILR effector T cells defined as KLRK1+ CD49d- IL-7R+ among CD8+ T cells is shown. Untreated n = 6, DT n = 7. Median is shown. (B–E) OT-I Rag2-/- mice were treated with OVA peptide (single dose on day 0, n = 7) and/or IL-2/S4B6 (three doses, days 0, 1 and 2, n = 7 mice per group) or left untreated (n = 6). Spleens were collected and analyzed by flow cytometry on day 3. (B) Four populations of OT-I T cells were identified based on their expression of KLRK1 and CD49d. A representative experiment out of three in total. (C) Top: IL-7R expression on KLRK1+ CD49d- OT-I T cells from mice treated with OVA and/or IL-2/S4B6. Expression of IL-7R on naïve OT-I T cells is shown as a positive control. Representative staining. Bottom: number of KILR effector T cells, defined as KLRK1+ CD49d- IL-7R+ OT-I T cells. Median is shown. (D) IL-7R expression in CD49d+ KLRK1-, CD49d+ KLRK1+, CD49d- KLRK1+, and CD49d- KLRK1- OT-I T cells from mice treated with OVA + IL-2/S4B6. Top: a representative histogram. Bottom: percentage of IL-7R+ cells among OT-I T cells in indicated populations. Median is shown. (E) GZMB levels in OT-I T cells. Top: a representative histogram. Bottom: geometric mean fluorescence intensity (MFI) of anti-GZMB-eFluor 660 antibody on OT-I T cells. Obtained values were normalized to the average of MFI of untreated samples in each experiment (=1). Median is shown. (F–G) OT-I Rag2-/- and Ly5.1 OT-I Rag2-/- mice were treated with OVA peptide (day 0) and IL-2/S4B6 (three doses, days 0–2). On day 3, KILR (KLRK1+ CD49d-), naïve (KLRK1- CD49d-), and effector cells (KLRK1- CD49d+) were sorted. Recipient Cd3e-/- mice received a mix of KILR and naïve (n = 9), or KILR and effector (n = 11) congenic cells (1:1 ratio, 400 × 103 or 500 × 103 cells in total). On day 7, spleens of the recipient mice were analyzed by flow cytometry. Two independent experiments were performed. (F) Percentage of cells that kept their initial phenotype was determined. Top: cells sorted as KILR (magenta), naïve (blue), and effector cells (orange) fall into corresponding gates. Representative dot plot. Bottom: percentage of cells that fall into the KILR, effector, and naïve gate, after adoptive co-transfer. Median is shown. (G) Ratio of KILR cells to co-transferred control cells. Median is shown. (H) OT-I Rag2-/- mice were treated with OVA peptide (day 0), and/or IL-2/S4B6 (days 0, 1, and 2) or left untreated. Spleens were collected on day 3. KLRK1+ CD8+ or KLRK1- CD8+ cells were sorted and adoptively transferred into recipient RIP.OVA mice, which have received a mixture of target OVA-pulsed CTV-loaded and unpulsed CFSE-loaded splenocytes from Ly5.1 mice at ~1:1 ratio earlier on the same day. The next day, the spleens were analyzed for the presence of Ly5.1 donor cells by flow cytometry. Ratio of unpulsed (CFSE+) to OVA pulsed (CTV+) target cells was determined and normalized to control recipients which did not receive OT-I T cells (=1). KLRK1- (Untreated) n = 6, KLRK1- (OVA + IL-2/JES6) n=11, KLRK1+ (OVA + IL-2/JES6) n = 13, KLRK1+ (OVA peptide) n = 6. Four independent experiments. Median is shown. (I–L) Human CD8+ T-cell atlas was generated by integrating 14 scRNAseq data sets from blood of healthy donors. The gene expression data after the removal of MAIT cells were projected into a 2D UMAP plot. (I) The assignment of individual cells to clusters identified by unsupervised clustering. Individual clusters were matched to established CD8+ T cell subsets based on the expression of their signature markers (see Figure 6—figure supplement 1H). (J) The intensity of the blue color corresponds to the level of expression of indicated genes in individual cells. (K) The percentage of CD8+ T cells assigned to the KILR-like CD8+ T-cell cluster in individual donors (n = 14). Median is shown. (L) Left: clonally expanded T cells were identified based on their TCRαβ VDJ sequences. The intensity of the red color indicates the size of individual clones. Right: T cells with recovered complete TCRαβ VDJ information are shown in green. Statistical significance was calculated by two-tailed Mann–Whitney test (A, G), Wilcoxon matched-pairs signed rank test (F), or Kruskal–Wallis test (C, D, E, H) for multiple groups comparison (p-value is shown in italics) with Dunn’s post-test (*<0.05, **<0.01, ***<0.001).
Figure 6—figure supplement 1
The characterization of IL-2-induced KILR CD8+ T cells and human blood KILR-like T cells.
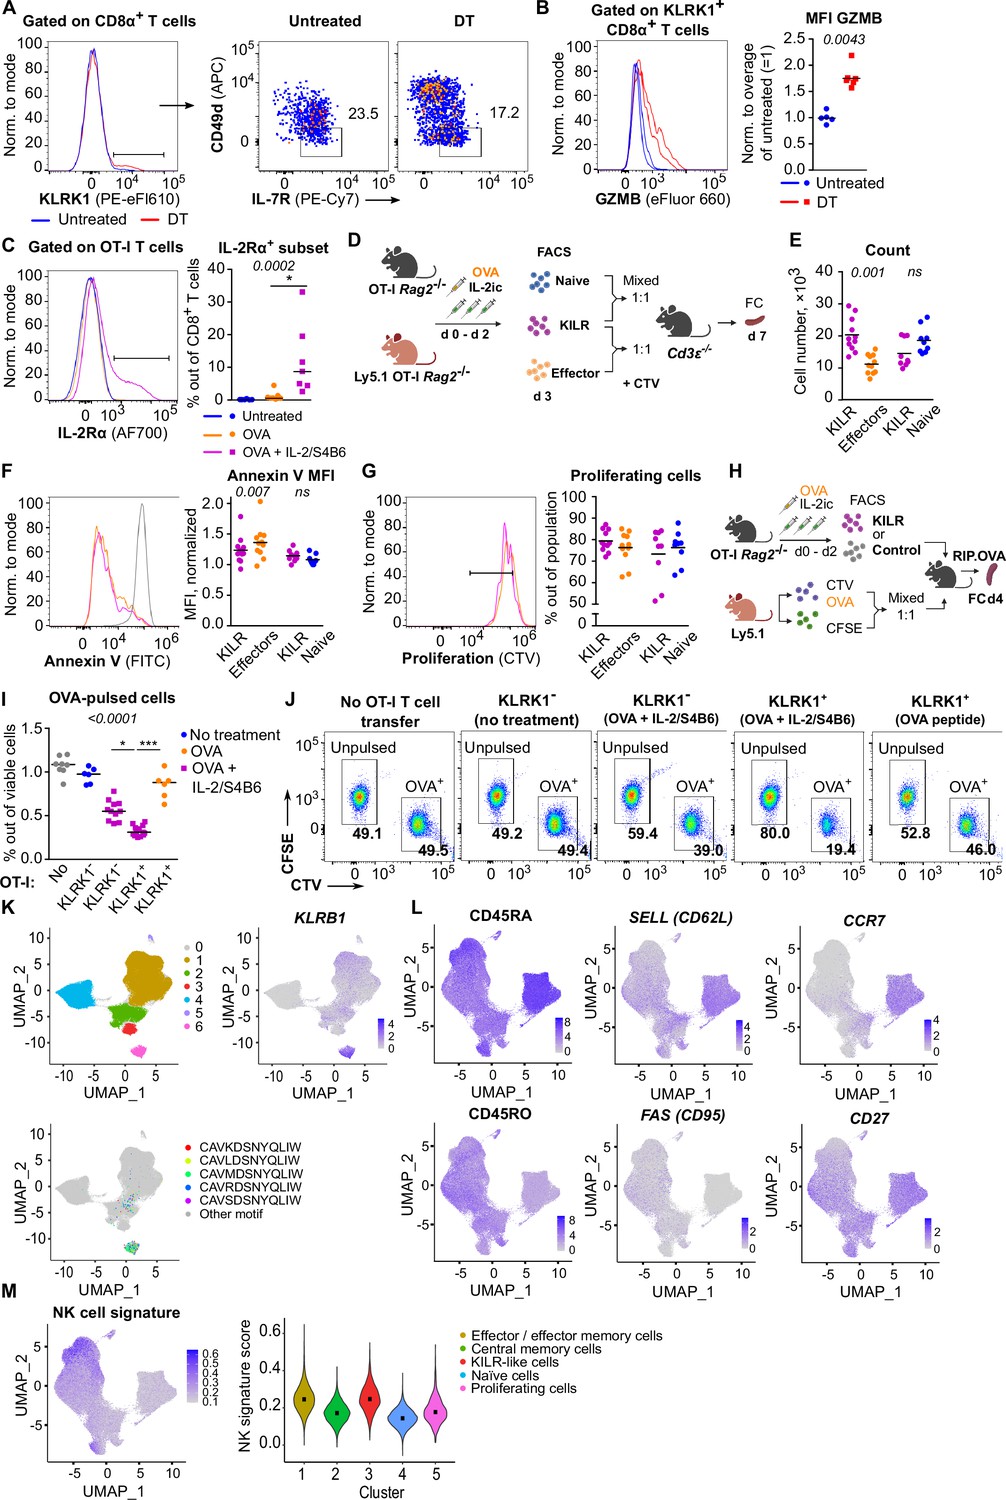
(A) Representative experiment out of three in total for the data shown in Figure 6A. (B) GZMB levels in CD8+ T cells from the experiment shown in Figure 6A. Left: a representative histogram. Right: geometric mean fluorescence intensity (MFI) of anti-GZMB-eFluor 660 antibody on CD8+ T cells was determined. Obtained values were normalized to the average of MFI of untreated samples in each experiment (=1). DT treated n = 6, untreated n = 5 mice. Statistical significance was calculated by two-tailed Mann–Whitney test (p-value is shown in italics). Median is shown. (C) Additional results of the experiments described in Figure 6B–E. IL-2Rα expression on OT-I T cells from mice treated with OVA, OVA + IL-2/S4B6, and untreated control. Statistical significance was calculated by Kruskal–Wallis test (p-value is shown in italics) with Dunn’s multiple comparison post-test (*<0.05). Median is shown. (D–G) Additional data for the experiment shown in Figure 6F and G. (D) Scheme of the experiment. KILR T cells were induced in OT-I Rag2-/- and congenic Ly5.1 OT-I Rag2-/- mice via IL-2/S4B6 and OVA. Three populations of CD8+ OT-I T cells were FACS sorted as: naive (KLRK1- CD49d-), KILR (KLRK1+ CD49d-), effector (KLRK1- CD49d+). KILR cells were mixed with one of the control populations in 1:1 ratio, stained with CTV proliferation dye, and injected to Cd3e-/- recipient mouse. Each mouse got 400 × 103, or 500 × 103 cells in total in two independent experiments (KILR + Effector n = 11, KILR + Naïve n = 9). On day 7 of the experiment (3 days post transfer) spleens of the recipients were analyzed by flow cytometry. (E) Number of cells originating from transferred KILR, effector, and naïve cells, per spleens of recipient. Mean is shown. (F) Annexin V staining, representative histogram (positive control in gray) on left, normalized geometric MFI on right. Statistical significance was calculated by Wilcoxon matched-pairs signed rank test (p-value is shown in italics), ns, not significant (>0.05). Mean is shown. (G) Proliferating cells, gated as CTVlow cells (two and more divisions). Left: representative staining. Right: % of proliferating cells out of total cell population. Mean is shown. (H–J) Additional data for the experiment shown in Figure 6H. (H) Scheme of the experiment. OT-I Rag2-/- mice were treated with OVA peptide (day 0), and/or IL-2/S4B6 (days 0, 1, and 2) or left untreated. On day 3, KLRK1+ CD8+ or KLRK1- CD8+ OT-I T cells were FACS sorted and transferred to recipient RIP.OVA mice, which have received a mixture of OVA-pulsed CTV-loaded and unpulsed CFSE-loaded target cells obtained from Ly5.1 mice at ~1:1 ratio earlier the same day. Spleens were analyzed by flow cytometry on day 4 of the experiment. (I) Percentage of OVA-pulsed target cells out of all viable splenocytes. No OT-I T cell transfer n = 8, KLRK1- (no treatment) n = 6, KLRK1- (OVA + IL-2/JES6) n = 11, KLRK1+ (OVA + IL-2/JES6) n = 13, KLRK1+ (OVA peptide) n = 6. (J) A representative experiment out of four in total. Statistical significance was calculated by Kruskal–Wallis test (p-value is shown in italics) with Dunn’s multiple comparison post-test (*<0.05, ***<0.001). Median is shown. (K) Identification of MAIT cells in the human CD8+ T cell atlas. Top left: UMAP projection. Individual cells are assigned to individual clusters based on unsupervised clustering. Cluster 6 corresponds to MAIT cells. Top right: the intensity of the blue color indicates the level of KLRB1 expression (a MAIT cell marker) in individual cells. Bottom: cells expressing five most abundant semi-invariant MAIT cell-specific receptor-alpha (TCRα) are shown. (L) The intensity of the blue color indicates the expression level of selected genes based on the detection using hash-tagged antibodies (CD45RA and CD45RO) or transcripts in human CD8+ T cell atlas after the removal of MAIT cells. (M) NK cell signature was calculated for each cluster of the human CD8+ T cell atlas. Left: the intensity of the blue color indicates the level of expression of NK signature genes. Right: violin plot showing NK cell signature score calculated for each cluster.
Figure 7 with 1 supplement
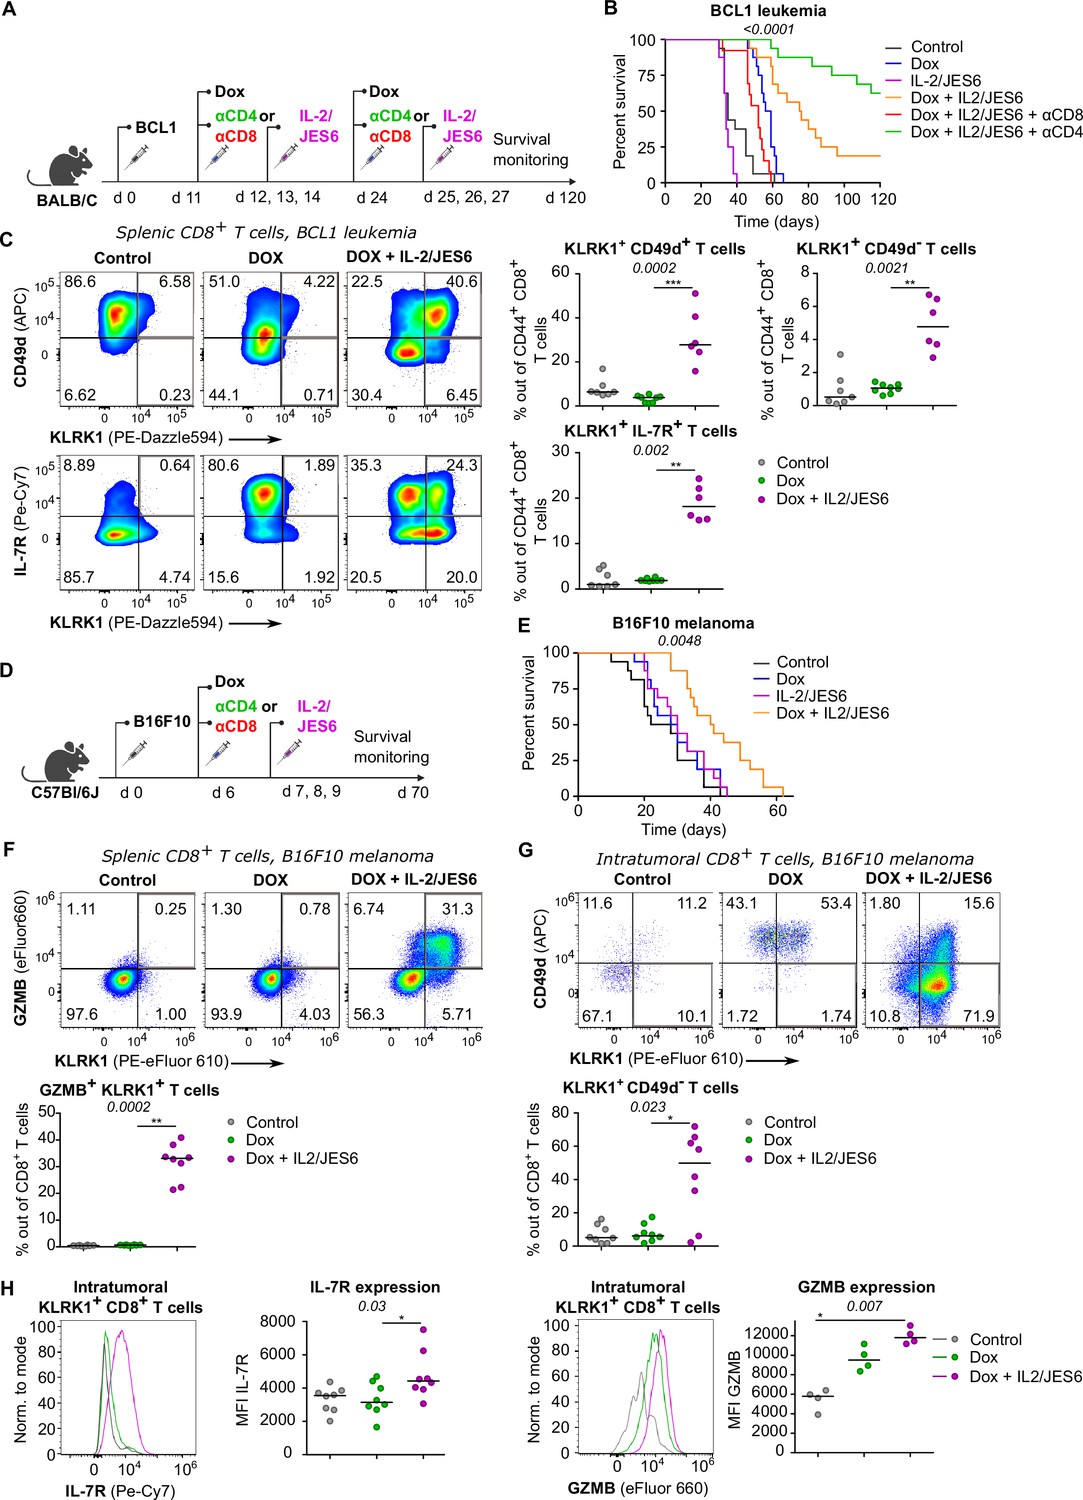
A combined treatment of IL-2/JES6 immunocomplexes and chemotherapy hampers the tumor growth and induces KILR CD8+ T cells.
(A–C) On day 0, BALB/C mice were inoculated with BCL1 leukemia cells. On days 11 and 24 post inoculation, mice received doxorubicin (Dox), with or without anti-CD4 or anti-CD8 depletion mAbs. On three consecutive days, mice were treated with IL-2/JES6. (A) Scheme of the experiment. (B) Survival curves. n = 16 mice per group in two independent experiments with the exception of “Dox + IL-2/JES6 + αCD8” conditions where three mice in the second experiment did not tolerate anti-CD8 administration for unknown reasons and were removed. (C) On day 30, spleens of mice from control (n = 7), Dox-treated (n = 8), and Dox + IL-2/JES6-treated (n = 6) groups were collected and analyzed by flow cytometry. Left: expression of KLRK1, CD49d, and IL-7R on CD44+ CD8+ T cells. Representative staining. Right: percentage of KLRK1+ CD49d-, KLRK1+ CD49d+, and KLRK1+ IL-7R+ cells out of CD44+ CD8+ T cells. Two independent experiments. (D–H) On day 0, C57Bl/6J mice were inoculated with B16F10 melanoma cells. On day 6, mice received doxrubicin (Dox). On three consecutive days, mice were treated with IL-2/JES6. (D) Scheme of the experiment showing also the eventual treatment with anti-CD4 or anti-CD8 depletion mAb relevant for Figure 7—figure supplement 1B. (E) Survival curves. n = 16 mice per group in two independent experiments. (F–H) On day 11, spleens and tumors of mice from control, Dox-treated, and Dox + IL-2/JES6-treated groups (n = 8 per group) were collected and analyzed by flow cytometry. Two independent experiments. (F) Top: expression of KLRK1 and granzyme B on splenic CD8+ T cells. Representative dot plot. Bottom: percentage of KLRK1+ GZMB B+ cells out of total CD8+ T cells. (G) Top: expression of KLRK1 and CD49d on intratumoral CD8+ T cells. Representative dot plot. Bottom: percentage of KLRK1+ CD49d- cells out of total CD8+ T cells. (H) IL-7R and GZMB expression on intratumoral KLRK1+ CD8+ T cells. Representative histograms and geometric mean fluorescence intensity (MFI) are shown. Statistical significance was calculated by log-rank (Mantel–Cox) test (survival B, E), or Kruskal–Wallis test (C, F–H) (p-value is shown in italics) with Dunn’s post-test (*<0.05, **<0.01, ***<0.001). Median is shown.
Figure 7—figure supplement 1
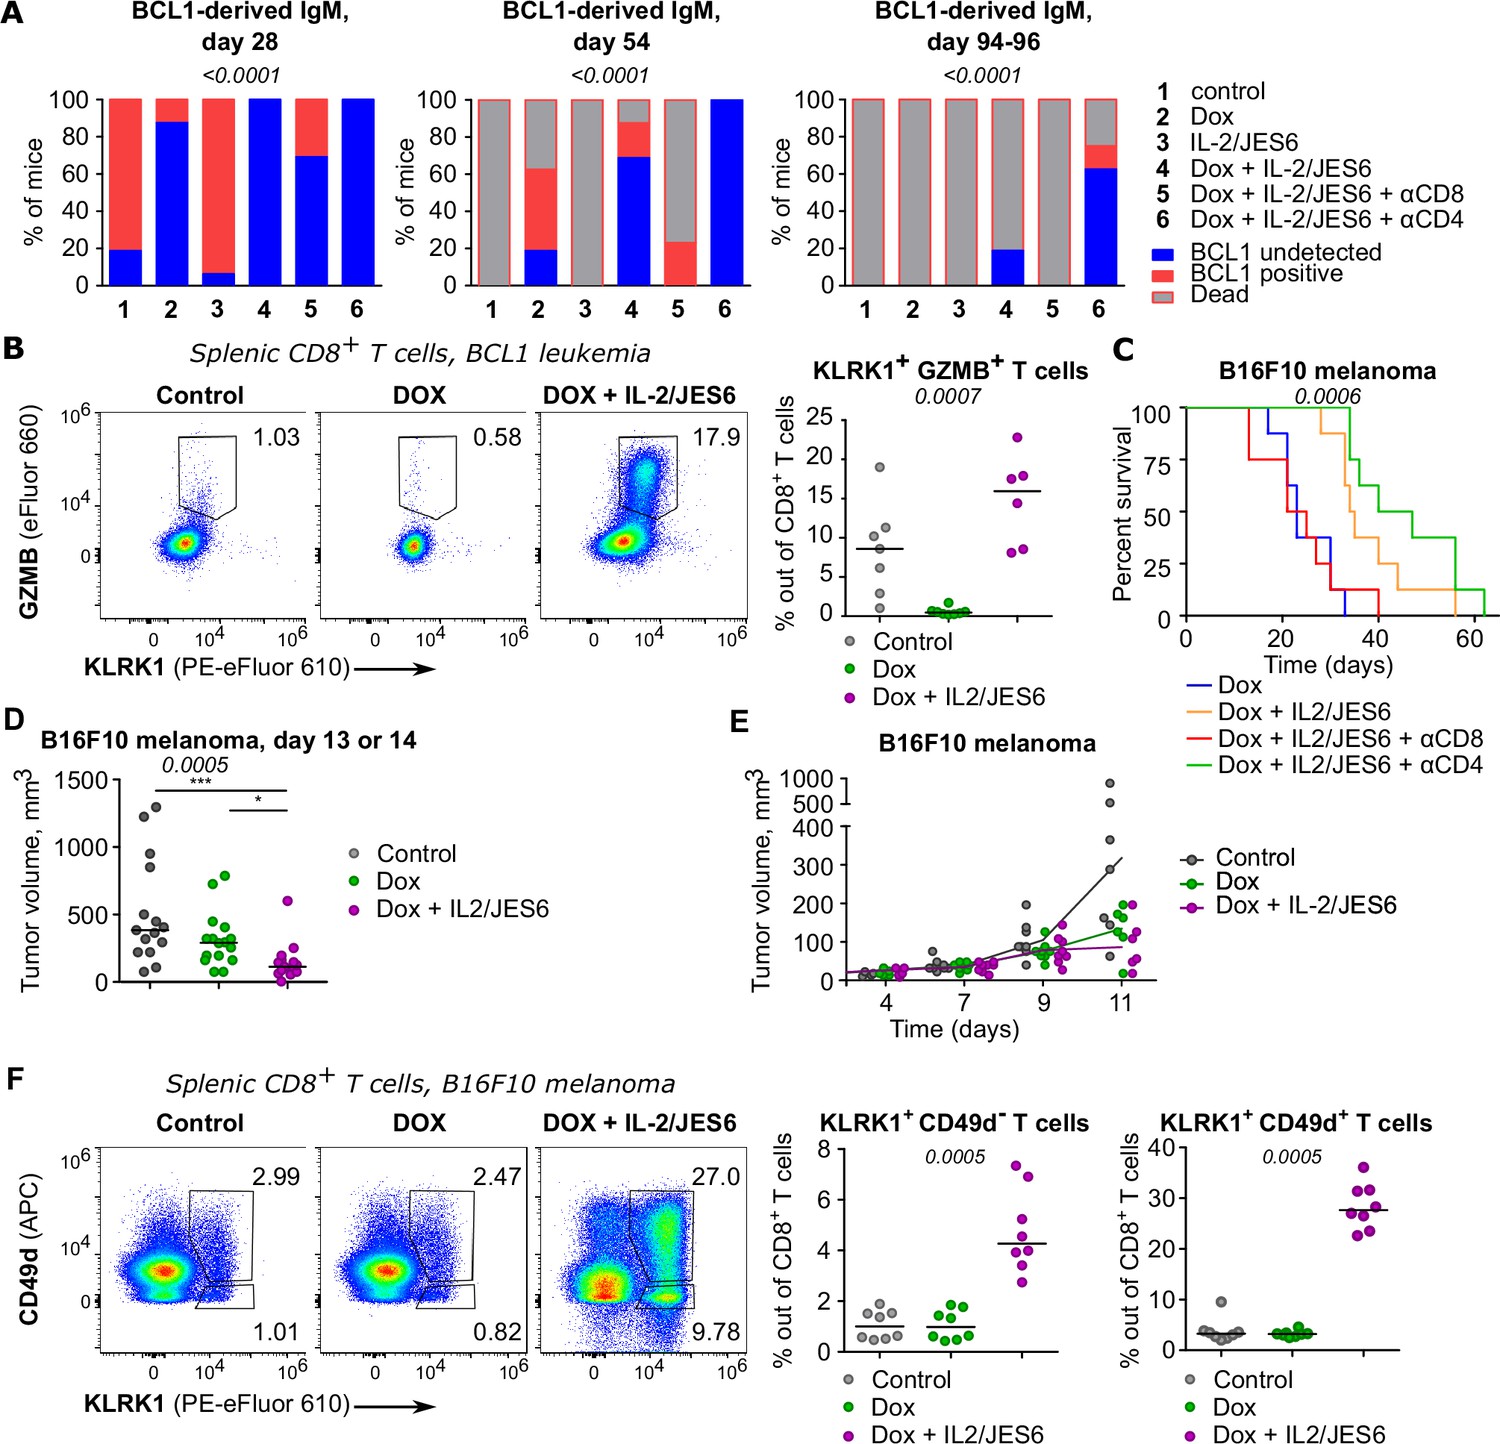
The effects of combined treatment of tumor-bearing mice with IL-2/JES6 immunocomplexes and doxorubicine.
(A) In experiments described in Figure 7A and B, BCL1 IgM/IgD in the serum on days 28, 54, and 94–96 post tumor inoculation was detected by ELISA. n = 16 mice per group in two independent experiments with two exceptions: (i) 'Dox + IL-2/JES6 + αCD4' conditions on day 54 where the analysis failed for the second experiment and thus, n = 8 mice and (ii) control conditions on day 54, when one mouse was not analyzed for technical reasons and thus, n = 15. The statistical significance was calculated using chi-square test (two groups of the outcomes: mice with undetectable BCL1 vs. mice with detectable BCL1 or dead), p-value is shown in italics. (B) Addition data for the experiment shown in Figure 7C. Expression of KLRK1 and GZMB on splenic CD8+ T cells. Left: representative staining. Right: percentage of KLRK1+ GZMB+ cells out of total CD8+ T cells. Kruskal–Wallis test, p-value is shown in italics, median is shown. (C) On day 0, C57Bl/6J mice were inoculated with B16F10 melanoma cells. On day 6, mice received doxorubicin (Dox) with/without anti-CD4 or anti-CD8 depletion mAb. On three consecutive days, mice were treated with IL-2/JES6 (see scheme Figure 7D). Survival curves. n = 8 mice per group in one experiments. The data shown here partially overlap with data shown in Figure 7E. There were two experiments in total, but only the second experiment had the mouse groups with the depletion of CD8+ or CD4+ cells. Figure 7E shows pooled data for all conditions included in both experiments. Here, results from the second experiment are shown. Statistical significance was calculated by log-rank (Mantel–Cox) test (p-value is shown in italics). (D) Tumor volume recorded on day 13 or 14 in the experiments shown in Figure 7E. Kruskal–Wallis test (p-value is shown in italics) with Dunn’s multiple comparison post-test (*<0.05, ***<0.001), median is shown. Control n = 15, Dox n = 16, Dox + IL-2/JES6 n=15 in two independent experiments. (E) Tumor volume growth in the experiment shown in Figure 7F–H. On day 11, tumors were harvested for flow cytometry analysis. n = 8 per group in two independent experiments. (F) Addition data for the experiment shown in Figure 7F–H. Expression of KLRK1 and CD49d on splenic CD8+ T cells. Left: representative staining. Right: percentage of KLRK1+ CD49d- and KLRK1+ CD49d+ cells out of total CD8+ T cells. Kruskal–Wallis test (p-value is shown in italics), median is shown.
Author response image 1
Additional files
-
Supplementary file 1
Differentially expressed genes for all clusters shown in Figure 5B.
The used differential expression criteria were fold change above 2, minimum of 0.1 difference in the fraction of detection between each cluster and the rest of the cells and adjusted p-value<0.01. For each gene, the fractions of cells with at least one detected transcript in the tested cluster (pct.1) or among all other cells (pct.2) are listed. The columns 'p_val', 'avg_log2FC' and 'p_val_adj' show p-values (Mann–Whitney U test), log2 fold changes and adjusted p-values (Bonferroni correction).
- https://cdn.elifesciences.org/articles/79342/elife-79342-supp1-v2.zip
-
Supplementary file 2
Differentially expressed genes between the super-effector-like cell cluster and all the remaining cells in the human CD8+ atlas (after MAIT removal).
The used differential expression criteria were average fold change > 1.5 and adjusted p-value<0.01. For each gene, the fractions of super-effector-like cells (pct.1) or remaining cells (pct.2) with at least one detected transcript are listed. The columns 'p_val ', 'avg_log2FC' and 'p_val_adj' show p-values (Mann–Whitney U test), log2 fold changes and adjusted p-values (Bonferroni correction).
- https://cdn.elifesciences.org/articles/79342/elife-79342-supp2-v2.zip
-
MDAR checklist
- https://cdn.elifesciences.org/articles/79342/elife-79342-mdarchecklist1-v2.docx
Download links
A two-part list of links to download the article, or parts of the article, in various formats.
Downloads (link to download the article as PDF)
Open citations (links to open the citations from this article in various online reference manager services)
Cite this article (links to download the citations from this article in formats compatible with various reference manager tools)
Regulatory T cells suppress the formation of potent KLRK1 and IL-7R expressing effector CD8 T cells by limiting IL-2
eLife 12:e79342.
https://doi.org/10.7554/eLife.79342


