Integrative analysis of metabolite GWAS illuminates the molecular basis of pleiotropy and genetic correlation
- Department of Genetics, Stanford University School of Medicine, United States
- Herbold Computational Biology Program, Fred Hutchinson Cancer Research Center, United States
- Nightingale Health Plc, Finland
- Internal Medicine Research Unit, Pfizer Worldwide Research, Development and Medical, United States
- Department of Biology, Stanford University, United States
Figures
Figure 1
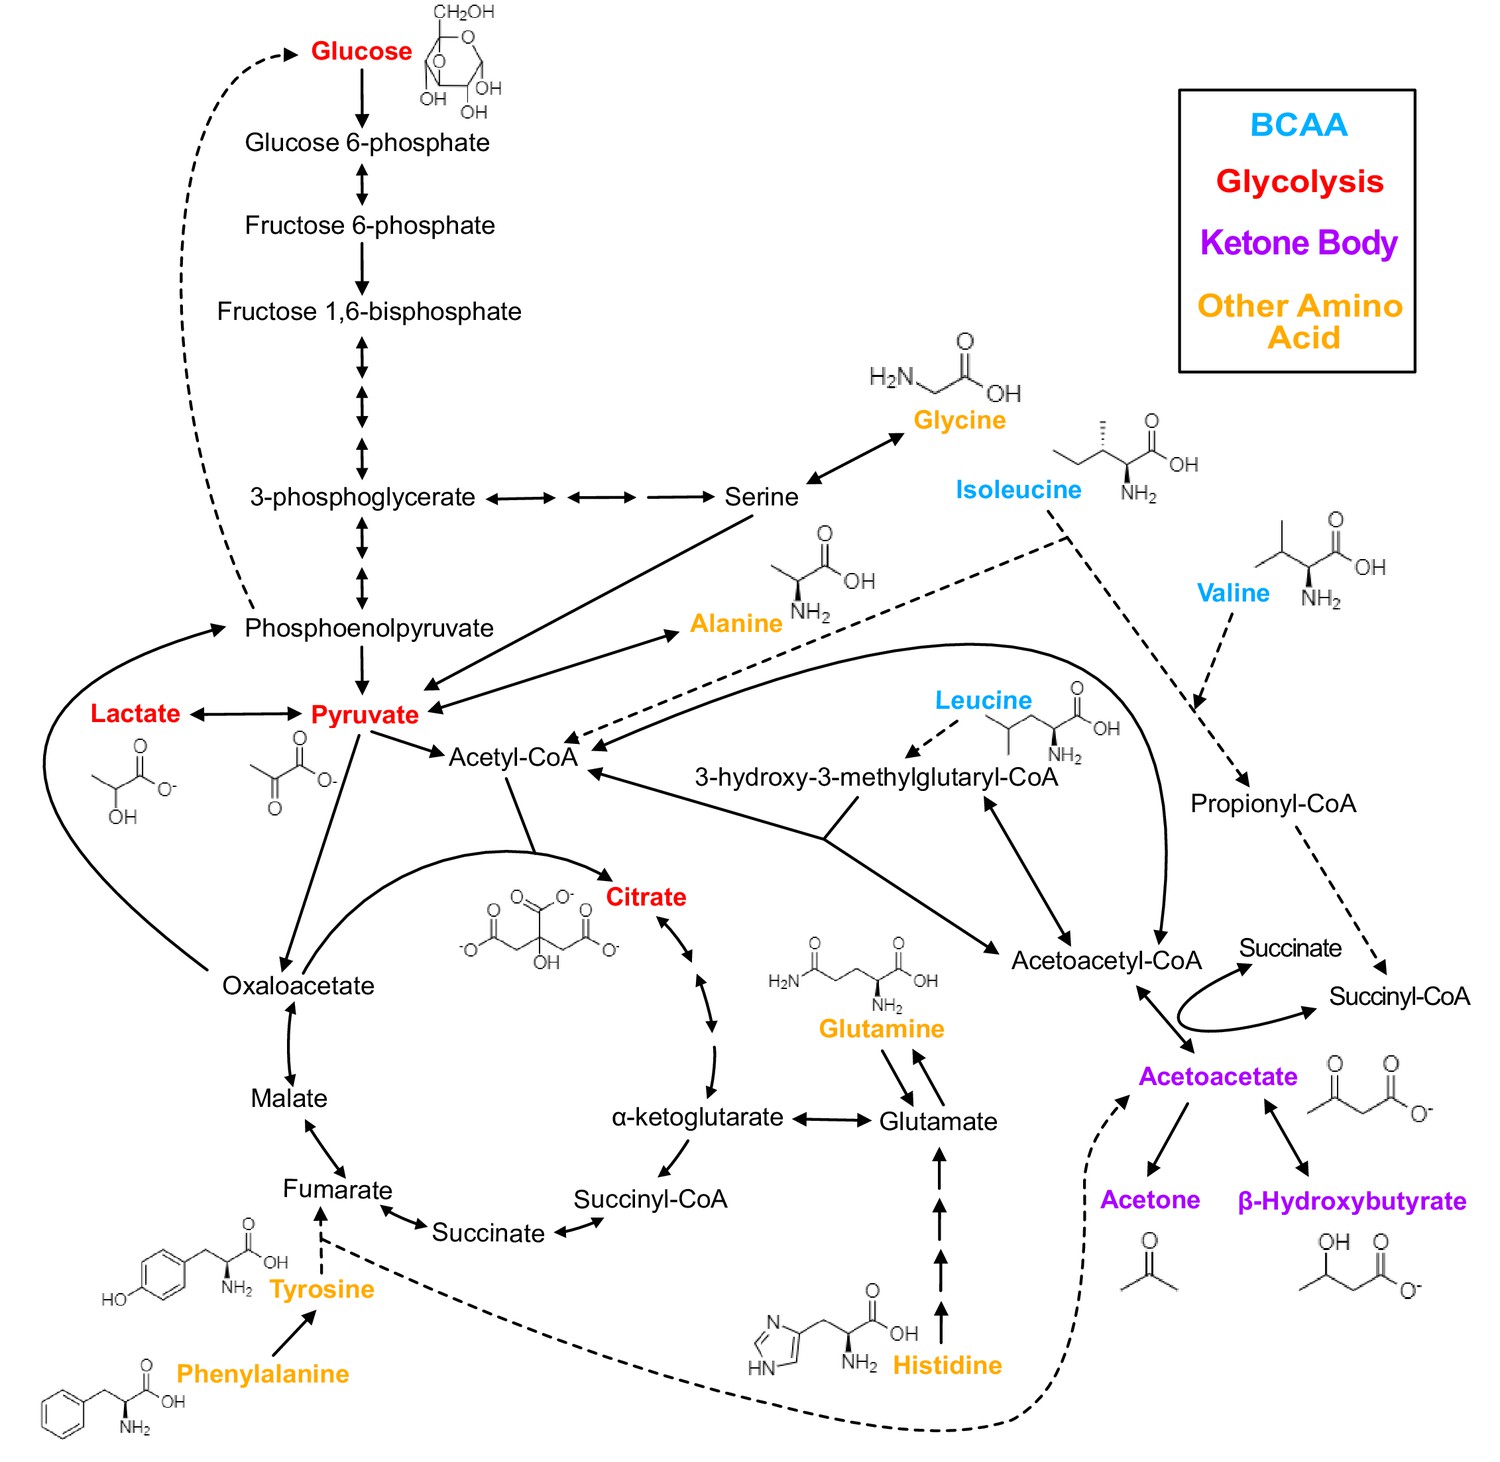
Biochemistry of relevant metabolites.
Pathway diagram and molecular structure of relevant metabolites, colored by their biochemical groups. The pathway diagram was curated from multiple resources (see ‘Methods’). All solid lines represent a single chemical reaction step. Dotted lines represent a simplification of multiple steps. For simplicity, only a subset of all the reactions each metabolite participates in is shown. Genes encoding the enzymes that catalyze the above chemical reactions are known and presented in Figure 3—figure supplement 1.
Figure 2 with 4 supplements
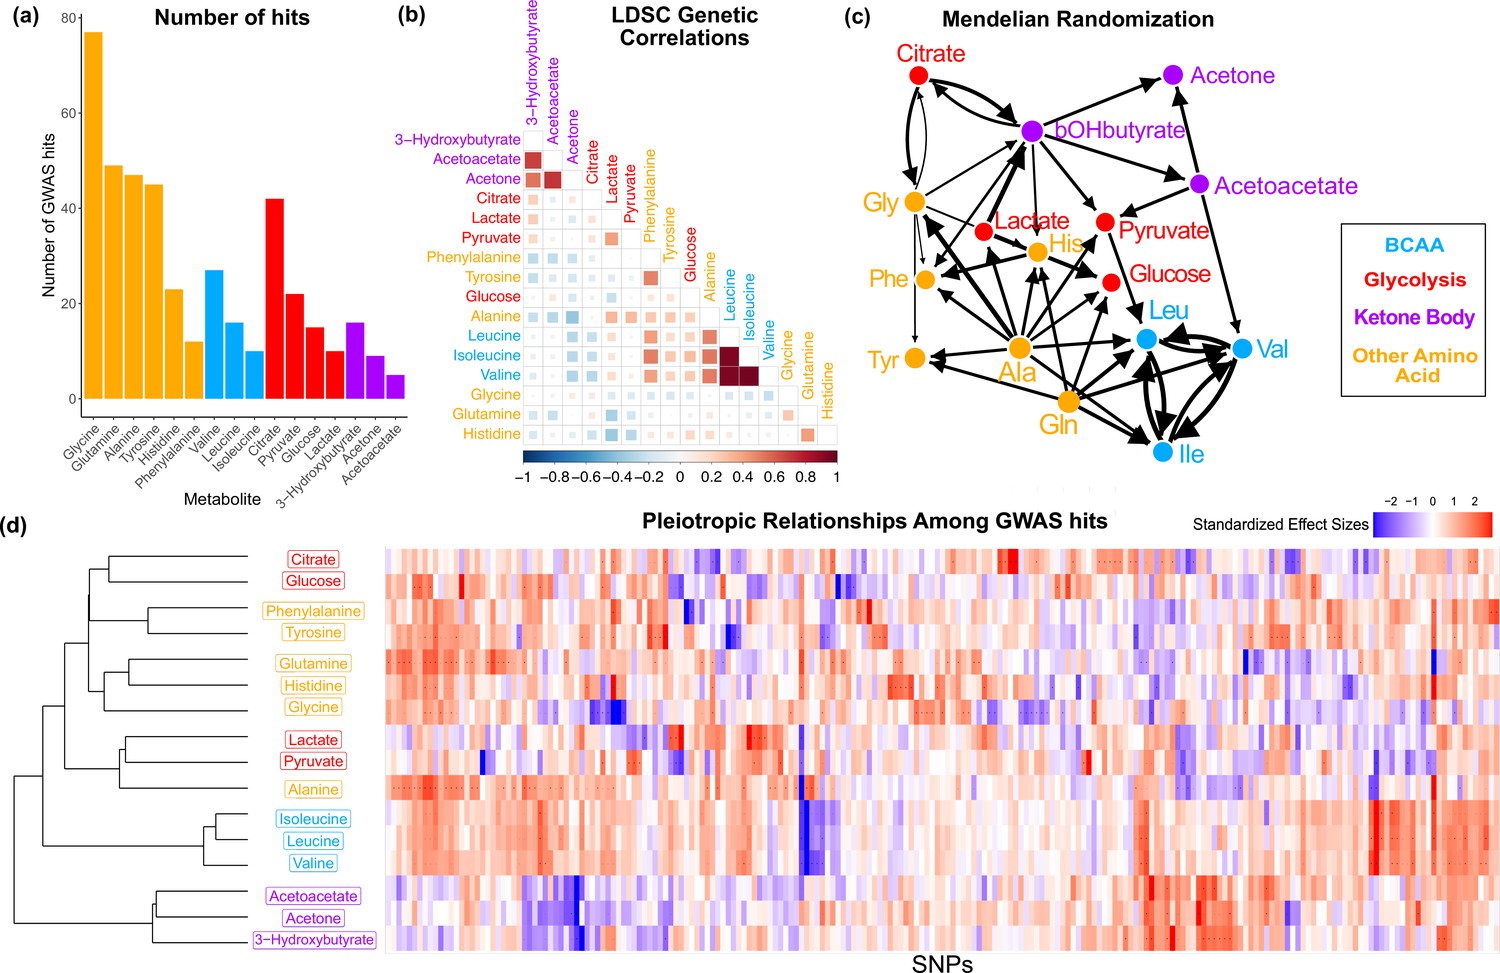
Overview genetic architecture of metabolites.
(a) Number of genome-wide association studies (GWAS) hits per metabolite. (b) Pairwise LDSC genetic correlations between the metabolites, clustered by genetic correlation. (c) Mendelian randomization weighted results between the metabolites. (d) Biclustered standardized effect size in each metabolite for the 213 metabolite GWAS hits. For visualization, effect sizes were divided by the standard error then inverse normal transformed and standardized. Each variant was aligned to have a positive median score across metabolites.
Figure 2—figure supplement 1

Manhattan plots.
Manhattan plots for each metabolite overlayed by biochemical group: (a) branched-chain amino acids, (b) glycolysis related metabolites, (c) other amino acids, and (d) ketones. Coloring reflects gene type assignment for where relevant.
Figure 2—figure supplement 2

HESS heritability plots.
Cumulative HESS heritability plots for the 16 metabolites, colored by biochemical group: (a) acetoacetate, (b) 3-hydroxybutyrate, (c) acetone, (d) citrate, (e) glucose, (f) pyruvate, (g) lactate, (h) isoleucine, (i) valine, (j) leucine, (k) alanine, (l) glutamine, (m) glycine, (n) histidine, (o) phenylalanine, (p) tyrosine.
Figure 2—figure supplement 3

Phenotypic correlation.
Correlation matrix of the residualized phenotype levels for the 16 metabolites. Metabolites are colored by biochemical group.
Figure 2—figure supplement 4

Quantile–quantile plots.
Quantile–quantile plots showing the observed -log10(p-value) from the 16 genome-wide association studies (GWAS) in each metabolite for the 213 metabolite GWAS Hits. The most significant trait for each SNP is excluded, and the plots are faceted by gene type. Note that for plotting purposes, p-values were set to a minimum of 1e-300. Variants with quantile <0.005 are labeled with their gene annotation.
Figure 3 with 2 supplements
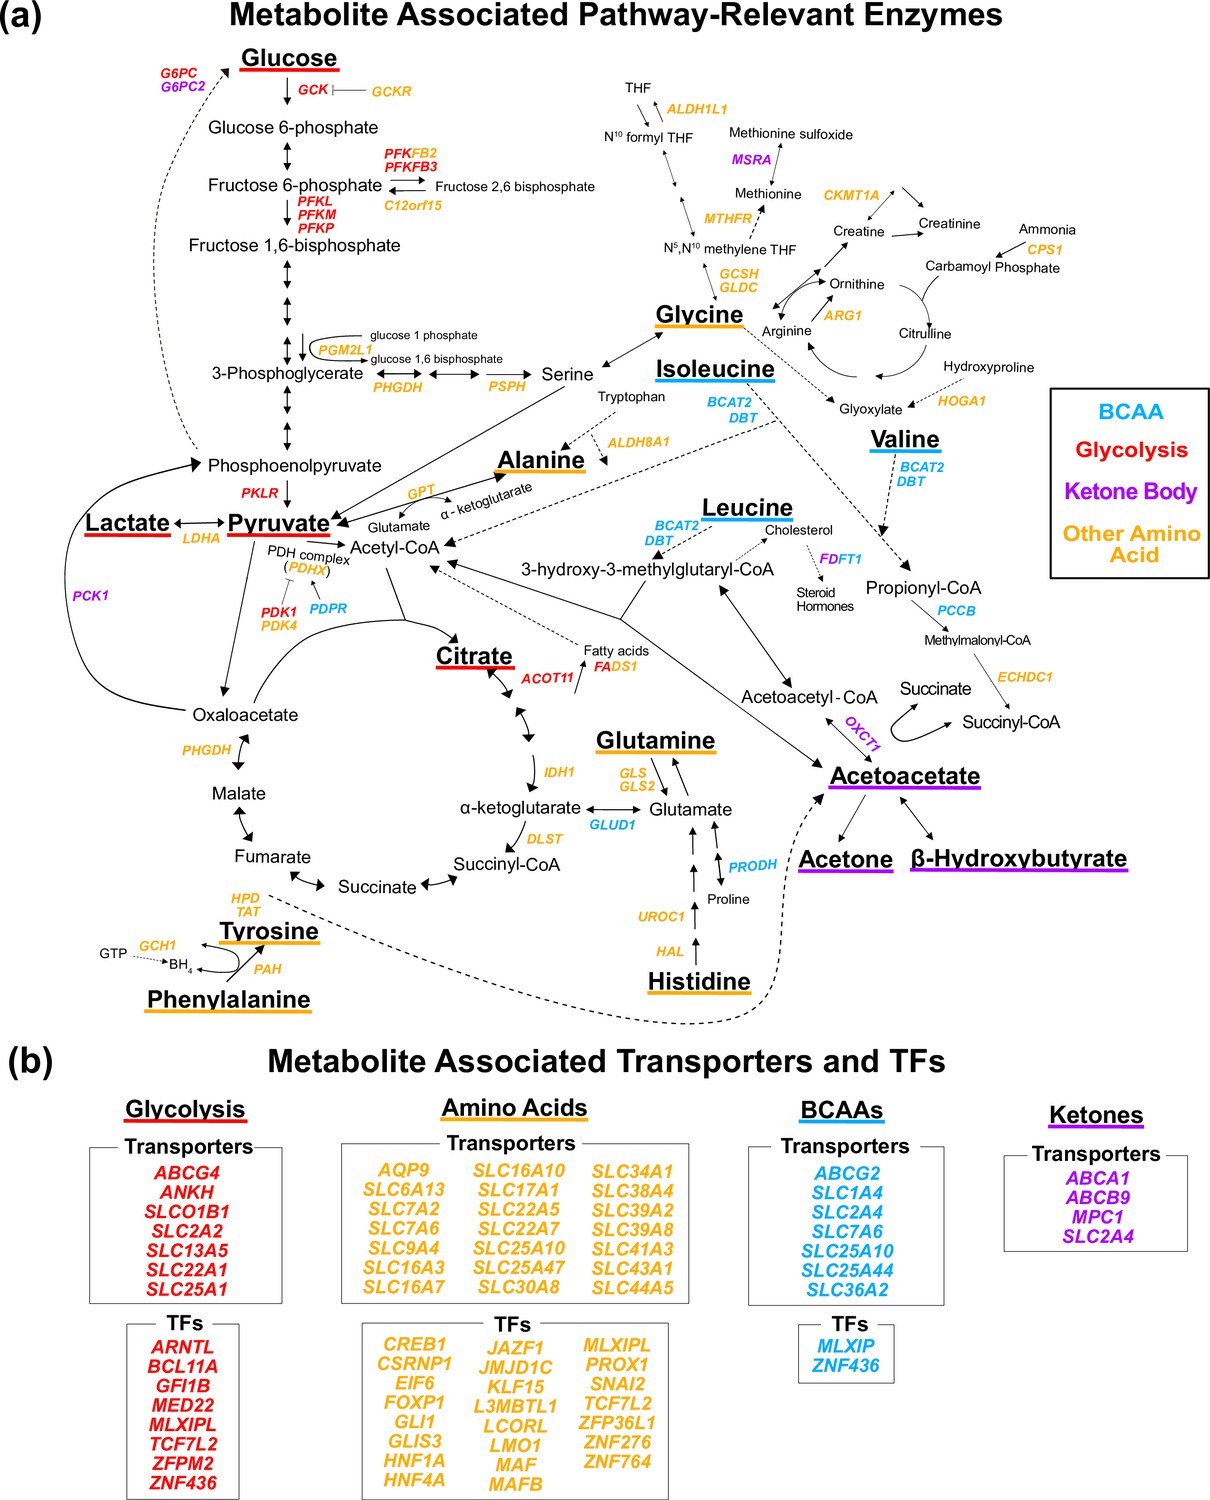
Gene annotation of metabolite genome-wide association studies (GWAS) hits.
Each gene is colored based on the biochemical group with the most associated metabolites (p<1e-4). If multiple biochemical groups are tied for the most associations for a given gene, they are all shown. (a) Expanded pathway diagram with all genes (italicized) that encode pathway-relevant enzymes and were a metabolite GWAS hits. (b) List of all genes of the metabolite GWAS hits that encode transporters and transcription factors (TFs). There were 69 metabolite GWAS hits that are not shown. Of these, 60 were annotated with genes assigned to the gene type general cell function (14 of these 60 were related to lipid function), and 9 were assigned to a gene of unknown function or that did not have any genes nearby (see ‘Methods’).
Figure 3—figure supplement 1
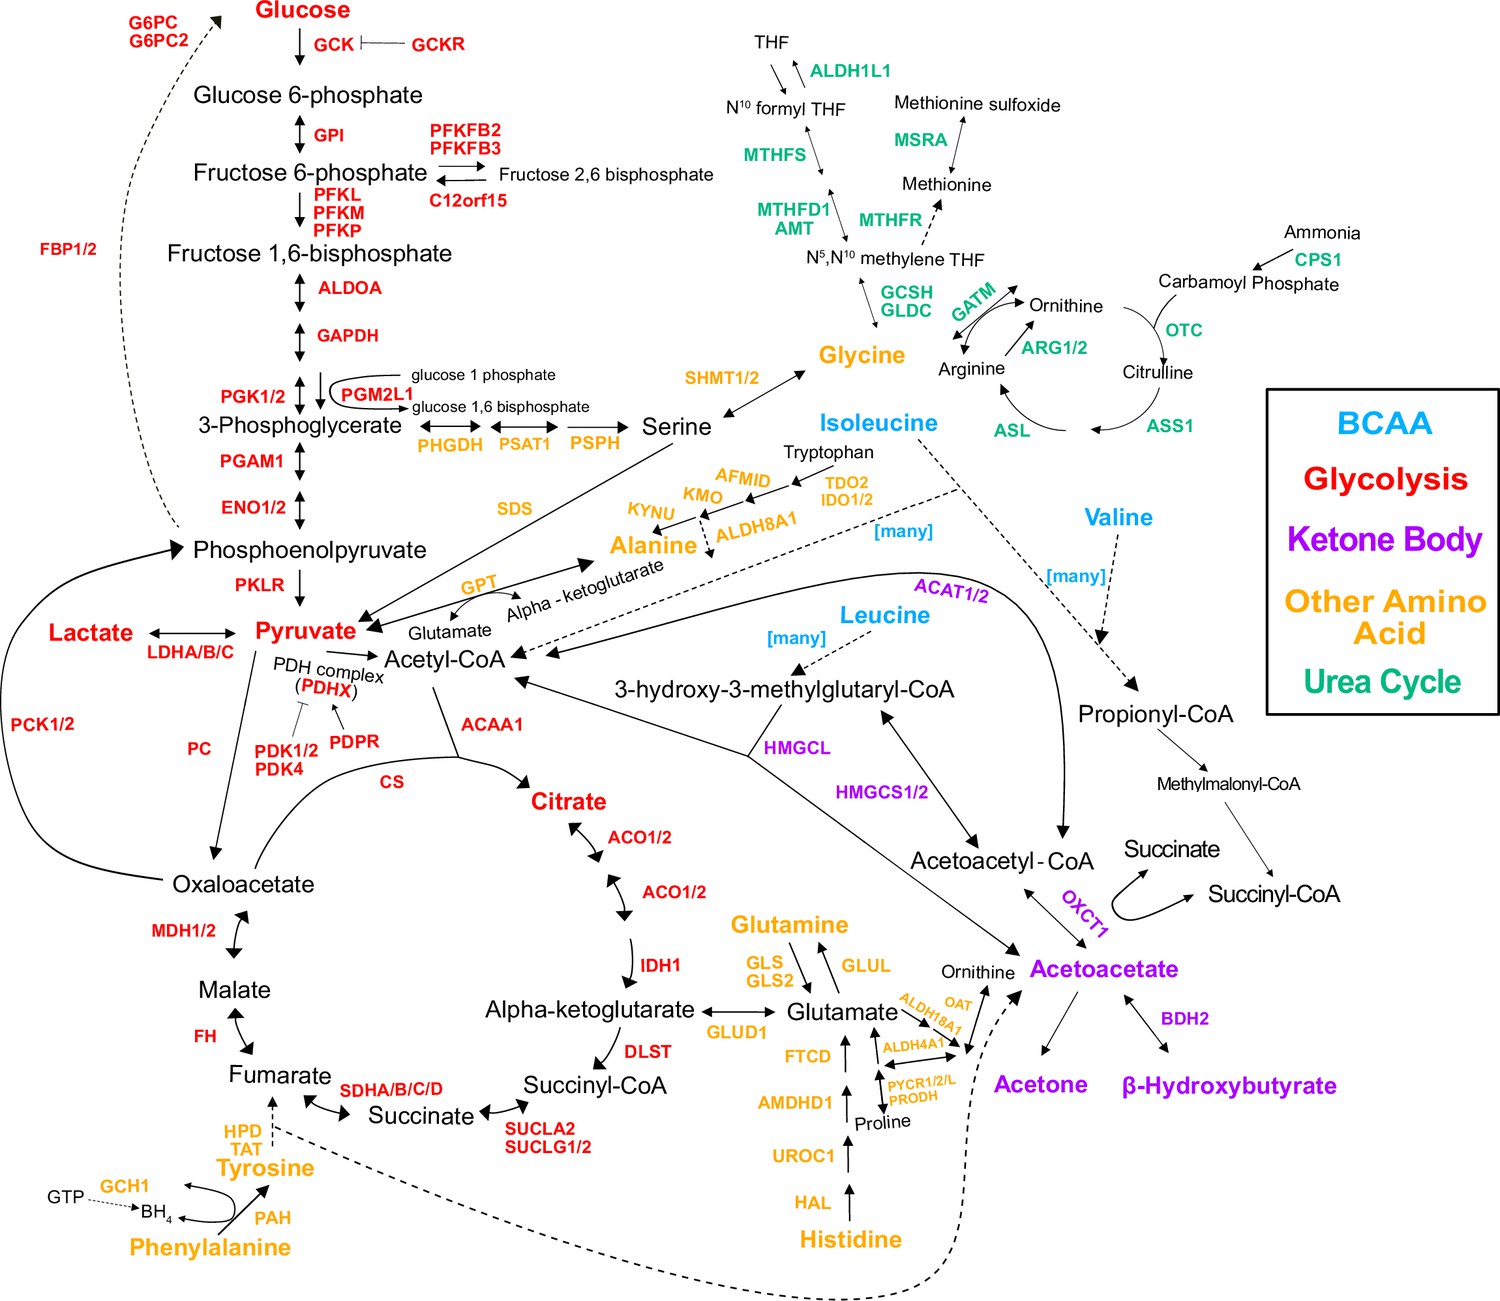
Genes in the pathway.
Pathway diagram showing the genes in the pathway, regardless of whether there was a variant annotated with them or not.
Figure 3—figure supplement 2
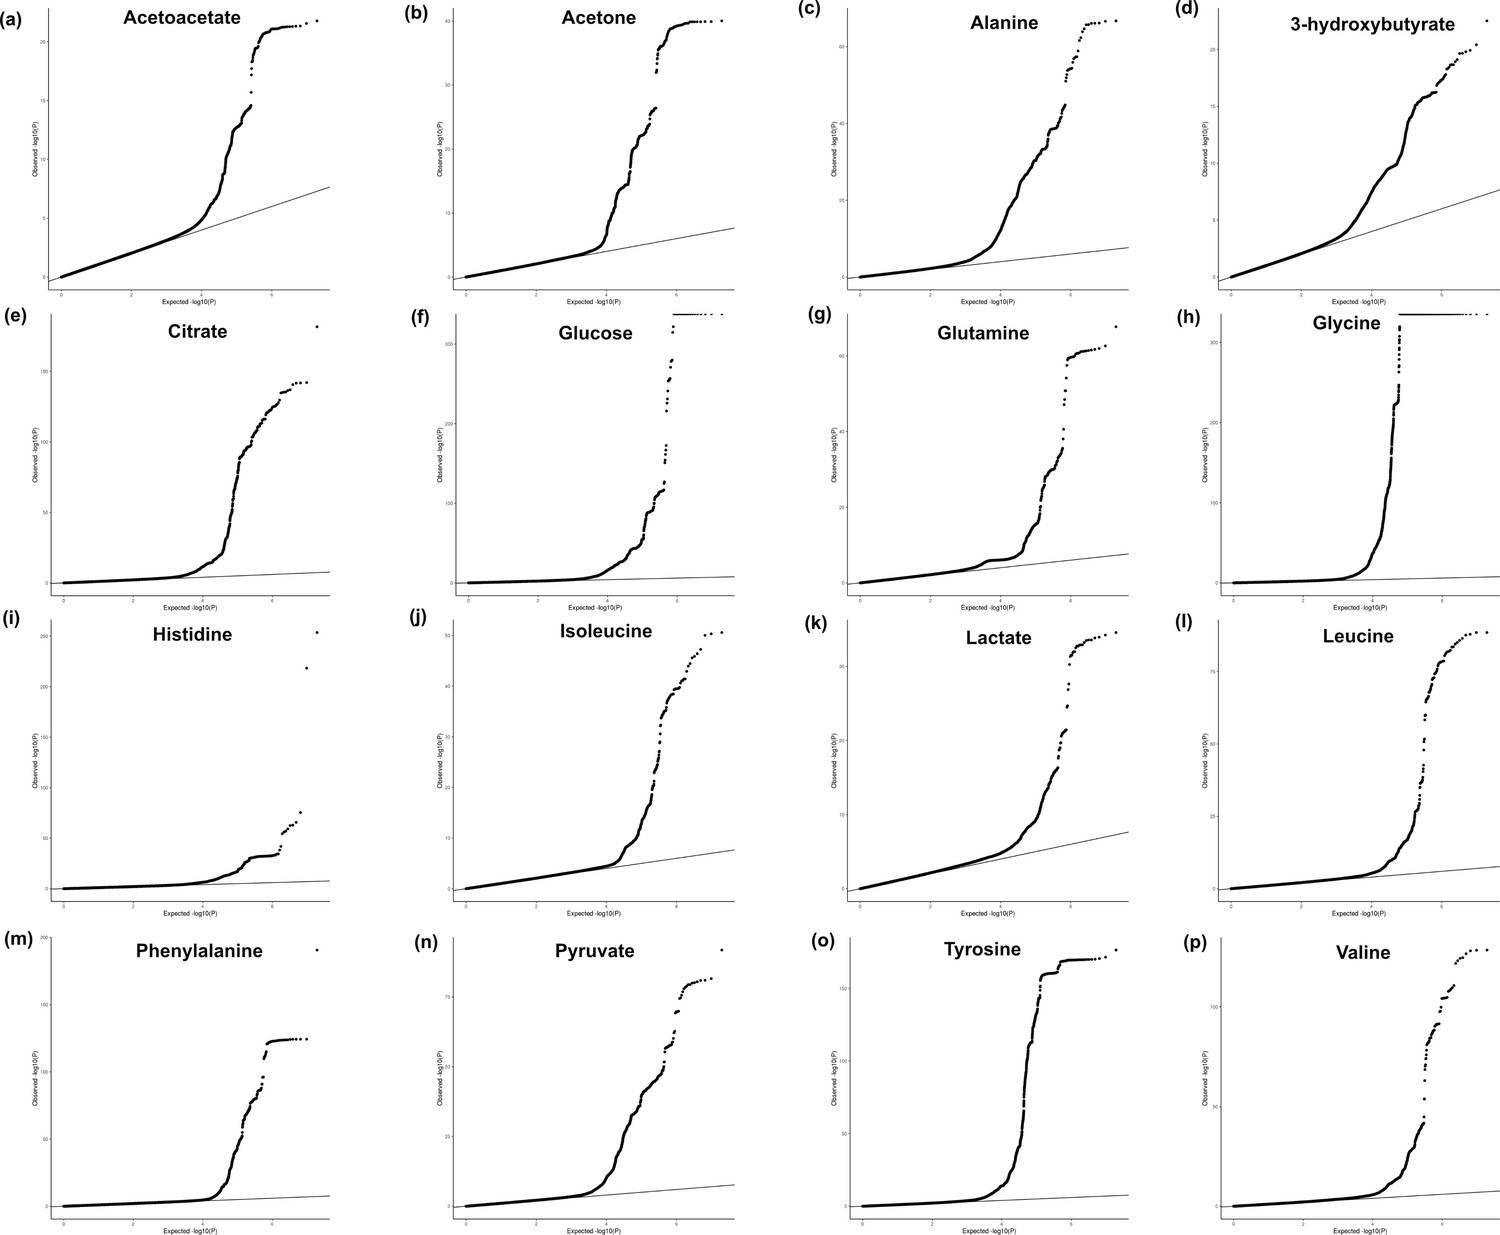
Quantile–quantile plots.
Quantile–quantile plots showing the observed -log10(p-value) from the 16 genome-wide association studies (GWAS) in each metabolite for the full summary statistics of the ancestry-inclusive GWAS: (a) acetoacetate, (b) acetone, (c) alanine, (d) 3-hydroxybutyrate, (e) citrate, (f) glucose, (g) glutamine, (h) glycine, (i) histidine, (j) isoleucine, (k) lactate, (l) leucine, (m) phenylalanine, (n) pyruvate, (o) tyrosine, (p) valine. Note that for plotting purposes, p-values were set to a minimum of 1e-324.
Figure 4 with 7 supplements
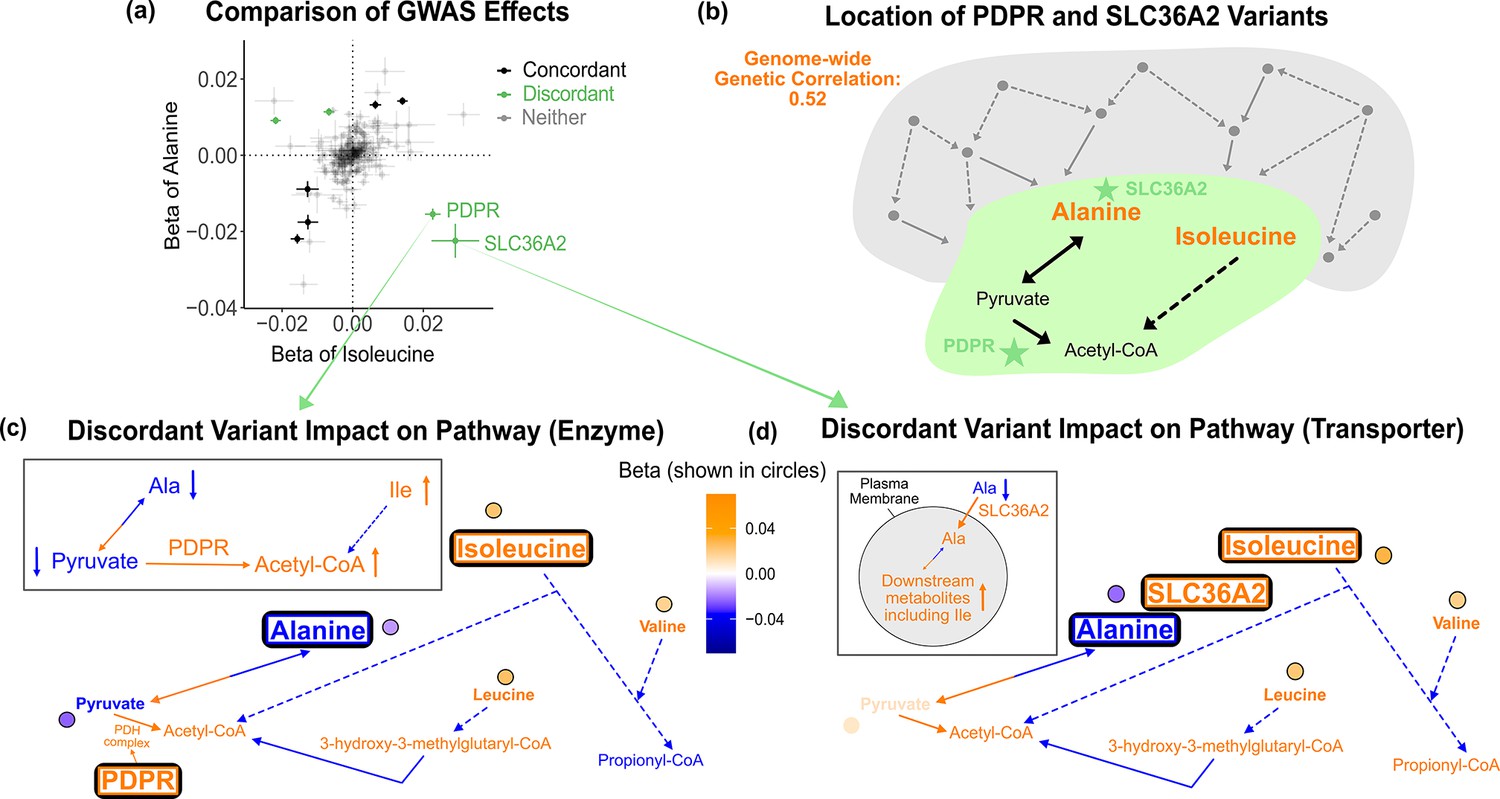
Discordant variant analysis.
(a) Comparison between the effects on alanine levels versus the effects on isoleucine levels for the 213 metabolite genome-wide association studies (GWAS) hits. This highlights two discordant variants: rs370014171 (PDPR) and rs77010315 (SLC36A2). Variants without an association p<1e-4 in both metabolites are labeled ‘Neither.’ (b) Graphical representation of where these two discordant variants act in the pathway, represented by green stars, relative to other upstream variants driving the positive genetic correlation. Below are the hypothesized mechanisms explaining the GWAS results in relevant metabolites for each of these discordant variants. Data are shown in circles with the coloring corresponding to the effect (beta) of that variant on that metabolite. A black outline represents an association with p<1e-4. Orange text and arrows represent a hypothesized increase (direction, not magnitude) in flux and blue corresponds to a decrease. (c) Results for rs370014171 near the gene PDPR, which encodes a protein that activates the conversion of pyruvate to acetyl-CoA. All solid lines represent a single chemical reaction step. Dotted lines represent a simplification of multiple steps. (d) Results for rs77010315 in the gene SLC36A2, which encodes a small amino acid transporter.
Figure 4—figure supplement 1

Full pathway results for PDPR.
Full pathway results and possible mechanism for discordant variant rs370014171 with gene annotation PDPR. rs370014171 (PDPR): The discordant variant rs370014171 had gene annotation PDPR, which encodes the regulatory unit of the protein pyruvate dehydrogenase phosphatase that is responsible for the activation of the pyruvate dehydrogenase (PDH) complex that catalyzes the conversion of pyruvate to acetyl-CoA (supplementary expanded pathway Figure 4-figure supplement 1). One possible mechanism for this variant is that it is increasing PDPR activity, leading to increased conversion of pyruvate to acetyl-CoA, resulting in decreased pyruvate levels and, by compensation, decreased lactate levels. In addition, to compensate for the decreased pyruvate levels, there could be an increased conversion of alanine to pyruvate and glutamate. This would cause a decrease in levels of alanine and an increase in levels of glutamate. In response to the increased acetyl-CoA, there could be decreased breakdown of metabolites that are normally broken down for its production, including isoleucine and leucine, resulting in an increase in their levels. With the increase in acetyl-CoA levels, less HMG-CoA is broken down to acetyl-CoA. The reaction of HMG-CoA to acetyl-CoA also produces acetoacetate, so this decrease results in a decrease in acetoacetate, as well as the other ketone bodies (acetone and -hydroxybutyrate), which are directly downstream of acetoacetate. Some of the increase in HMG-CoA (from its decreased breakdown) leads to an increase in cholesterol. Meanwhile, alanine to glutamate is an important regulator of BCAA levels since the first step in BCAA breakdown is a reversible conversion to glutamate. An increase in glutamate’s levels means again less BCAA will need to be broken down, which is another potential reason for increased levels of the BCAAs (isoleucine, leucine, and valine). This variant was also found to be significantly associated with an increase in isoleucine, leucine, and valine and a decrease in alanine in another recent metabolomics study (Lotta et al., 2021). In this dataset, after these four amino acids, the metabolite with the next most significant association with this variant lysine (Z = 3.8, p=1e-4) (Lotta et al., 2021). Lysine is another amino acid that can be catabolized to produce acetyl-CoA and thus like isoleucine, leucine, and valine, based on the hypothesized mechanism for this variant it makes sense lysine would have a positive association.
Figure 4—figure supplement 2
PDPR locus colocalization.
Colocalization results for PDPR locus demonstrating pleiotropic effects of variant rs370014171 on alanine (one of multiple independent associations at this locus), pyruvate, isoleucine, valine, and leucine.
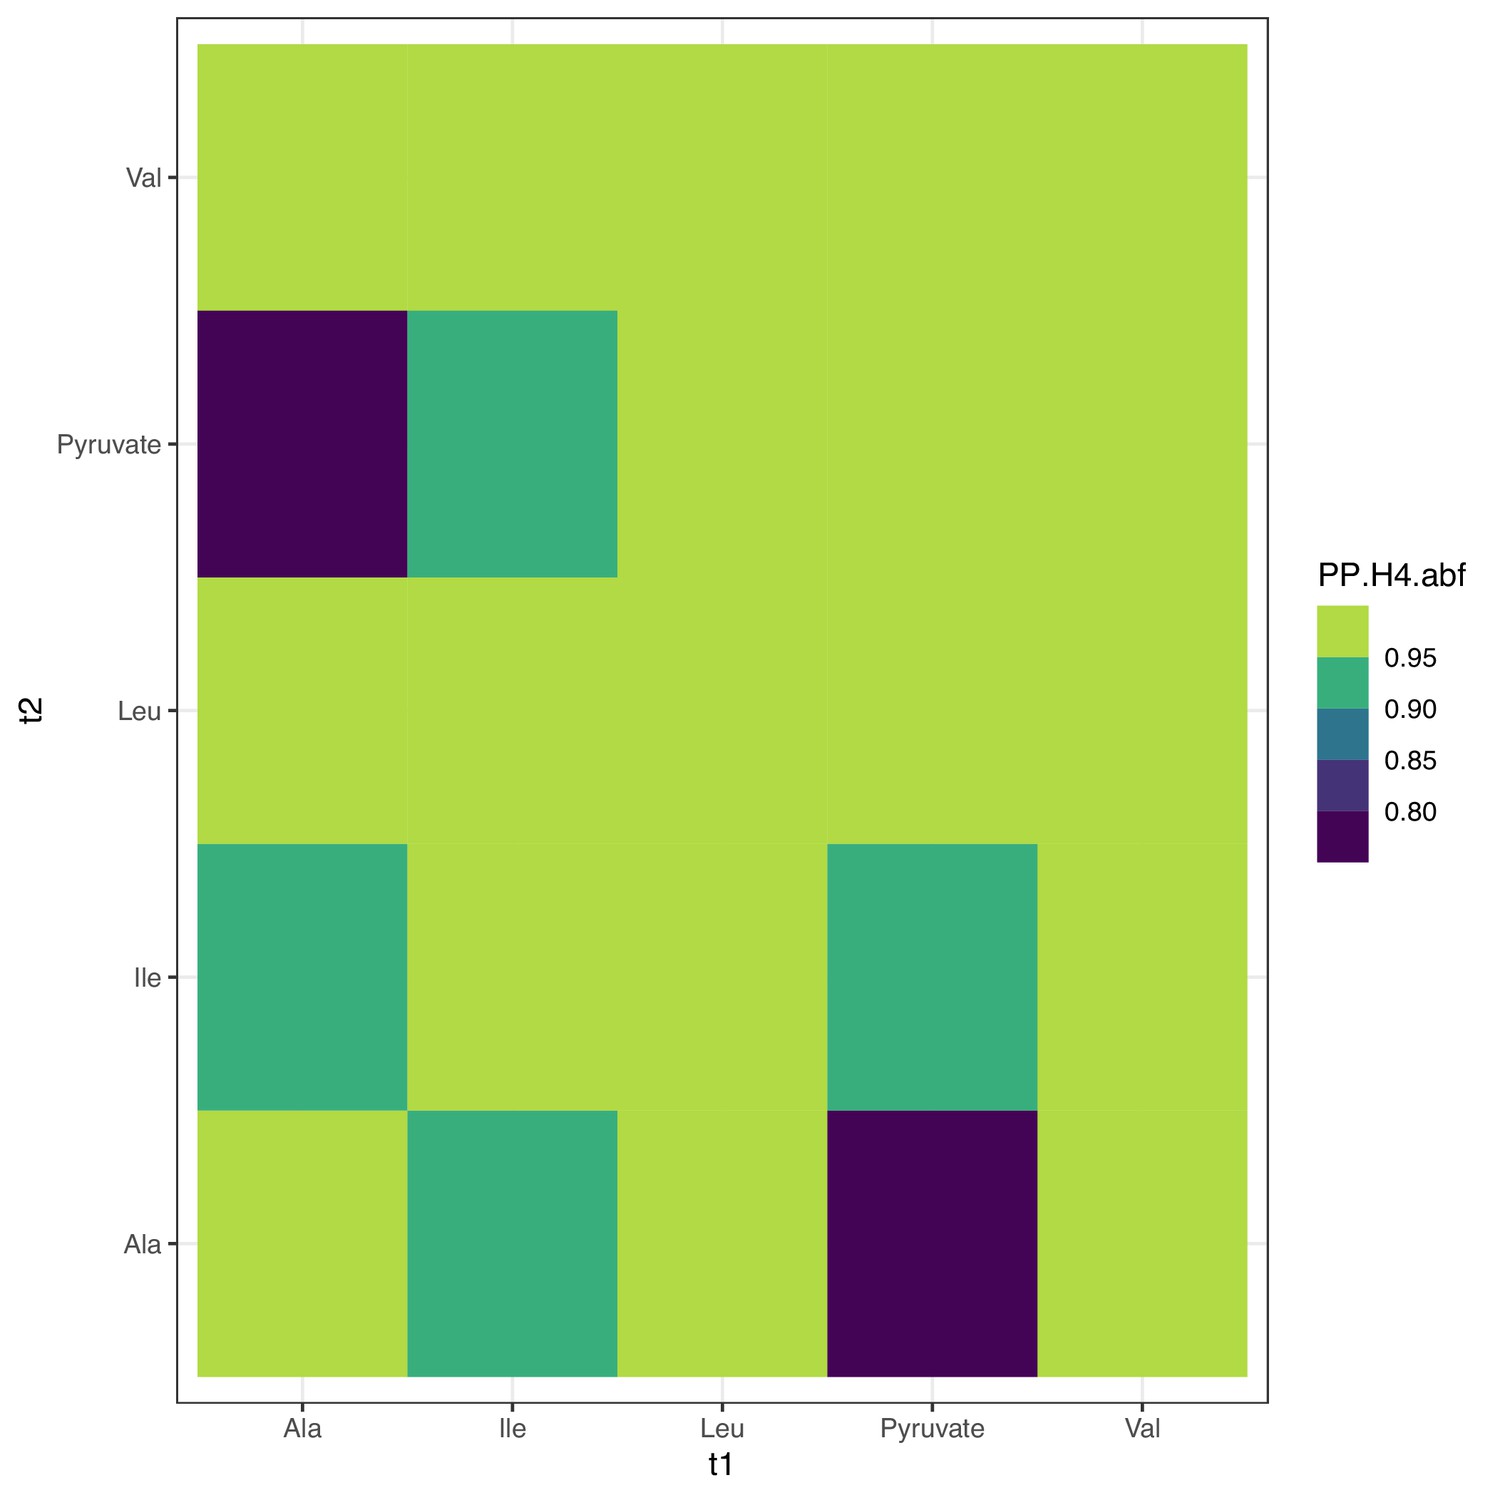
Figure 4—figure supplement 3

Colocalization at PDPR.
Colocalization probabilities at PDPR for the joint association signals of all metabolites. Note that alanine has multiple associations at the locus (Figure 4—figure supplement 2) and thus has reduced colocalization since coloc assumes a single causal variant; see Figure 4—figure supplement 4 for conditional colocalization.
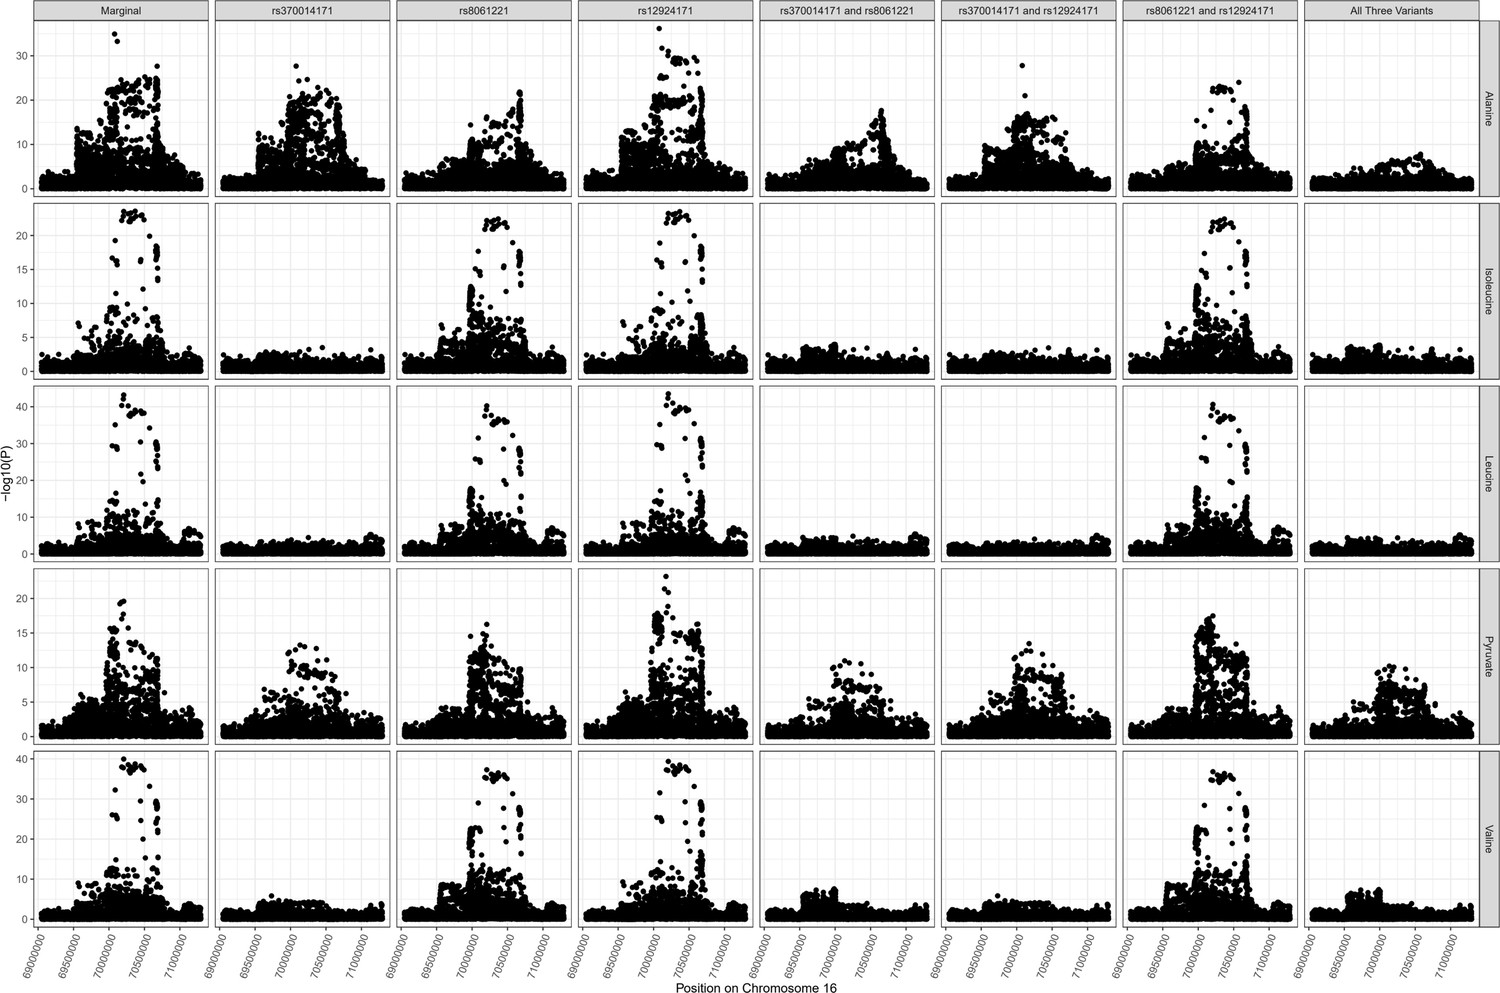
Figure 4—figure supplement 4
Colocalization at PDPR conditioned on secondary signals.
Colocalization probabilities at PDPR for the joint association signals of all metabolites for summary statistics conditioned on rs8061221 and rs12924171. By conditioning on these two secondary SNPs, there is broad colocalization across traits.
Figure 4—figure supplement 5
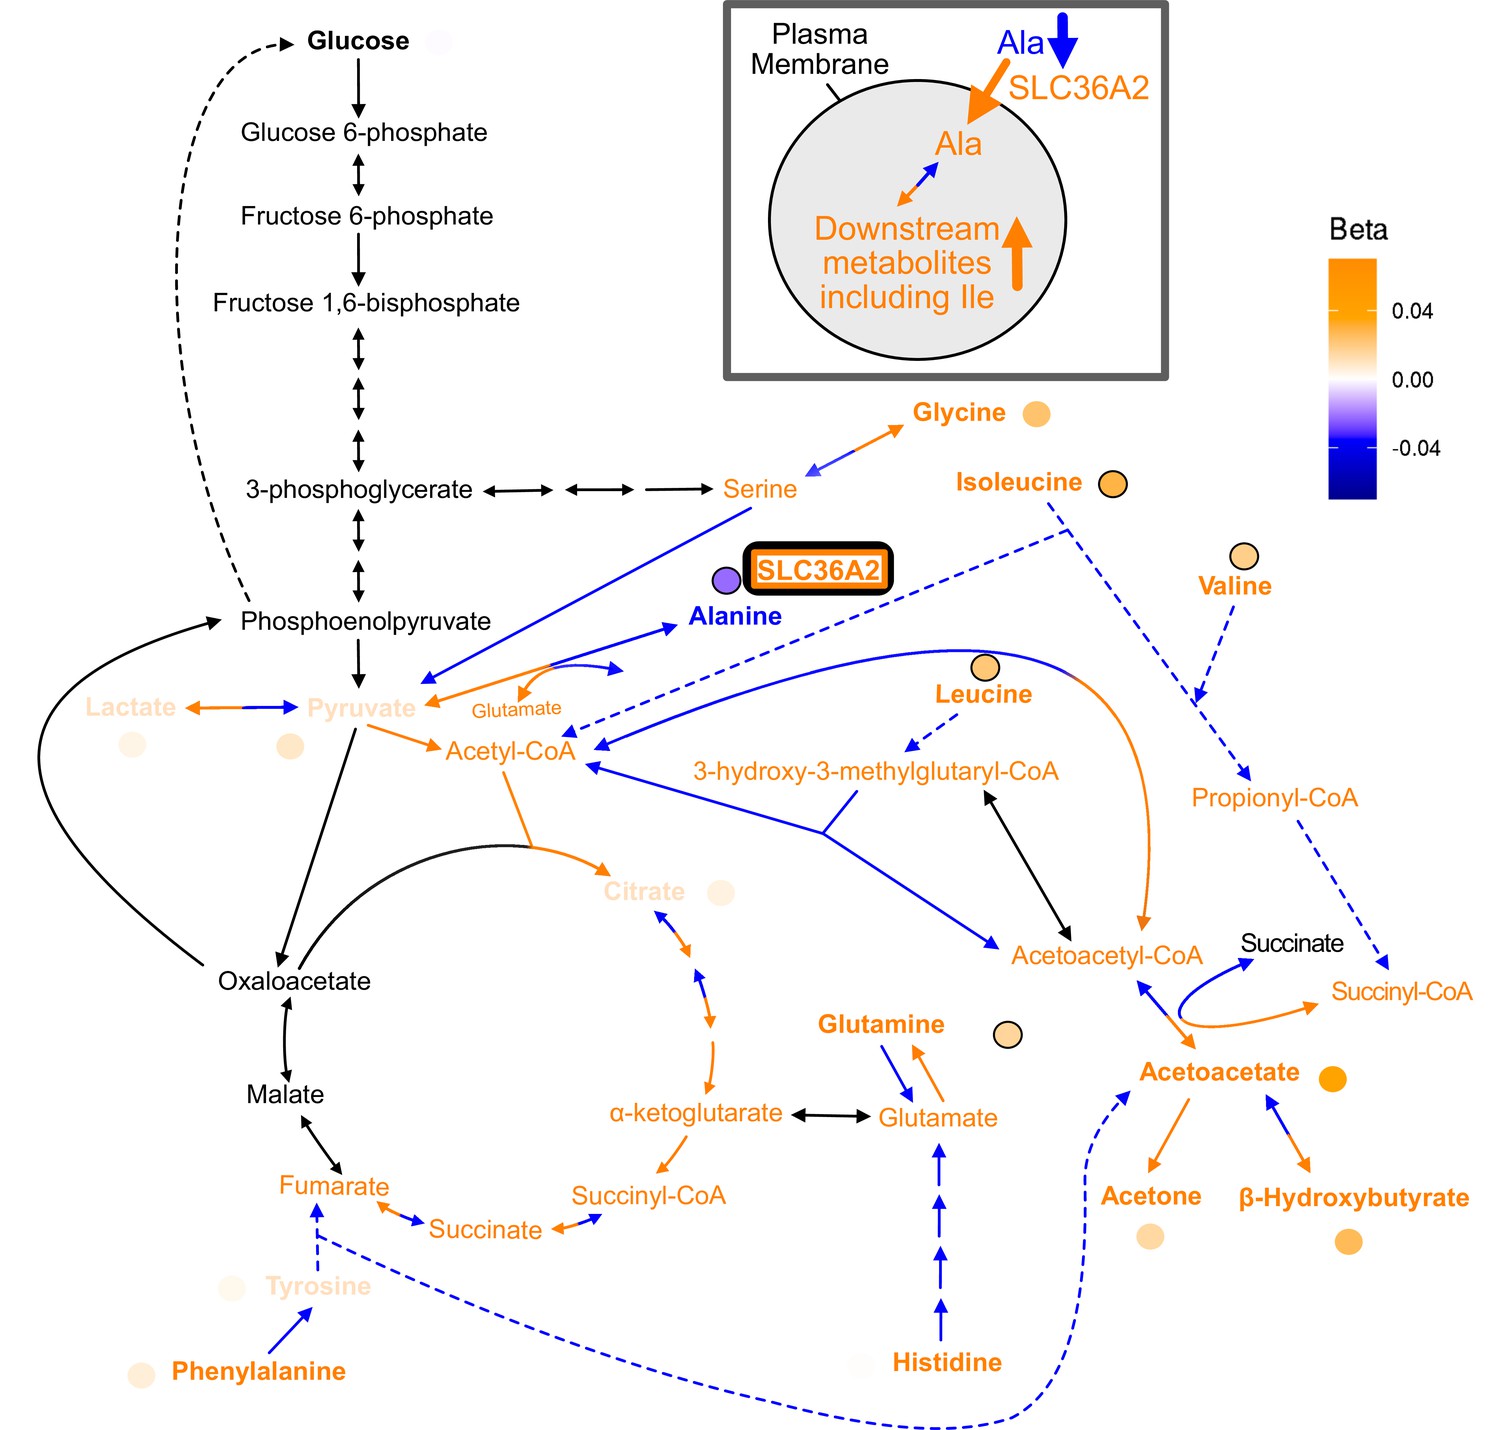
Full pathway results for SLC36A2.
Full pathway results and possible mechanism for discordant variant rs77010315 with gene annotation SLC36A2. rs77010315 (SLC36A2): the discordant variant rs77010315 is a missense variant in SLC36A2, which encodes a transporter for small amino acids such as alanine (supplementary expanded pathway Figure 4—figure supplement 5 ). We hypothesize this variant is discordant because it increases the activity of SLC36A2, leading to increased transport of alanine into cells. This results in a decrease in levels of alanine in the blood, but results in increased intracellular conversion of alanine to pyruvate and glutamate. Pyruvate can then be reversibly converted to lactate, resulting in an increase in lactate levels, as well as converted to acetyl-CoA. The increased pyruvate results in an increase in glycine levels because less needs to be broken down to produce it. The increase in acetyl-CoA leads to an increase in its downstream citric acid cycle intermediates including citrate, fumarate, succinyl-CoA, and alpha-ketoglutarate. The increased glutamate leads to an increase in glutamine and the increase in fumarate leads to an increase in tyrosine and phenylalanine. The increase in acetyl-CoA also leads to an increase in isoleucine, HMG-CoA, and leucine since less needs to be broken down to produce it, and to increased acetoacetyl-CoA since more acetyl-CoA is available to be converted to it. Acetoacetyl-CoA can then be converted to acetoacetate, leading to an increase in all three ketone bodies (acetoacetate, acetone, and -hydroxybutyrate), as well as succinyl-CoA. Finally, the increased succinyl-CoA leads to an increase in valine because less valine needs to be broken down to produce it. This variant also had consistent associations consistent in direction of effect with alanine (Z = –4.3, p=2e-5), glutamine (Z = 3.9, p=1e-4), valine (Z = 3.7, p=2e-4), and glycine (Z = 3.4, p=8e-4) in another dataset (Lotta et al., 2021). In this dataset, the most significant association with this variant was carnitine (Z = 13.2, p=2e-39) (Lotta et al., 2021). Carnitine can be made from methionine, which is a metabolite that can be produced from glycine breakdown. Because increased levels of glycine from this variant may result in increased levels of carnitine, based on the hypothesized mechanism for this variant it may make sense that carnitine would have a positive association.
Figure 4—figure supplement 6

SLC36A2 locus colocalization.
Colocalization results for SLC36A2 locus demonstrating pleiotropic effects of variant rs77010315 on alanine, isoleucine, valine, and leucine. There is limited evidence for an association with pyruvate levels at the locus, suggesting the potential for larger sample sizes to resolve the contributions of changes to pyruvate levels at SLC36A2.
Figure 4—figure supplement 7
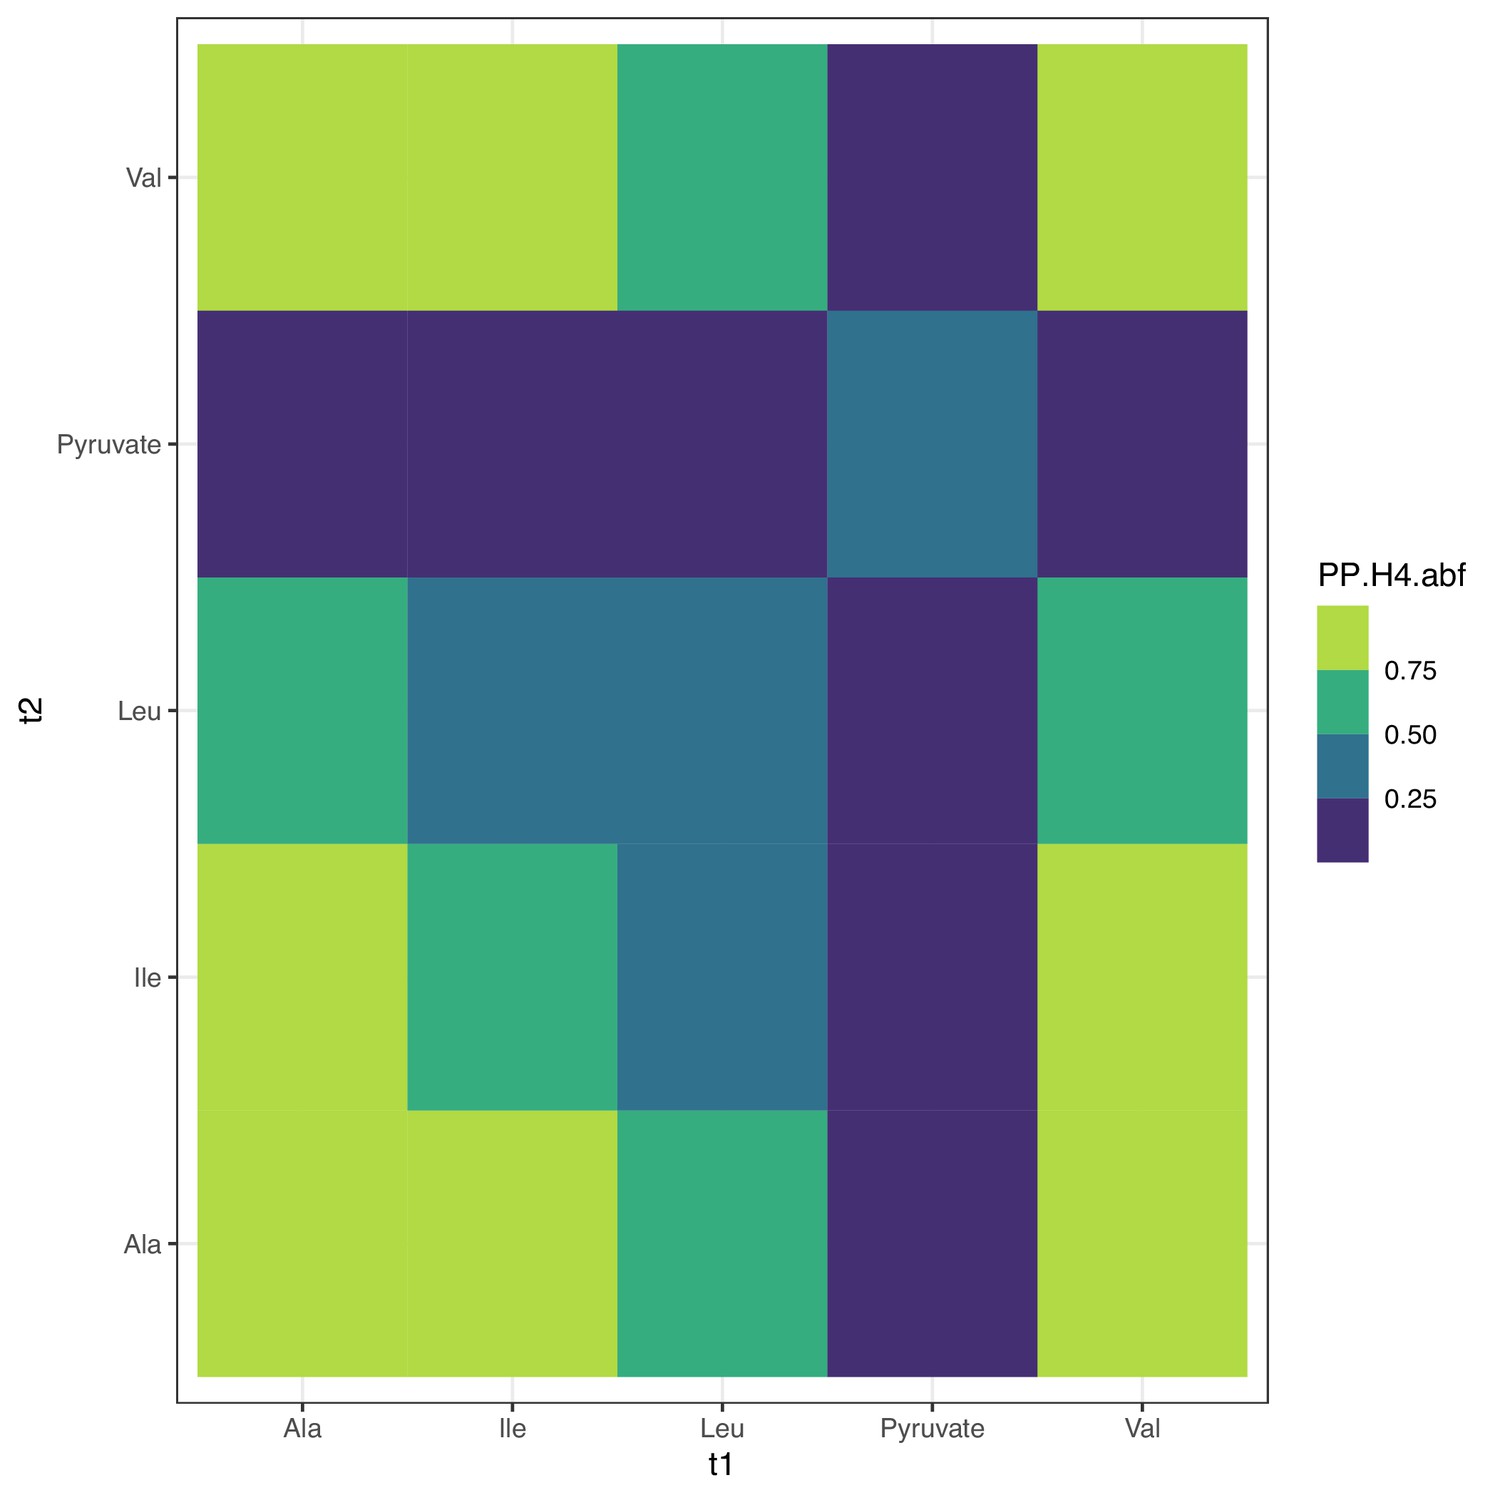
Colocalization at SLC36A2.
Colocalization probabilities at SLC36A2 for the joint association signals of all metabolites. Note that pyruvate has a weak or nonexistent marginal association at the locus, which likely contributes to the lack of colocalization; see Figure 4—figure supplement 6.
Figure 5 with 2 supplements
Characterization of discordant and concordant variants.
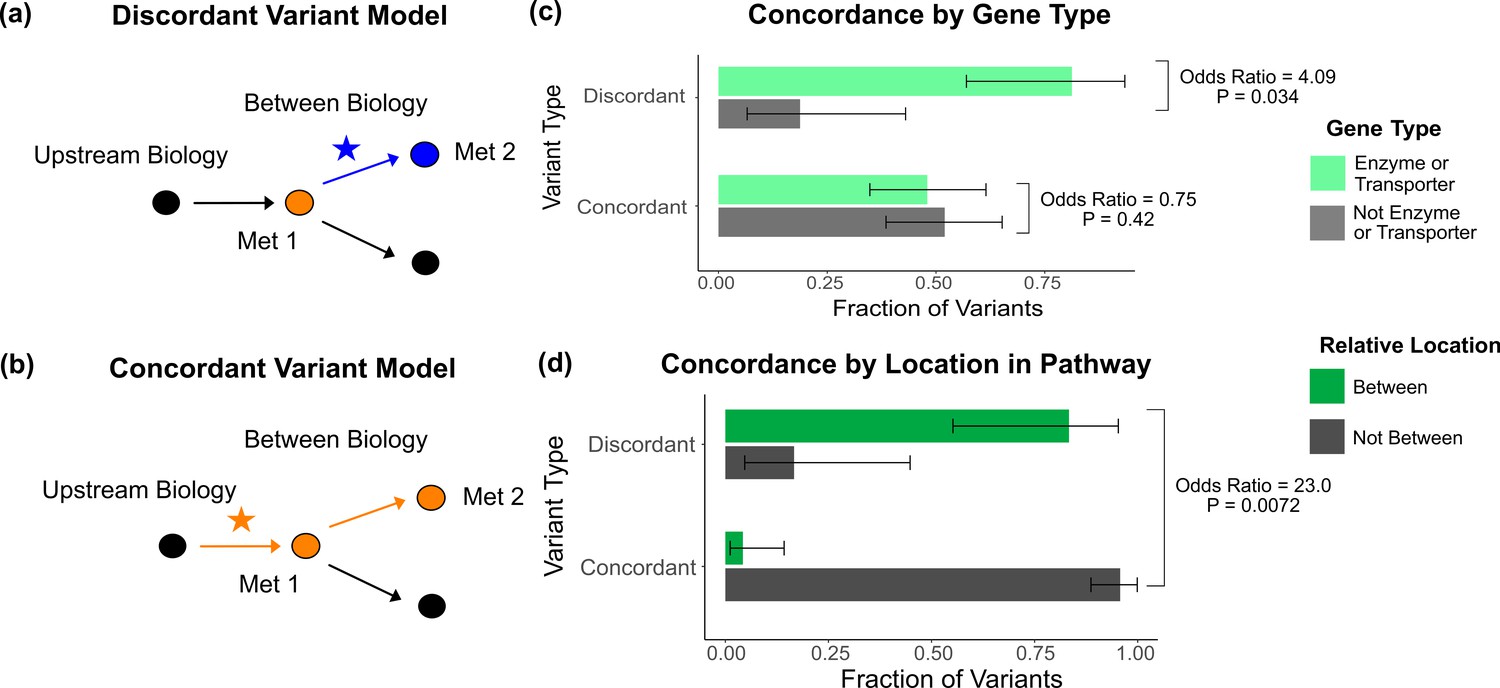
(a) Proposed model for the mechanism of a discordant variant. This example is for a discordant variant that has opposite effect directions on a pair of metabolites with a positive overall genetic correlation because it affects biology between them. (b) Proposed model for the mechanism of a concordant variant. This example is for a concordant variant that has the same effect direction on a pair of metabolites with a positive overall genetic correlation because it affects biology upstream both metabolites. (c) Fraction of the discordant and concordant variants that have a pathway-relevant enzyme or transporter gene-type annotation versus those with a different gene-type annotation (N total = 62). Discordant variants are enriched for the gene types of pathway-relevant enzyme or transporter, as would be expected in the model of discordant variants generally affecting biology between metabolites. (d) Fraction of the discordant and concordant variants annotated with a pathway-relevant enzyme that affect biology between versus not between their significant metabolite pairs (N total = 17). Significance tests were performed using Fisher’s exact method and the plotted SEs are from 95% CI calculated by Wilson score interval.
Figure 5—figure supplement 1
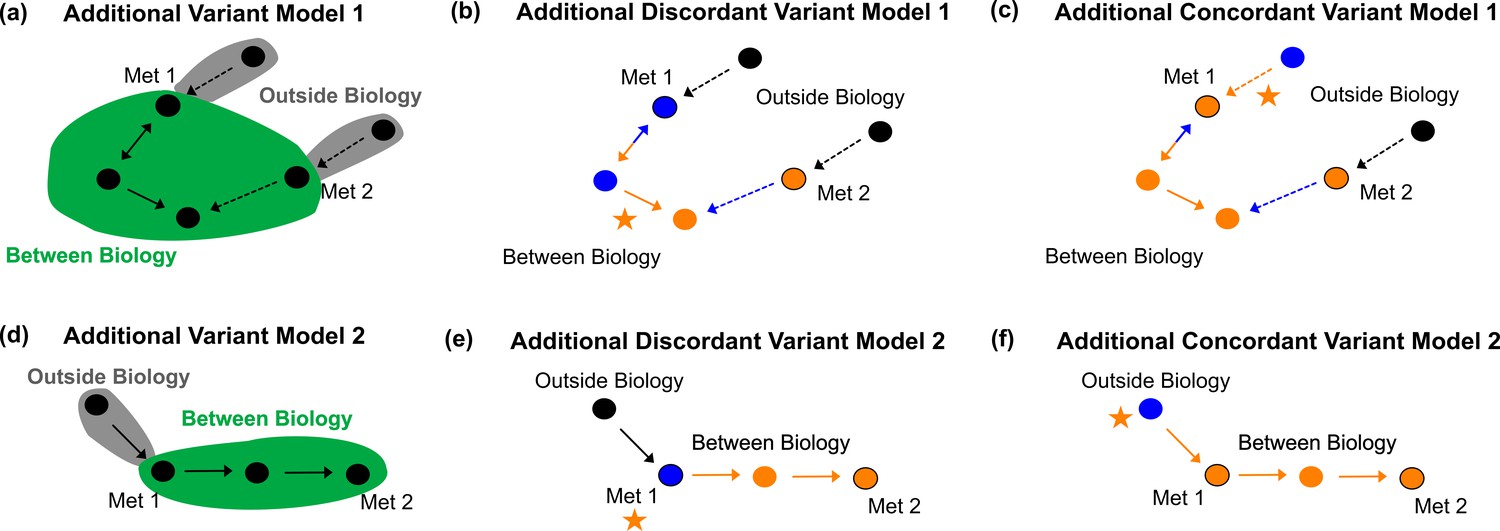
Additional variant models.
Additional Variant Model 1 defining between vs. outside biology (a), example discordant variant (b), and example concordant variant (c) for a more complicated example with a pathway like that in Figure 4c and d. Additional Variant Model 2 defining between vs. outside biology (d), example discordant variant (e), and example concordant variant (f) for a variant affecting a transmembrane transporter, labeled next to the metabolite the transporter acts on.
Figure 5—figure supplement 2

Negative genetic correlation variant models.
Model for an example discordant (a) and an example concordant (b) variant when there is an overall negative genetic correlation.
Figure 6 with 1 supplement
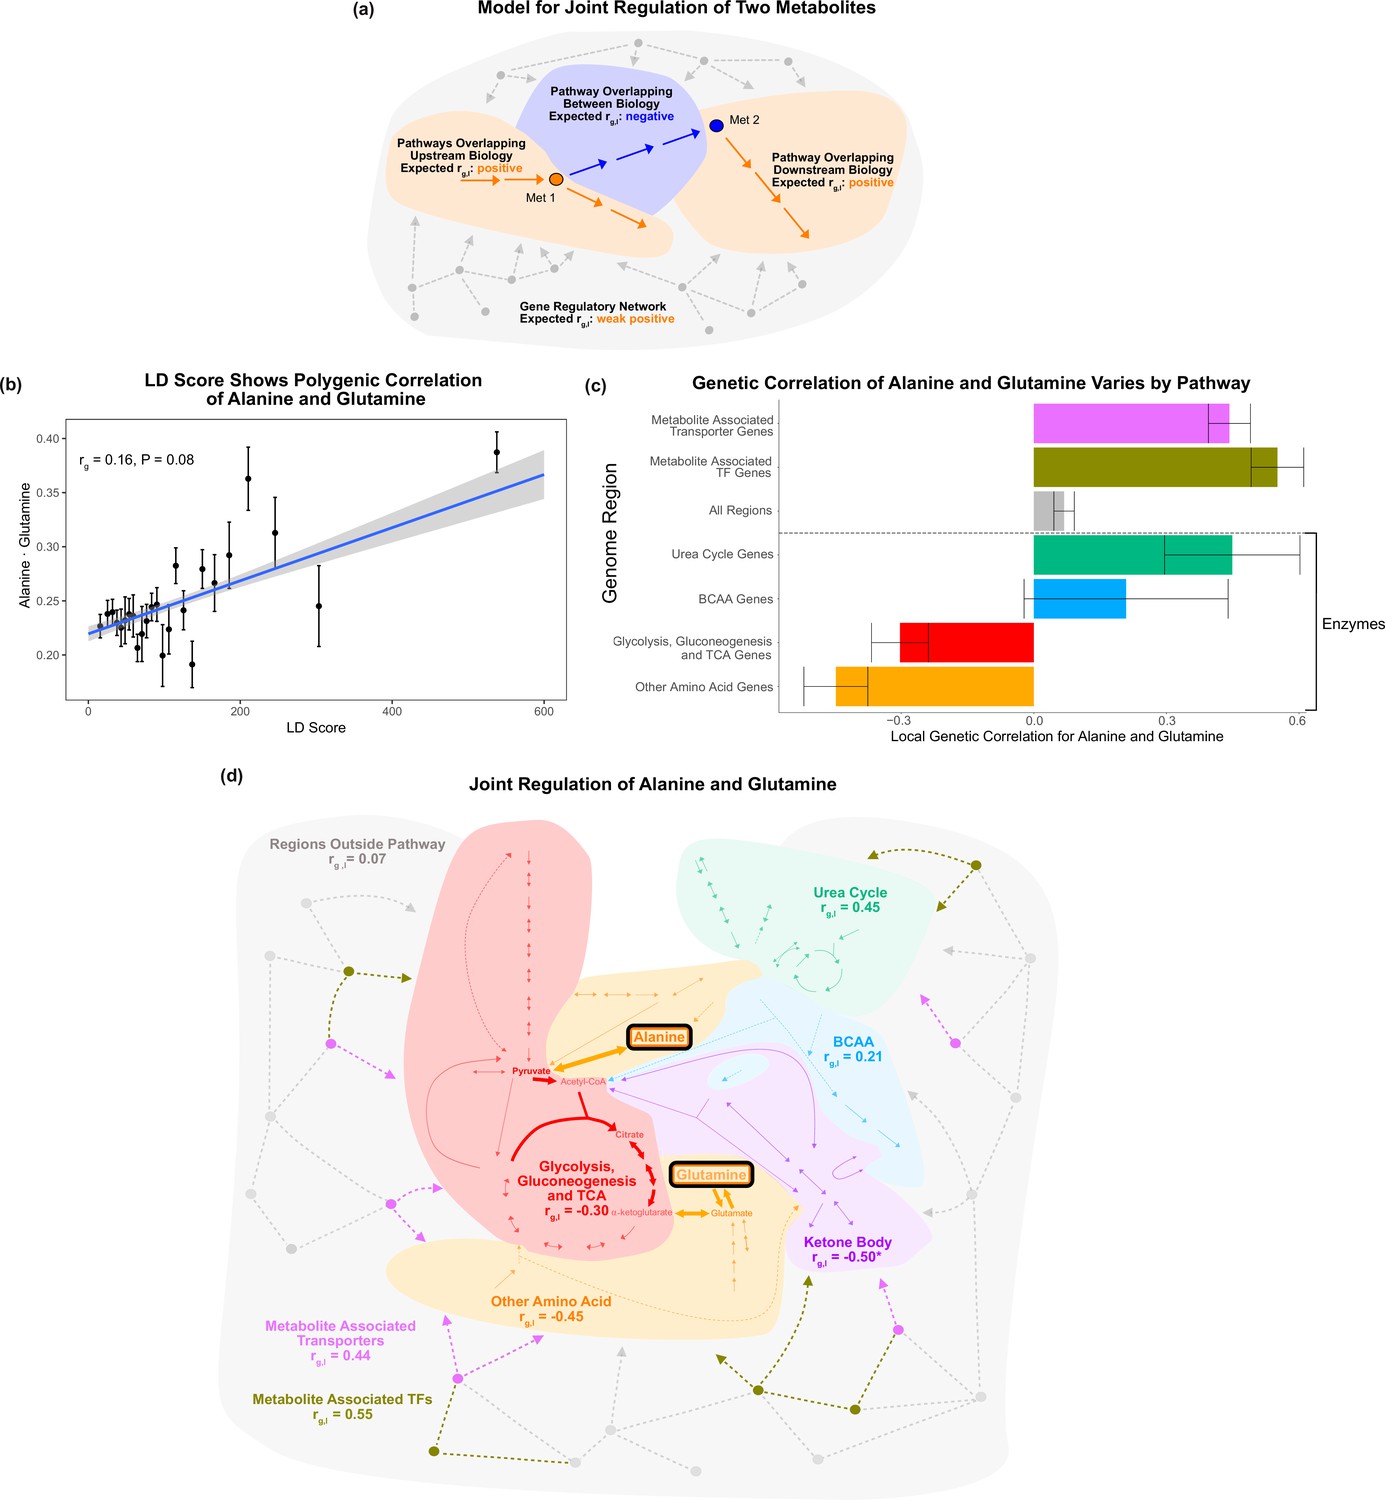
Local genetic correlation.
(a) Model of expected local genetic correlation direction, with contrasting effects of variants affecting ‘between’ versus outside biology at a pathway and genome-wide level. (b) LD Score shows the polygenic correlation of alanine and glutamine. For the x-axis, LD Scores were binned into 25 bins. The y-axis shows the mean and SE within each bin genome wide, and overall genetic correlation significance was calculated using the jackknife standard error (participant N = 94464). (c) Results for the local genetic correlation of alanine and glutamine for variants within 100 kb of genes in each pathway. Standard errors are shown (participant N = 94464). Genesets listed below the dotted line include only enzymes and are considered pathway-relevant enzymes for these metabolites. Summary statistics for BOLT-REML and other methods can be found in Supplementary file 7. (d) Pathway diagram showing the pathways included in the local genetic correlation analysis and the positioning of their genes relative to alanine and glutamine. *Ketone body genes were omitted from panel (c) because the limited number of genes meant they failed to robustly converge. All arrows and nodes in the gray section are hypothetical and shown for illustration purposes.
Figure 6—figure supplement 1

Genetic correlation results.
p-Values for all metabolite pairs for all pathway regions for Haseman–Elston regression genetic correlation analysis.
Figure 7 with 6 supplements
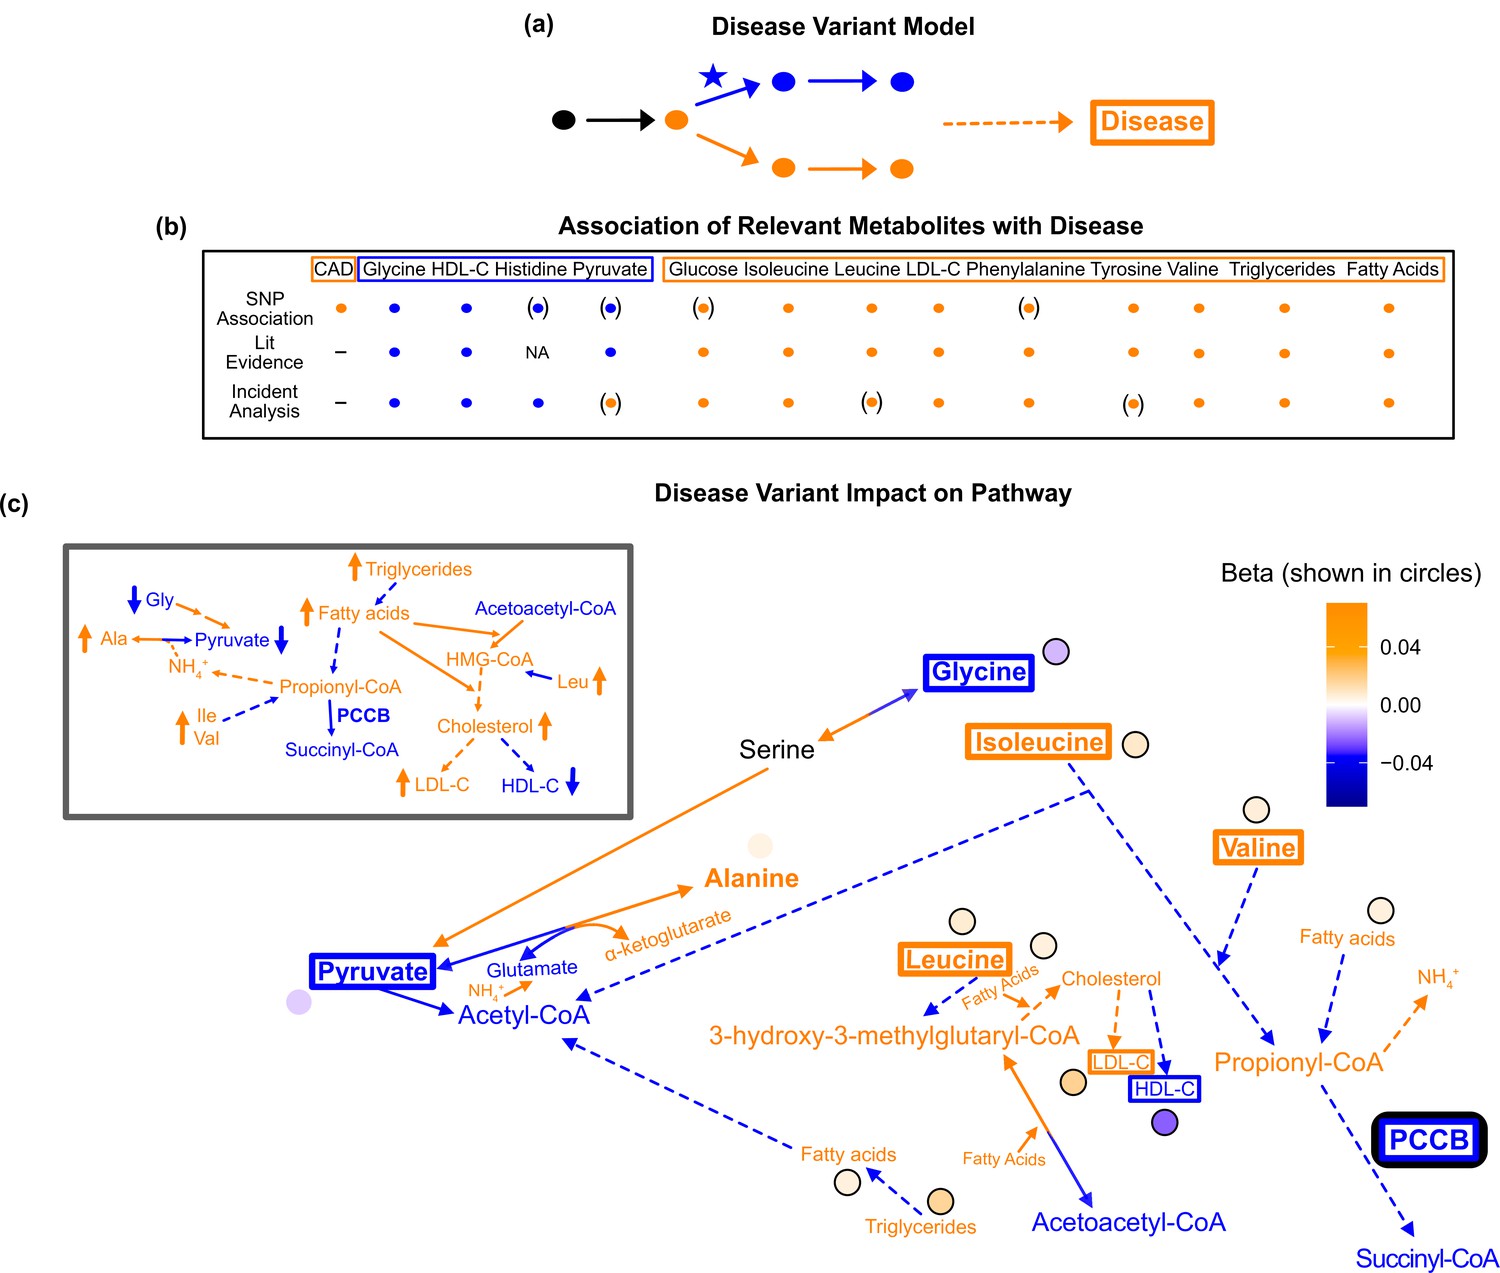
Pathway impact and pathology of example disease genome-wide association studies (GWAS) hit.
(a) Proposed model for the impact of a disease hit on a relevant pathway, contributing to an increased risk in the disease. (b) This variant is associated with an increase in levels of metabolites that have been implicated with increased risk of coronary artery disease (CAD), and a decrease in the levels of metabolites that have been implicated with decreased risk. Parentheses indicate nonsignificant associations, ‘NA’ indicates no evidence was found, and ‘-’ indicates a placeholder because CAD is being compared with itself. (c) Results for rs61791721 with gene assignment PCCB, which encodes a protein that catalyzes the conversion of propionyl-CoA to succinyl-CoA. The hypothesized mechanism is that the variant is decreasing the activity of PCCB, resulting in the above metabolite associations. Ammonium is represented by its chemical formula (). Data are shown in circles with the coloring corresponding to the effect (beta) of that variant on that metabolite. All solid lines represent a single chemical reaction step. Dotted lines represent a simplification of multiple steps.
Figure 7—figure supplement 1

Full pathway results for PCCB.
Full pathway results and possible mechanism for disease-associated variant rs61791721 with gene annotation PCCB. rs61791721 (PCCB): The variant rs61791721 has gene assignment PCCB, which encodes a protein that catalyzes the conversion of propionyl-CoA to succinyl-CoA (supplementary expanded pathway Figure 7—figure supplement 1). The hypothesized mechanism is that the variant decreases PCCB activity, resulting in lower levels of succinyl-CoA and increased propionyl-CoA. The increased propionyl-CoA results in excess ammonium being produced because propionyl-CoA inhibits N-acetylglutamate synthase, which is an important cofactor for the enzyme (carbamoyl phosphate synthetase) that catalyzes the first step in the urea cycle for ammonium capture. Alanine is a reservoir for nitrogen waste so there is an increase in pyruvate and glutamate to alanine and alpha-ketoglutarate to capture the toxic ammonium (Wongkittichote et al., 2017; Smith and Garg, 2017). More glycine is then broken down in response to the decrease in pyruvate levels and more glutamine is converted to glutamate, leading to a decrease in glycine and glutamine levels. Conversely, the increased levels of propionyl-CoA mean less valine and isoleucine need to be broken down, resulting in an increase in their levels. In addition, the increased alpha-ketoglutarate increases downstream citric acid cycle intermediates, meaning less tyrosine needs to be broken down to produce fumarate. Also in response to increased propionyl-CoA, fewer fatty acids are broken down, resulting in decreased acetyl-CoA, which is typically the downstream product, decreased citrate, which is one step downstream of acetyl-CoA, increased total fatty acid levels, and increased total triglyceride levels. This increase may stimulate the activity of HMG-CoA reductase and synthase, resulting in increased conversion of ketone bodies to acetoacetyl-CoA to HMG-CoA and cholesterol. This results in decreased levels of ketone bodies and increased HMG-CoA and cholesterol. Increased HMG-CoA leads to increased leucine, while increased cholesterol leads to an increase in low-density lipoprotein cholesterol (LDL-C) and a decrease in high-density lipoprotein cholesterol (HDL-C). While it is not necessarily intuitive that an increase in cholesterol levels would decrease HDL-C, it is possible that this increase activates the Rho A signal transduction pathway and suppresses peroxisome proliferator-activated receptor alpha, which then decreases the amount of ApoA1, as the reverse may explain why patients on statins may experience an increase in HDL-C despite a decrease in total cholesterol (Martin et al., 2001). ApoA1 is an essential protein for HDL and thus a decrease in its levels would result in a decrease in HDL-C. We also found that PCCB was the strongest eGene in GTEx for rs61791721, with an effect shared across most tissues (Figure 7—figure supplement 5). Note that we additionally ran GWAS for total triglycerides, total fatty acids, HDL-C, and LDL-C as part of the interpretation of the PCCB variant because they are important metabolites in the discussion of cardiometabolic disease (Figure 7—figure supplement 6).
Figure 7—figure supplement 2
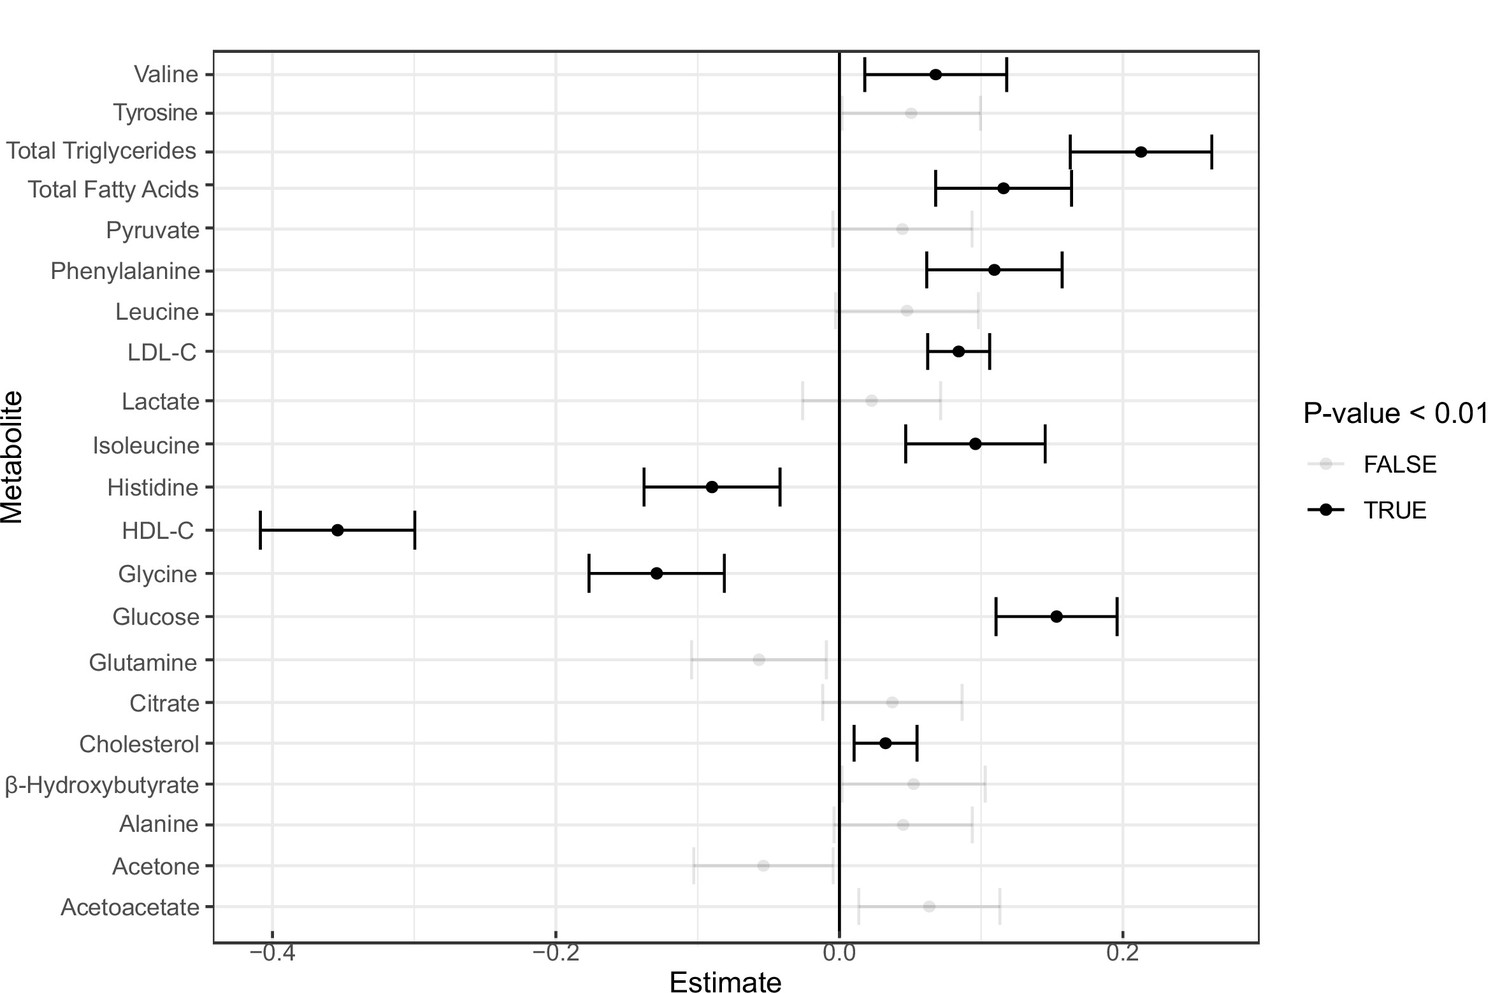
Incident analysis.
Forest plot for coronary artery disease (CAD) incident analysis for the 16 metabolites as well as high-density lipoprotein cholesterol (HDL-C), low-density lipoprotein cholesterol (LDL-C), total triglycerides, cholesterol, and total fatty acids in the UK Biobank.
Figure 7—figure supplement 3
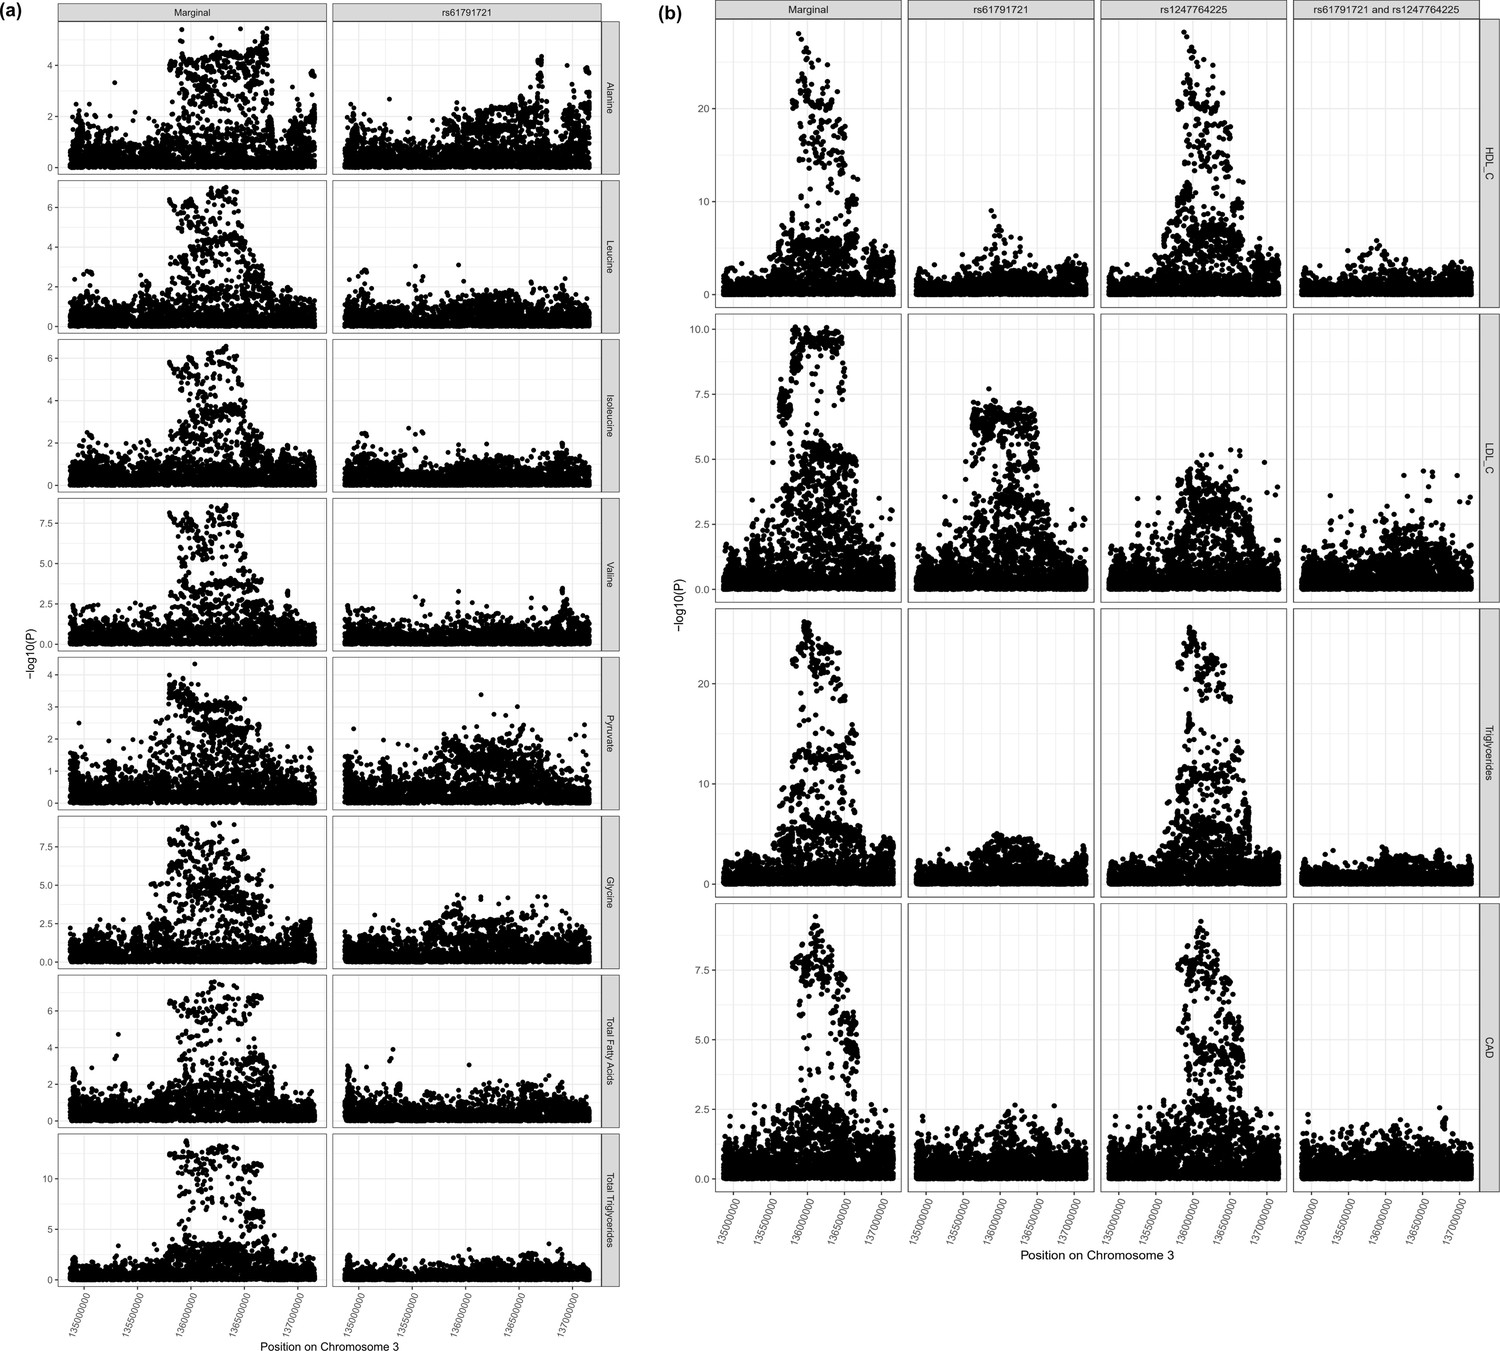
PCCB locus colocalization.
Colocalization results for PCCB locus demonstrating pleiotropic effects of variant rs61791721 on (a) alanine, glycine, pyruvate, isoleucine, valine, leucine, total fatty acids, total triglycerides, total free cholesterol, and (b) the UK Biobank clinical measures of high-density lipoprotein cholesterol (HDL-C), low-density lipoprotein cholesterol (LDL-C) and triglycerides, and coronary artery disease (CAD).
Figure 7—figure supplement 4
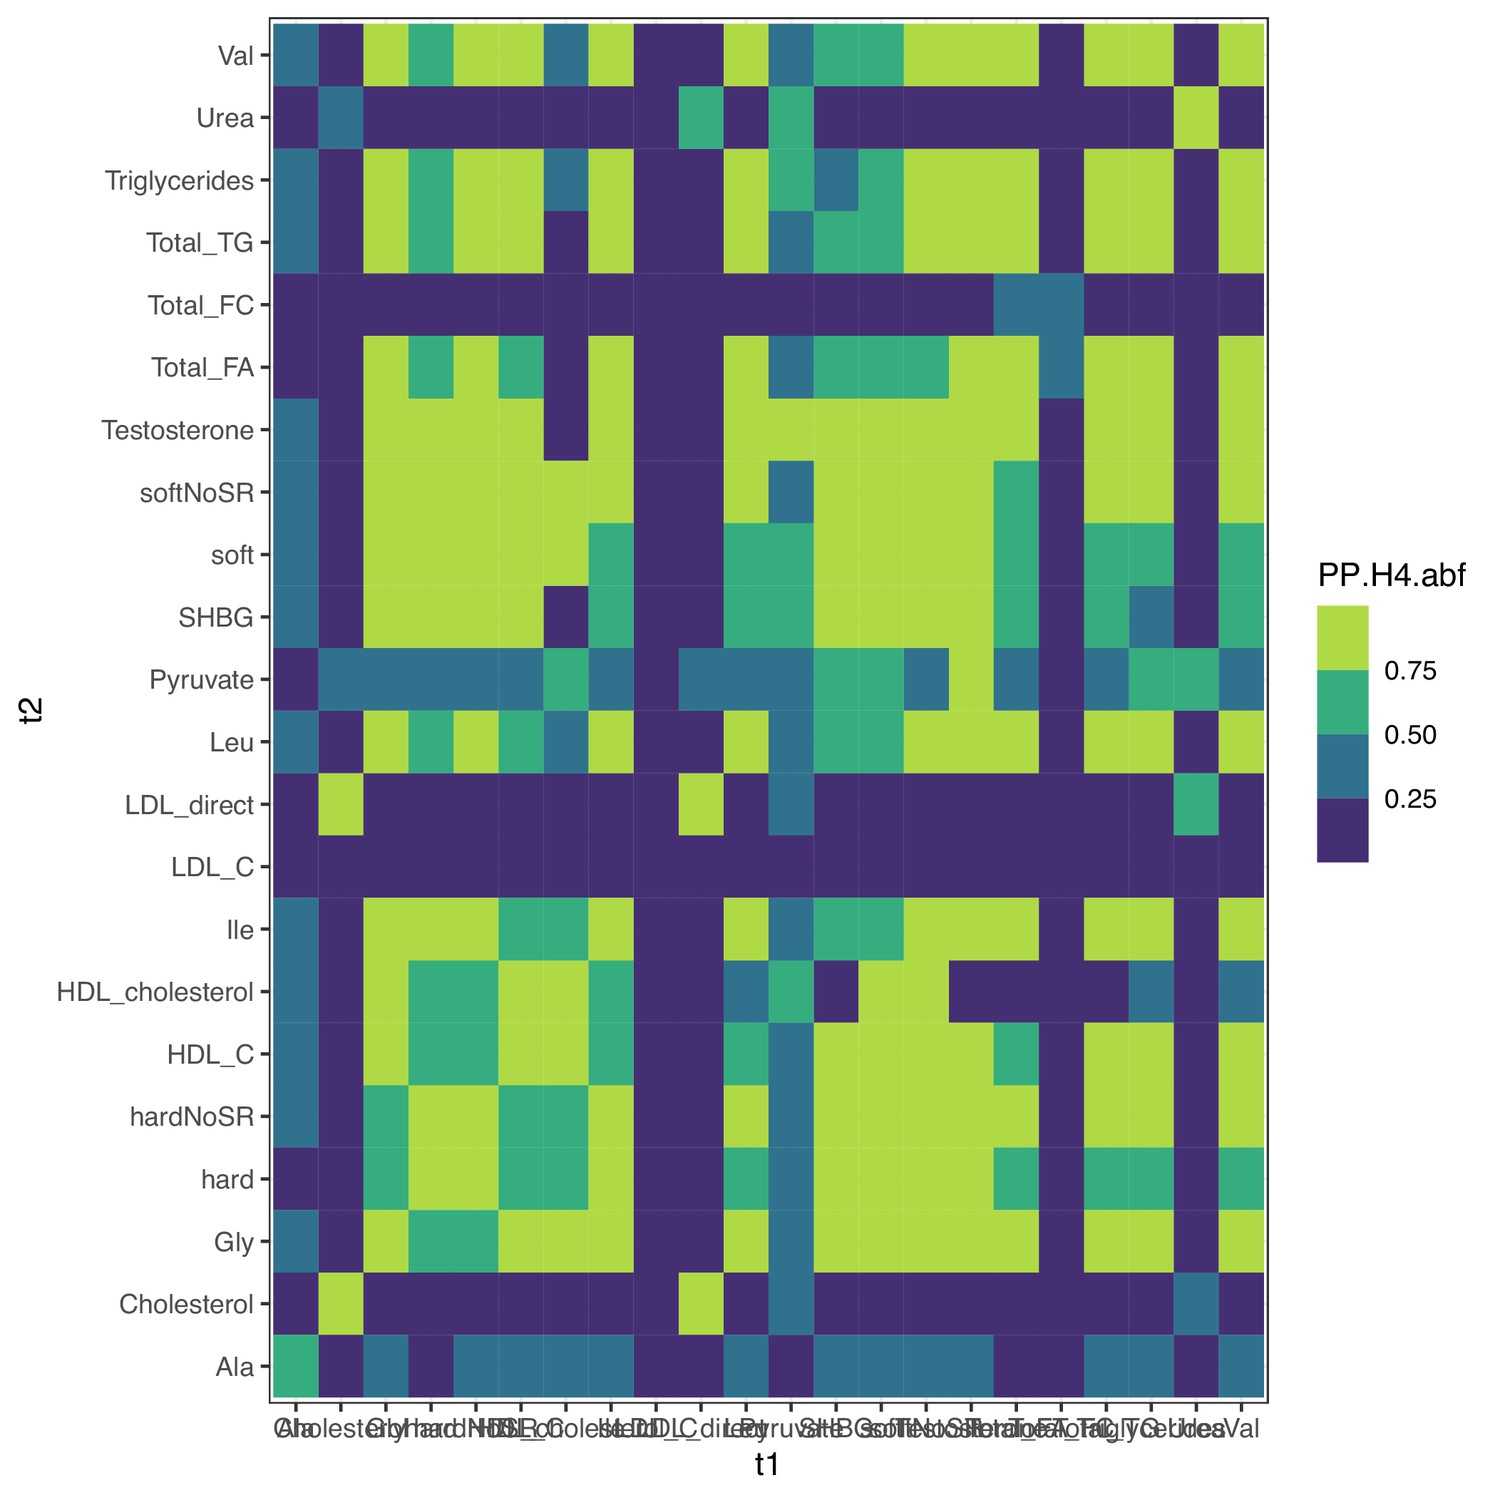
Colocalization at PCCB for metabolites.
Colocalization probabilities at PCCB for the joint association signals of all metabolites and clinical traits. hard, hard coronary artery disease (CAD); soft, soft CAD (with angina); SR, self-reported cases included. All traits except total free cholesterol (Total_FC), urea, low-density lipoprotein cholesterol (LDL), and total cholesterol colocalize together; LDL was initially well powered enough to detect multiple putative causal variants (Figure 7—figure supplement 3), supporting the alternative coloc pattern.
Figure 7—figure supplement 5
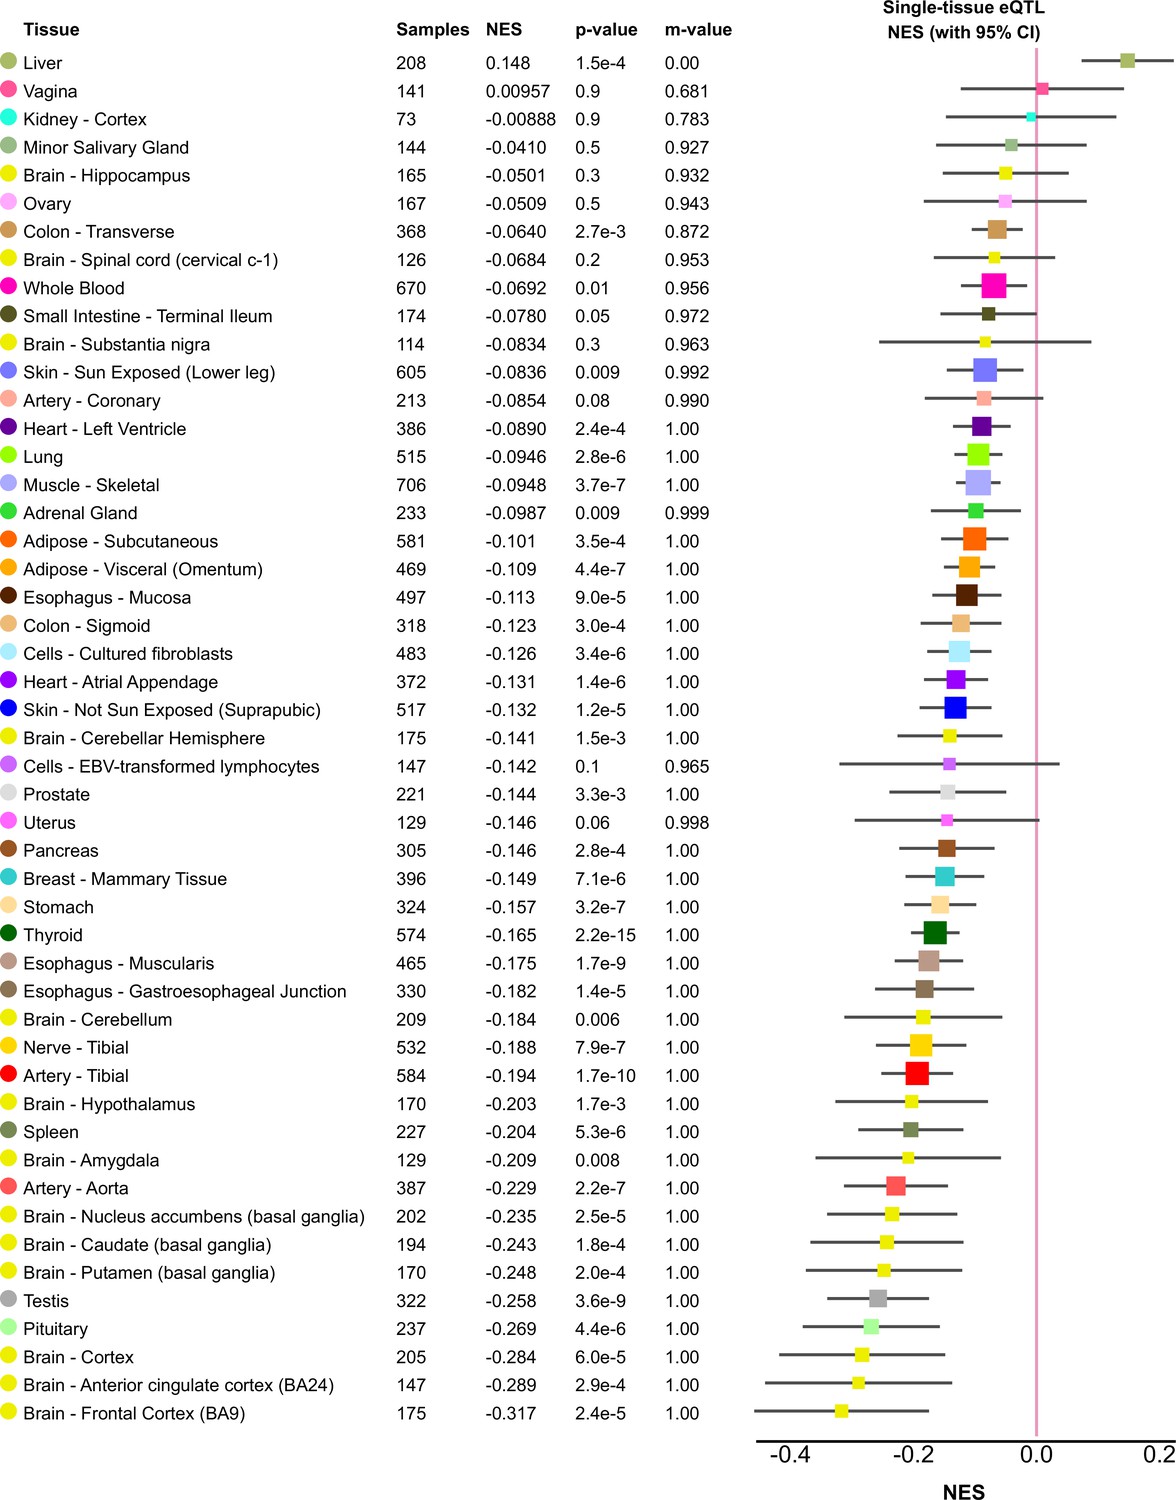
rs61791721 eQTL effects.
Tissue expression quantitative trait locus (eQTL) effects for the PCCB variant (rs61791721) in GTEx. Reproduced from https://gtexportal.org/home/snp/rs61791721(downloaded on February 12, 2022). N shown in figure and 95% confidence intervals are from linear regression of normalized expression as previously described.
Figure 7—figure supplement 6
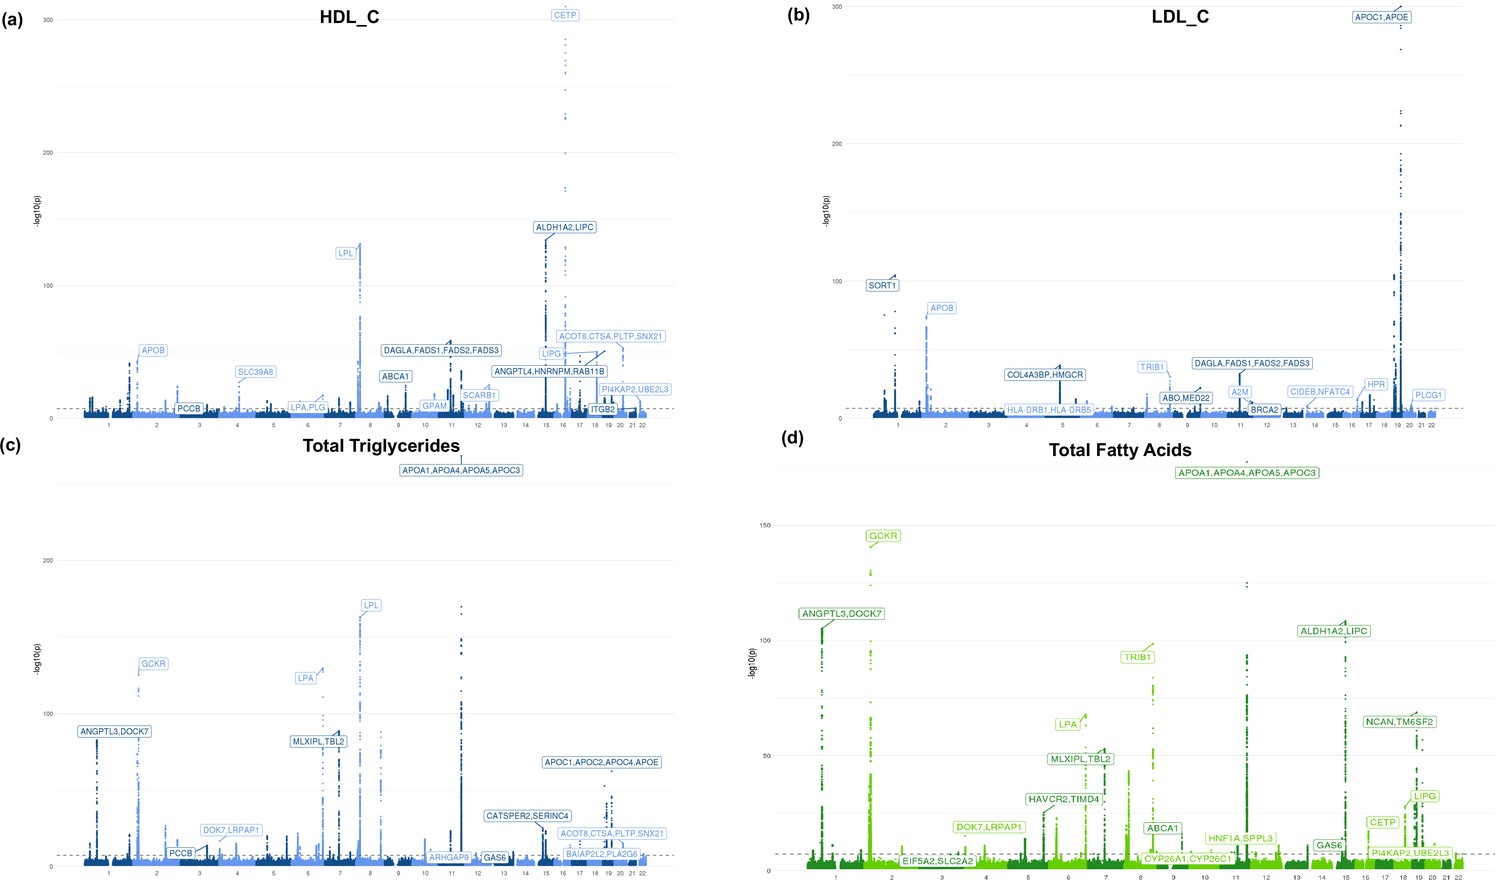
Additional Manhattan plots.
Manhattan plots for (a) high-density lipoprotein cholesterol (HDL-C), (b) low-density lipoprotein cholesterol (LDL-C), (c) total triglycerides, and (d) total fatty acids. Blue coloring represents metabolites belonging to the lipid group and green belongs to fatty acid group.
Additional files
-
Supplementary file 1
Metabolite HESS heritabilities.
Heritability results from HESS for each metabolite.
- https://cdn.elifesciences.org/articles/79348/elife-79348-supp1-v2.tsv
-
Supplementary file 2
Gene function sources.
Sources for biochemical characterization of genes mentioned in the variant vignettes.
- https://cdn.elifesciences.org/articles/79348/elife-79348-supp2-v2.xlsx
-
Supplementary file 3
Metabolite genome-wide association studies (GWAS) hits annotation.
Annotation for the 213 metabolite GWAS hits, including the assigned gene, assigned gene type, variant classification, and nearest gene.
- https://cdn.elifesciences.org/articles/79348/elife-79348-supp3-v2.tsv
-
Supplementary file 4
Gene biochemical groups.
The number of significant (p<1e-4) metabolite associations each metabolite genome-wide association studies (GWAS) gene had for each biochemical group. For a given gene, only biochemical groups that had at least one significant metabolite association were listed.
- https://cdn.elifesciences.org/articles/79348/elife-79348-supp4-v2.tsv
-
Supplementary file 5
Ancestry-inclusive genome-wide association studies (GWAS) hits.
List of additional metabolite GWAS hits from the ancestry-inclusive analysis that were not present in the European-only GWAS results.
- https://cdn.elifesciences.org/articles/79348/elife-79348-supp5-v2.tsv
-
Supplementary file 6
Discordant variant annotation.
List of each discordant variant–metabolite association, including the variant annotations and relevant metabolite pair genetic correlation and genome-wide association studies (GWAS) summary statistics.
- https://cdn.elifesciences.org/articles/79348/elife-79348-supp6-v2.tsv
-
Supplementary file 7
Local genetic correlation results.
Combined results for different methods of calculating the local genetic correlation for different pathways for alanine and glutamine, demonstrating the consistency across the different approaches.
- https://cdn.elifesciences.org/articles/79348/elife-79348-supp7-v2.tsv
-
Supplementary file 8
Metabolite associations with coronary artery disease (CAD).
Literature evidence and citations for metabolite associations with CAD.
- https://cdn.elifesciences.org/articles/79348/elife-79348-supp8-v2.xlsx
-
Supplementary file 9
PCCB genome-wide association studies (GWAS) results.
GWAS summary statistics for rs61791721 (PCCB) in the 16 metabolites.
- https://cdn.elifesciences.org/articles/79348/elife-79348-supp9-v2.tsv
-
MDAR checklist
- https://cdn.elifesciences.org/articles/79348/elife-79348-mdarchecklist1-v2.docx
Download links
A two-part list of links to download the article, or parts of the article, in various formats.
Downloads (link to download the article as PDF)
Open citations (links to open the citations from this article in various online reference manager services)
Cite this article (links to download the citations from this article in formats compatible with various reference manager tools)
Integrative analysis of metabolite GWAS illuminates the molecular basis of pleiotropy and genetic correlation
eLife 11:e79348.
https://doi.org/10.7554/eLife.79348


