Histone deacetylase 1 maintains lineage integrity through histone acetylome refinement during early embryogenesis
- Department of Developmental and Cell Biology, University of California, Irvine, United States
- Center for Complex Biological Systems, University of California, Irvine, United States
Figures
Figure 1 with 1 supplement

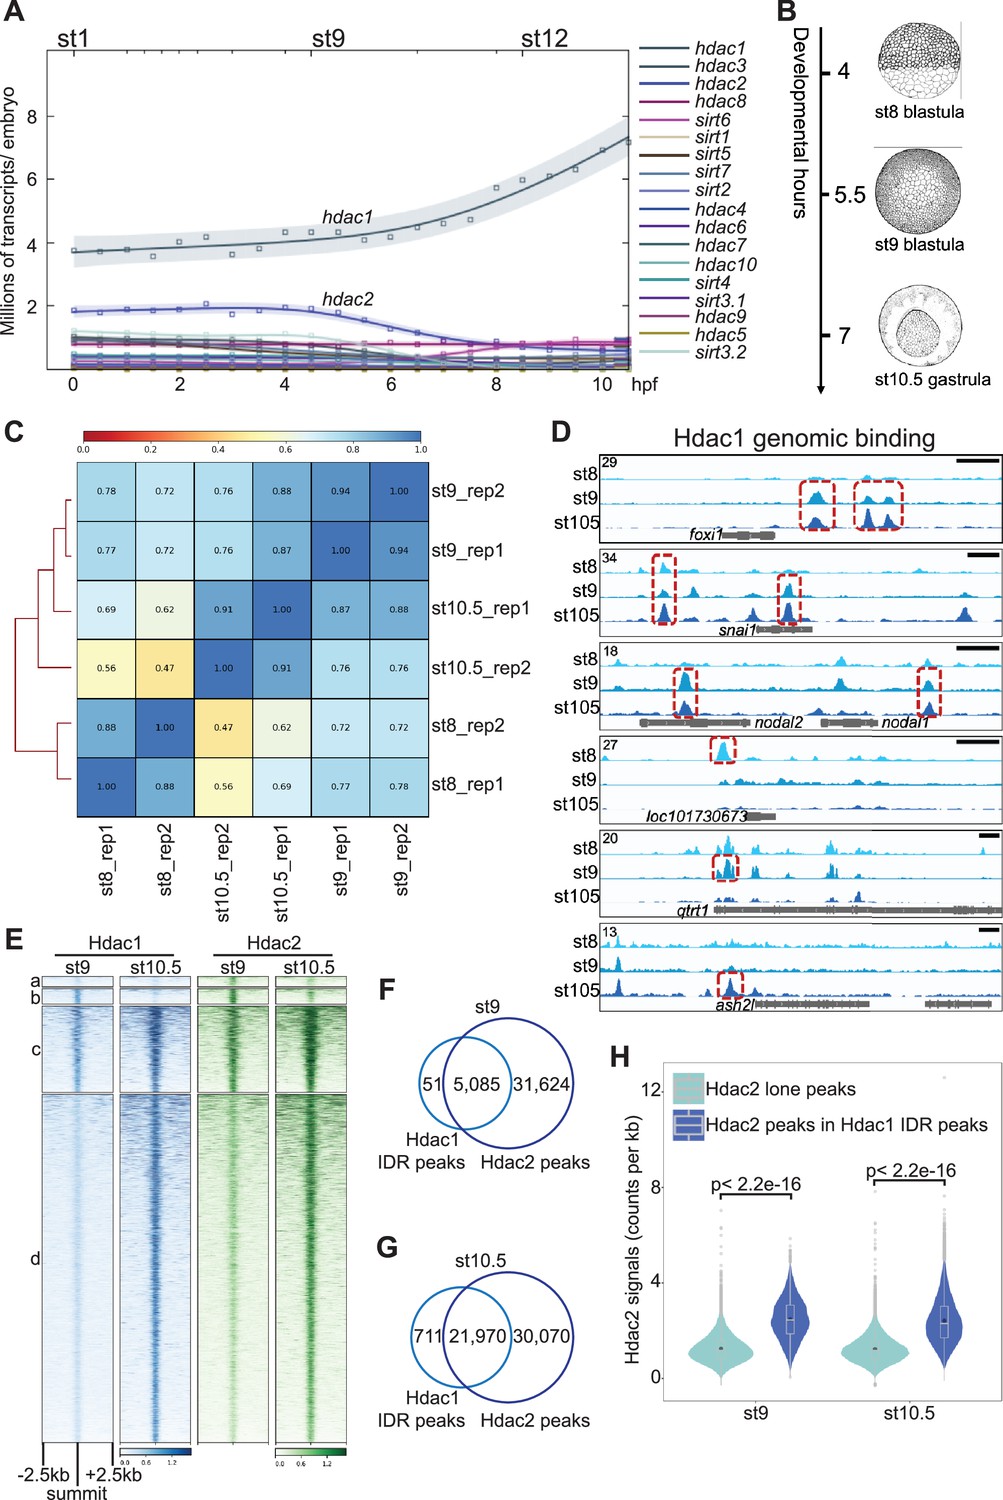
Hdac1 binds to the genome gradually during early Xenopus development.
(A) Western blot analyses showing Hdac1 and Hdac2 proteins over a time course of early development. β-Tubulin is used as a loading control. (B) Venn diagram comparing Hdac1 irreproducibility discovery rate (IDR) peaks among examined stages. The sums of peaks in st8 and st9 are smaller due to instances where more than one peak from st8 or st9 overlaps the same single st10.5 peak. (C) Clustered heatmap showing Hdac1 ChIP-seq signals at each stage over a window of 5 kb centered on the summit of all Hdac1 IDR peaks in descending order. (D) The expression levels (TPM, transcripts per million) of genes associated with Hdac1 clusters at different developmental periods. (E) Distributions of Hdac1 IDR peaks at each stage across five defined genomic features. The promoter is defined as −1 kb to +100 bp from TSS (transcription start site) while the TTS (transcription termination site) is defined as −100 bp to +1 kb from TTS. (F) Distributions of Hdac1 ChIP-seq signals within the intervals of 5 kb upstream of gene model 5′ ends, gene bodies (normalized for length), and 5 kb downstream of gene model 3′ ends at each stage. The signal of st9 input DNA ChIP-seq is used as a negative control. Y-axis values represent reads quantified by bins per million (BPM) at a bin size of 50 bp. (G) ChIP-qPCR showing Hdac1 enrichment on selected genomic regions (nine positive regions: alkbh2, fgf5, foxi4.2, gdnf, hhex, miR428a, not, snai1, and sp8; two negative regions: hspa4 and klf11) at indicated stages of early embryogenesis.
-
Figure 1—source data 1
Western blot analyses showing Hdac1 and Hdac2 proteins during Xenopus embryogenesis.
- https://cdn.elifesciences.org/articles/79380/elife-79380-fig1-data1-v2.zip
Figure 1—figure supplement 1
Hdac1 genomic occupancy in early Xenopus development.
(A) Time-course expression levels of HDACs revealed by ribo-depleted RNA-seq (rdRNA-seq) in Xenopus tropicalis. (B) Graphic illustration of examined stages during early Xenopus development: st8 mid-blastula, st9 late blastula, and st10.5 early gastrula (Nieuwkoop and Faber, 1994). (C) Pearson correlation analyses of intra- and inter-stage Hdac1 ChIP-seq samples. (D) Genome browser visualization of Hdac1peaks on foxi1, snai1, nodal1, nodal2, loc101730673, qtrt1, and ash2l. Red boxes represent irreproducibility discovery rate (IDR) peaks passing IDR threshold (see Materials and methods) on listed genes (not all IDR peaks are boxed). Y-axis values represent scaled track height. Black bars denote an interval of 2 kb. (E) Clustered Hdac1 heatmap (left panel) over a window of 5 kb centered on the summit of all Hdac1 IDR peaks in descending order. Hdac2 ChIP-seq signals present around Hdac1 IDR peaks (right panel). Venn diagrams comparing Hdac1 IDR peak and Hdac2 peak (non-IDR) overlaps at st9 (F) and st10.5 (G). (H) Violin plot showing intensity differences of Hdac2 signals between Hdac2–Hdac1 overlapped peaks versus Hdac2 lone peaks at stages 9 and 10.5. Student’s t-test is used to calculate p-values.
Figure 2 with 1 supplement
Maternal factors instruct Hdac1 recruitment during blastula stages.
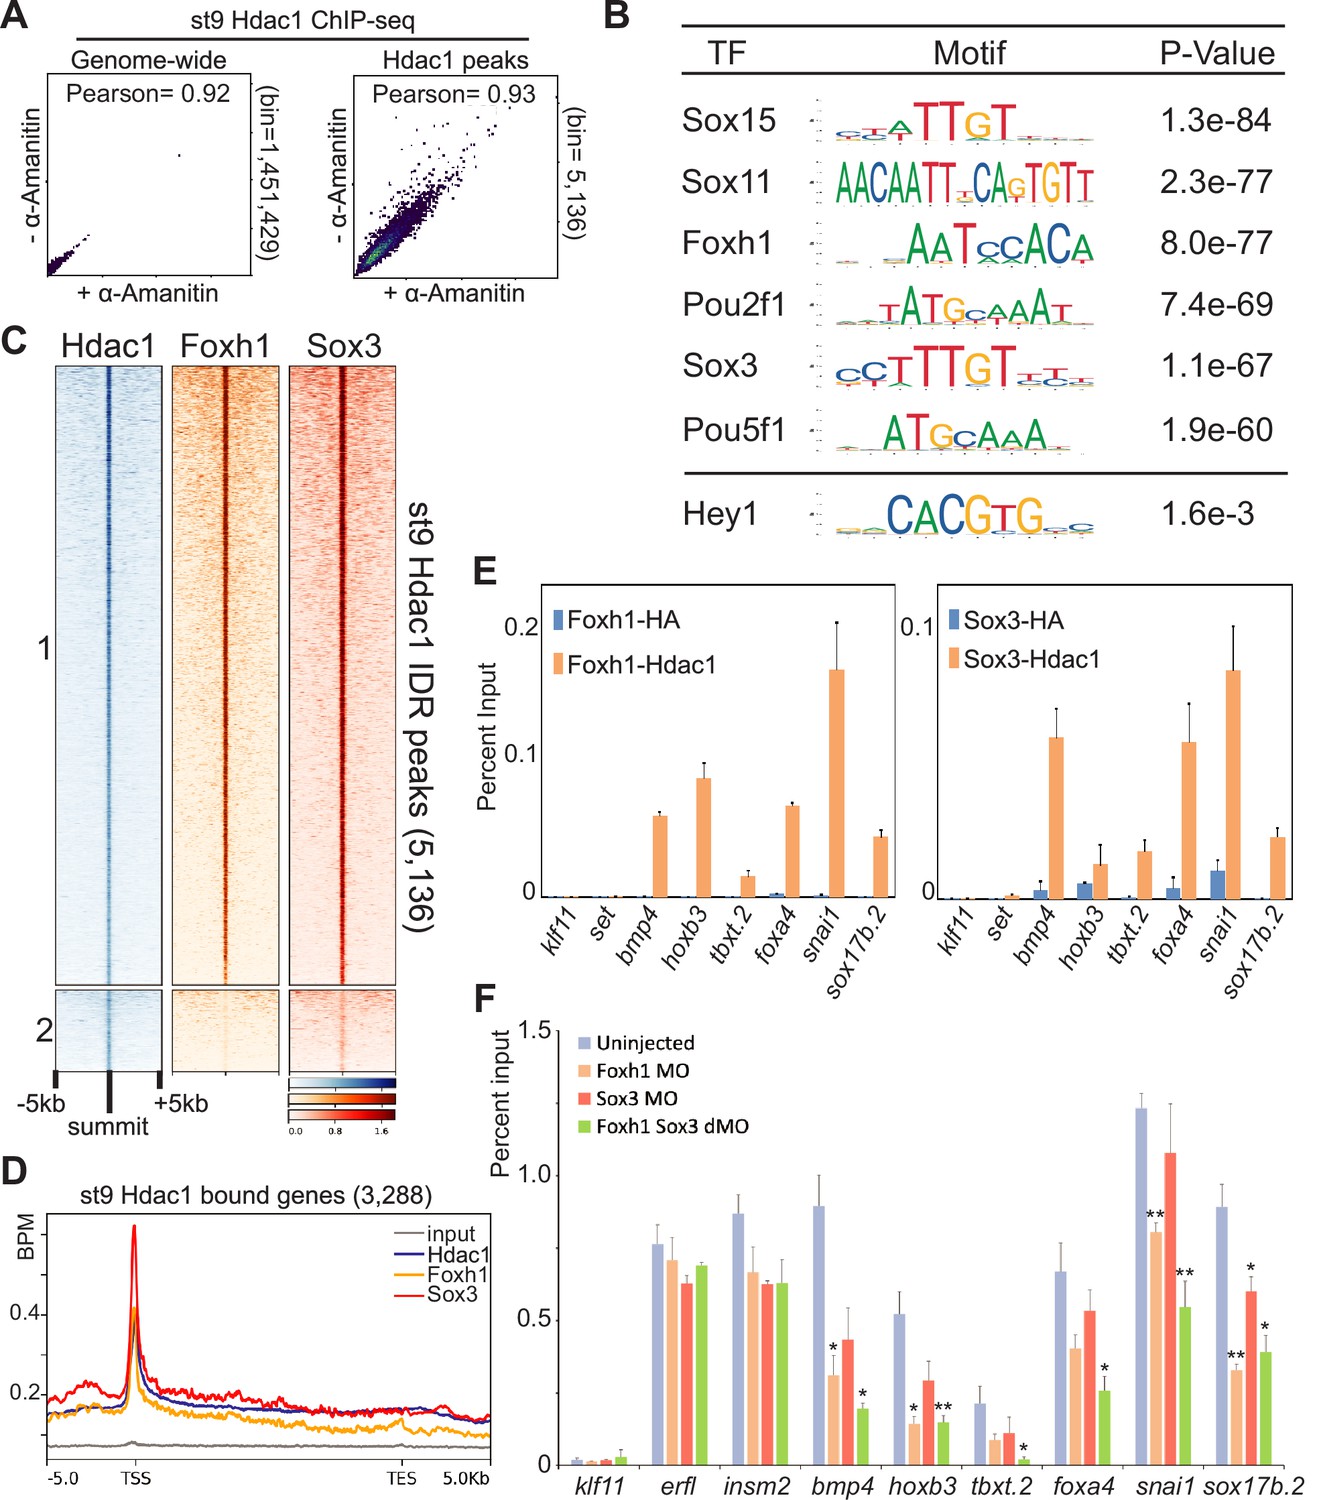
(A) Pairwise Pearson correlation analyses comparing ChIP-seq signals of st9 Hdac1 irreproducibility discovery rate (IDR) peaks between α-amanitin-injected and uninjected embryos across the genome (left) and among Hdac1 IDR peaks (right). (B) Motif analyses of st9 Hdac1 peaks (500 bp centered on IDR peak summit). Motif sequence to the corresponding factor is retrieved from JASPAR. Hey1 is an example of TF motif with low significance. (C) Clustered heatmap depicting st9 Foxh1 and Sox3 ChIP-seq signals in a window of 10 kb centered on st9 Hdac1 IDR peaks with descending order. (D) ChIP-seq signal enrichment of Hdac1, Foxh1, and Sox3 within the intervals of 5 kb upstream of gene model 5′ ends, gene bodies (normalized for length), and 5 kb downstream of gene model 3′ ends of st9 Hdac1 associated genes. The signal of st9 input DNA ChIP-seq is used as a negative control. Y-axis values represent reads quantified by bins per million (BPM) at a bin size of 50 bp. (E) St9 sequential ChIP-qPCR analyses for Foxh1 and Hdac1 co-bound regions and Sox3 and Hdac1 co-bound regions. anti-HA is used as a negative control. The error bars represent the variation from two technical replicates. (F) ChIP-qPCR analysis of Hdac1 peaks that are also Foxh1/Sox3 co-bound after Foxh1 and/or Sox3 depletion. Genomic loci associated with klf11 (no Hdac1 signals), erfl and insm2 (Hdac1 signals without Foxh1 or Sox3 signals) are negative controls. The error bars represent the variation from two technical replicates. Student’s t-test is used to calculate p-values over Hdac1 enrichment of uninjected embryos. * is for p< 0.05** is for p< 0.01.
Figure 2—figure supplement 1
Hdac1 binding to genome is instructed maternally.
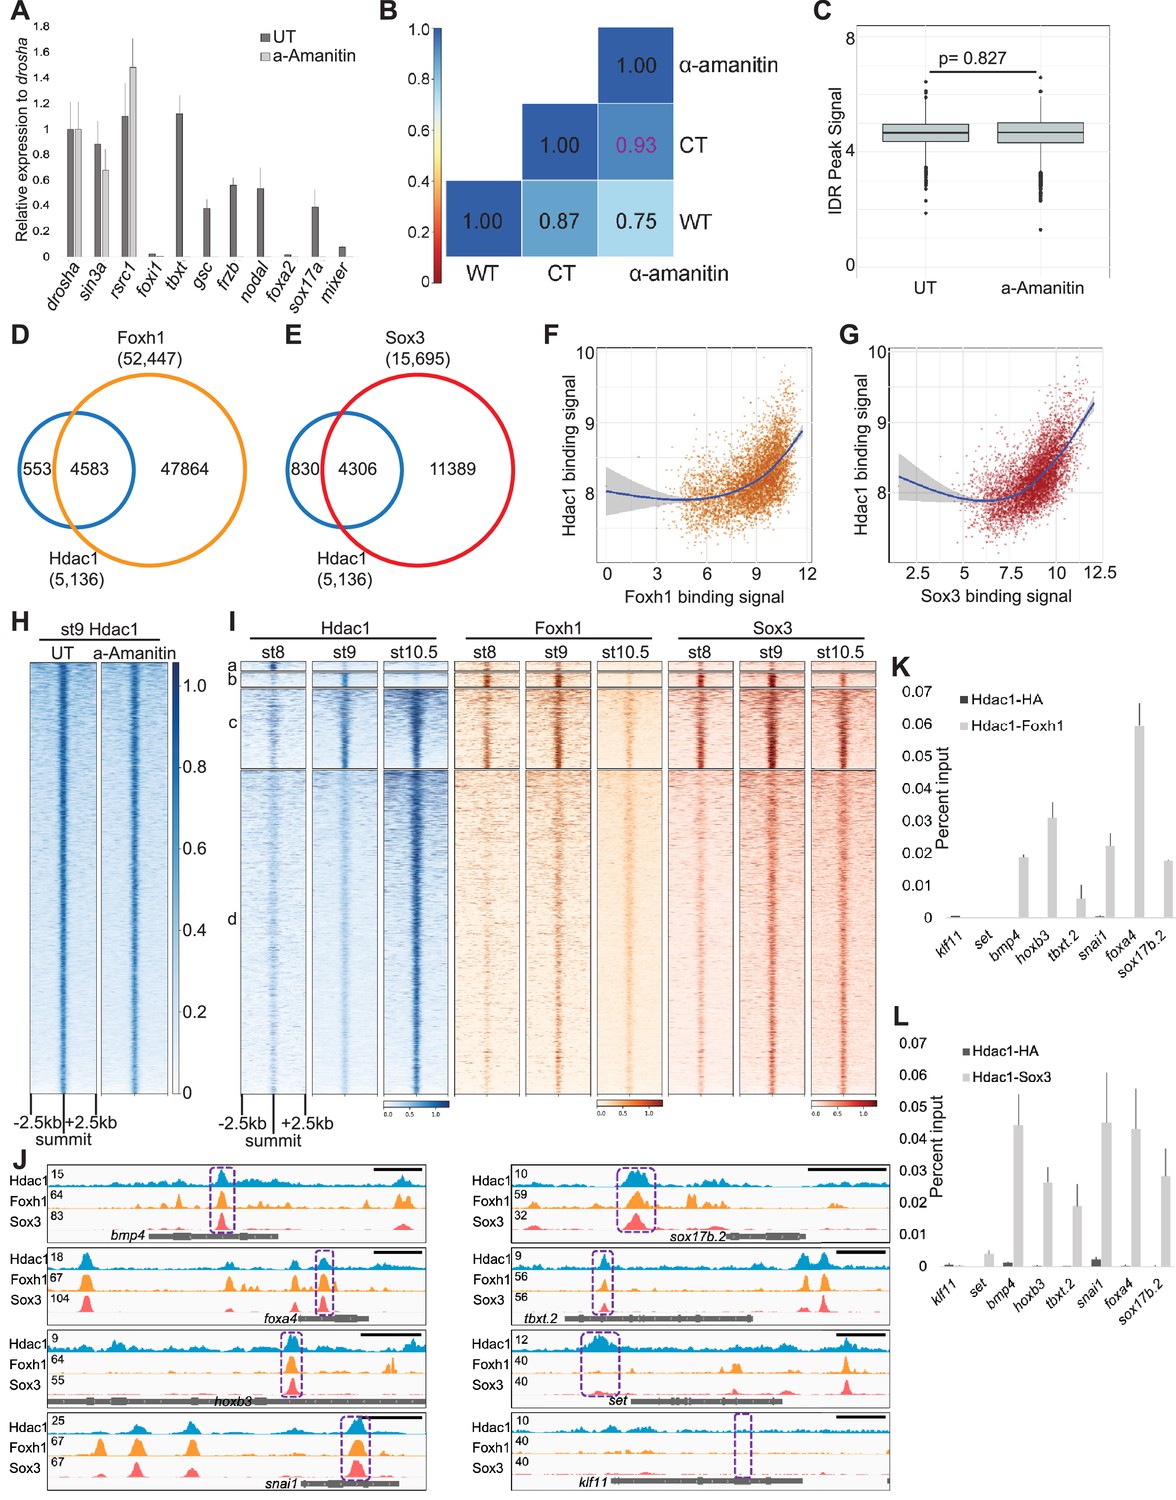
(A) Real-time quantitative PCR (RT-qPCR) analysis of maternal (maternal-zygotic) genes (drosha, sin3a, and rsrc1) and zygotic genes (foxi1, tbxt, gsc, frzb, nodal, foxa2, sox17a, and mixer). Note a high efficacy of α-amanitin blocking zygotic transcription. The error bars represent the variation from two technical replicates. (B) Pairwise Pearson correlation analyses comparing ChIP-seq signals of st9 Hdac1 irreproducibility discovery rate (IDR) peaks with controls. WT, CT, and α-amanitin denote wild-type samples from previous time-course experiments (Owens et al., 2016), α-amanitin-injected embryos, and stage (batch)-matched control embryos. (C) Box plot illustrating Hdac1 signal enrichment are unchanged between uninjected and α-amanitin-injected embryos at stage 9. Y-axis values represent log2(reads to IDR peaks/(peak size × read depth at IDR peaks) + 1). p-Value is calculated by two-tailed Student’s t-test. (D, E) Venn diagram showing the overlap between st9 IDR peaks of Foxh1 and Hdac1; Sox3 and Hdac1. (F, G) Scatter plots representing a positive correlation between binding signals of Foxh1 and Hdac1, and Sox3 and Hdac1. The binding signal is calculated as log2(reads mapped to st9 Hdac1 IDR peaks per kb + 1). Blue lines depict linear regression curves generated from a generalized additive model. Gray areas denote a 95% confidence interval. (H) Heatmap showing Hdac1 ChIP-seq signals between uninjected and α-amanitin-injected embryos in a window of 5 kb centered on st9 Hdac1 IDR peaks with descending order. (I) Clustered heatmaps depicting Foxh1 and Sox3 ChIP-seq signals on stage 8, 9, and 10.5 Hdac1 IDR peaks in a window of 5 kb centered on Hdac1 peaks. Each cluster corresponds to the same regions present in Figure 1C. (J) Genome browser visualization of Hdac1, Foxh1, and Sox3 signals on bmp4, foxa4, hoxb3, snai1, sox17b.2, tbxt.2, set, and klf11 genes. Purple boxes represent genomic regions examined in sequential ChIP-qPCR experiments. Y-axis values represent scaled track height. Black bars denote an interval of 2 kb. Reciprocal sequential ChIP-qPCR analyses representing Figure 2D, E assessing (K) Foxh1 and Hdac1 co-bound regions; (L) Sox3 and Hdac1 co-bound regions. anti-HA is used as a negative control. The error bars represent the variation from two technical replicates.
Figure 3 with 1 supplement
Hdac1 binds to cis-regulatory modules (CRMs) containing functionally distinct histone modifications.
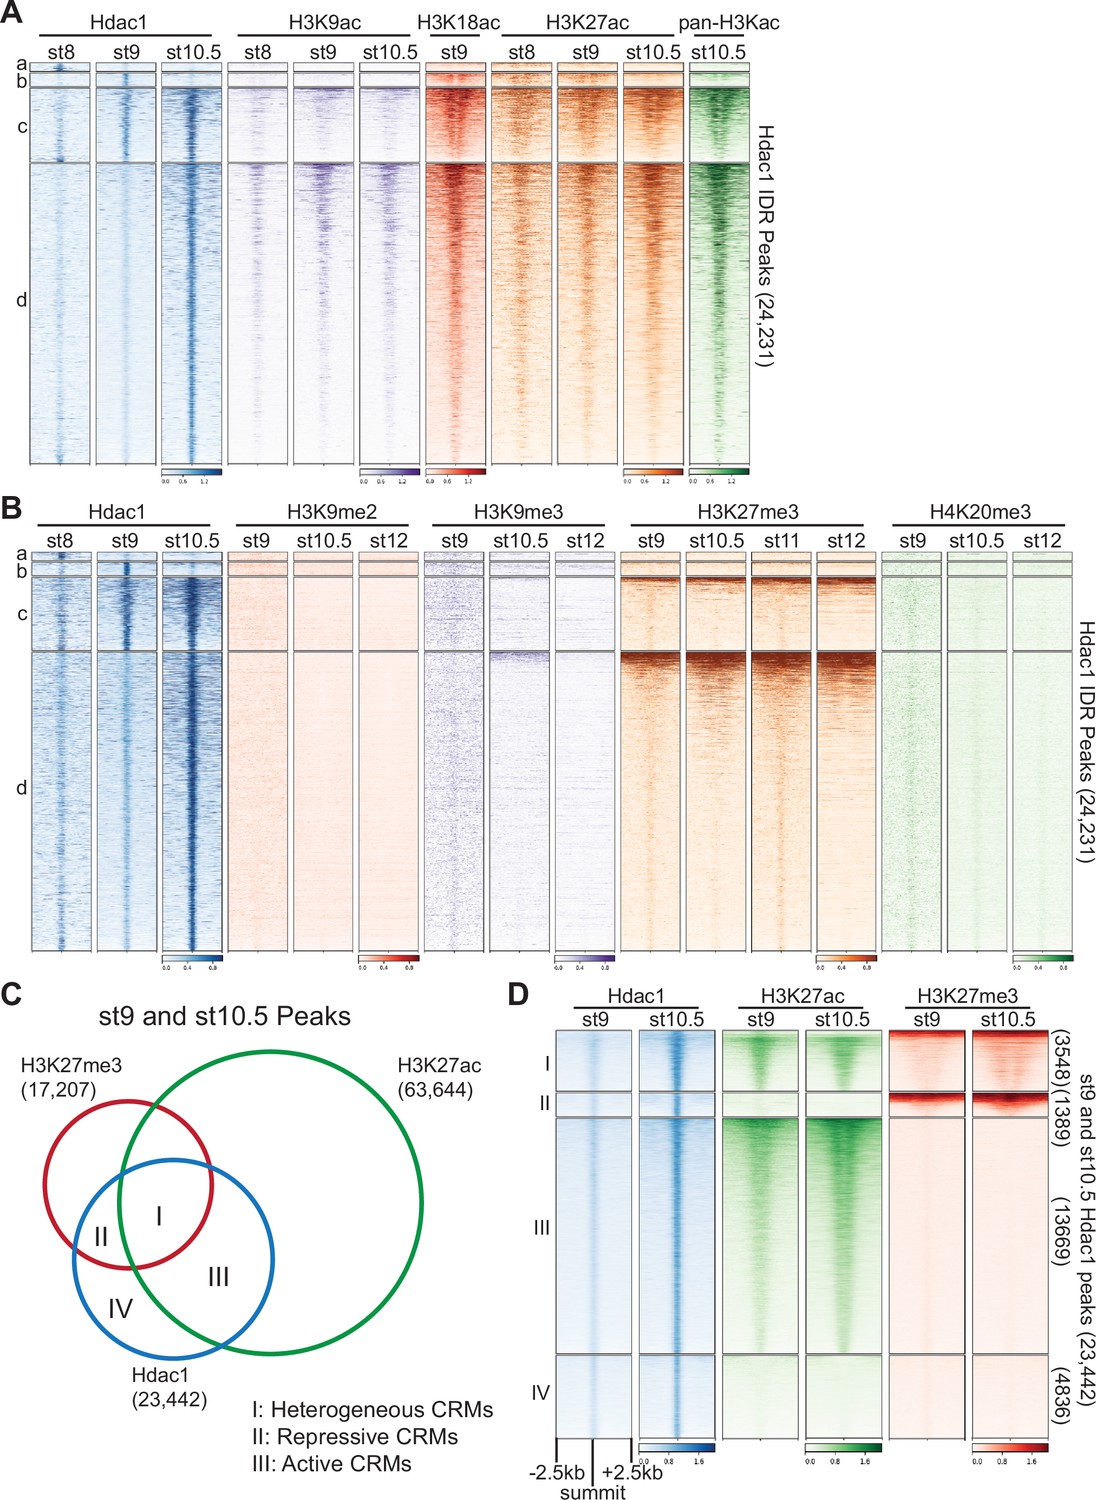
Clustered heatmaps showing signals from several stages of various (A) histone acetylation marks and (B) repressive histone methylation marks on Hdac1 peaks. Each cluster corresponds to the same regions present in Figure 1C. (C) Venn diagram illustrating Hdac1 peaks overlapping with H3K27me3 and H3K27ac peaks from both st9 and st10.5 combined. (D) Clustered heatmaps depicting signals of H3K27me3 and H3K27ac on combined st9 and st10.5 Hdac1 peaks. Clusters denote the same genomic regions in C. Numbers on the right side indicate the total number of regions in each cluster. The signals are shown in a window of 5 kb centered on the summits of Hdac1 peaks presented in descending order of track signal intensities within each cluster.
Figure 3—figure supplement 1
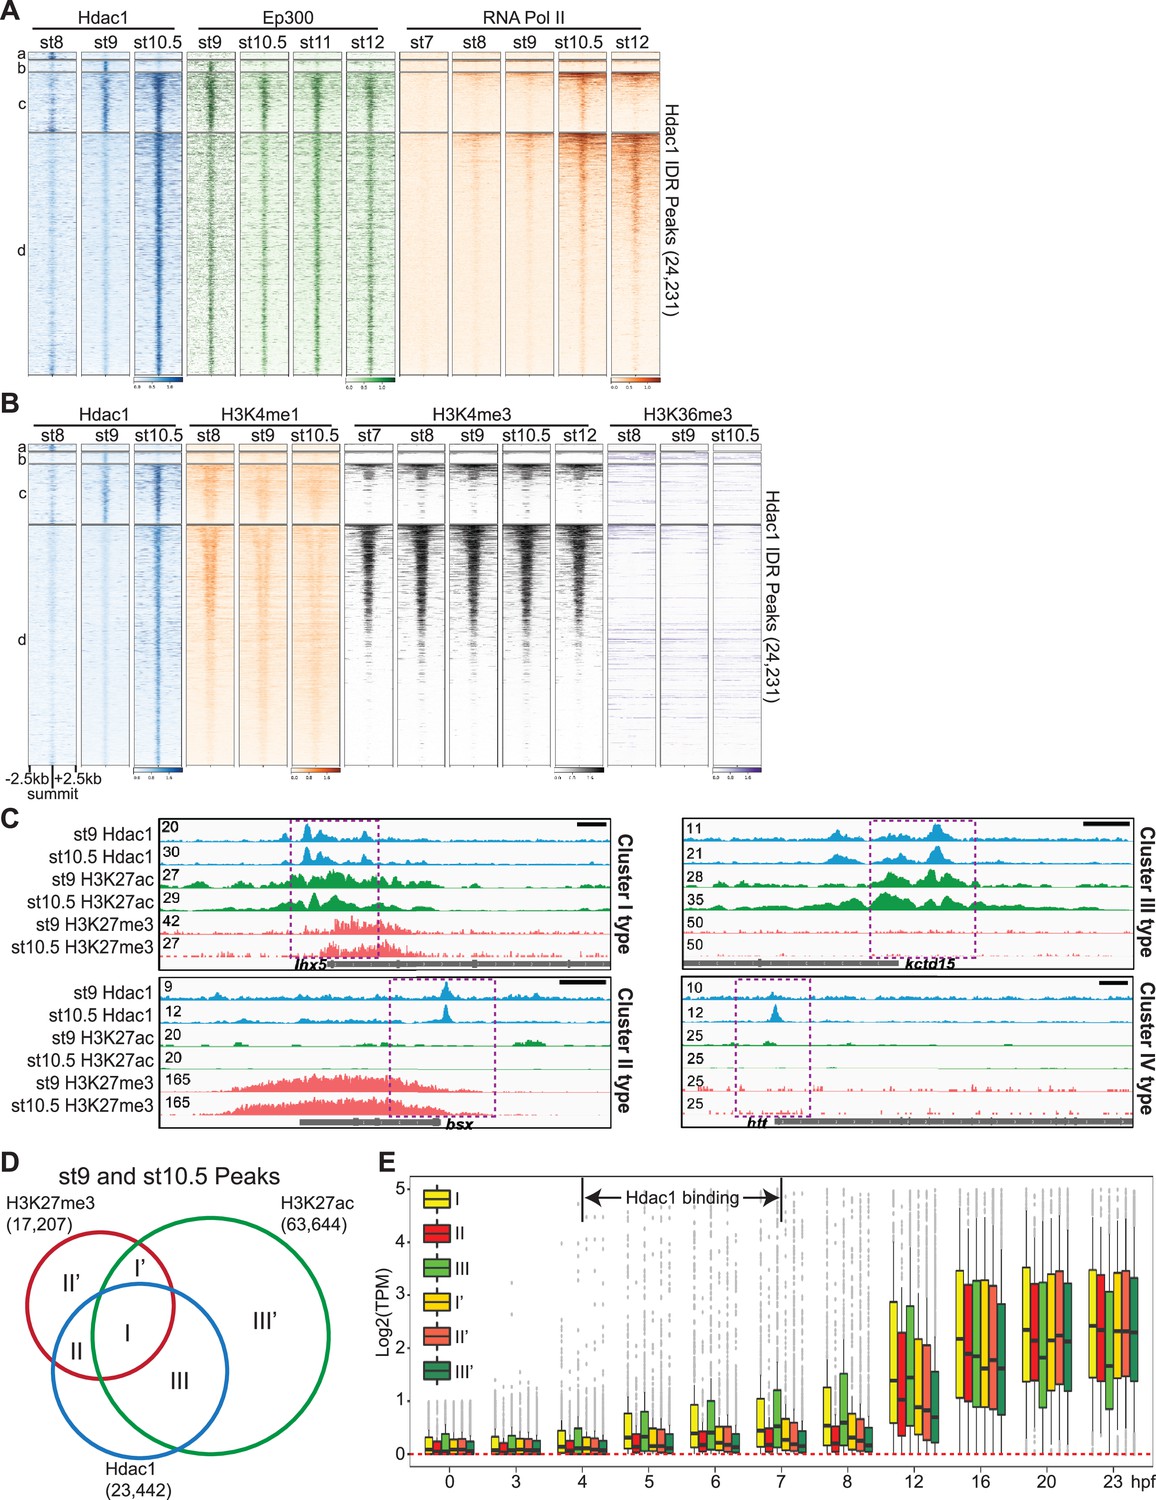
Hdac1-bound cis-regulatory modules (CRMs) are marked with distinct epigenetic signatures.
Clustered heatmaps showing signals across several stages of (A) Ep300, RNA polymerase II, and (B) various active histone methylation marks on Hdac1 peaks. The signals are shown in a window of 5 kb centered on the summits of Hdac1 peaks. The signal density within each cluster is ordered by RNA polymerase II in (A) and by all samples in (B) by descending order. Each cluster corresponds to the same region in Figure 1C. (C) Genome browser visualization of Hdac1, H3K27ac, and H3K27me3 signals on genes representing Hdac1 CRM Clusters: Cluster I (lhx5), Cluster II (bsx), Cluster III (kctd15), and Cluster IV (htt). Y-axis values represent scaled track height. Black bars denote an interval of 2 kb. (D) Venn diagram showing Hdac1 peaks overlapping with H3K27me3 and H3K27ac peaks from both st9 and st10.5 combined. Additional clusters (I’, II’, and III’) represent genomic regions with the same H3K27 modifications to clusters (I, II, and III) but lack Hdac1 binding. (E) The expression levels of genes associated with six clusters in Figure 3D from 0 hr post-fertilization (egg) to 23 hpf (st26, tailbud).
Figure 4 with 3 supplements
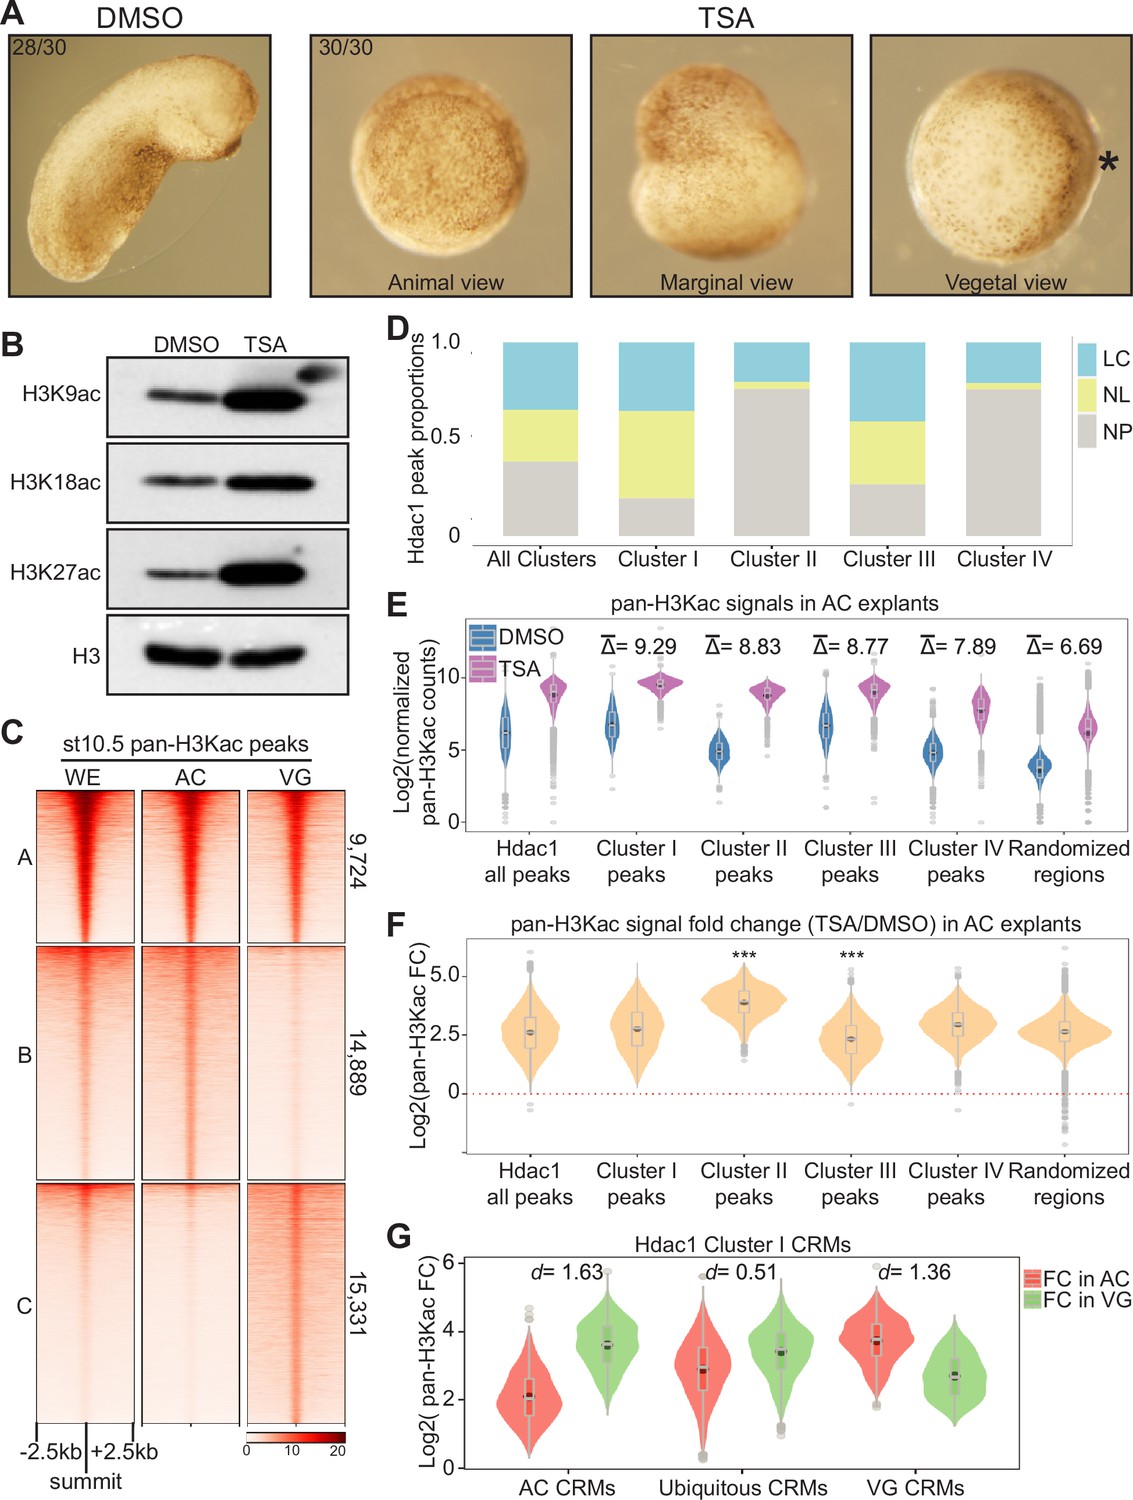
Hdac1 maintains differential H3 acetylomes between germ layers.
(A) Embryos treated with 100 nM Trichostatin A (TSA) displaying gastrulation defects 24 hr post-fertilization. Asterisk denotes the dorsal side containing the early blastopore lip. (B) Western blot analyses showing various histone acetylation modifications affected by HDAC inhibition. Anti-H3 is used as a loading control. (C) Clustered heatmap depicting signals of pan-H3Kac at st10.5 in whole embryos (WE), animal cap (AC), and vegetal mass (VG) cells. The signals are shown in a window of 5 kb centered on the summits of combined AC and VG peaks presented in descending order within each cluster. (D) Stacked bar graph representing proportions of localized (LC) versus non-localized (NL) pan-H3Kac signals found at Hdac1 cis-regulatory module (CRM) clusters in Figure 3C. A Hdac1 peak is considered to exhibit localized pan-H3Kac if it overlaps with either AC- or VG-specific pan-H3Kac peaks (Cluster B or C in C); a Hdac1 peak is considered to exhibit non-localized pan-H3Kac if it overlaps with pan-H3Kac peaks shared between AC and VG (Cluster A in C). NP: not overlap with any pan-H3Kac peak. (E) Spike-in normalized pan-H3Kac signals across Hdac1 CRM clusters (clusters in Figure 3C) in Dimethy Sulfoxide (DMSO)- or TSA-treated AC explants. represents the log2 scaled average differences of spike-in normalized pan-H3Kac signals between DMSO- and TSA-treated AC explants. Randomized genomic regions (n = 23,442) are used as the negative control. (F) Fold changes (FC) of pan-H3Kac signals at Hdac1 CRM clusters (clusters in Figure 3C) in DMSO- or TSA-treated AC explants. Red dotted line denotes the level of zero. *** denotes p < 0.001 (Student’s t-test). (G) Fold changes (FC) of pan-H3Kac signals in Cluster I of Hdac1 CRM clusters (clusters in Figure 3C) for each spatial CRM category. d denotes effect size calculated by Cohen’s d.
-
Figure 4—source data 1
Western blot analyses showing various histone acetylation modifications after HDAC inhibition.
- https://cdn.elifesciences.org/articles/79380/elife-79380-fig4-data1-v2.zip
Figure 4—figure supplement 1
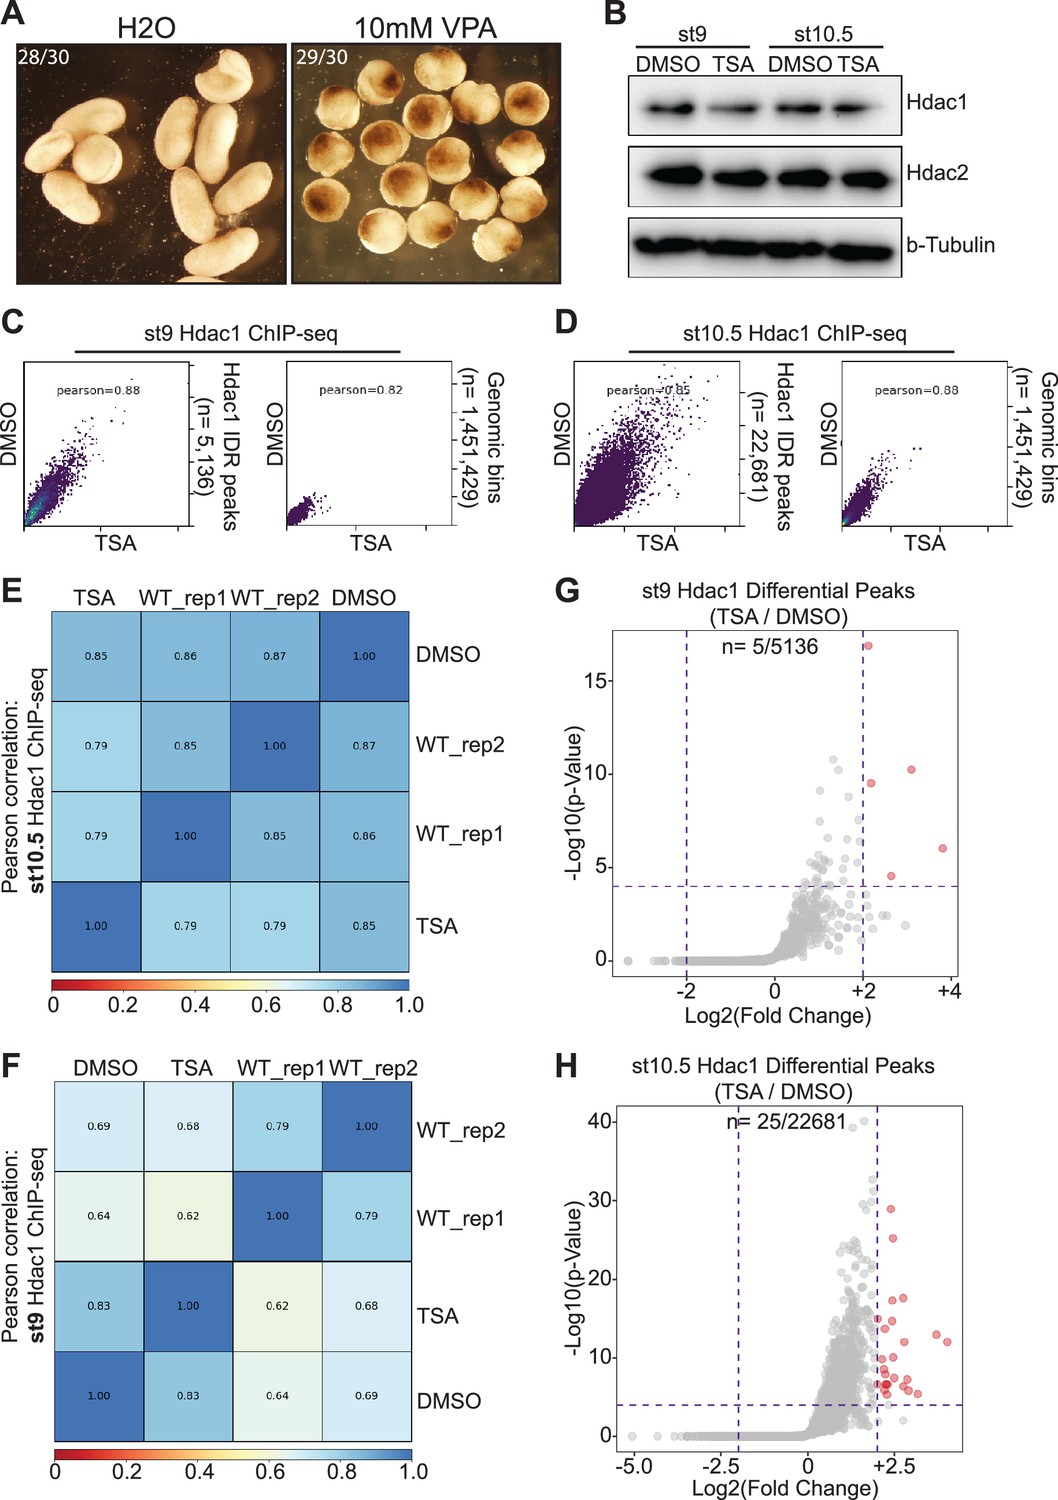
Trichostatin A (TSA)-mediated HDAC inhibition does not alter Hdac1 genomic occupancy.
(A) Embryos treated with 10 mM valproic acid (VPA) display gastrulation defects at 24 hr post-fertilization. (B) Western blot analyses showing protein levels of Hdac1 and Hdac2 upon TSA treatment in st9 and st10.5 embryos. b-Tubulin is used as a loading control. (C, D) Pairwise Pearson correlation analyses comparing Hdac1 ChIP-seq signals of (C) st9 and (D) st10.5 DMSO- and TSA-treated embryos. (E, F) Pairwise Pearson correlation analyses comparing Hdac1 ChIP-seq signals of (E) st9 and (F) st10.5 DMSO- and TSA-treated embryos among different sample batches. WT denotes two biological replicate samples from time-course experiments. (G, H) Differential ChIP-seq analysis of (G) st9 and (H) st10.5 Hdac1 ChIP-seq between DMSO- and TSA-treated embryos. Red dots denote significant and gray dots denote nonsignificant differential irreproducibility discovery rate (IDR) peaks.
-
Figure 4—figure supplement 1—source data 1
Western blot analyses of Hdac1 and Hdac2 proteins upon TSA treatment in st9 and st10.5 embryos.
- https://cdn.elifesciences.org/articles/79380/elife-79380-fig4-figsupp1-data1-v2.zip
Figure 4—figure supplement 2
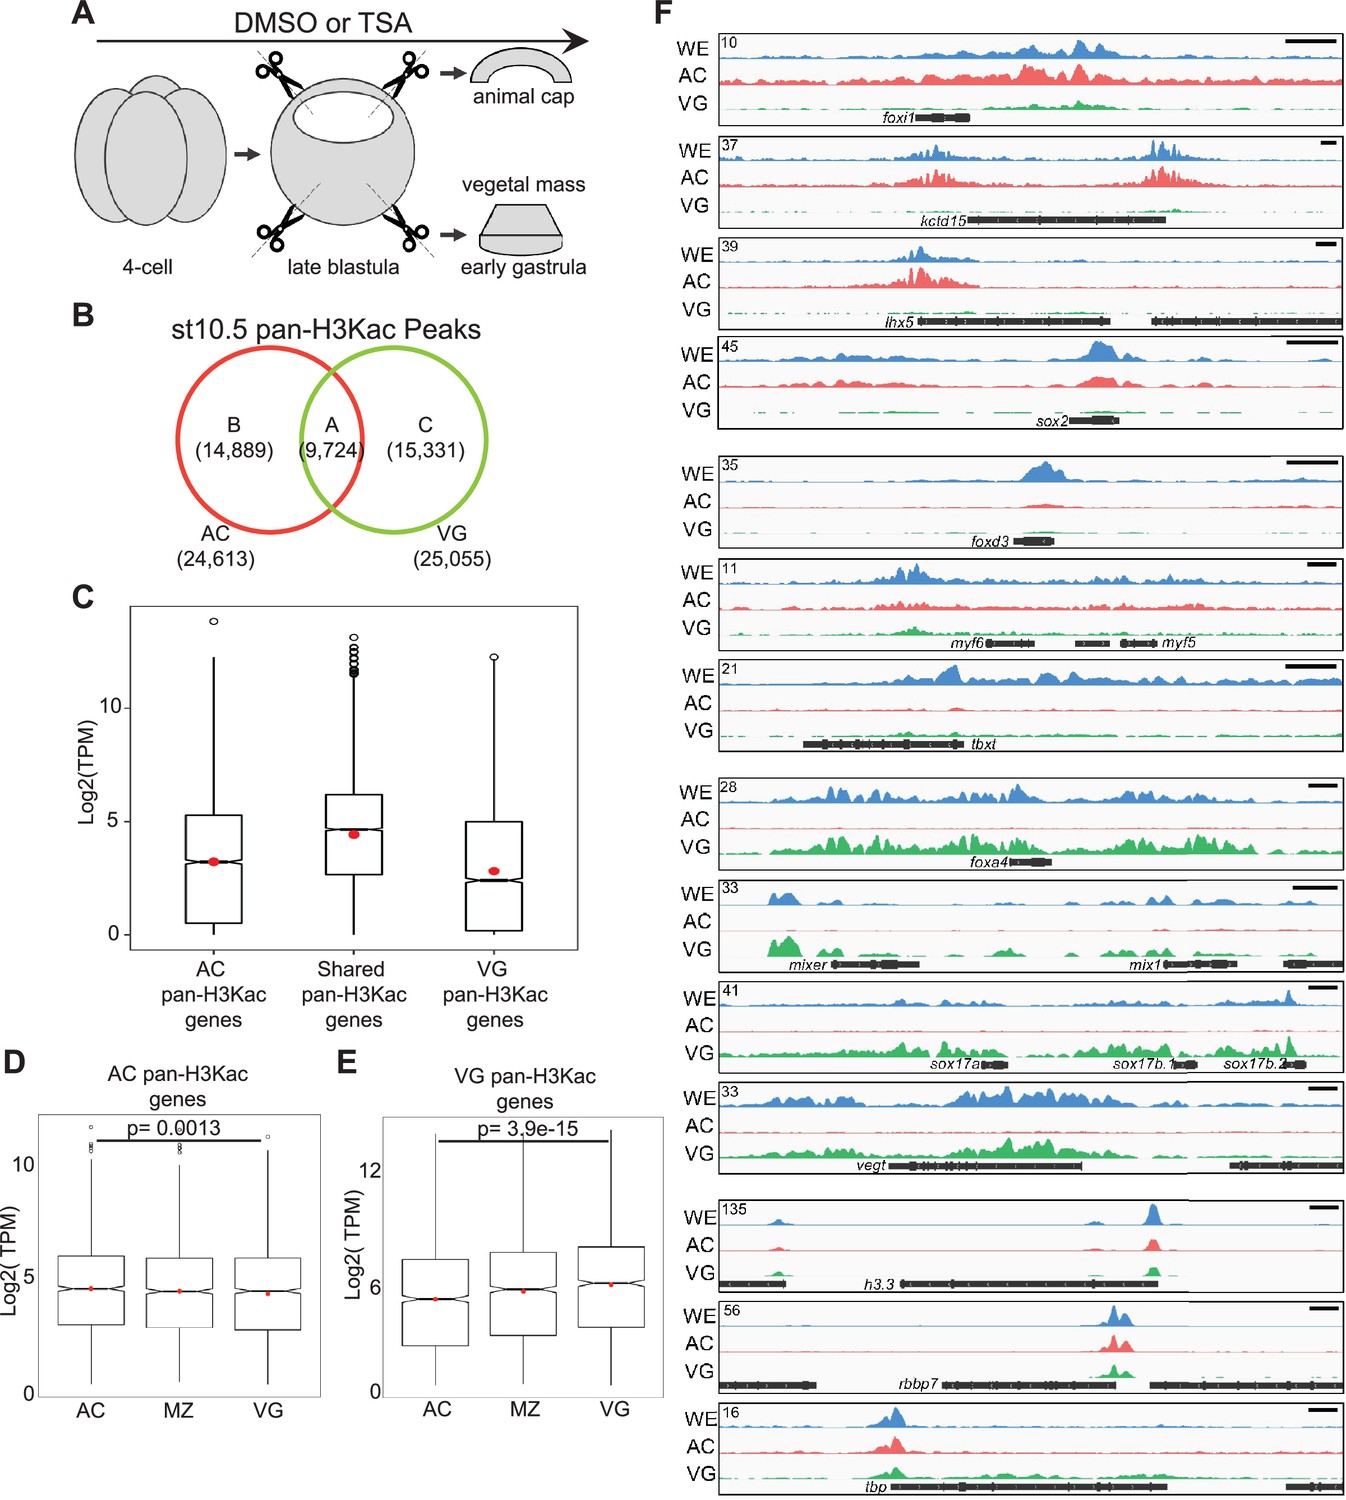
Differential H3 acetylomes are established in different germ layers.
(A) A schematic diagram of dissection experiments to separate animal cap tissues (AC) and vegetal mass tissues (VG) for ChIP-seq or RNA-seq. Late blastula stage explants were cultured ~1–1.5 hr to the early gastrula stage before being harvested for analyses. (B) Venn diagram comparing pan-H3Kac peaks in AC and VG. (C) Transcripts per million (TPM) expression of genes associated with distinct spatial pan-H3Kac clusters in Figure 4C. (D, E) Transcripts per million (TPM) expression of genes associated with (D) AC-specific pan-H3Kac and (E) VG-specific pan-H3Kac peaks across three germ layers. p-Values are calculated by Student’s t-test. (F) Genome browser visualization of pan-H3Kac signals at known ectodermal (foxi1, kctd15, lhx5, sox2), mesodermal (foxd3, myf5, myf6, tbxt), endodermal (foxa4, mixer, mix1, sox17a, sox17b.1, sox17b.2, vegt), and ‘housekeeping’ (h3.3, rbbp7, tbp) genes in whole embryos, AC, and VG explants. Y-axis values represent scaled track height. Black bars denote an interval of 2 kb.
Figure 4—figure supplement 3
Germ-layer-specific H3 acetylomes require HDAC activity.
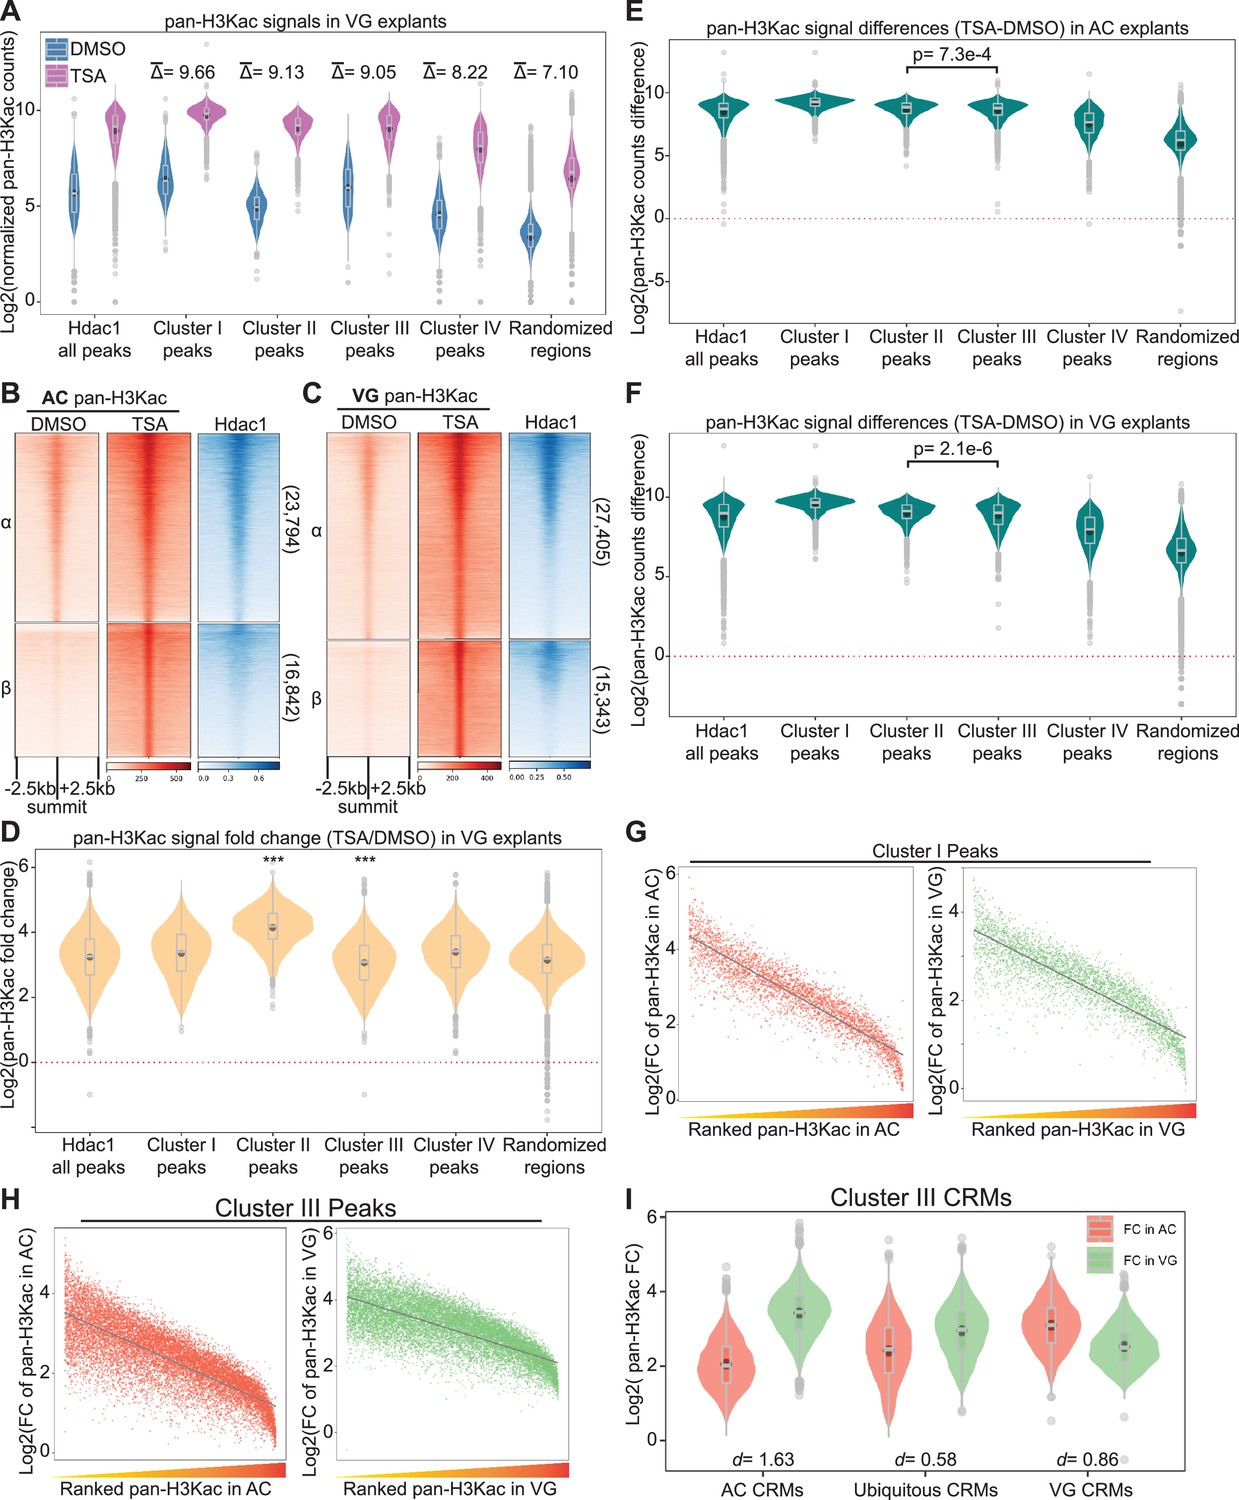
(A) Spike-in normalized pan-H3Kac signals across Hdac1 cis-regulatory module (CRM) Clusters (clusters in Figure 3C) in DMSO- or Trichostatin A (TSA)-treated vegetal mass (VG) explants. represents the log2 scaled average differences of spike-in normalized pan-H3Kac signals between DMSO- and TSA-treated VG explants. Randomized genomic regions (n = 23,442) are used as the negative control. (B, C) Clustered heatmaps depicting signals of pan-H3Kac and Hdac1 at st10.5 (B) animal cap (AC) and (C) VG explants treated with DMSO and TSA. The signals are scaled using spike-in normalization factors and shown in a window of 5 kb centered on the summits of pan-H3Kac peaks in descending order within each cluster. (D) Fold changes (FC) of pan-H3Kac signals at Hdac1 CRM Clusters (clusters in Figure 3C) in DMSO- or TSA-treated VG explants. Red dotted line denotes the level of zero. *** denotes p < 0.001 (Student’s t-test). (E, F) Pan-H3Kac signals at Hdac1 CRM Clusters (clusters in Figure 3C) in DMSO- or TSA-treated (E) AC and (F) VG explants. Values for Y-axis are log2 transformed. Red dotted line denotes the level of zero. Student’s t-test is used to obtain p-values. (G, H) Scatter plots representing the anti-correlation between fold changes of pan-H3Kac signals and ranked endogenous pan-H3Kac signals in Hdac1-bound CRM Cluster I and Cluster III of AC or VG explants shown in Figure 3C. Gray lines depict linear regression curves generated from a linear model. Both X and Y axes’ values are log2 transformed. (I) Fold changes (FC) of pan-H3Kac signals representing each spatial CRM category in Cluster III (clusters Figure 3C). d denotes effect size calculated by Cohen’s d.
Figure 5 with 1 supplement
Hdac1 regulates germ-layer transcriptomes both in time and space.
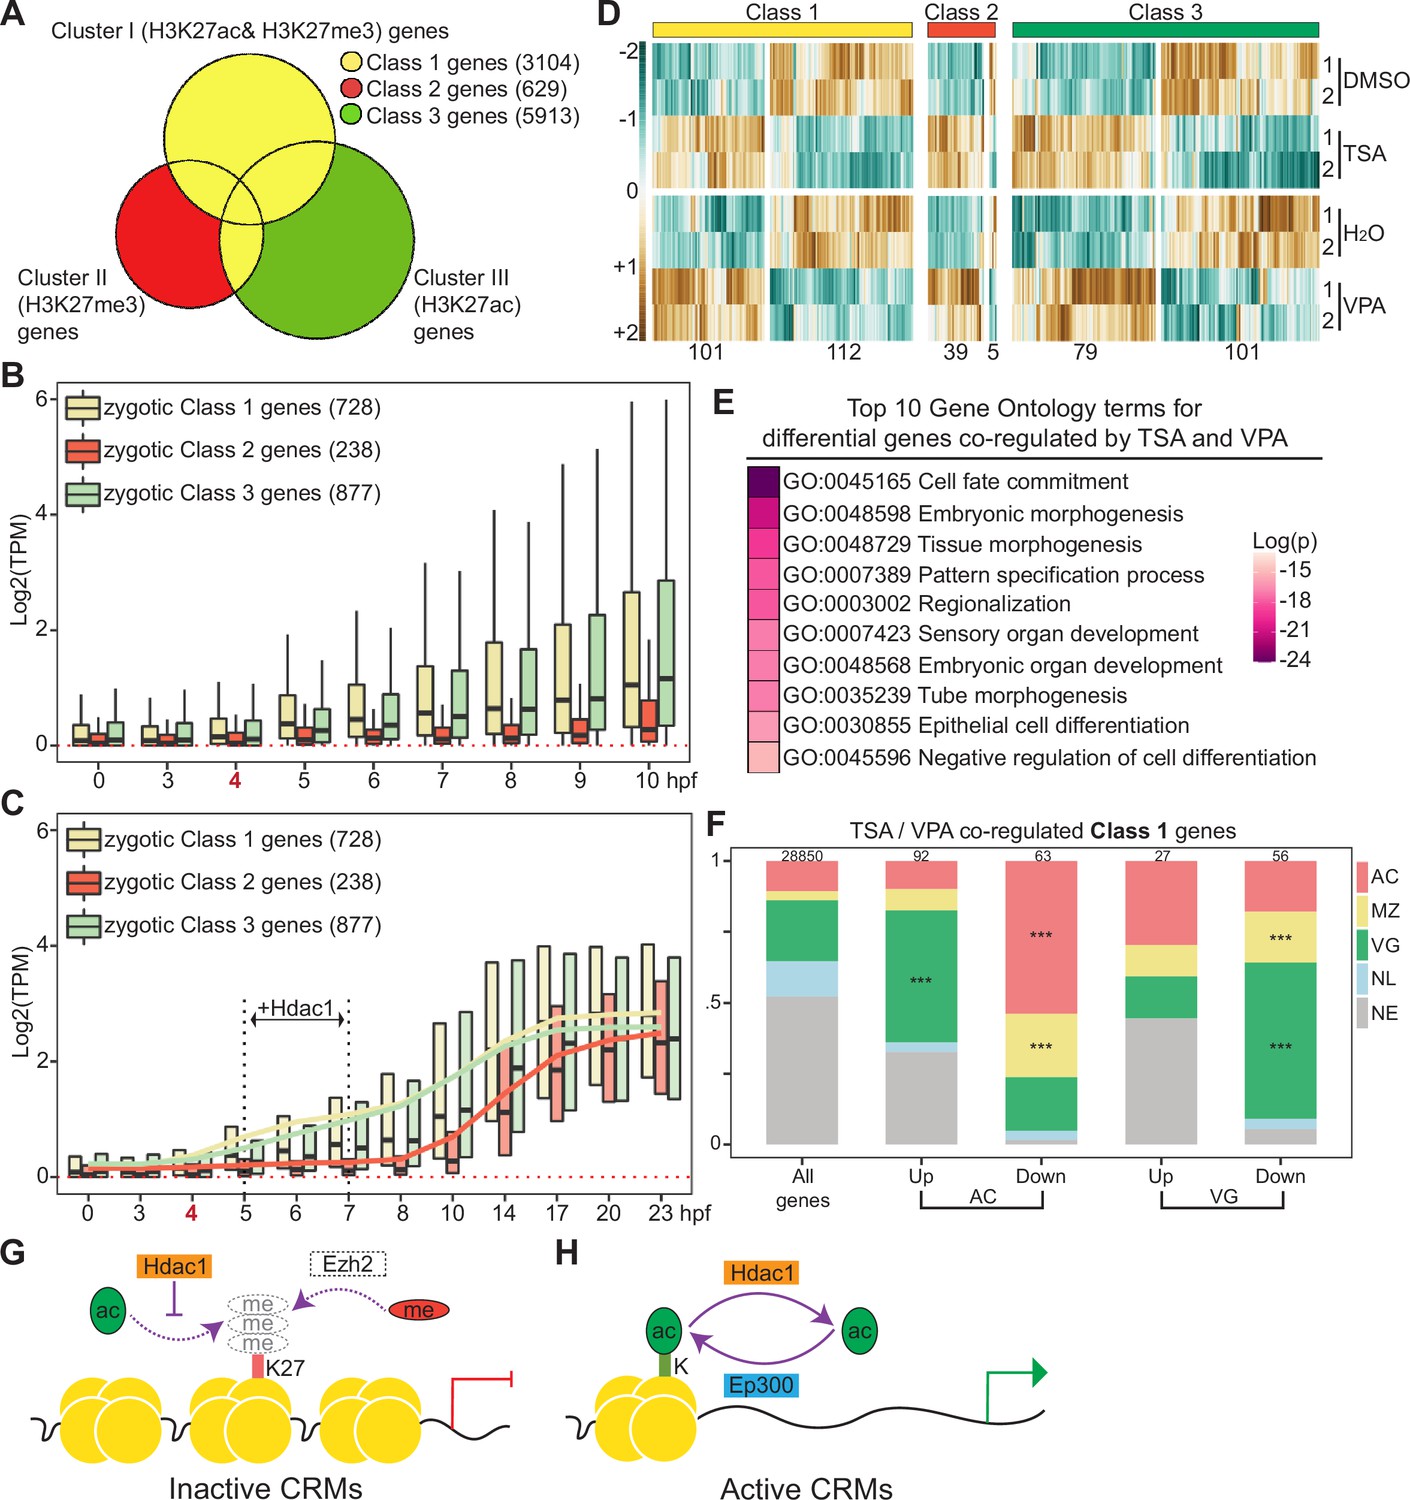
Venn diagram comparing genes associated with Hdac1 cis-regulatory module (CRM) clusters (Clusters I–III in Figure 3C). Class 1 genes include genes closest to Cluster I peaks and genes overlapped in Classes 2 and 3; Class 2 are unique genes closest to Cluster II peaks; Class 3 are unique genes closest to Cluster III peaks. (B) Time-course TPM expression of zygotic genes in Classes 1–3 from fertilization to 10 hr post-fertilization (hpf, late st12.5). Red dotted line denotes zero. Bold number ‘4’ in red denotes the onset of zygotic genome activation (ZGA). (C) Time-course TPM expression of zygotic genes in Classes 1–3 up to 23 hpf (tailbud st26). Black vertical dotted lines denote the time window when Hdac1 binding is examined. Trend lines for each class are generated by connecting mean TPM values at each time point. (D) The expression profiles of genes affected by Trichostatin A (TSA) or valproic acid (VPA) in each class. The total number of genes in each heatmap cluster is denoted. (E) Gene ontology enrichment analysis of genes co-regulated by TSA- and VPA-mediated HDAC inhibition. Only genes with matched gene synonym to Homo sapiens are used in the analysis. (F) Spatial expression pattern of Class 1 genes co-regulated by TSA and VPA in proportions. The total number of genes in each category is listed at the top of each bar. Only *** denoting p < 0.001 (Fisher’s exact test) is shown. AC: animal cap, presumptive ectoderm; MZ: marginal zone, presumptive mesoderm; VG: vegetal mass, presumptive endoderm; NL: non-localized genes; NE: non-expressed genes. (G, H) Models of Hdac1 functioning at both inactive and active CRMs: (G) on inactive CRMs, H3K27 residue is maintained as unmodified by Hdac1, which may be subjected to H3K27me3-mediated suppression; (H) on active CRMs, the state of histone acetylation is dynamically modulated by Ep300- and-Hdac1-mediated acetylation–deacetylation cycles.
Figure 5—figure supplement 1
Integrity of germ-layer transcriptomes requires HDAC activity.
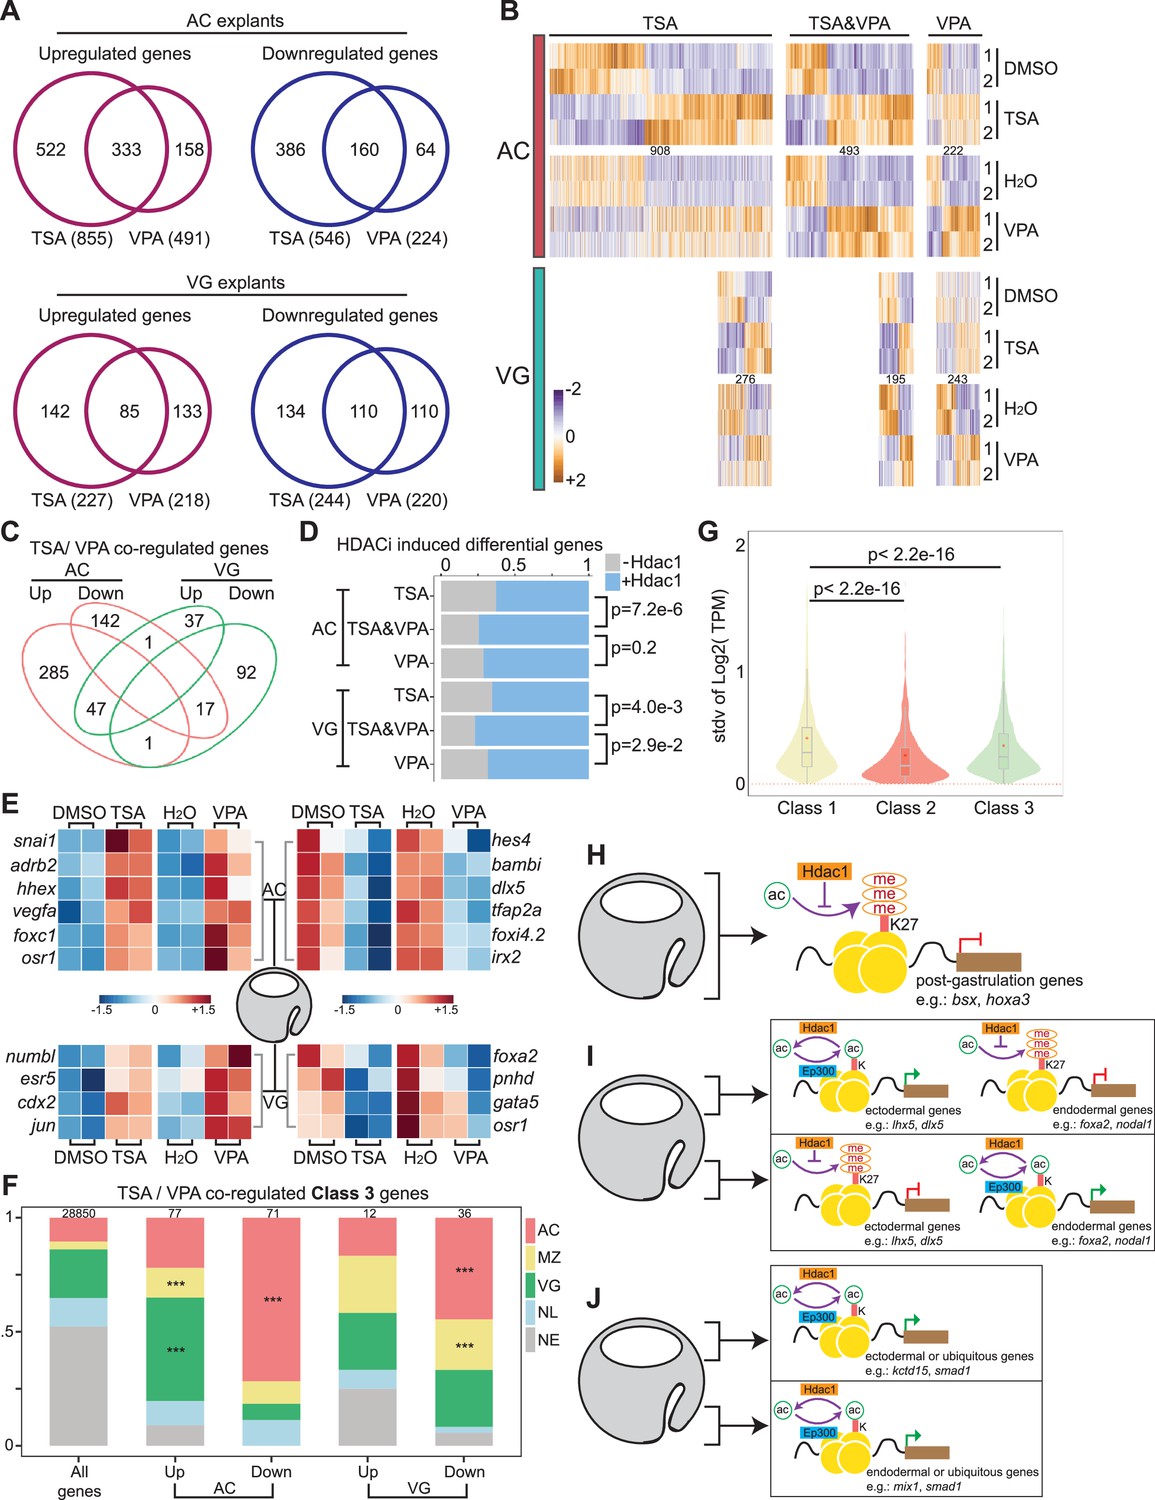
(A) Venn diagrams showing the overlap of differentially regulated genes by Trichostatin A (TSA) and valproic acid (VPA) treatment in AC or VG explants. (B) Differential expression profiles of genes induced by TSA alone, both TSA and VPA, and VPA alone in AC or VG explants. The total number of genes in each cluster is denoted. (C) Venn diagrams depicting the overlap of TSA/VPA co-regulated genes in AC and VG explants. (D) Proportions of Hdac1-bound and unbound genes differentially regulated by TSA alone, both TSA and VPA, and VPA alone in AC and VG explants. Fisher’s exact test is used to calculate the p-value. (E) Heatmaps depicting the expression levels of germ-layer genes (Supplementary file 3) co-regulated by TSA and VPA. (F) Spatial expression patterns of Class 3 genes co-regulated by TSA and VPA in proportions. The total number of genes in each category is listed at the top of each bar. Only *** denoting p < 0.001 (Fisher’s exact test) is shown. AC: animal cap, presumptive ectoderm; MZ: marginal zone, presumptive mesoderm; VG: vegetal mass, presumptive endoderm; NL: non-localized genes; NE: non-expressed genes. Parameters of spatial categories are detailed in Supplemental Methods. (G) The standard deviation of TPM values between five dissected tissue fragments for Class 1–3 genes. p-Values are calculated using Student’s t-test. (H–J) Models of Hdac1 function during germ-layer specification. (H) Hdac1 temporally suppresses the expression of genes expressed post-gastrulation. (I) Spatially Hdac1 safeguards misactivation of germ-layer genes in other germ layers suppressed by H3K27me3 or (J) devoid of histone acetylation; in addition, (I, J) Hdac1 sustains the activity of respective germ-layer genes.
Additional files
-
Supplementary file 1
Top transcription factor binding motifs detected in HDAC1 peaks at stage 8, 9 and 10 embryos.
- https://cdn.elifesciences.org/articles/79380/elife-79380-supp1-v2.docx
-
Supplementary file 2
References for known germ-layer functioning genes in Figure 5—figure supplement 1E.
- https://cdn.elifesciences.org/articles/79380/elife-79380-supp2-v2.docx
-
Supplementary file 3
ChIP-qPCR Primer Sequences.
- https://cdn.elifesciences.org/articles/79380/elife-79380-supp3-v2.docx
-
Supplementary file 4
ChIP spike-in normalization.
- https://cdn.elifesciences.org/articles/79380/elife-79380-supp4-v2.docx
-
Supplementary file 5
p-Values from Fisher’s exact test.
- https://cdn.elifesciences.org/articles/79380/elife-79380-supp5-v2.docx
Download links
A two-part list of links to download the article, or parts of the article, in various formats.
Downloads (link to download the article as PDF)
Open citations (links to open the citations from this article in various online reference manager services)
Cite this article (links to download the citations from this article in formats compatible with various reference manager tools)
Histone deacetylase 1 maintains lineage integrity through histone acetylome refinement during early embryogenesis
eLife 12:e79380.
https://doi.org/10.7554/eLife.79380


