Motor processivity and speed determine structure and dynamics of microtubule-motor assemblies
- Division of Biology and Biological Engineering, California Institute of Technology, United States
- Department of Applied Physics, California Institute of Technology, United States
- Biophysics Program, Stanford University, United States
- Department of Computing and Mathematical Science, California Institute of Technology, United States
- Department of Bioengineering, Stanford University, United States
- Department of Physics, California Institute of Technology, United States
Figures
Figure 1 with 2 supplements
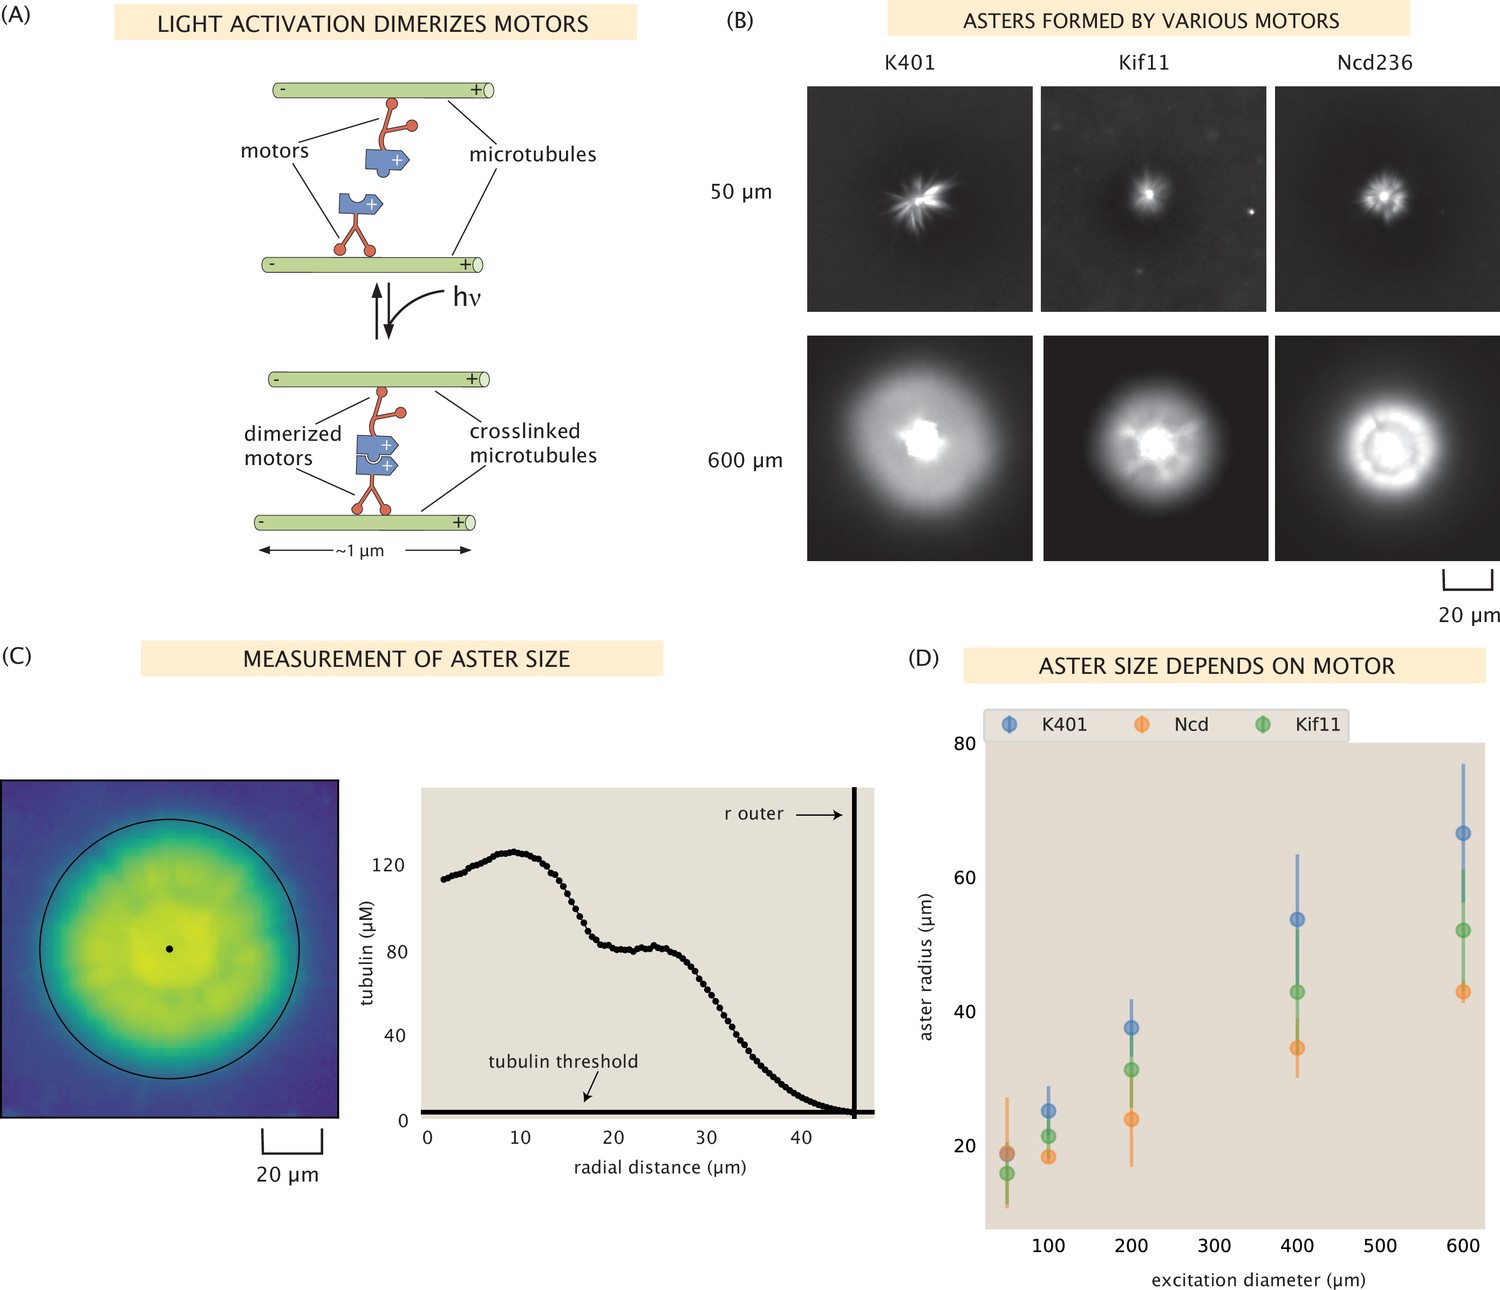
Aster size depends on motor used.
(A) Motor heads are fused to optogenetic proteins such that activation with light causes the formation of motor tetramers (dimer of dimers). Motors are shown walking toward the microtubule plus-end. K401 and Kif11 walk in this direction, however Ncd is minus-end directed. (B) Images of the microtubule fluorescence for asters formed with each of the motors excited with a disk either 50 or 600 μm in diameter. (C) Image of the microtubule fluorescence from an aster with the measured size represented with the outer black circle. The plot on the right shows the radial microtubule concentration as revealed by fluorescence intensity; the threshold concentration used to determine the aster size is shown as a black horizontal line. (D) Mean aster size (n ≈ 5 asters for each condition) for the three motors and different excitation diameters; the error bars represent the standard deviation.
Figure 1—figure supplement 1
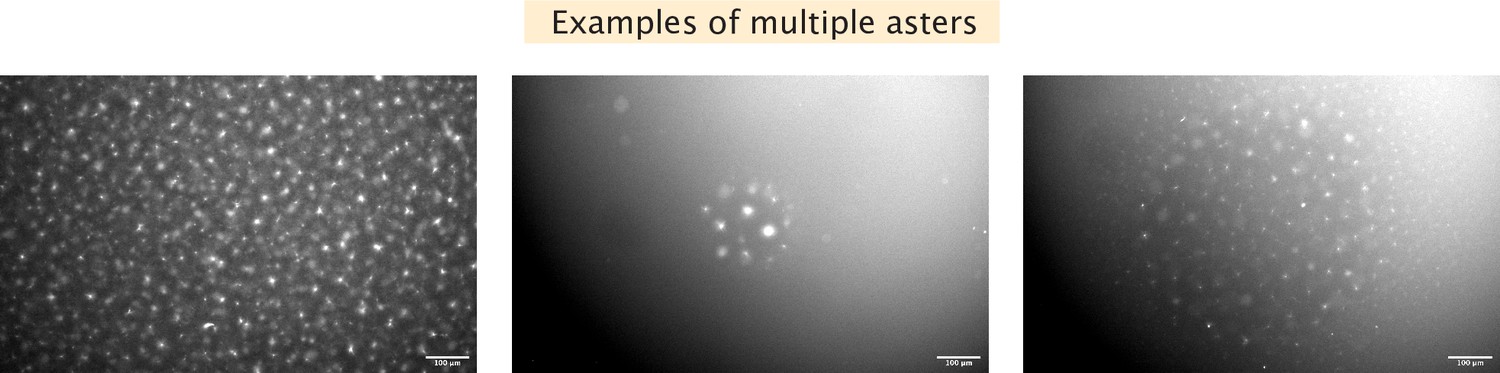
Examples of multiple asters formed.
Left, many mini asters are seen before light activation. Center, activation results in a few asters within the illuminated region. Right, activation results in many small asters within the illuminated region.
Figure 1—figure supplement 2
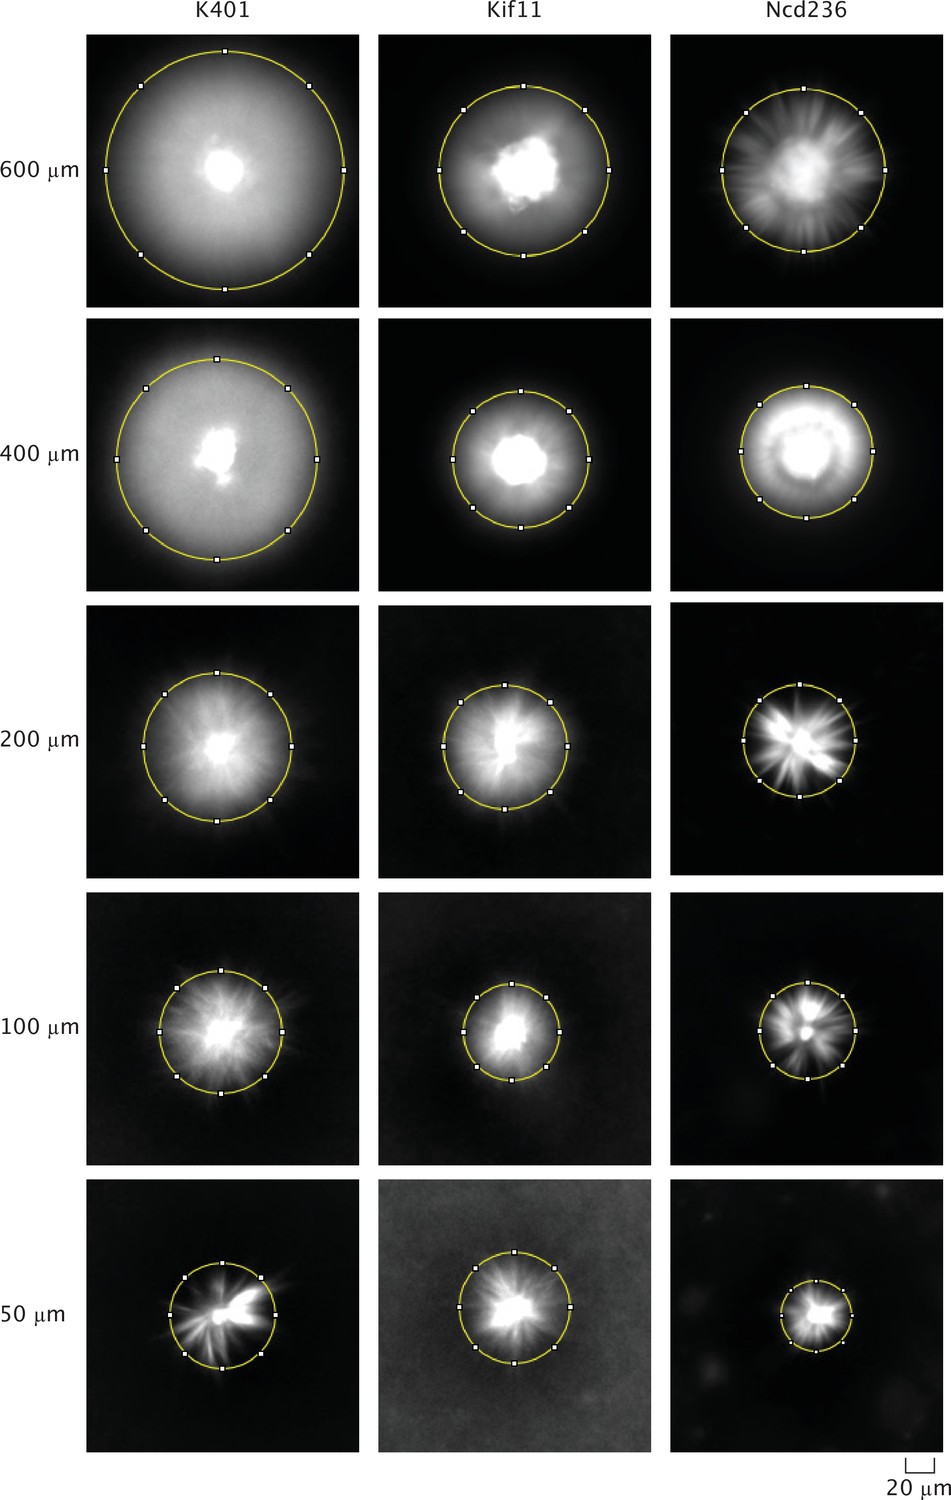
Example images of microtubule fluorescence of asters made with each motor used and each excitation diameter.
The yellow circle indicates a visual measurement size of the aster.
Figure 2 with 1 supplement

Modeling the motor distribution.
(A) Schematic of the radial microtubule organization in an aster. Modeling applies to locations outside the disordered core region at the aster center. Components of the schematic are not drawn to scale. (B) Motor states and transitions between them. (C) Governing equations for the bound and free motor populations, along with our solution for the total motor distribution at steady state, expressed via effective parameters and (see SI section ‘Model formulation’ for details). (D) Demonstration of the model fitting procedure on an example Kif11 aster. Fits to the average motor profile as well as to 5 out of 16 wedge profiles are shown. The outlier case with a lower concentration corresponds to wedge 13 in the fluorescence images. (E) Mean fitting errors for all asters calculated from the fits to the wedge profiles. The error is defined as the ratio of the mean residual to the concentration value at the inner boundary. (F) Inferred parameters and grouped by the kind of motor. Box plots indicate the quartiles of the inferred parameter sets. The fitting error and the inferred parameters for the Kif11 aster in panel (D) are shown as white dots in panels (E) and (F).
Figure 2—figure supplement 1
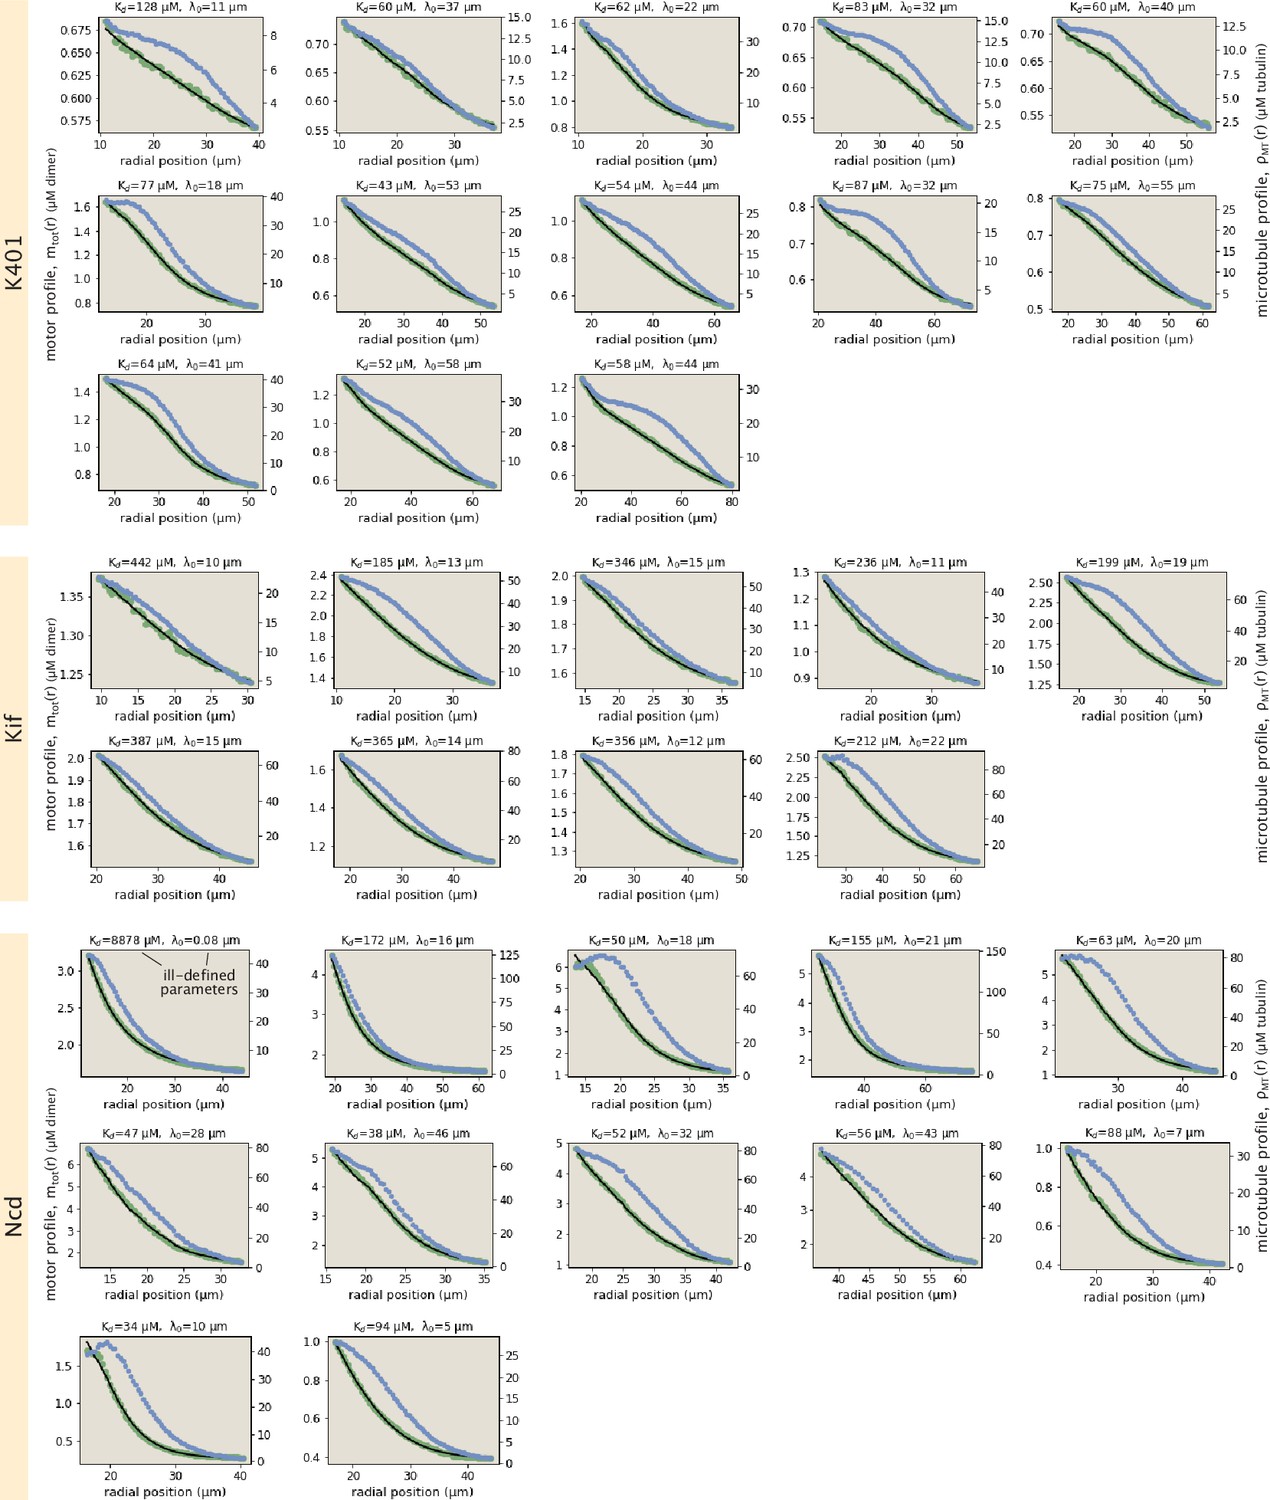
Collection of all fits to motor profiles.
The green and blue dots represent the radially averaged motor and tubulin concentrations. The solid black lines represent the model fits.
Figure 3 with 1 supplement
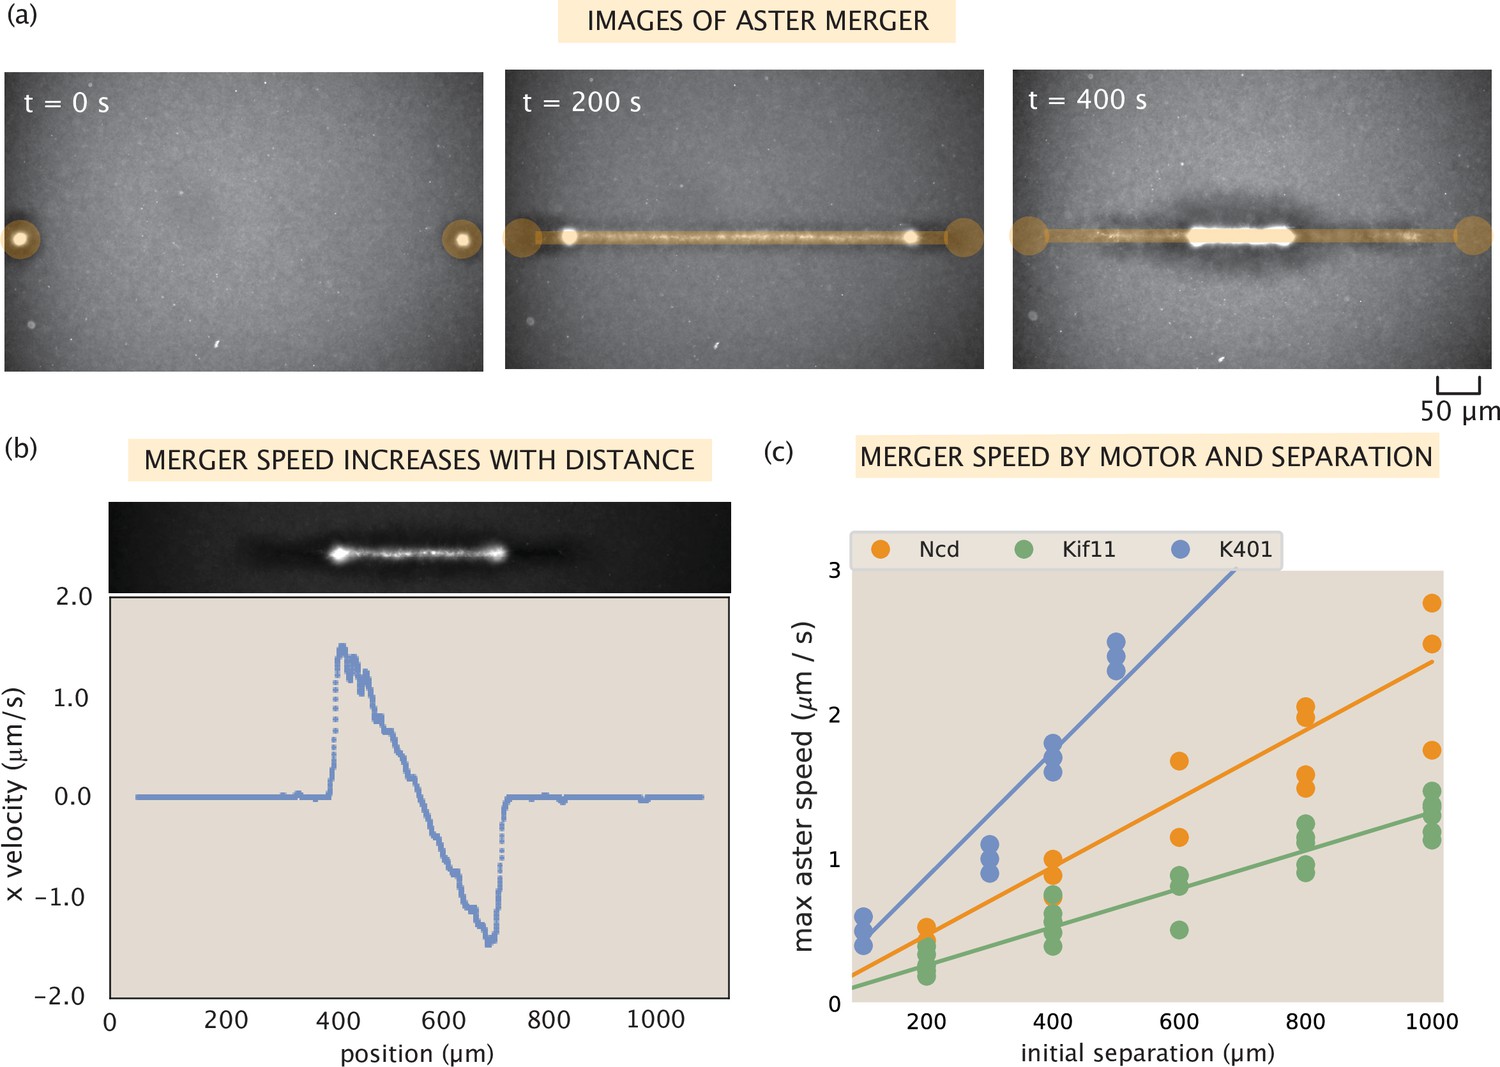
Contractile speeds in motor-microtubule networks scale with network size and motor speed.
(a) Images of microtubule fluorescence during aster merger. Regions of light activation are shown in orange. (b) Example profile of speeds in an aster merger as a function of linear distance. Each dot is the mean speed measured at that x-position within the network. (c) Maximum merger speed, measured at the ends of the network for each initial separation, and motor. Each dot is a single experiment and the lines are best fits to the data.
Figure 3—figure supplement 1
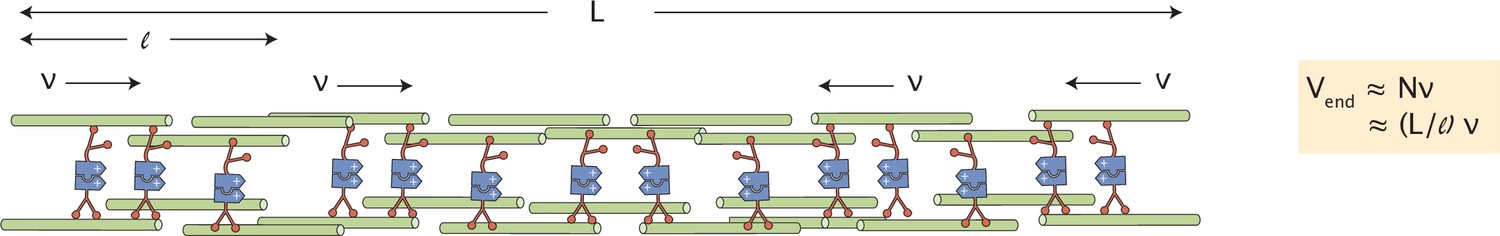
Scaling of contractile speeds with network size.
The contractile network between two merging asters is composed of contractile units (bundles of microtubules) of length , each contracting with speed . The speed measured at the end of the network is the number of contractile units times their contractile speed, or (L/).
Appendix 1—figure 1
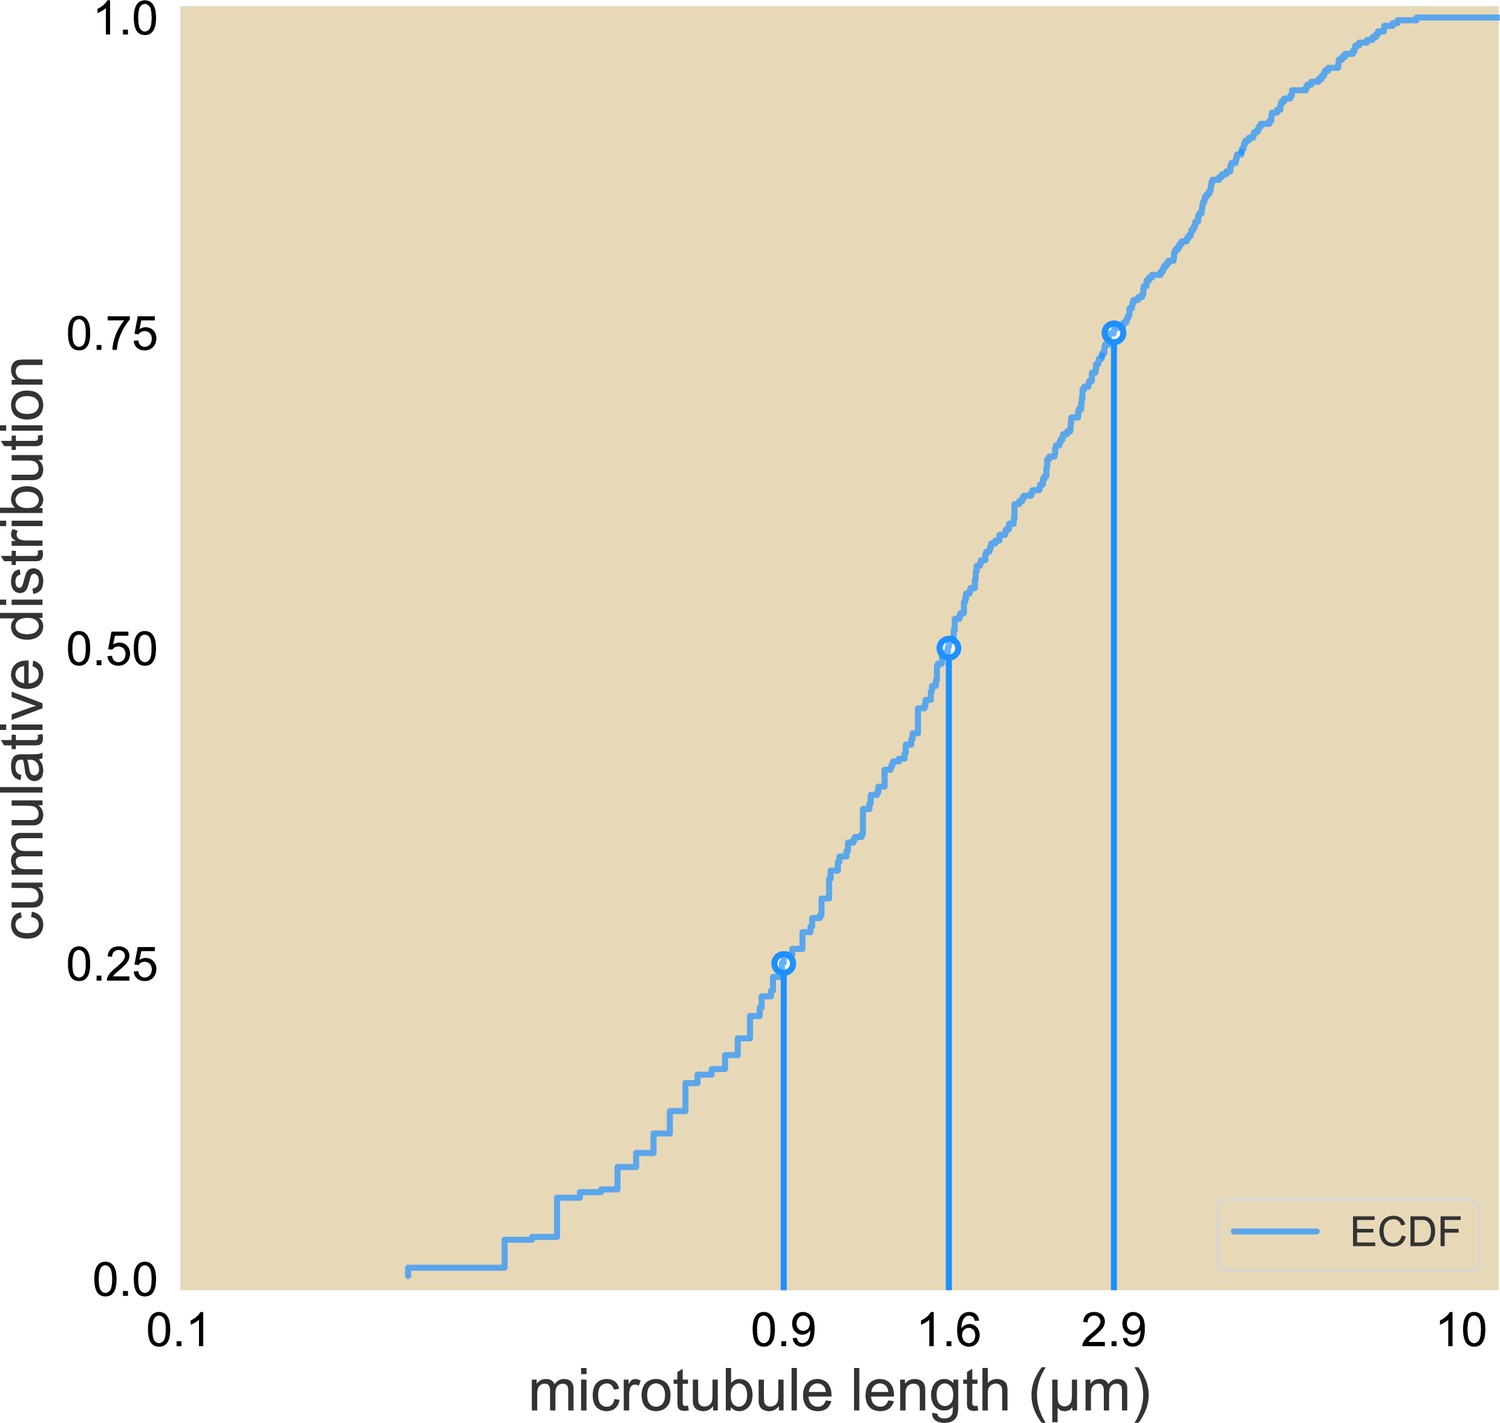
Cumulative distribution of microtubule lengths.
The 25%, 50%, and 75% length are marked.
Appendix 1—figure 2
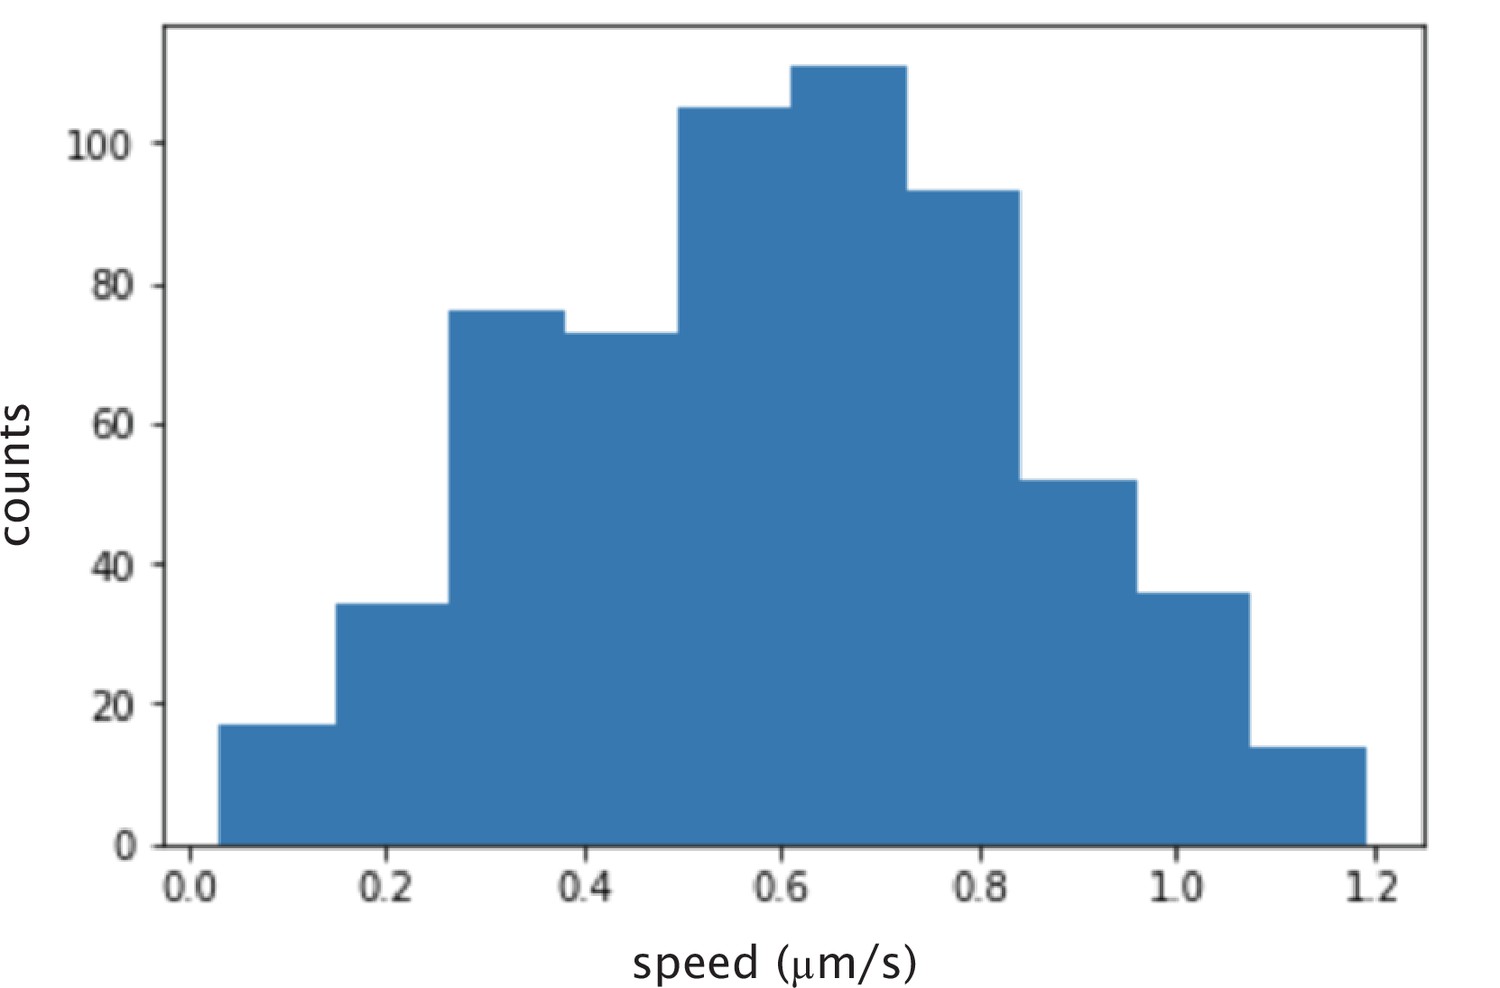
Histogram of calculated instantaneous speed of microtubules glided by K401 motors.
The mean speed is nm/s.
Appendix 1—figure 3

Aster centers are disordered and the arms are aligned radially.
(a) Retardance image of an aster taken with a Pol-Scope. The arms of the aster result from their alignment and the magnitude of retardance is proportional to the number of microtubules in a bundle. The dark center indicates no alignment of microtubules in that region. (b) Azimuthal angle of microtubule alignment in an aster. Black is 0 and white is 180.
Appendix 1—figure 4
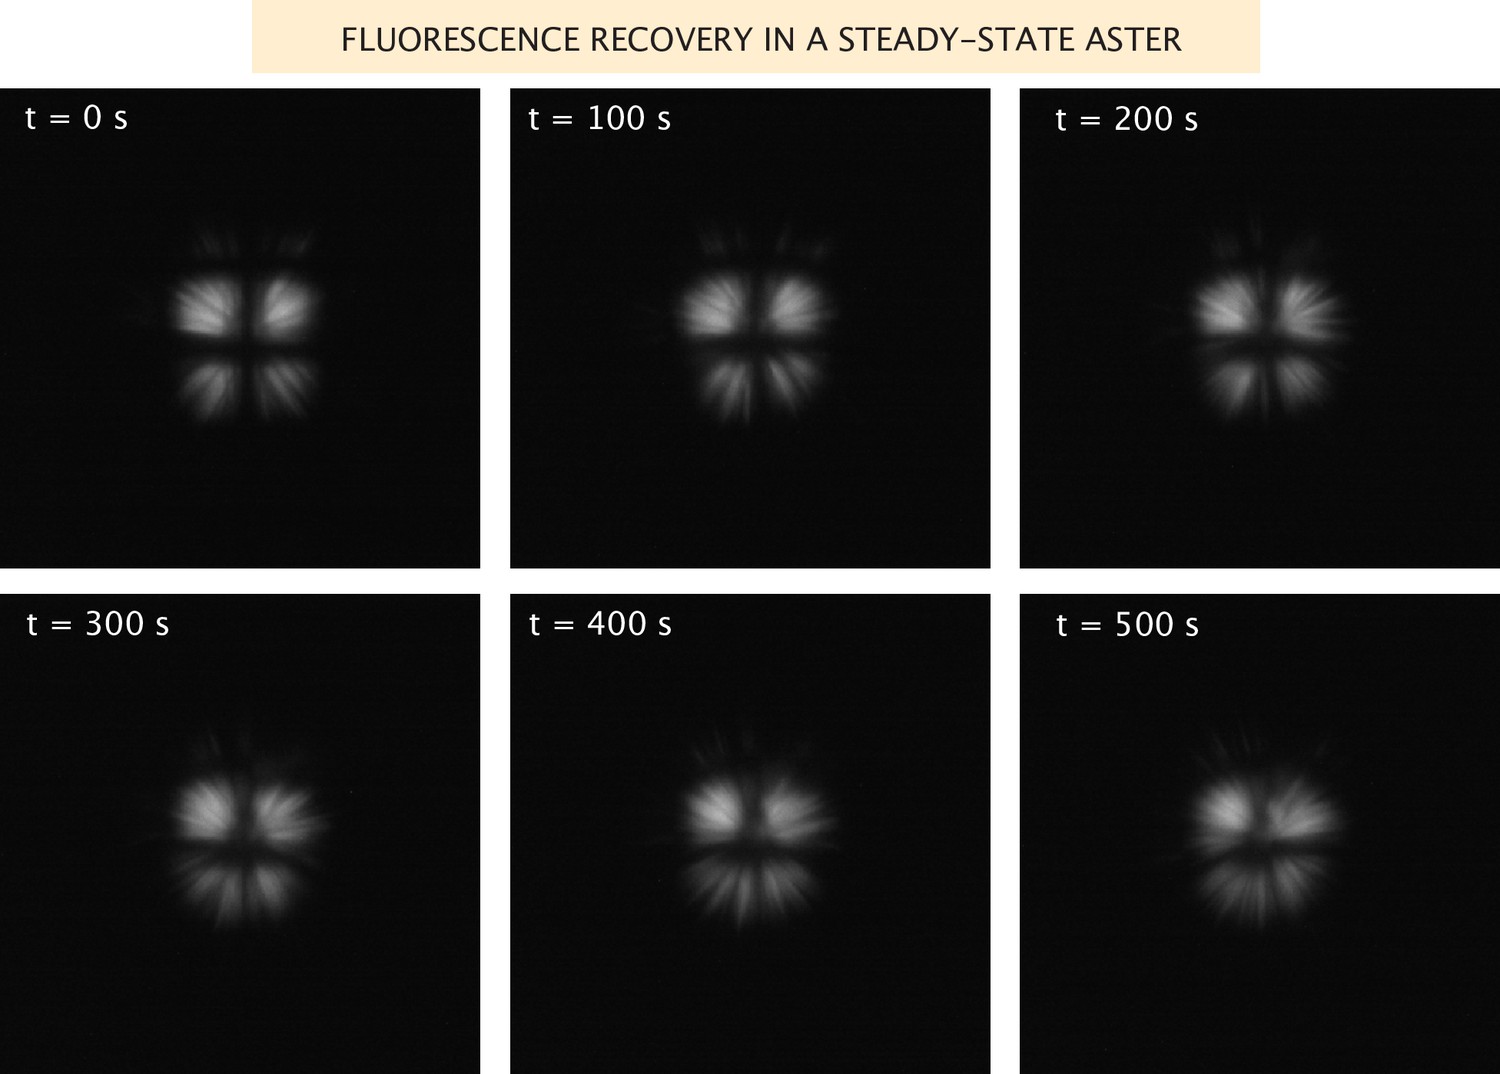
Fluorescence recovery of the microtubules in a steady-state aster.
Images of the microtubule fluorescence after photobleaching in a grid pattern of an aster formed with Ncd236 motors.
Appendix 1—figure 5
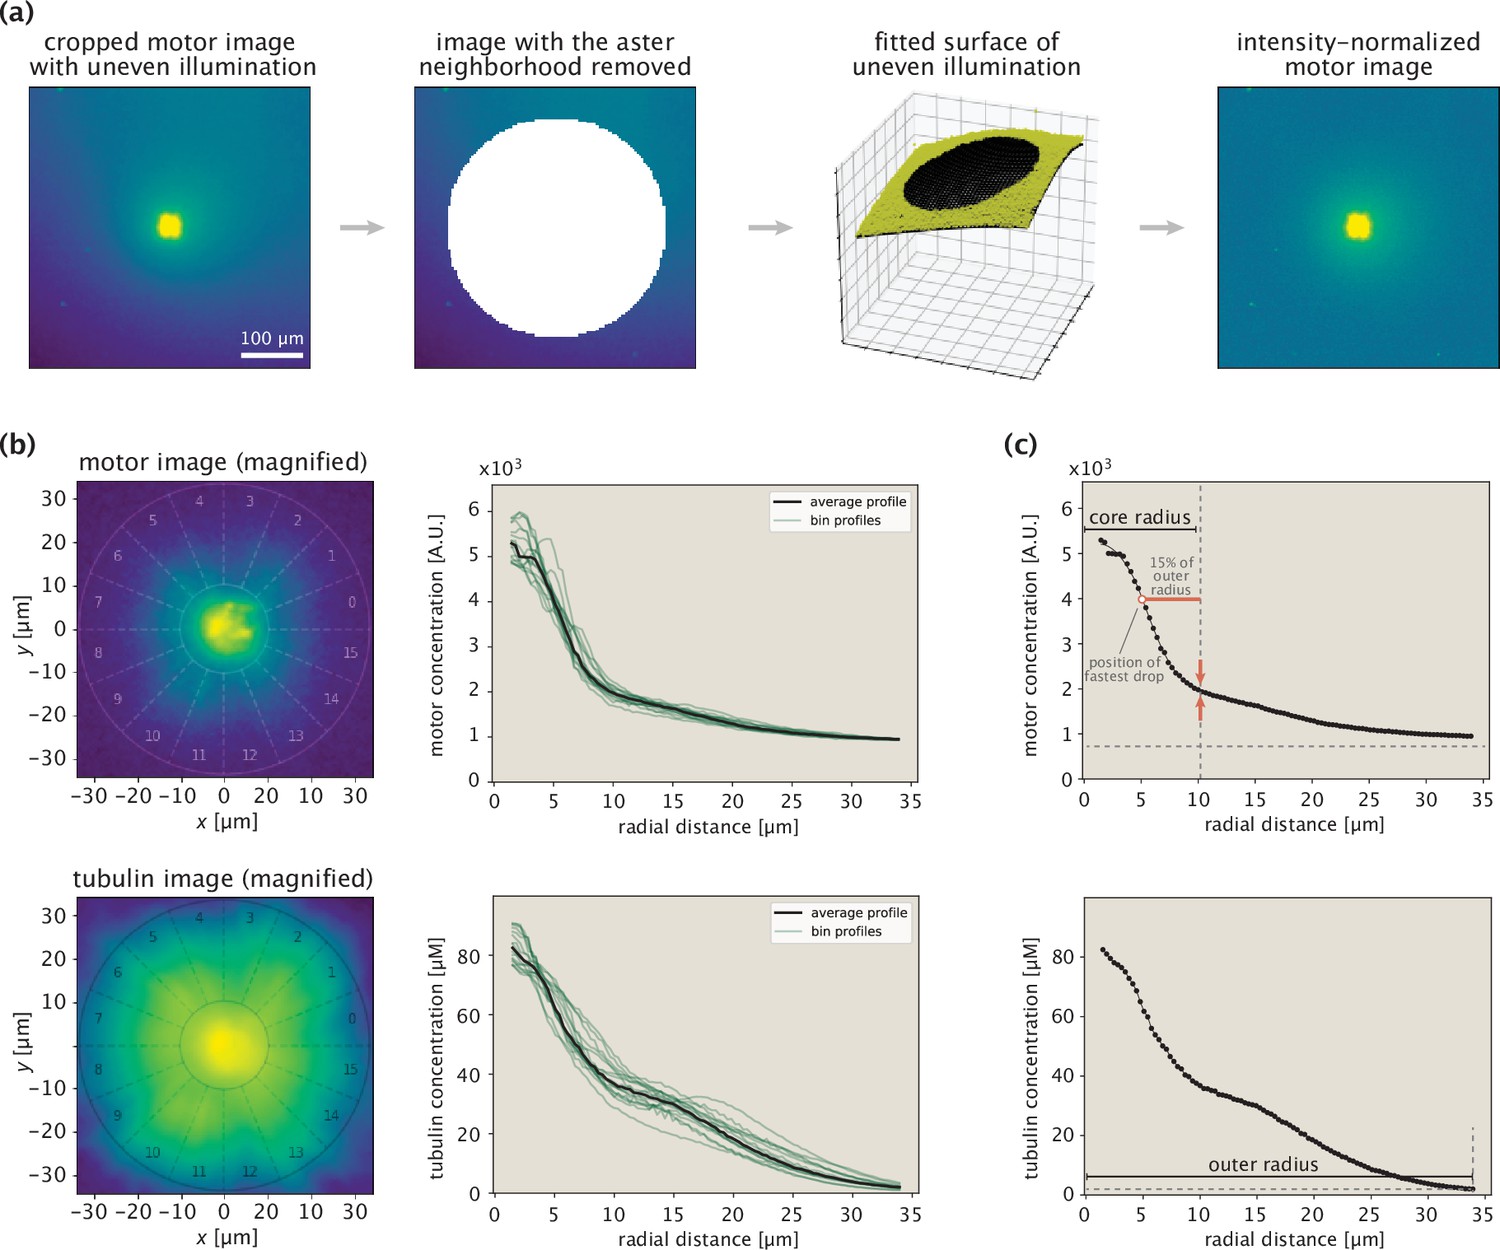
Procedure for extracting protein concentration profiles demonstrated on an example aster.
(a) Steps taken in normalizing the fluorescence of motor images. The immediate aster region is shown with a saturated color to make it possible to see the nonuniform background fluorescence. (b) Aster center identification and extraction of radial concentration profiles. The numbers indicate the wedges at different angular positions. The two circles in the images indicate the inner and outer bounds. (c) Determination of inner and outer bounds based on the motor and tubulin profiles, respectively.
Appendix 1—figure 6
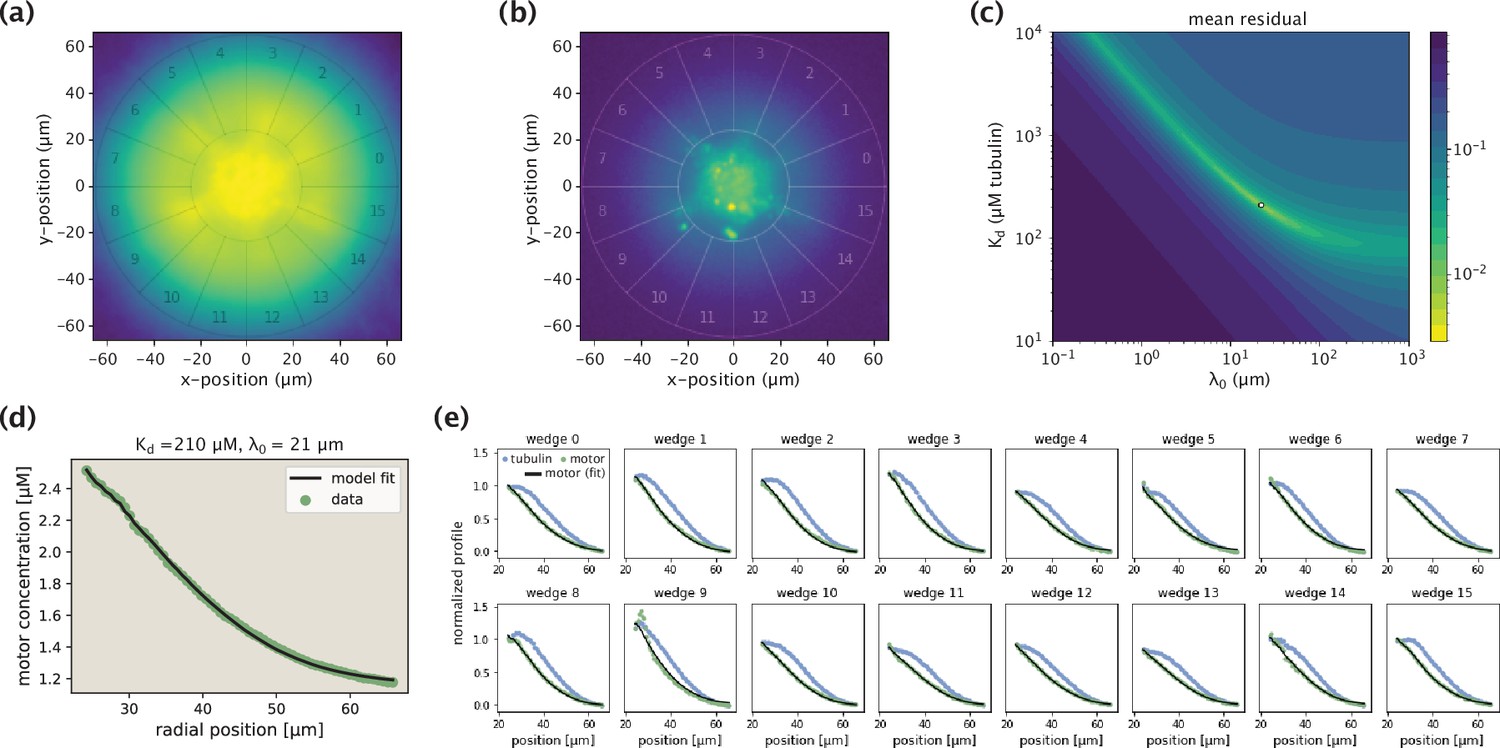
Demonstration of the model fitting procedure for average as well as separate wedge profiles.
(a,b) Fluorescence images of an example Kif11 aster in tubulin (a) and motor (b) channels. Sixteen different wedges are separated and numbered. (c) Landscape of fit residuals when varying the two effective parameters and . For each pair, an optimal scaling coefficient is inferred before calculating the residual. The dot at the brightest spot stands for the optimal pair (or, the arrow indicates the location of the optimal pair in the landscape). (d) Average motor profile and the model fit, along with the inferred parameters. (e) Collection of fits to separate wedge profiles using the optimal pair inferred from the average profile.
Appendix 1—figure 7
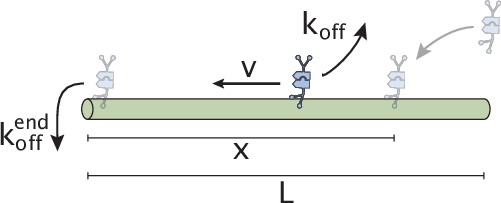
Schematic representation of initial motor binding, advection, and stalling at the microtubule end.
Appendix 1—figure 8
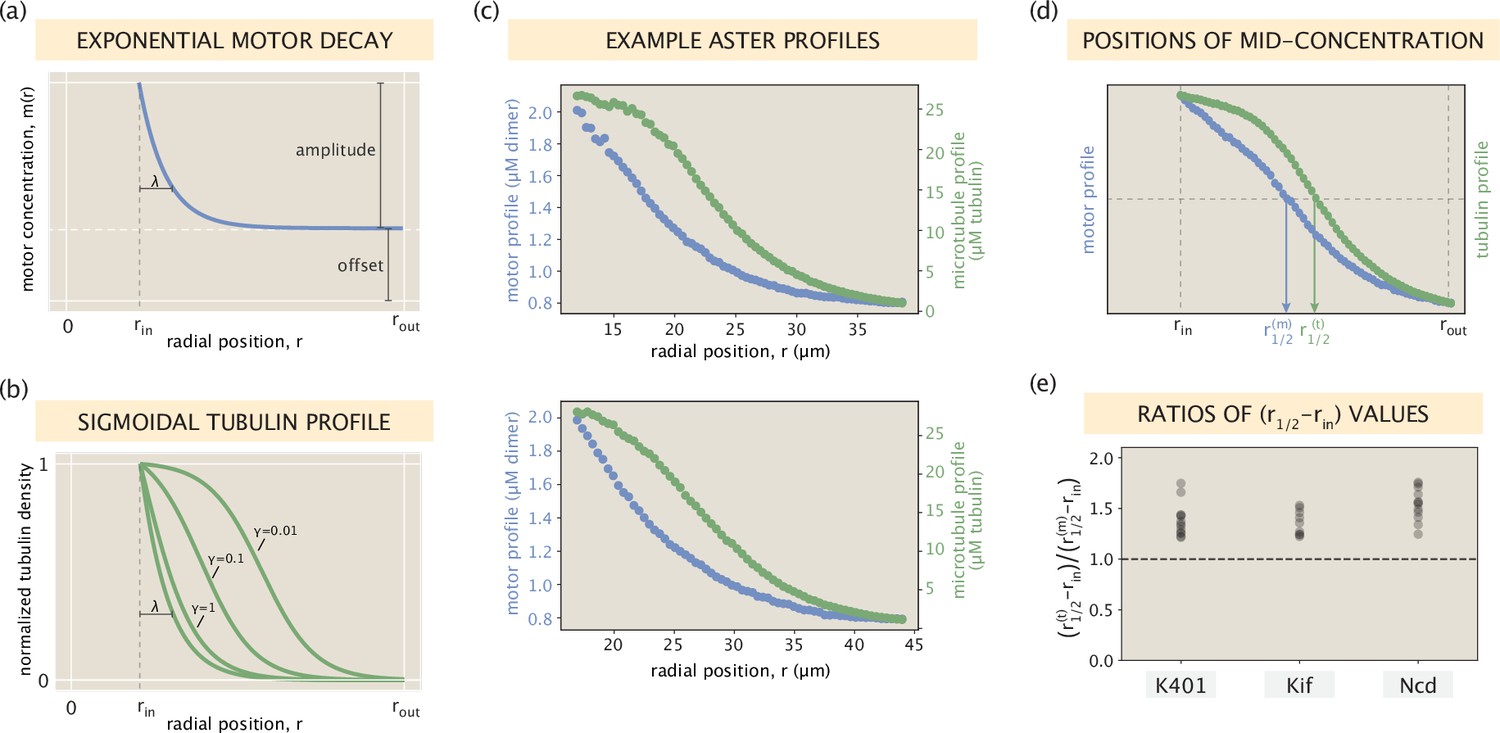
Relationship between motor and microtubule distributions.
(a) An idealized exponentially decaying motor profile with a constant offset. (b) Set of sigmoidal tubulin profiles corresponding to the exponentially decaying motor profile. The precise curve depends on the shape parameters of the motor profile and the motor type via an effective constant (see SI section ‘Broader spread of the tubulin profile for details). (c) Two example profiles from Ncd asters that resemble the setting in panels (a) and (b). Blue and green dots represent measured concentrations of motors and microtubules, respectively. (d) Radial positions in the interval where the motor and tubulin concentrations take their middle values. (e) The ratio calculated for all of the aster profiles.
Appendix 1—figure 9
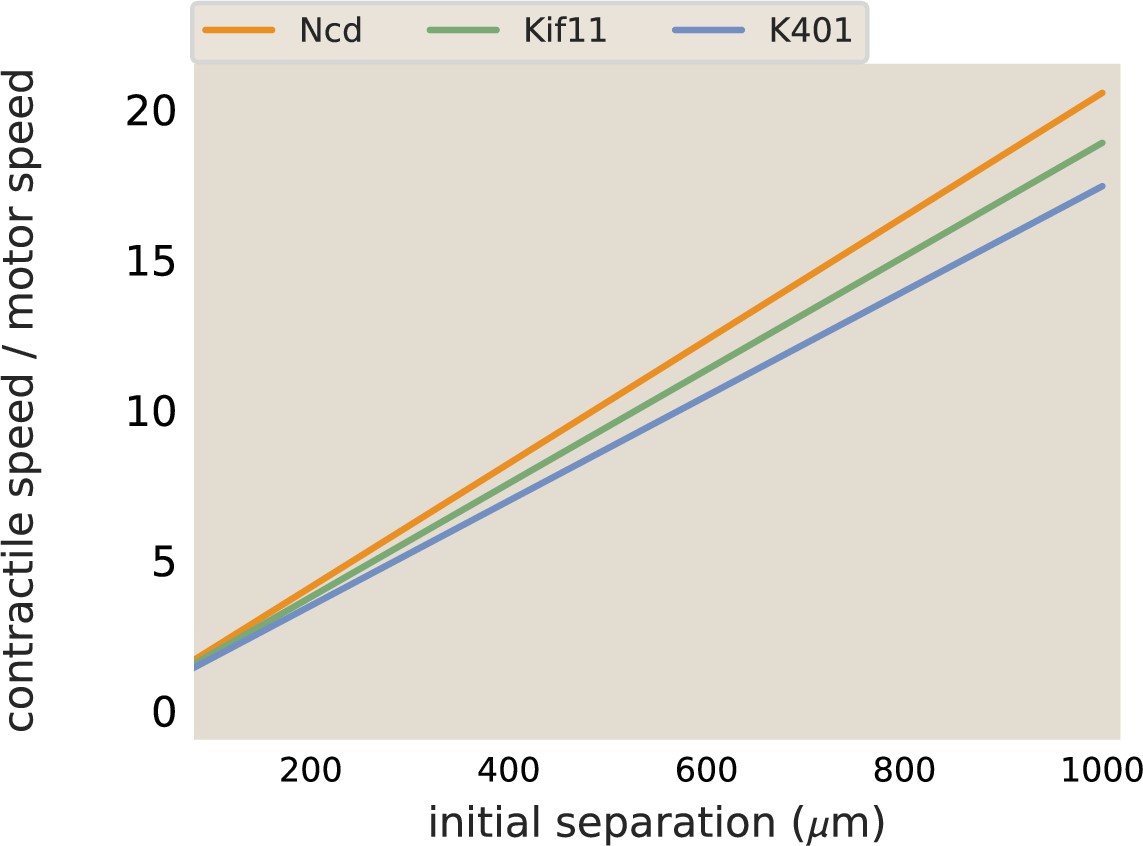
Merger speeds depend on motor stepping speed.
The best fit lines from the contraction rate measured in aster mergers are plotted, normalized by the measured motor speed.
Appendix 1—figure 10
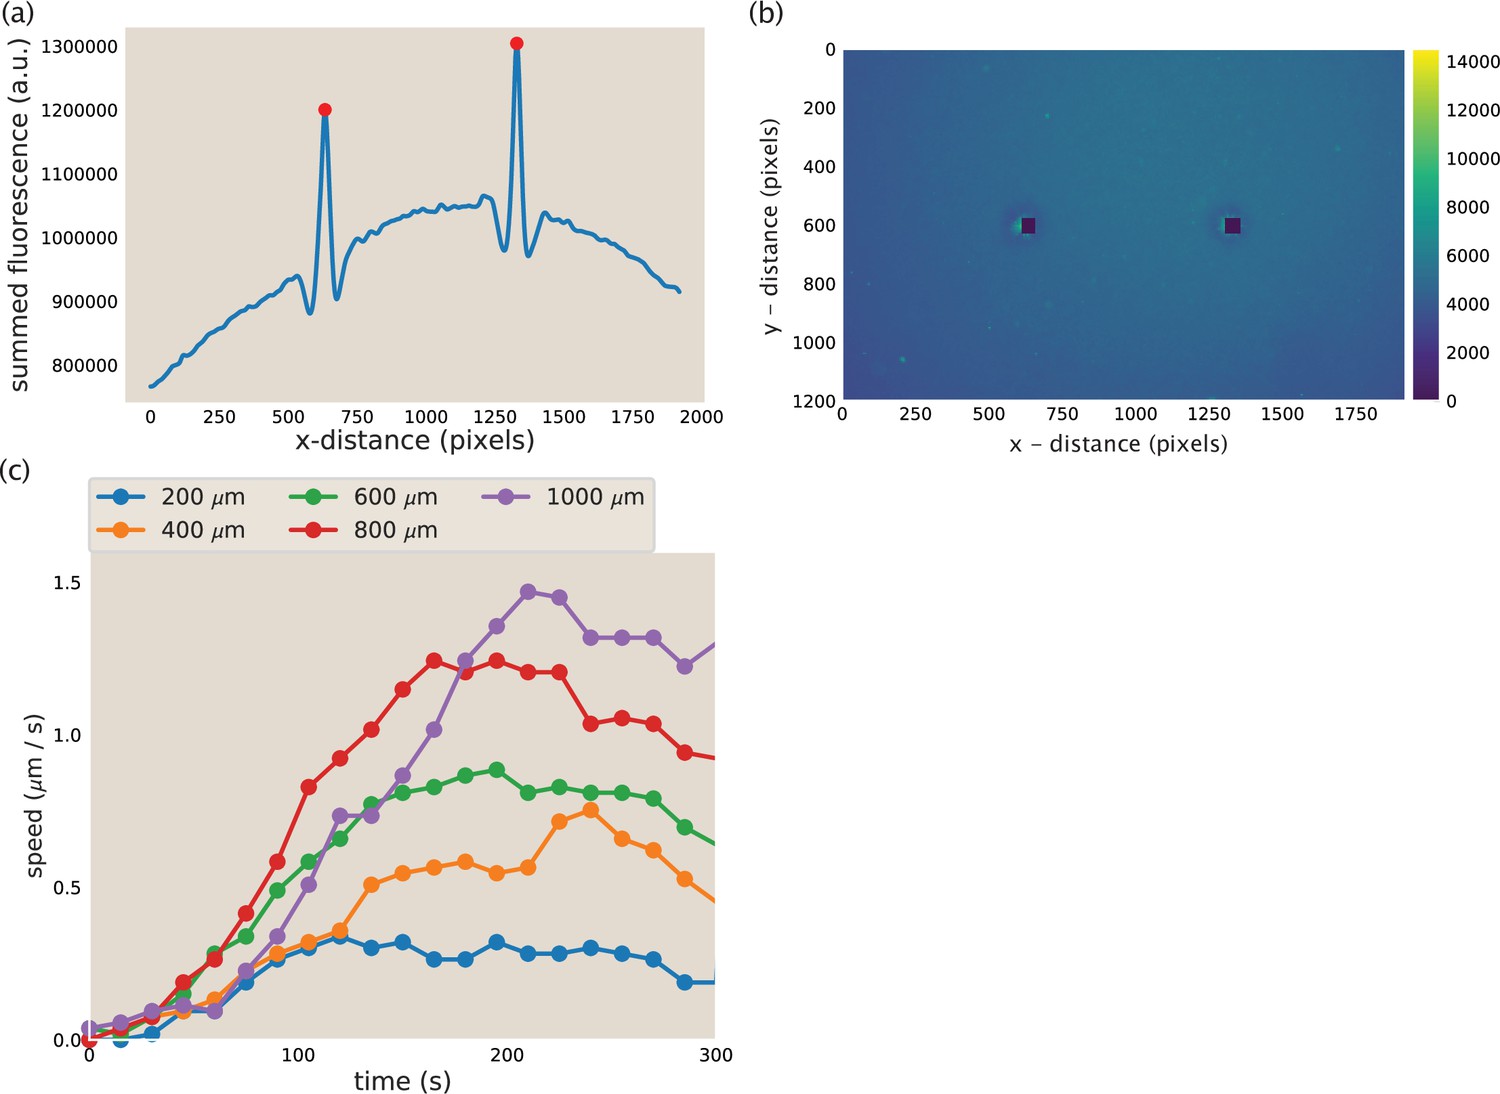
Aster identification and speed calculation in aster mergers.
(a) Example y-summed microtubule fluorescence from an image during aster merger. The peaks represent the asters and the red dots are the position of the asters as identified by the code. (b) Image corresponding to the fluorescence plotted in (a). The blacked out squares are the location of the asters identified from the peaks in (a). (c) Measured aster speed versus time during aster merger. Each dot is a single measured speed and the colors represent the initial separation of the asters.
Tables
Table 1
Properties of motor proteins used in this study.
Speeds were measured by us by gliding assay, the processivity and directionality are literature values.
| Motor | Speed | Processivity | Direction |
|---|---|---|---|
| K401 | ≈ 600 nm/s | ≈100 steps (Belmonte et al., 2017) | Plus (Hirokawa et al., 1991) |
| Ncd236 | ≈115 nm/s | Not processive (Hentrich and Surrey, 2010, Nédélec et al., 2001, Lee and Kardar, 2001) | Minus (Sankararaman et al., 2004) |
| Kif11(513) | ≈70 nm/s | ≈10 steps (Aranson and Tsimring, 2006) | Plus (Aranson and Tsimring, 2006) |
Additional files
-
Supplementary file 1
Plasmids generated for and used in this study.
- https://cdn.elifesciences.org/articles/79402/elife-79402-supp1-v2.docx
-
Supplementary file 2
Processivities of motors, decay length scales of motor profiles, and corresponding ratios of these two length scales.
Step size of nm corresponding to the length of a tubulin dimer was used for estimating the motor processivities in μm units. For Ncd motors, the upper limit in processivity corresponds to that of oligomeric motor assemblies. Estimates for the decay length scales were made based on the motor profiles in Figure 2—figure supplement 1.
- https://cdn.elifesciences.org/articles/79402/elife-79402-supp2-v2.docx
-
MDAR checklist
- https://cdn.elifesciences.org/articles/79402/elife-79402-mdarchecklist1-v2.docx
Download links
A two-part list of links to download the article, or parts of the article, in various formats.
Downloads (link to download the article as PDF)
Open citations (links to open the citations from this article in various online reference manager services)
Cite this article (links to download the citations from this article in formats compatible with various reference manager tools)
Motor processivity and speed determine structure and dynamics of microtubule-motor assemblies
eLife 12:e79402.
https://doi.org/10.7554/eLife.79402


