β-cell deletion of the PKm1 and PKm2 isoforms of pyruvate kinase in mice reveals their essential role as nutrient sensors for the KATP channel
- Department of Medicine, Division of Endocrinology, Diabetes, and Metabolism, University of Wisconsin-Madison, United States
- Koch Institute for Integrative Cancer Research, Massachusetts Institute of Technology, United States
- Lewis-Sigler Institute for Integrative Genomics, Princeton University, United States
- Department of Internal Medicine, Yale University, United States
- Molecular Nutrition Unit and Montreal Diabetes Research Center, CRCHUM, and Departments of Nutrition, Biochemistry and Molecular Medicine, Université de Montréal, Canada
- Department of Cellular & Molecular Physiology, Yale University, United States
- William S. Middleton Memorial Veterans Hospital, United States
Figures
Figure 1 with 3 supplements

Generation of mouse models to probe the functions of PKm1, PKm2, and phosphoenolpyruvate carboxykinase (PCK2) in β-cells.
(A) Hypothesized model in which pyruvate kinase (PK) in the KATP microcompartment is fueled by two sources of phosphoenolpyruvate (PEP) – glycolytic PEP generated by enolase, and mitochondrial PEP generated by PCK2 in response to anaplerotic fuels. β-Cells express three isoforms of PK, constitutively active PKm1, and allosterically recruitable PKm2 and PKL that are activated by endogenous fructose 1,6-bisphosphate (FBP) or pharmacologic PK activators (PKa). (B–D) Quantification of knockdown efficiency in islet lysates from PKm1-βKO (B), PKm2-βKO (C), and Pck2-βKO mice (D) (n=4 mice for PKm1- and PCK2-βKO, n=6 mice for PKm2-βKO). (E–G) Intraperitoneal glucose tolerance tests (GTT, 1 g/kg) of PKm1-βKO mice (n=9) and littermate controls (n=8) (E), PKm2-βKO mice (n=7) and littermate controls (n=7) (F), and Pck2-βKO mice (n=10) and littermate controls (n=7) (G) following an overnight fast. (H–I) PK activity in islet lysates of PKm1-βKO (H) and PKm2-βKO mice (I) in response to FBP (80 µM) and PKa (10 µM TEPP-46) (n=2 replicates from 6 mice/group). See Figure 1—source data 1 and Figure 1—source data 2 for source data. Data are shown as mean ± SEM. #p<0.01, *p<0.05, **p<0.01, ***p<0.001, **** p<0.0001 by t-test (B–G) or two-way ANOVA (H–I).
-
Figure 1—source data 1
Western blot source data.
- https://cdn.elifesciences.org/articles/79422/elife-79422-fig1-data1-v2.zip
-
Figure 1—source data 2
Source data for Western blots, glucose tolerance tests, and PK activity assays associated with Figure 1.
- https://cdn.elifesciences.org/articles/79422/elife-79422-fig1-data2-v2.xlsx
Figure 1—figure supplement 1
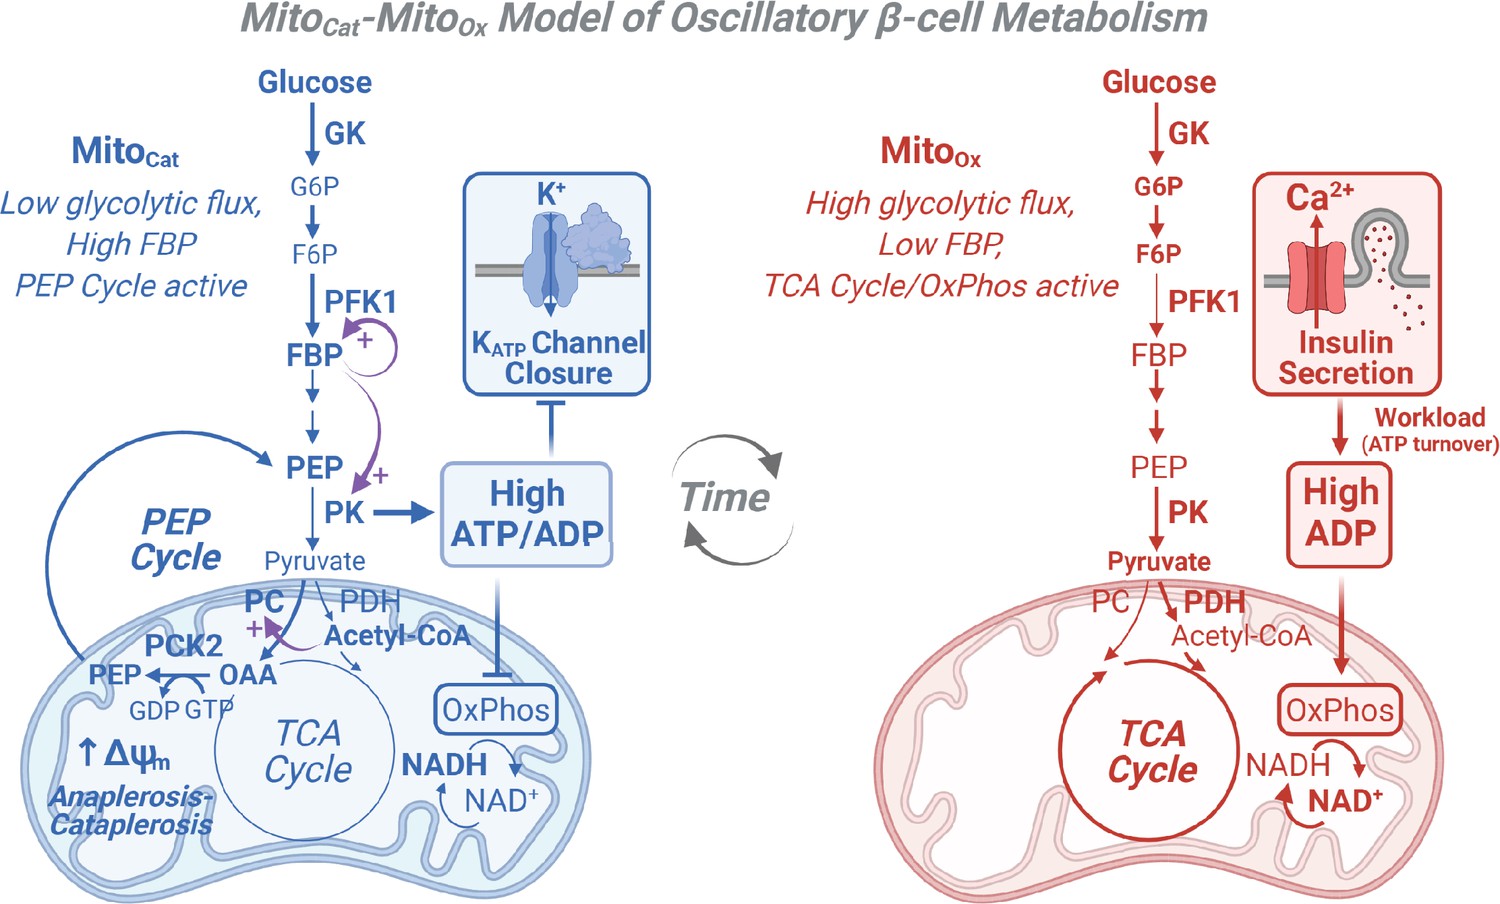
Cartoon depicting the MitoCat-MitoOx model of oscillatory β-cell metabolism.
MitoCat-MitoOx model of oscillatory β-cell metabolism with two states (triggering vs. secretory) separated by membrane depolarization. MitoCat is interchangeable with MitoSynth in Lewandowski et al., 2020 and is a more precise term reflecting the matched processes of anaplerosis and cataplerosis that are central to glucose signaling. MitoCat: Before depolarization, pyruvate kinase (PK) lowers ADP, reducing oxidative phosphorylation (OxPhos) and the TCA cycle, which raises acetyl-CoA that allosterically activates pyruvate carboxylase and PEP cataplerosis through phosphoenolpyruvate carboxykinase (PCK2). The return of PEP to the cytosol completes the PEP cycle and augments PK. MitoOx: After PK raises ATP/ADP sufficiently to close KATP channels, workload in the form of ATP hydrolysis restores ADP (e.g., by exocytosis and pumps), increasing OxPhos, TCA cycle, and glycolytic flux. Note that recruitable PK isoforms (M2 and L) are active before depolarization, when glycolytic flux is low and the fructose 1,6-bisphosphate (FBP) concentration is high.
Figure 1—figure supplement 2
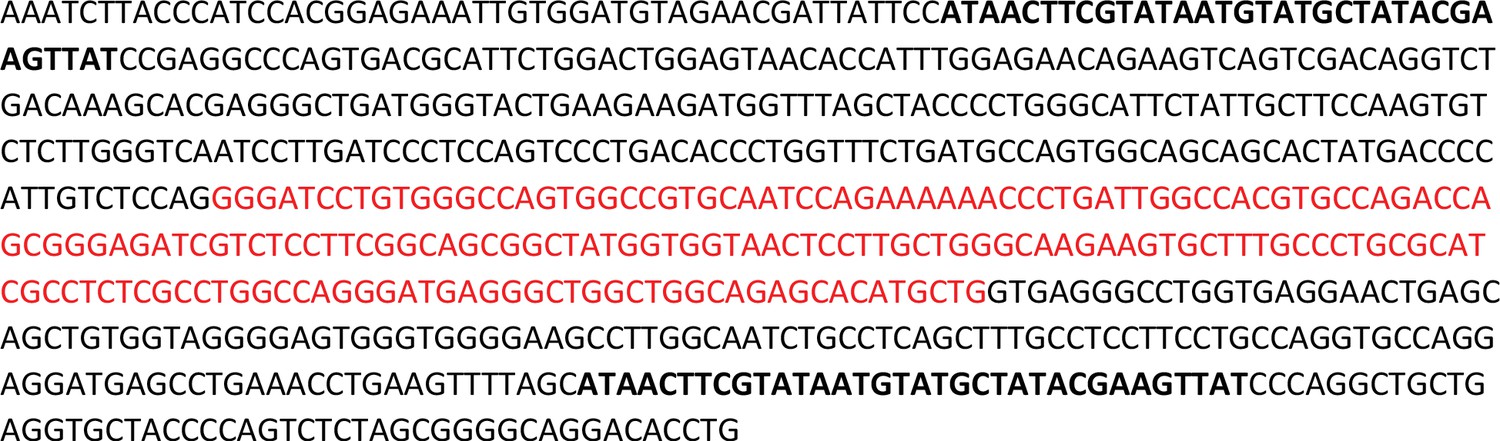
Sequence verification of PCK2f/f mice related to Figure 1.
Genomic DNA sequence of pck2 around exon 5 (ENSMUSE00000399990; in red), showing LoxP sites (bold) as confirmed by Illumina targeted deep sequencing.
Figure 1—figure supplement 3
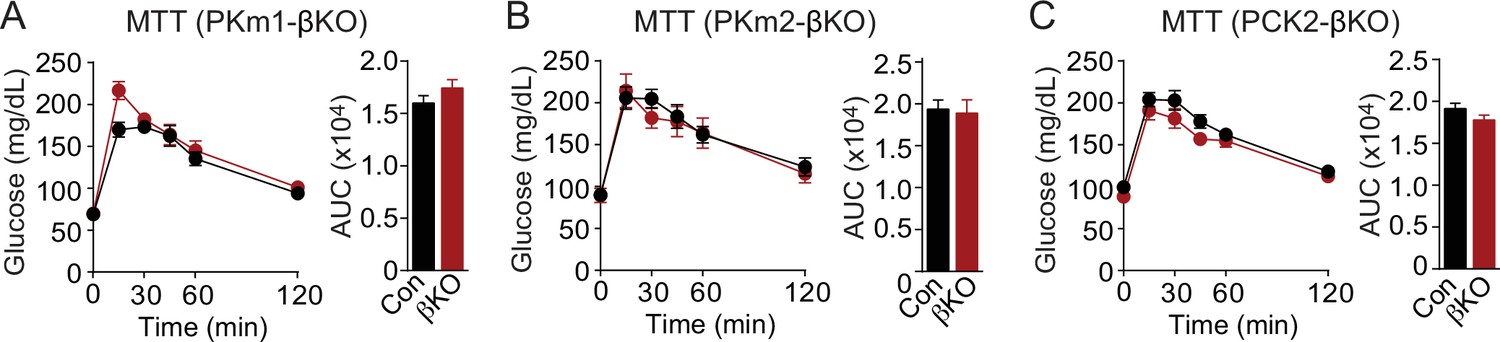
Meal tolerance of PKm1-, PKm2-, and PCK2-βKO mice related to Figure 1.
Meal tolerance test by oral gavage (Ensure, 10 mL/kg) of PKm1-βKO mice (n=8) and littermate controls (n=8 following the removal of one outlier by ROUT [Q=10%]) (A), PKm2-βKO mice (n=8) and littermate controls (n=9) (B), and Pck2-βKO mice (n=12) and littermate controls (n=11) (C) following an overnight fast. See Figure 1—figure supplement 3—source data 1 for source data. Data are shown as mean ± SEM. PCK2, phosphoenolpyruvate carboxykinase.
-
Figure 1—figure supplement 3—source data 1
Source data for meal tolerance tests.
- https://cdn.elifesciences.org/articles/79422/elife-79422-fig1-figsupp3-data1-v2.xlsx
Figure 2
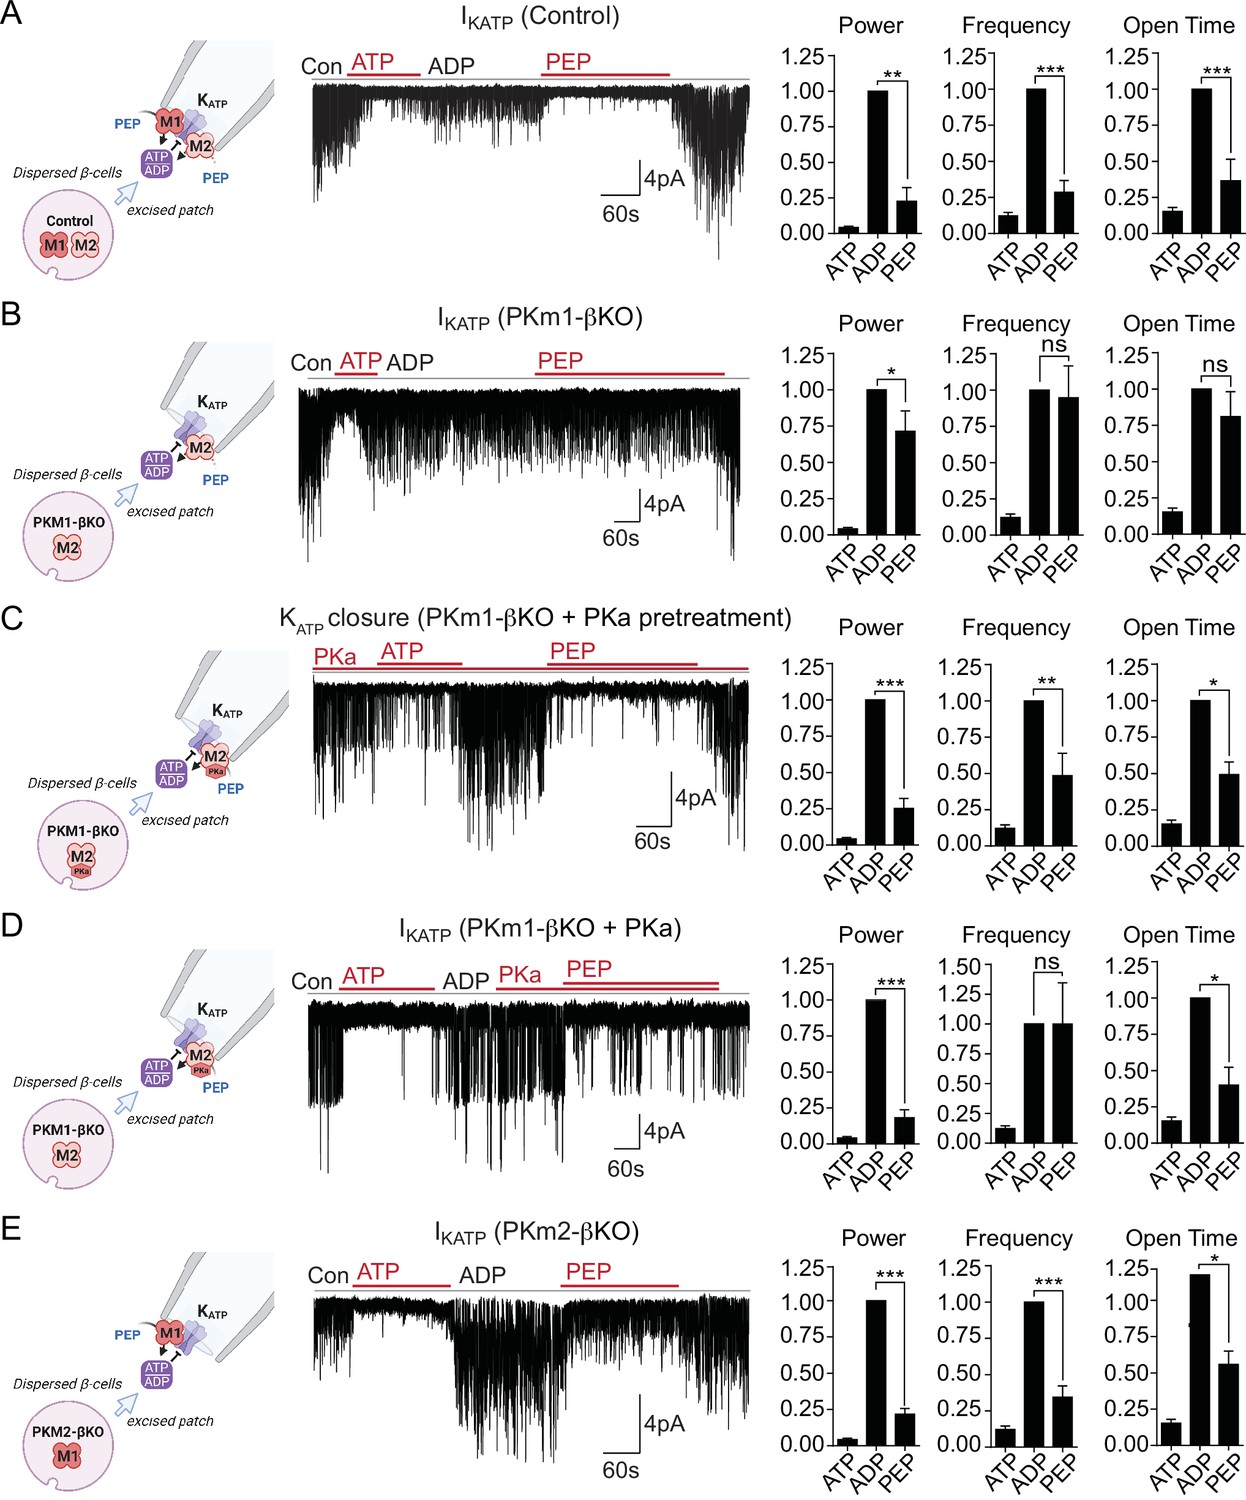
Plasma membrane KATP channels are locally regulated by a combination of PKm1 and allosterically activated PKm2.
(A–E) KATP channel activity (holding potential = –50 mV) quantified in terms of power, frequency, and open time. Applying the substrates for pyruvate kinase (PK) closes KATP channels in excised patches of β-cell plasma membrane from control mice (n=14 recordings from 4 mice) (A). Defective KATP channel closure in β-cells from PKm1-KO (n=20 recordings from 5 mice) (B) is rescued by PK activator (PKa) pretreatment (n=6 recordings from 3 mice) (C) and acute PKa application (n=7 recordings from 3 mice) (D). PKm1 is sufficient for KATP closure in β-cells from PKm2-βKO (n=6 recordings from 3 mice) (E). ATP, 1 mM; ADP, 0.5 mM ADP+ 0.1 mM ATP; PEP, 5 mM; PKa, 10 µM TEPP-46. See Figure 2—source data 1 for source data. Data are shown as mean ± SEM. *p<0.05, **p<0.01, ***p<0.001, ****p<0.0001 by paired t-test. (*)p<0.05 by unpaired t-test in (H).
-
Figure 2—source data 1
Source data for excised patch clamp experiments in Figure 2.
- https://cdn.elifesciences.org/articles/79422/elife-79422-fig2-data1-v2.xlsx
Figure 3 with 1 supplement
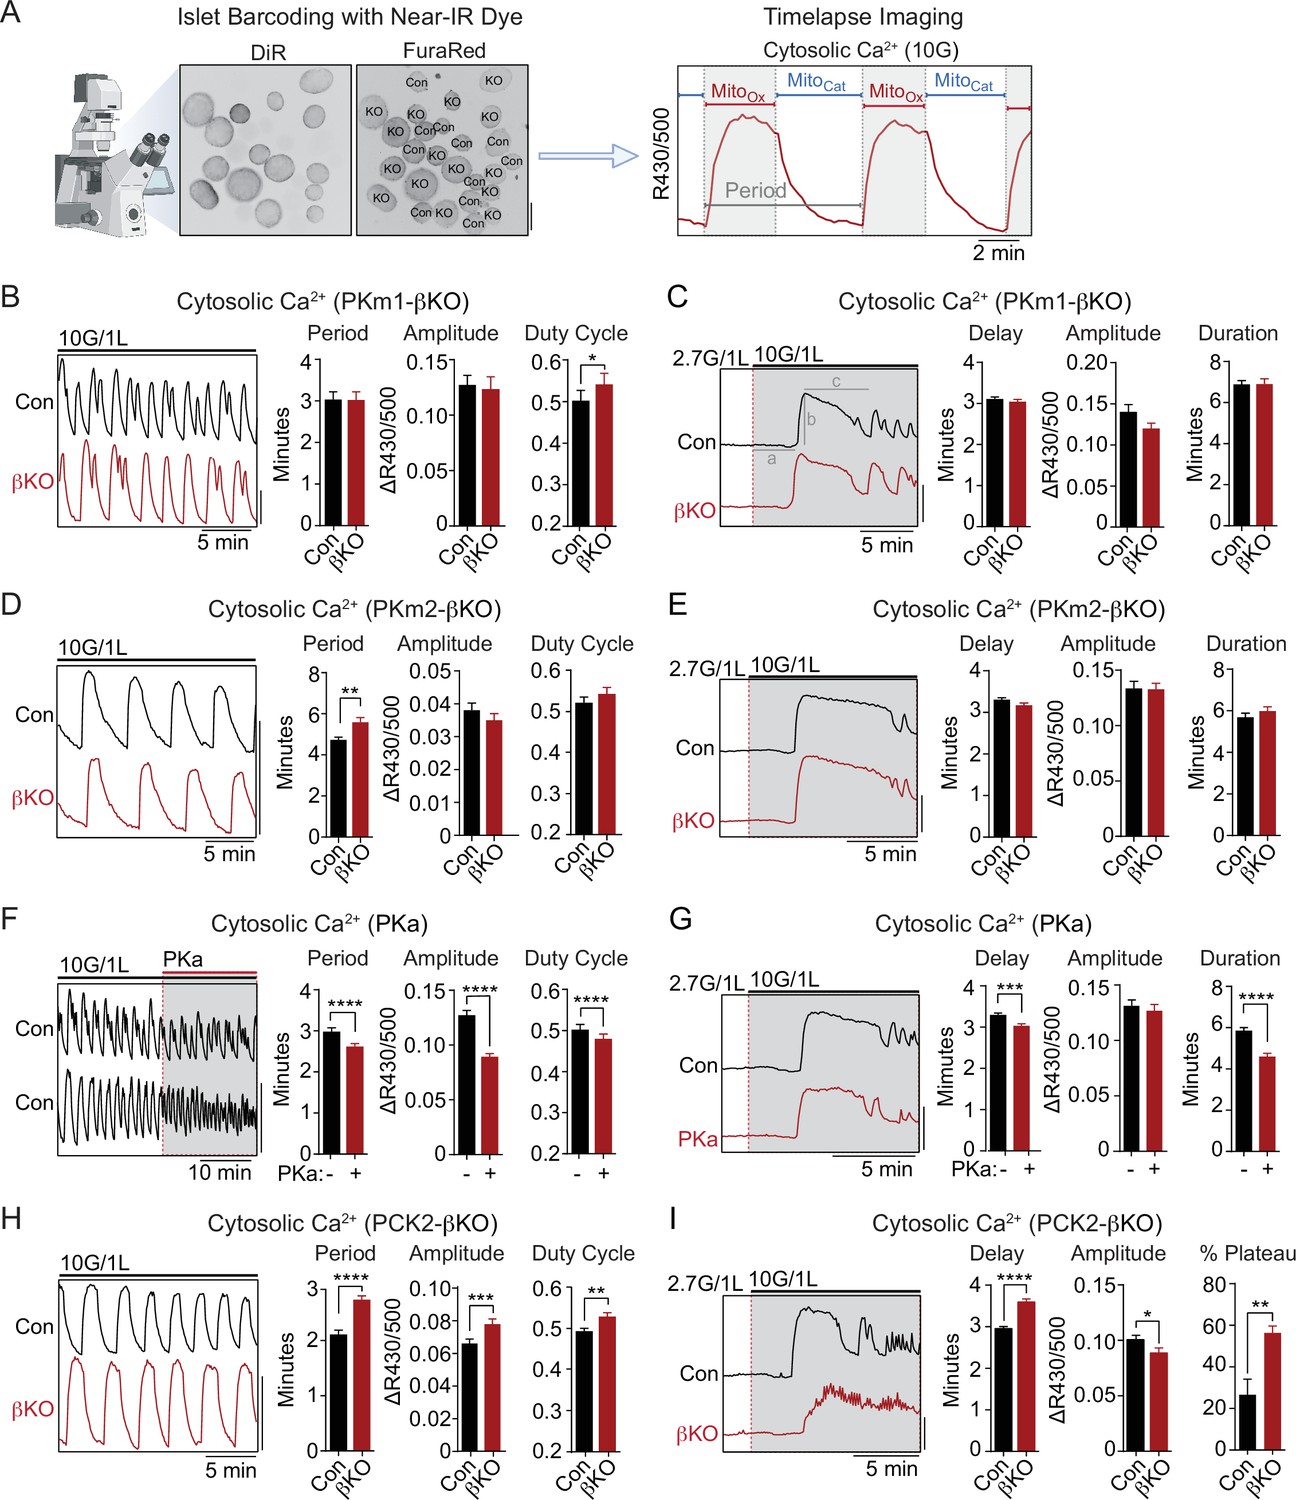
PKm2 and phosphoenolpyruvate carboxykinase (PCK2), but not PKm1, have metabolic control over first-phase and steady-state Ca2+ influx in response to glucose.
(A) Barcoding of islet preparations with near-IR dye (DiR) permits simultaneous timelapse imaging of islet Ca2+ dynamics of control and βKO mice (scale bar = 200 µm) (left). A representative trace illustrates the cataplerotic triggering phase (MitoCat) and oxidative secretory phases (MitoOx) of steady-state Ca2+ oscillations in the presence of 10 mM glucose and 1 mM leucine (right). Gray line denotes the period. (B, D, F, H) Representative traces and quantification of period, amplitude, and duty cycle of steady-state Ca2+ oscillations in islets from PKm1-βKO (n=94 islets from 3 mice) and littermate controls (n=91 islets from 3 mice) (B), PKm2-βKO (n=118 islets from 4 mice) and littermate controls (n=111 islets from 4 mice) (D), control mice treated with PK activator (PKa) (10 μM TEPP-46) (n=88 islets from 3 mice) (F), and PCK2-βKO (n=74 islets from 3 mice) and littermate controls (n=77 islets from 3 mice) (H). The bath solution (PSS) contained 10 mM glucose (10G) and 1 mM leucine. Scale bars: 0.1 FuraRed excitation ratio (R430/500). (C, E, G, I) Representative Ca2+ traces and quantification of time to depolarization (a), first-phase amplitude (b), and first-phase duration (c) in islets from PKm1-βKO (n=144 islets from 6 mice) and littermate controls (n=150 islets from 6 mice) (C), PKm2-βKO (n=52 islets from 2 mice) and littermate controls (n=55 islets from 2 mice) (E), PKa-treated (10 μM TEPP-46) (n=161 islets from 9 mice) and vehicle controls (n=212 islets from 9 mice) (G), and PCK2-βKO (n=73 islets from 3 mice) and littermate controls (n=78 islets from 3 mice) (I). The bath solution (PSS) contained 1 mM leucine and 2.7 mM (2.7G) and 10 mM glucose (10G) as indicated. Scale bars: 0.1 FuraRed excitation ratio (R430/500). See Figure 3—source data 1 for source data. Data are shown as mean ± SEM. *p<0.05, **p<0.01, ***p<0.001, ****p<0.0001 by unpaired t-test (A–C, and E–I) and paired t-test (D).
-
Figure 3—source data 1
Source data for calcium imaging assays in Figure 3.
- https://cdn.elifesciences.org/articles/79422/elife-79422-fig3-data1-v2.xlsx
Figure 3—figure supplement 1

Supplemental quantification of steady-state Ca2+ dynamics related to Figure 3.
(A) The steady-state Ca2+ response of mouse islets to pyruvate kinase (PK) activator (PKa, 10 μM TEPP-46) shows a primarily one-tailed distribution toward reduced period. 10 mM glucose. n=76 islets from 3 mice. (B) Quantification of the average duration of the silent phase (MitoCat) and active phase (MitoOx) of steady-state islet Ca2+ oscillations from control mice with and without PKa in the presence of 10 mM glucose and 1 mM leucine (PKa, 10 µM TEPP-46). Control+vehicle n=91 from 3 mice, control+PKa n=92 from 3 mice. (C) Quantification of the average duration of the silent phase (MitoCat) and active phase (MitoOx) of steady-state islet Ca2+ oscillations from PCK2-βKO mice and littermate controls in the presence of 10 mM glucose and 1 mM leucine. Control, n=74 islets from 3 mice; PCK2-βKO, n=77 islets from 3 mice. See Figure 3—figure supplement 1—source data 1 for source data. Data are shown as mean ± SEM. **p<0.01, ****p<0.0001 by unpaired t-test.
-
Figure 3—figure supplement 1—source data 1
Source data for quantification of calcium assays in Figure 3—figure supplement 1.
- https://cdn.elifesciences.org/articles/79422/elife-79422-fig3-figsupp1-data1-v2.xlsx
Figure 4
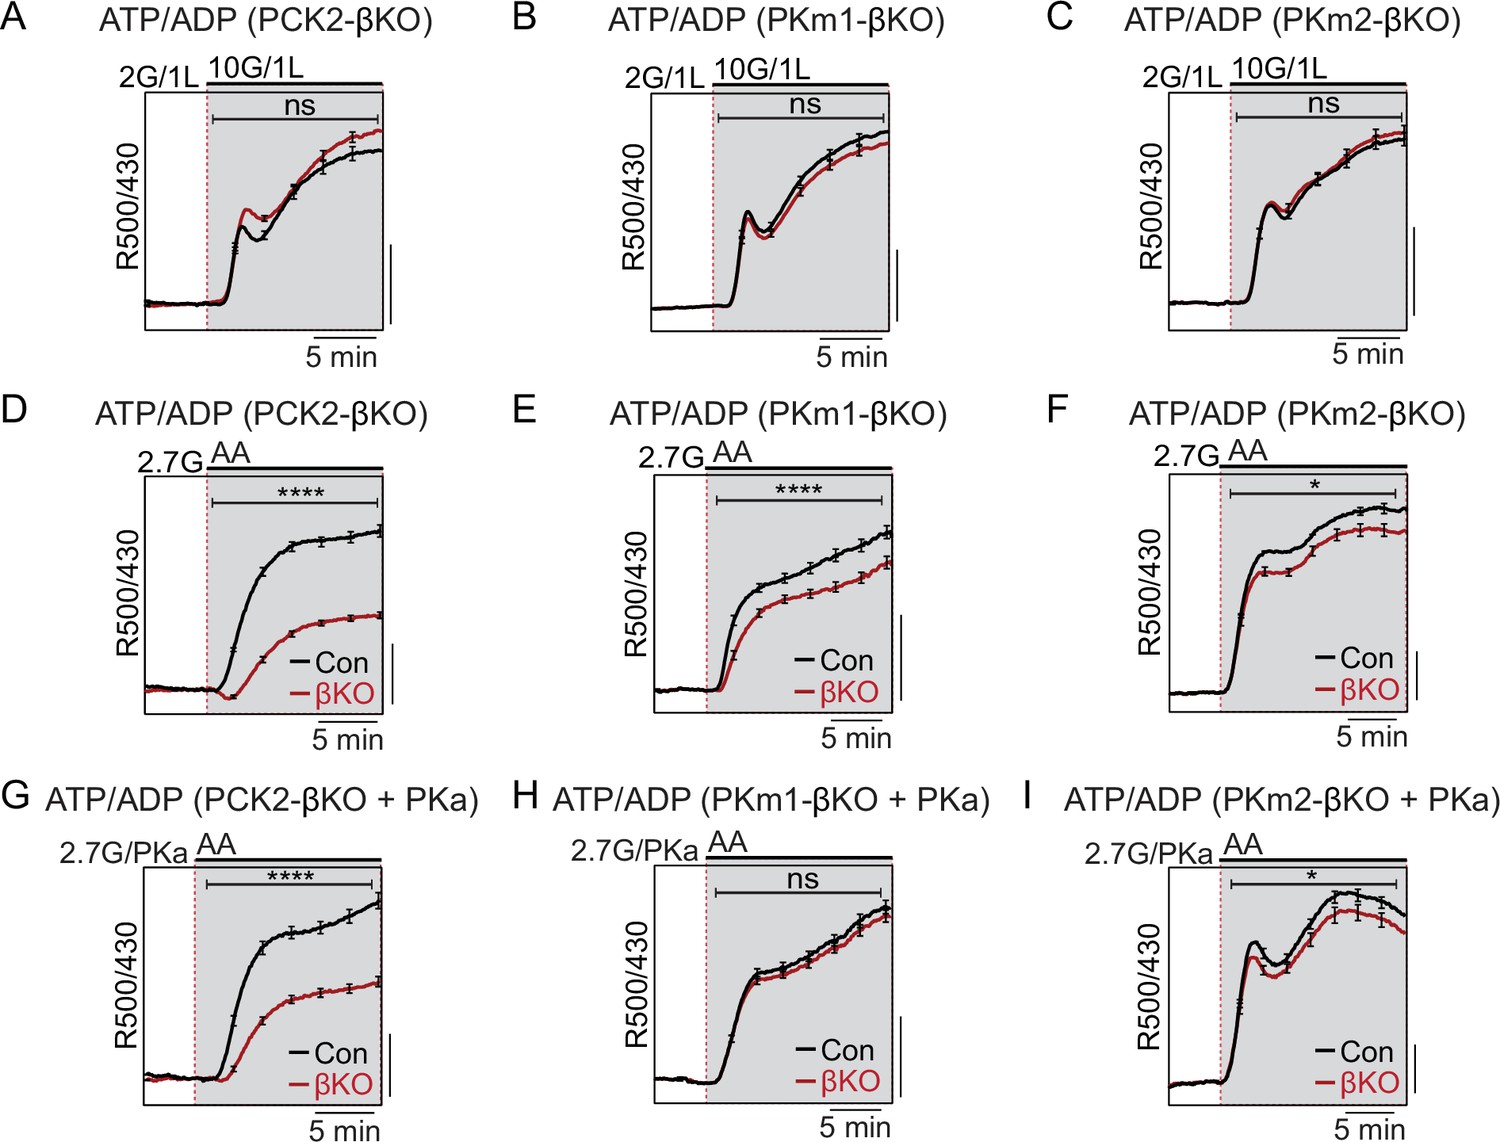
Restriction of the glycolytic phosphoenolpyruvate (PEP) supply reveals the importance of PEP carboxykinase (PCK2) for cytosolic ATP/ADP.
Average β-cell ATP/ADPc in islets from PCK2-βKO (A, D, G), PKm1-βKO (B, F, H), and PKm2-βKO (C, F, I) mice in response to glucose in the presence of 1 mM leucine (A–C) or mixed amino acids (AA) provided at three times their physiological concentrations (×1=Q, 0.6 mM; L, 0.5 mM; R, 0.2 mM; A, 2.1 mM) in the presence of 2.7 mM glucose (2.7G) to remove the enolase contribution to cytosolic PEP (D–I). Pyruvate kinase activator (PKa) (10 μM TEPP-46) was present in G, H, and I. ATP/ADPc is quantified as area under the curve from PCK2-βKO (A, n=65 islets from 3 mice; D, n=73 islets from 3 mice; G, n=71 islets from 3 mice) and littermate controls (A, n=63 islets from 3 mice; D, n=90 islets from 3 mice; G, n=77 islets from 3 mice); PKm1-βKO (B, n=88 islets from 3 mice; E, n=66 islets from 3 mice; H, n=72 islets from 3 mice) and littermate controls (B, n=92 islets from 3 mice; E, n=69 islets from 6 mice; H, n=69 islets from 3 mice); and PKm2-βKO (C, n=86 islets from 3 mice; F, n=99 islets from 3 mice; I, n=89 islets from 3 mice) and littermate controls (C, n=90 islets from 3 mice; F, n=100 islets from 6 mice; I, n=85 islets from 3 mice). Scale bars: 0.025 Perceval-HR excitation ratio for A–C and 0.1 Perceval-HR excitation ratio for D–I (R500/430). See Figure 4—source data 1 for source data. Data are shown as mean ± SEM. *p<0.05, ****p<0.0001 by t-test.
-
Figure 4—source data 1
Source data for beta cell ATP/ADP measurements in Figure 4.
- https://cdn.elifesciences.org/articles/79422/elife-79422-fig4-data1-v2.xlsx
Figure 5
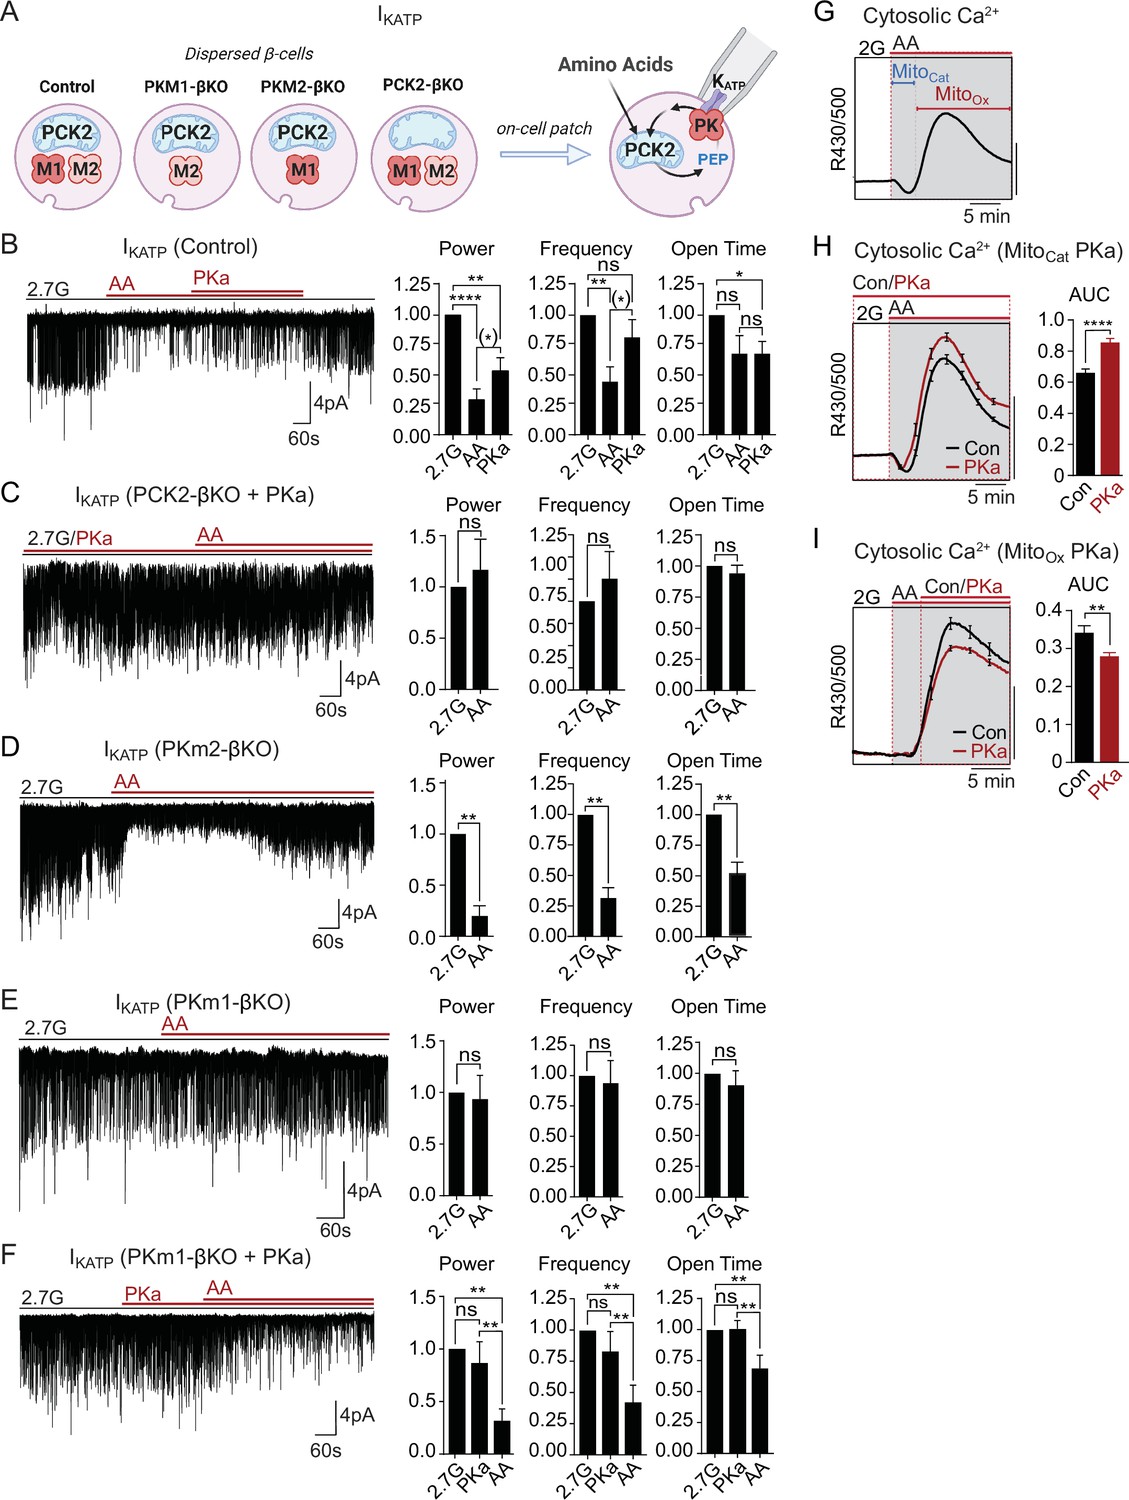
Mitochondrial phosphoenolpyruvate (PEP) signals to pyruvate kinase (PK) within the plasma membrane KATP channel microcompartment in intact β-cells.
(A) Diagram of on-cell patch clamp method in intact β-cells with bath application of amino acids (AA). (B–F) Representative example traces and quantification of KATP channel closure in terms of normalized power, frequency, and open time for β-cells from control (n=10 recordings from 3 mice) (B), PCK2-βKO mice in the presence of PK activators (PKa) (10 µM TEPP-46) (n=10 recordings from 3 mice) (C), PKm2-βKO (n=7 recordings from 3 mice) (D), and PKm1-βKO (n=7 recordings from 3 mice) (E–F) in response to mixed AA and 2.7 glucose (2.7G) as in Figure 4. (G–I) AA-stimulated Ca2+ responses in control islets illustrating the MitoCat and MitoOx phases (G). The average Ca2+ response to PKa application during MitoCat (vehicle, n=575 islets from 8 mice; PKa, n=575 islets from 8 mice) (H) and MitoOx (vehicle, n=91 islets from 4 mice; PKa, n=108 islets from 4 mice) (I) is quantified as AUC. Scale bars: 0.025 FuraRed excitation ratio (R430/500). See Figure 5—source data 1 for source data. Data are shown as mean ± SEM. *p<0.05, **p<0.01, ***p<0.001, ****p<0.0001 by paired one-way ANOVA or paired t-test as appropriate. Following the removal of one outlier by ROUT (Q=10%), (*)p<0.05 by paired t-test in (B).
-
Figure 5—source data 1
Source data for on-cell patch clamp and calcium assays in Figure 5.
- https://cdn.elifesciences.org/articles/79422/elife-79422-fig5-data1-v2.xlsx
Figure 6 with 1 supplement
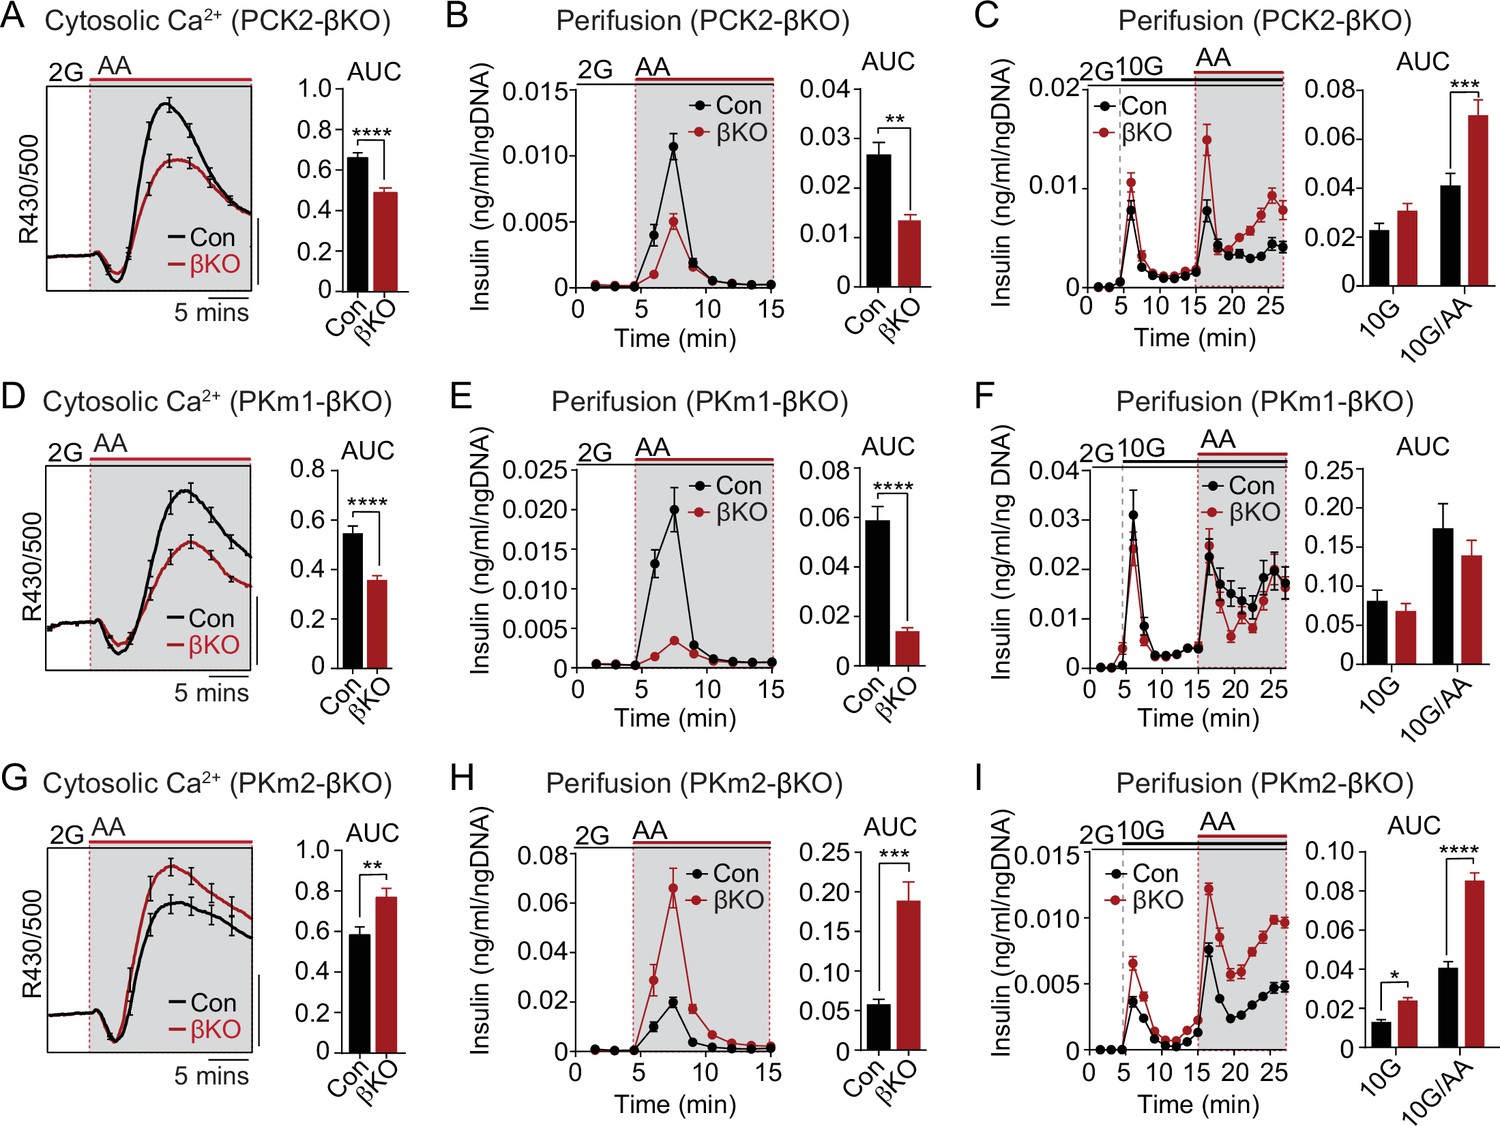
The PKm1/PKm2 ratio dictates the β-cell Ca2+ and secretory response to anaplerotic fuels.
Average cytosolic Ca2+ and insulin secretory responses in controls and PCK2-βKO (A–C), PKm1-βKO (D–F), and PKm2-βKO islets (G–I) to the indicated concentrations of glucose (2G, 2 mM; 10G, 10 mM) and amino acids (AA; concentrations are listed in Figure 4). Data are quantified as AUC. Islet Ca2+ data reflect n=60–101 islets from 3 mice per condition (scale bar = 0.025 FuraRed excitation ratio). Islet perifusion data reflect n=100 islets per mouse and 6 mice per condition except PKm2-βKO at high glucose (I) (5 mice). See Figure 6—source data 1 for source data. Data are shown as mean ± SEM. *p<0.05, **p<0.01, ***p<0.001, ****p<0.0001 by t-test. PCK2, phosphoenolpyruvate carboxykinase.
-
Figure 6—source data 1
Source data for calcium and insulin secretion assays in Figure 6.
- https://cdn.elifesciences.org/articles/79422/elife-79422-fig6-data1-v2.xlsx
Figure 6—figure supplement 1

Amino acid (AA)-stimulated Ca2+ influx in control and PKm2-βKO islets with and without PK activators (PKa) related to Figure 6.
Average cytosolic Ca2+ responses in controls (A) and PKm2-βKO islets (B) to 2 mM glucose (2G) and AA (concentrations are listed in Figure 4) with vehicle or with PKa (10 µM TEPP-46). Data are quantified as AUC. Islet Ca2+ data reflect n=35–61 islets from 3 mice per condition (scale bar = 0.025 FuraRed excitation ratio). See Figure 6—figure supplement 1—source data 1 for source data. Data are shown as mean ± SEM. **p<0.01 by t-test.
-
Figure 6—figure supplement 1—source data 1
Source data for calcium assays in Figure 6—figure supplement 1.
- https://cdn.elifesciences.org/articles/79422/elife-79422-fig6-figsupp1-data1-v2.xlsx
Tables
Key resources table
| Reagent type (species) or resource | Designation | Source or reference | Identifiers | Additional information |
|---|---|---|---|---|
| Strain, strain background (Mus musculus) | B6(Cg)-Ins1tm1.1(cre)Thor/J | The Jackson Laboratory | 26801 | |
| Strain, strain background (Mus musculus) | B6;129S-Pkmtm1.1Mgvh/J | The Jackson Laboratory | 24408 | |
| Strain, strain background (Mus musculus) | Pck2f/f | This paper | Mutant mouse | See ‘Mice’ in Materials and methods. Mouse can be obtained by request from Matthew Merrins. |
| Strain, strain background (Mus musculus) | Ucn3Cre | Mark Huising (University of CA-Davis) and Barak Blum (University of WI-Madison) | Mutant mouse | |
| Strain, strain background (Mus musculus) | Pkm1f/f | Matthew Vander Heiden (MIT) | Mutant mouse | |
| Strain, strain background (Mus musculus) | Pkm1f/f/Ins1Cre | This paper | Knockout mouse | See ‘Mice’ in Materials and methods. Mouse can be obtained by request from Matthew Merrins. |
| Strain, strain background (Mus musculus) | Pkm2f/f/Ins1Cre | This paper | Knockout mouse | See ‘Mice’ in Materials and methods. Mouse can be obtained by request from Matthew Merrins |
| Strain, strain background (Mus musculus) | Pck2f/f/Ucn3Cre | This paper | Knockout mouse | See ‘Mice’ in Materials and methods. Mouse can be obtained by request from Matthew Merrins. |
| Antibody | Anti-PKm2 (Rabbit monoclonal) | Cell Signaling | 4053 | WB (1:1000) |
| Antibody | Anti-PKm1 (Rabbit monoclonal) | Cell Signaling | 7067 | WB (1:1000) |
| Antibody | Anti-PCK2 (Rabbit polyclonal) | Cell Signaling | 6924 | WB (1:1000) |
| Antibody | Anti-β-Actin (Mouse monoclonal) | Cell Signaling | 3700 | WB (1:1000) |
| Antibody | Anti-HSP90 (Rabbit monoclonal) | Cell Signaling | 4877 | WB (1:1000) |
| Antibody | Anti-rabbit IgG, HRP-linked Antibody (Goat polyclonal) | Cell Signaling | 7074 | WB (1:20,000) |
| Antibody | Anti-mouse IgG, HRP-linked Antibody (Horse polyclonal) | Cell Signaling | 7076 | WB (1:20,000) |
| Chemical compound, drug | FuraRed | Molecular Probes | F3020 | |
| Chemical compound, drug | DiR'; DiIC18(7) (1,1'-Dioctadecyl-3,3,3',3'-Tetramethylindotricarbocyanine Iodide) | Thermo Fisher Scientific | D12731 | |
| Chemical compound, drug | DiD' solid; DiIC18(5) solid (1,1'-Dioctadecyl-3,3,3',3'-Tetramethylindodicarbocyanine, 4-Chlorobenzenesulfonate Salt) | Thermo Fisher Scientific | D7757 | |
| Other | Bio-Gel P-4 Media | Bio-Rad | 1504124 | Gio-gel used in perifusion assays |
| Commercial assay, kit | Promega Lumit Insulin Immunoassay | Promega | CS3037A01d | |
| Commercial assay, kit | PicoGreen dsDNA Assay Kit | Invitrogen | P7589 | |
| Chemical compound, drug | TEPP-46 (PKa) | MilliporeSigma Calbiochem | 50-548-70001 | |
| Chemical compound, drug | D-Fructose 1,6-bisphosphate trisodium salt hydrate | MilliporeSigma | F6803 | |
| Chemical compound, drug | Accutase solution | Sigma-Aldrich | A6964100ML | |
| Other | Microfilament borosilicate glass | Harvard Apparatus | 64-0792 | Capillaries used to make recording electrodes. |
| Software, algorithm | Clampfit analysis module | Molecular Devices | Pclamp 10 |
Additional files
Download links
A two-part list of links to download the article, or parts of the article, in various formats.
Downloads (link to download the article as PDF)
Open citations (links to open the citations from this article in various online reference manager services)
Cite this article (links to download the citations from this article in formats compatible with various reference manager tools)
β-cell deletion of the PKm1 and PKm2 isoforms of pyruvate kinase in mice reveals their essential role as nutrient sensors for the KATP channel
eLife 11:e79422.
https://doi.org/10.7554/eLife.79422


