Transcriptional regulation of Sis1 promotes fitness but not feedback in the heat shock response
- Department of Molecular Genetics and Cell Biology, University of Chicago, United States
- Committee on Genetics, Genomics, and Systems Biology, University of Chicago, United States
- Department of Electrical and Computer Engineering, University of Delaware, United States
- Department of Biomedical Engineering, University of Delaware, United States
- Department of Mathematical Sciences, University of Delaware, United States
- Center for Bioinformatics and Computational Biology, University of Delaware, United States
- Center for Physics of Evolving Systems, University of Chicago, United States
Figures
Figure 1 with 1 supplement
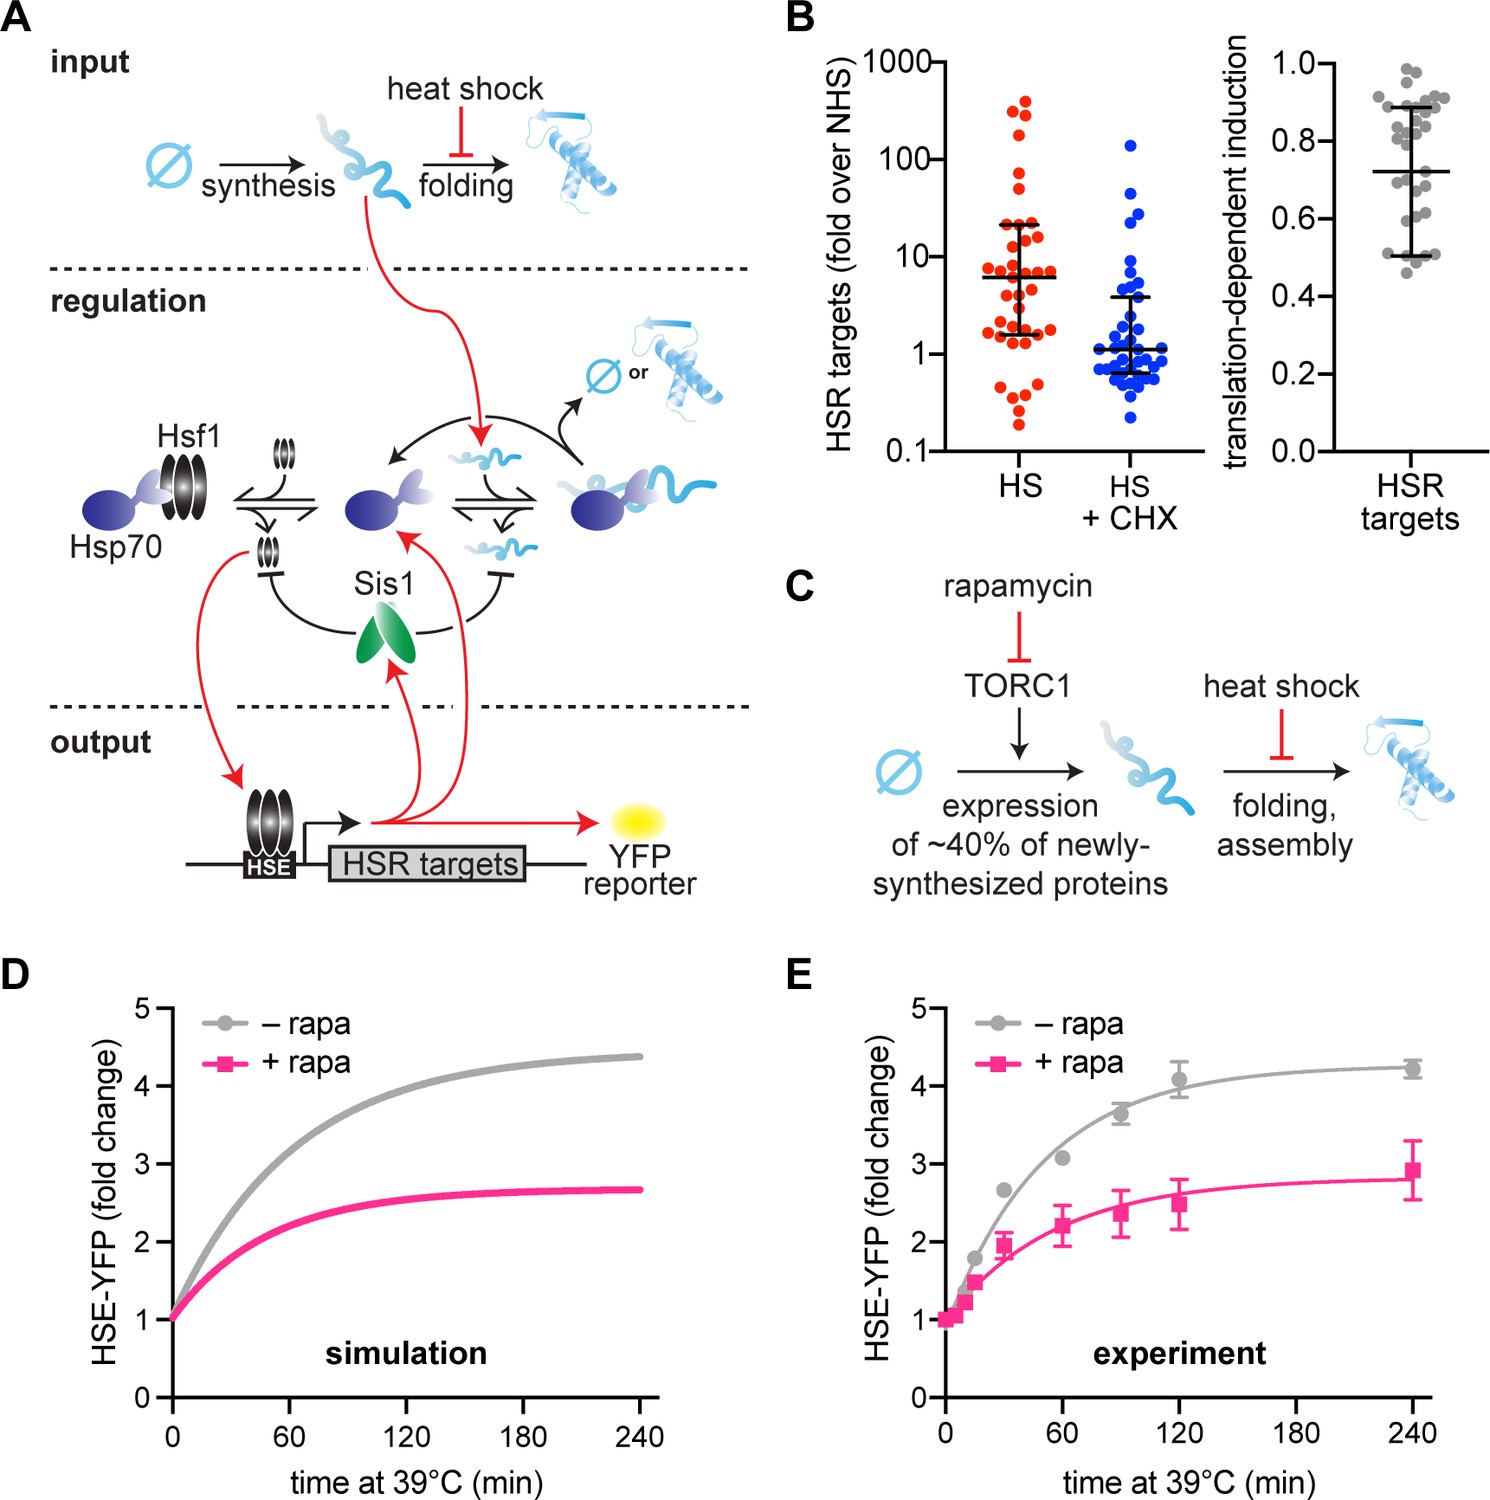
Newly synthesized proteins drive full activation of the heat shock response (HSR).
(A) Schematic of the mathematical model. Heat shock stalls folding of newly synthesized proteins so newly synthesized unfolded proteins accumulate. Hsp70 is recruited to unfolded proteins (red arrow) in turn releasing Hsf1 to induce its transcriptional targets. Among these targets are Hsp70 and Sis1 (and HSE-YFP, our ectopic reporter of Hsf1 activity). Of note, Sis1 has two known roles. It substantiates Hsf1–Hsp70 binding and substantiates Hsp70-misfolded protein interactions. (B) Hsf1 target gene transcript levels, relative to non-heat shock levels. Cells were treated with 200 µg/ml cycloheximide (CHX; blue) and subjected to 42°C heat shock for 20 min. Untreated control (red) plotted for comparison (red). Raw data from Triandafillou et al., 2020. One minus the transcript levels of CHX-treated over untreated cells is the portion of transcriptional induction which depends on ongoing translation (right graph). Each data point represents an Hsf1 target gene. (C) Model of rapamycin effect. Heat shock stalls newly synthesized protein folding, and newly synthesized unfolded proteins trigger the HSR. Upstream, rapamycin inhibits target of rapamycin complex 1 (TORC1) which inhibits ribosomal protein production, causing a 40% decrease in newly synthesized proteins. (D) HSE-YFP levels during heat shock. Cells are pretreated with 10 µg/ml rapamycin 5 min before heat shock (pink) and compared to untreated control (gray). Each time point represents the average of the three biological replicates. Error bar represents the standard deviation of three replicates. (E) Simulation of HSE-YFP levels during heat shock with or without rapamycin.
Figure 1—figure supplement 1
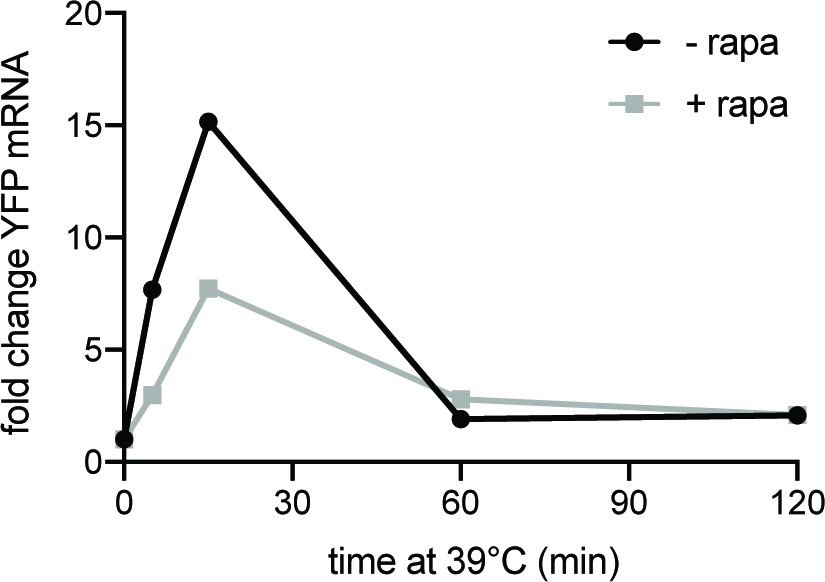
Rapamycin reduces HSE-YFP at the mRNA level RNA levels during heat shock relative to non-heat shock, measured by qRT-PCR.
Cells treated with 10 µg/ml rapamycin for 5 min before heat shock (gray) and compared to untreated control.
Figure 2
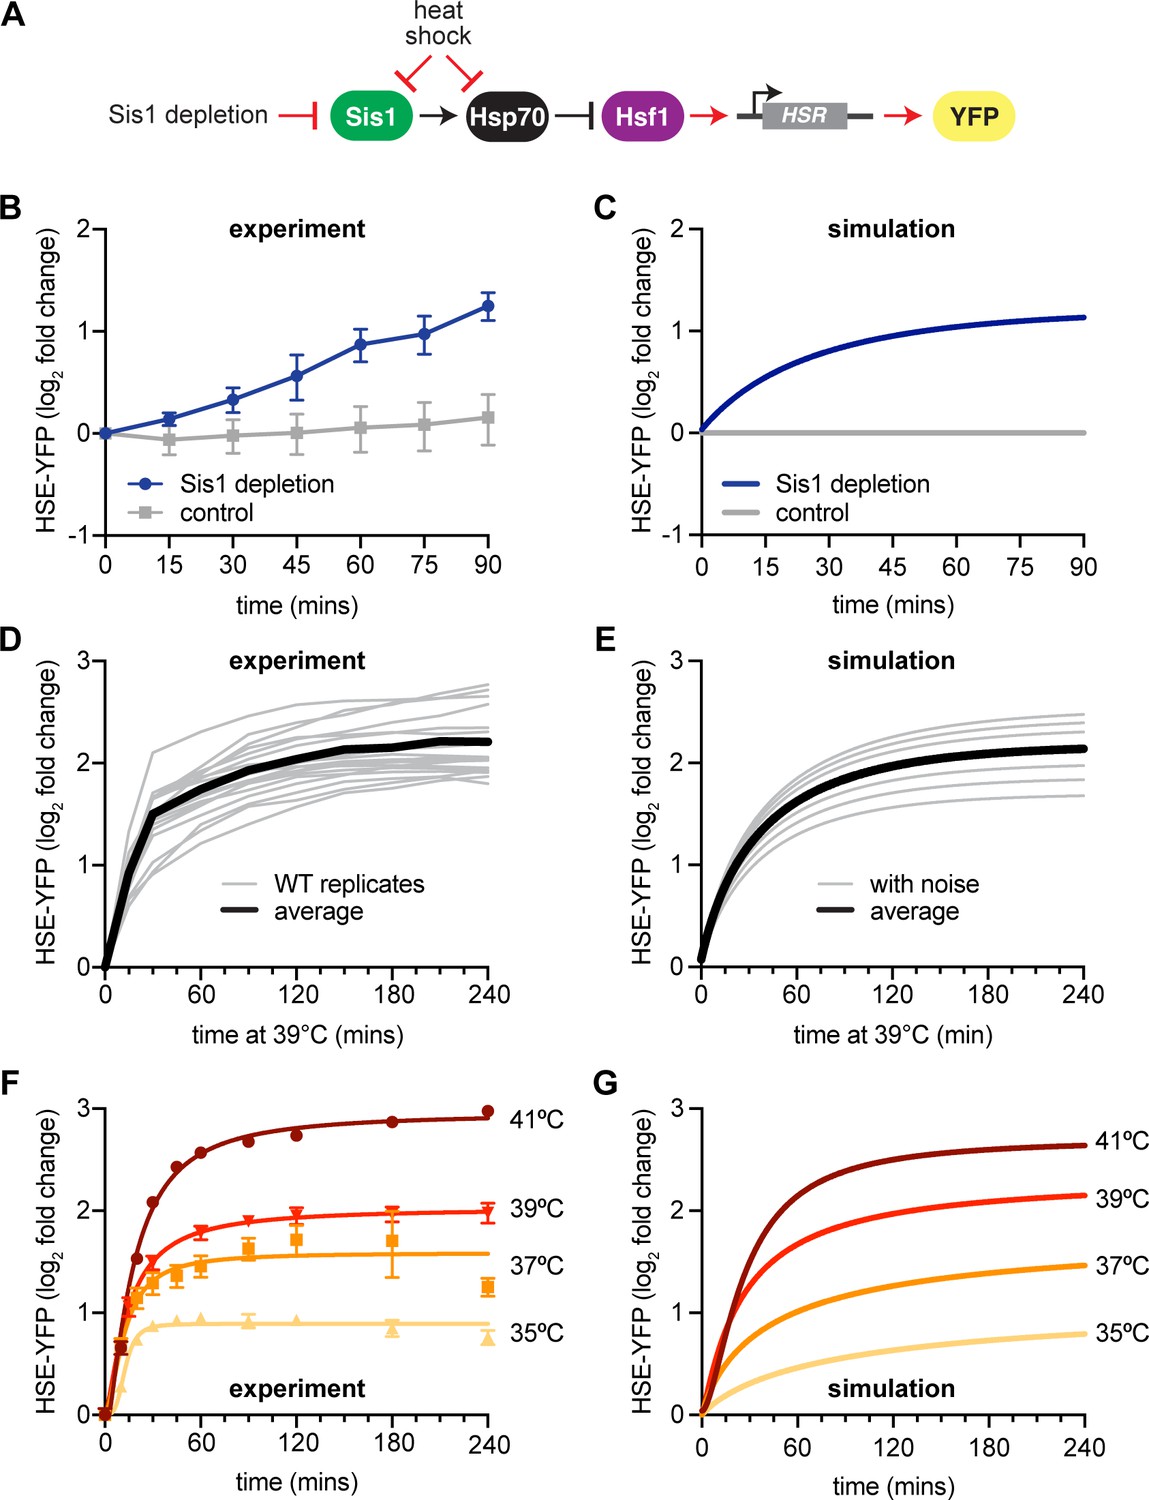
New heat shock response (HSR) model recapitulates experimental results.
(A) Model of Sis1 effect. In non-heat shock, Sis1 promotes Hsp70 binding to Hsf1, repressing transcriptional activation of the HSR. Heat shock results in the titration of Hsp70 and Sis1, leaving Hsf1 free to induce the HSR and the ectopic reporter of Hsf1 activity, HSE-YFP (red arrows). (B) HSE-YFP levels after nuclear Sis1 depletion (blue) at 30°C, measured by flow cytometry. Sis1 was anchored away to cytosolic ribosomes using 10 µg/ml rapamycin and the time course was started immediately. (C) Simulation of HSE-YFP reporter after Sis1 depletion. (D) HSE-YFP expression in wild-type cells across 18 biological replicates (gray). Average in black. (E) Simulation of variation in the wild-type HSR due to metabolic differences leading to changes in basal translation rate. (F) HSE-YFP heat shock time courses at a range of heat shock temperatures between 35 and 41°C. (G) Simulation of heat shock time courses at different induction temperatures. Heat shock at higher temperatures was simulated by a proportional decrease in protein folding rate.
Figure 3 with 1 supplement
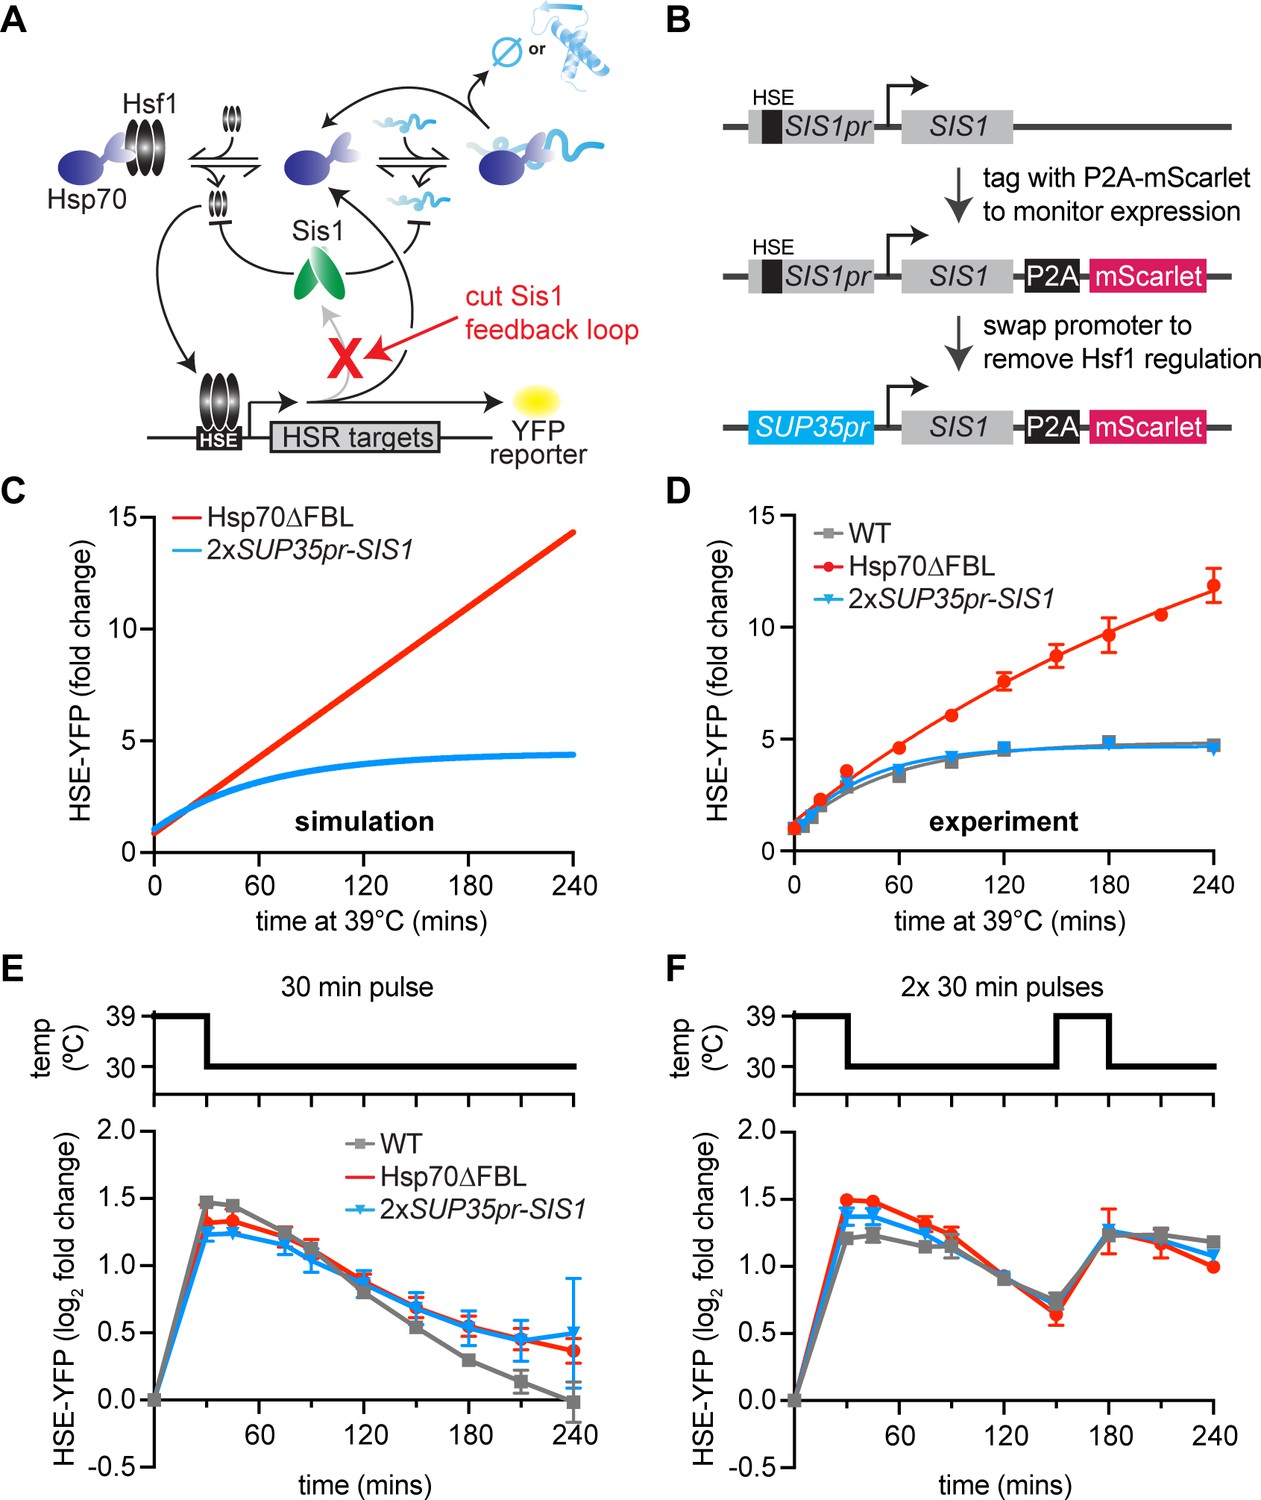
Transcriptional induction of Sis1 is dispensable for Hsf1 deactivation.
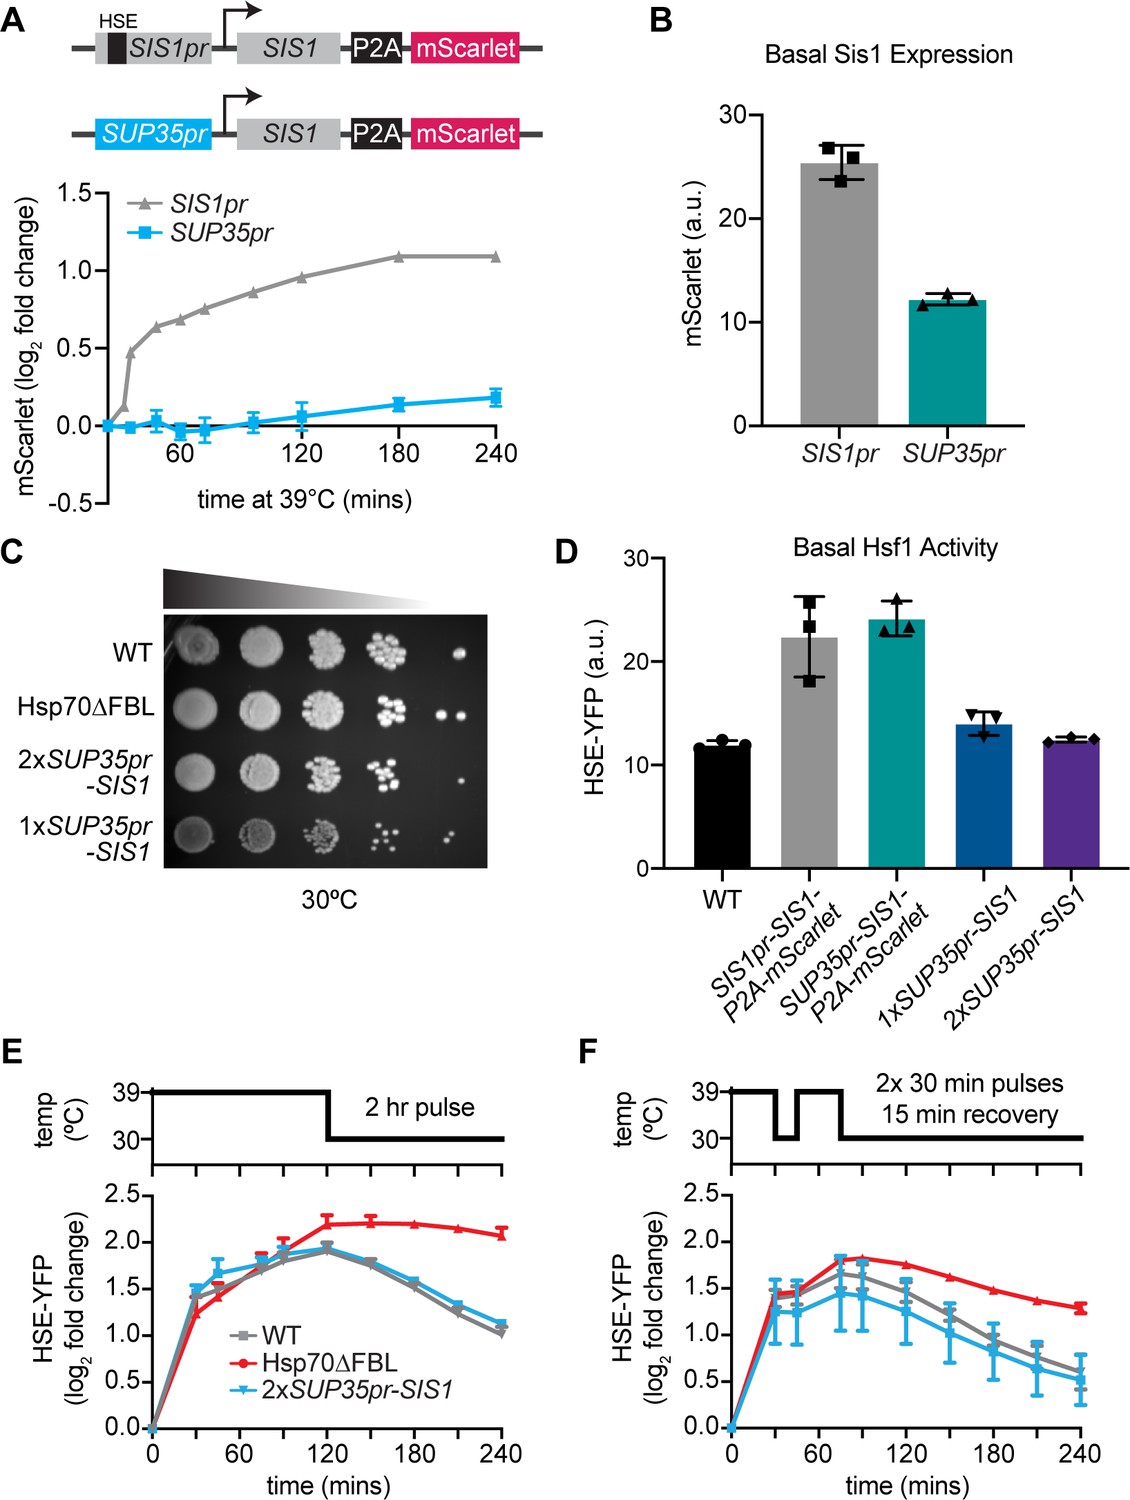
(A) Network schematic. Sis1 induction by Hsf1 is cut to test whether Sis1 induction is necessary for normal Hsf1 regulation. (B) Generating the non-inducible Sis1 mutant. mScarlet fluorescent protein reports on Sis1 transcription and the Sis1 promoter is replaced with a non-inducible promoter. (C) HSE-YFP levels over a heat shock time course, measured by flow cytometry. Each data point represents the average and standard deviation of three biological replicates. (D) Simulation of HSE-YFP when Sis1 or Hsp70 is maintained at basal expression level during heat shock. (E) HSE-YFP levels during a 30-min heat shock followed by recovery at 30°C. (F) HSE-YFP levels during two 30-min heat shock intervals, separated by a 2-hr recovery at 30°C.
Figure 3—figure supplement 1
Decoupling Sis1 from Hsf1 regulation.
(A) Heat shock time course of mScarlet levels in WT (gray) and non-inducible Sis1 (blue) lines measured by flow cytometry. The WT line contains a heat shock element (HSE) in the native enhancer sequence, where Hsf1 binds to induce transcription (top, gray line). A non-inducible Sup35 promoter drives Sis expression (bottom, blue line). In both cell lines, mscarlet, separated by a ribosomal skip sequence (P2A), is the tagless reporter of Sis1 transcription. Data points represent the average and standard deviation of three biological replicates. (B) Raw mScarlet reporter level in non-heat shock, 1xSup35pr-Sis1 and WT lines. (C) Dilution series spot assay of all lines. WT, Hsp70∆FBL, and 1xSup35pr-Sis1 and 2xSup35pr-Sis1 lines grown for 3 days at 30°C. (D) Basal HSE-YFP reporter expression of all lines measured by flow cytometry. (E) HSE-YFP reporter during 2-hr heat shock, followed by recovery at 30°C. Fluorescence quantified by flow cytometry. (F) HSE-YFP reporter levels over two 30-min heat shocks separated by a 15-min recovery period at 30°C.
Figure 4
Sis1 is induced slowly and localizes away from Hsf1 following heat shock.
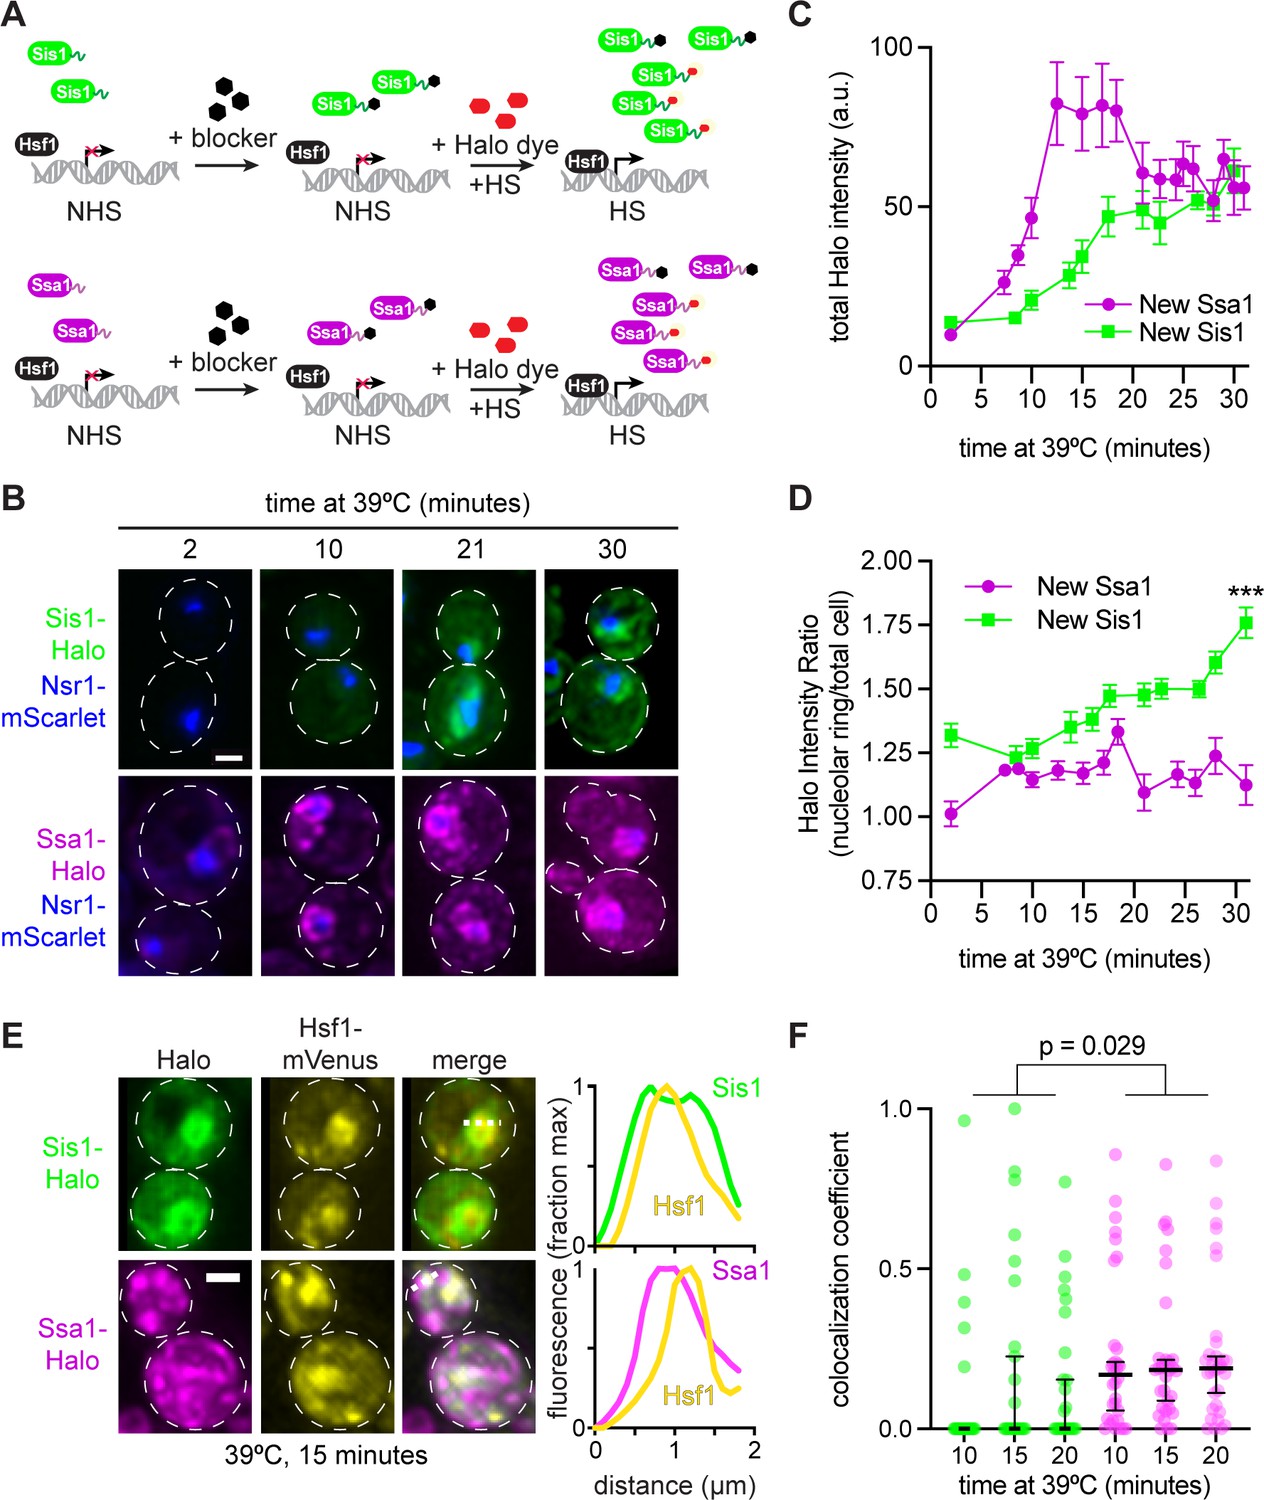
(A) Experiment workflow. Cells were treated with 20 µM 7-bromoheptanol for 5 min, then incubated in 20 µM of JF646 Halo dye at 39°C. Halo fluorescence thus marks the population of Sis1 or Hsp70 translated during heat shock. (B) Representative deconvolved live cell images captured by lattice light sheet microscopy. Cells imaged after 2-,10-, 21-, and 30-min heat shock. Cells express Nsr1-mscarlet as well as Sis1-Halo or Ssa1-Halo dye. Scale bar represents 2 µm. (C) Quantification of total cell Halo intensity during heat shock time course. Each point represents the mean of the average Halo intensity across 5–20 cells. Error bars represent the standard error. (D) Quantification of mean Halo intensity at the nucleolar periphery divided by mean Halo intensity in the total cell. Each data point represents the average ratio across 5–20 cells. Error bars indicate the standard error. ***, p<0.001 by two tailed t-test. (E) (Left) Representative deconvolved live cell images captured by lattice light sheet microscopy of cells expressing Hsf1-mVenus and newly synthesized Sis1 or Ssa1. (Right) Normalized fluorescence intensity along the dotted line shown in the images. (F) Single-cell analysis of the fraction of total newly synthesized Sis1 (green) or Ssa1 (magenta) that colocalizes with Hsf1. Lines are at the median, and error bars depict 95% confidence intervals.
Figure 5 with 1 supplement
Sis1 transcriptional regulation confers fitness under stress.
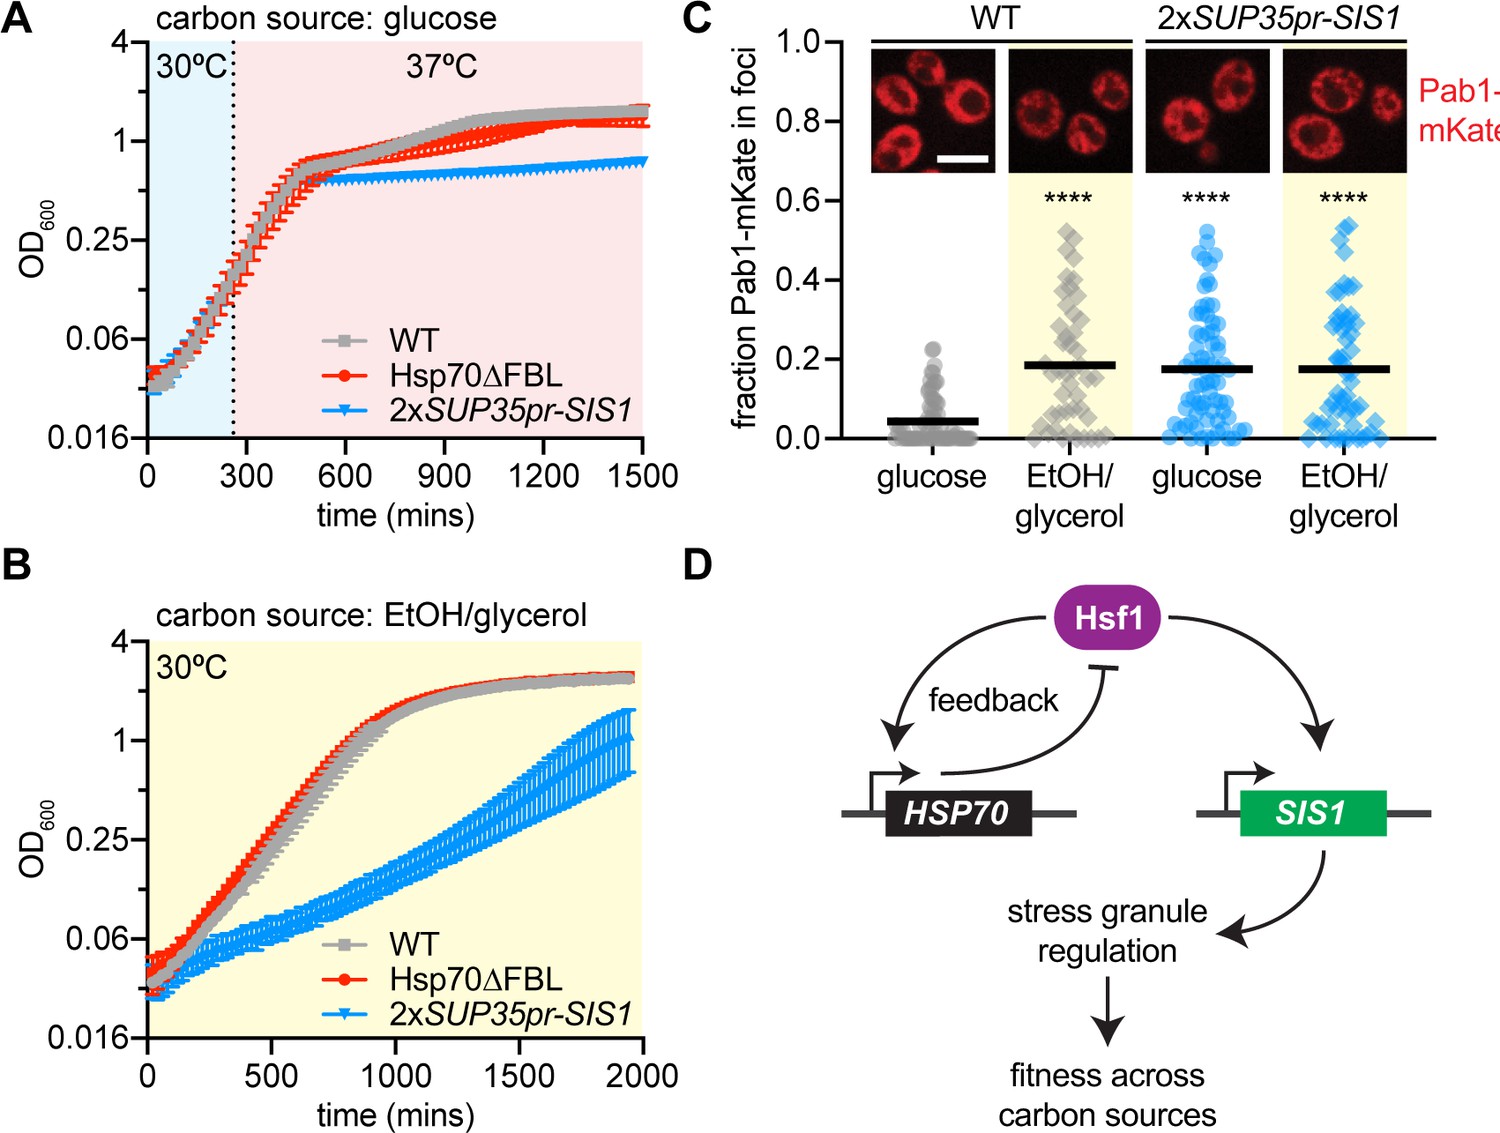
(A) Quantitative growth curve of non-inducible strains during heat shock (37°C). (B) Quantitative growth curve of non-inducible strains during growth in limited carbon media (2% glycerol, 2% EtOH) in non-heat shock (30°C). (C) Single-cell quantification of the fraction of Pab1-mCherry localized in foci as determined by the FindFoci plugin in Fiji. Inset: Representative deconvolved live cell images captured by lattice light sheet microscopy of cells expressing Pab1-mKate. (D) Model of the differential roles of transcriptional regulation of Hsp70 and Sis1 in feedback and fitness, respectively.
Figure 5—figure supplement 1
Additional growth curves.
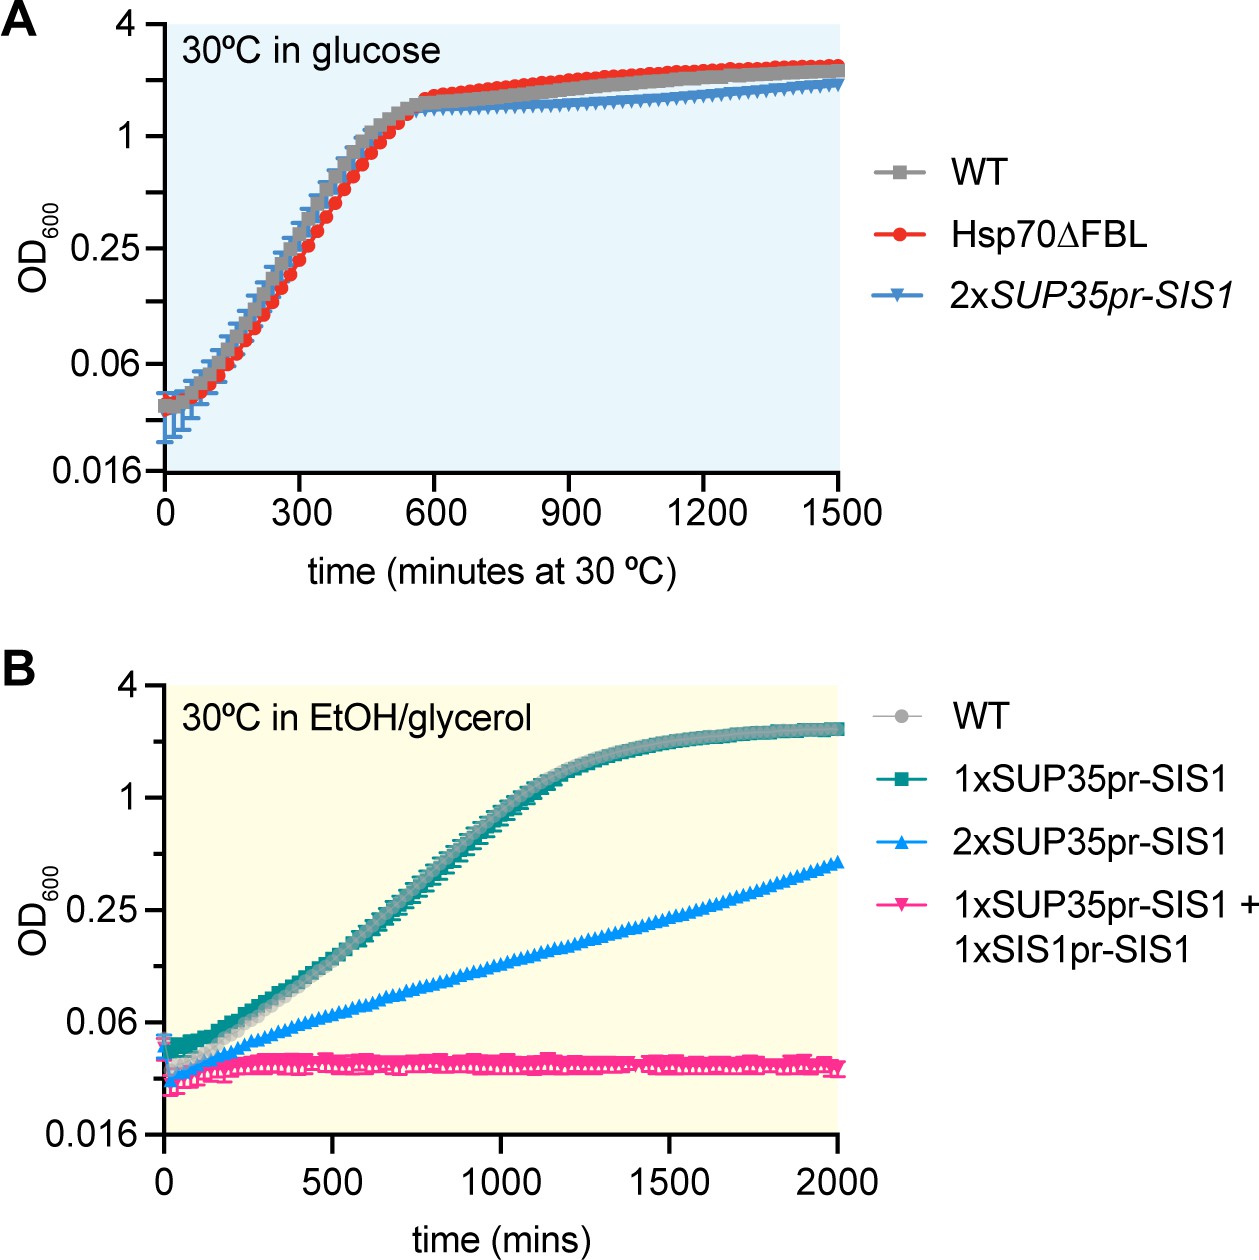
(A) Quantitative growth curve of non-inducible strains glucose media under non-heat shock conditions. (B) Quantitative growth curve of strains with low, medium, and high levels of non-inducible Sis1 grown in EtOH/glycerol.
Additional files
-
Supplementary file 1
Table of yeast strains used in this study.
Associated with all figures.
- https://cdn.elifesciences.org/articles/79444/elife-79444-supp1-v2.xlsx
-
MDAR checklist
- https://cdn.elifesciences.org/articles/79444/elife-79444-mdarchecklist1-v2.pdf
Download links
A two-part list of links to download the article, or parts of the article, in various formats.
Downloads (link to download the article as PDF)
Open citations (links to open the citations from this article in various online reference manager services)
Cite this article (links to download the citations from this article in formats compatible with various reference manager tools)
Transcriptional regulation of Sis1 promotes fitness but not feedback in the heat shock response
eLife 12:e79444.
https://doi.org/10.7554/eLife.79444


