Rate-distortion theory of neural coding and its implications for working memory
- Section of Life Sciences Engineering, École Polytechnique Fédérale de Lausanne, Switzerland
- Department of Neurobiology, Harvard Medical School, United States
- Department of Psychology and Center for Brain Science, Harvard University, United States
- Center for Brains, Minds, and Machines, MIT, United Kingdom
Figures
Figure 1
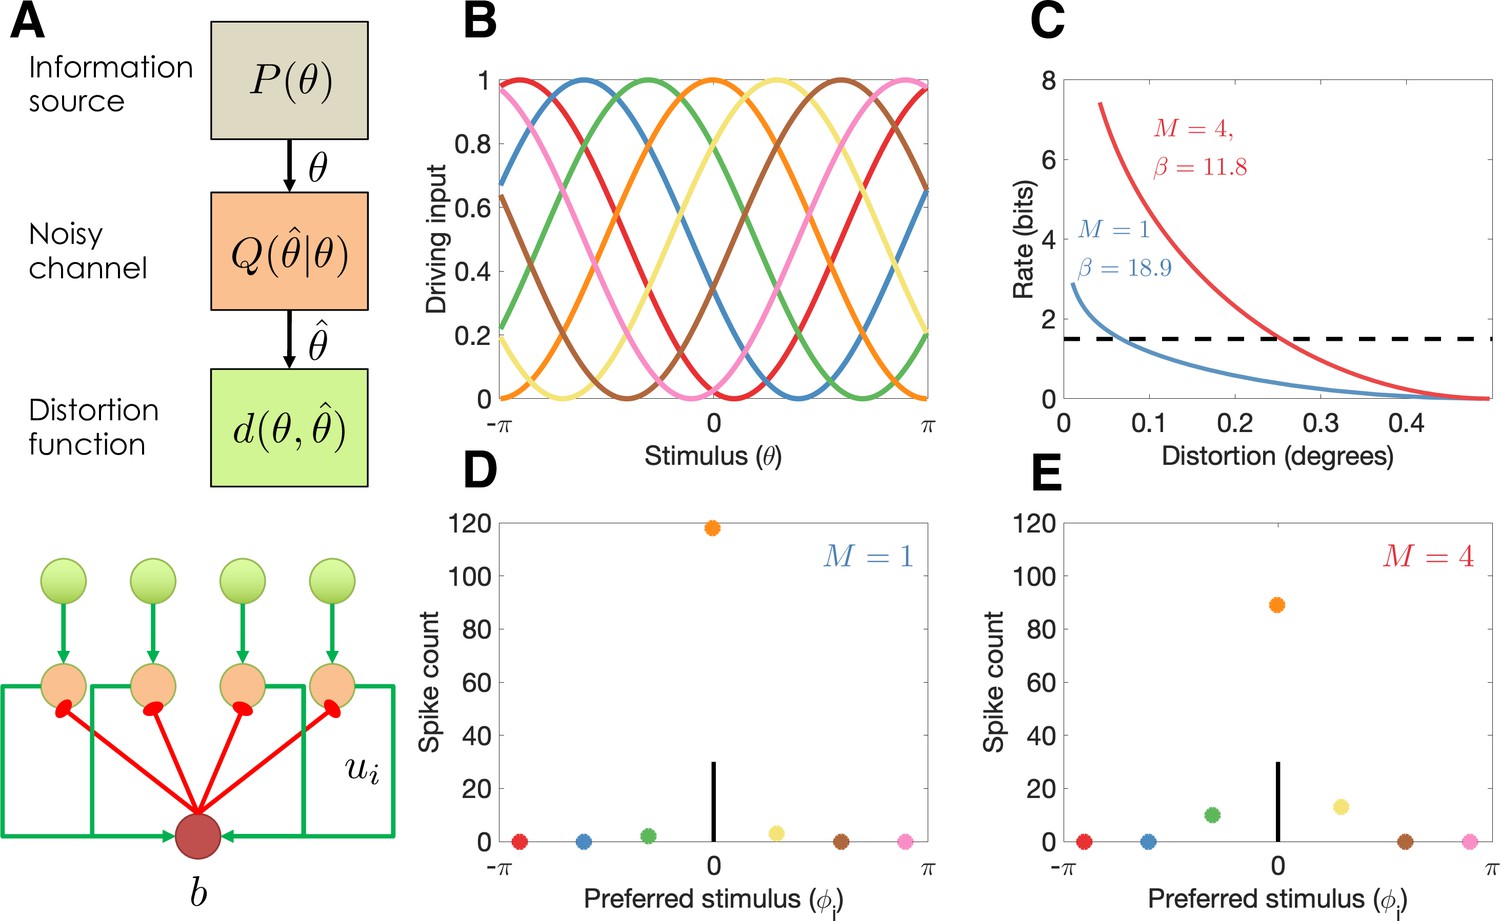
Model illustration.
(A) Top: Abstract characterization of a communication channel. A stimulus is sampled from an information source and passed through a noisy communication channel , which outputs a stimulus reconstruction . The reconstruction error is quantified by a distortion function, . Bottom: Circuit architecture implementing the communication channel. Input neurons encoding the negative distortion function provide the driving input to output neurons with excitatory input ui and global feedback inhibition . Each circuit codes a single stimulus at a fixed retinotopic location. When multiple stimuli are presented, the circuits operate in parallel, interacting only through a common gain parameter, . (B) Tuning curves of input neurons encoding the negative cosine distortion function over a circular stimulus space. (C) Rate-distortion curves for two different set sizes ( and ). The optimal gain parameter is shown for each curve, corresponding to the point at which each curve intersects the channel capacity (horizontal dashed line). Expected distortion decreases with the information rate of the channel, but the channel capacity imposes a lower bound on expected distortion. (D) Example spike counts for output neurons in response to a stimulus (, vertical line). The output neurons are color coded by their corresponding input neuron (arranged horizontally by their preferred stimulus, for neuron ; full tuning curves are shown in panel B). When only a single stimulus is presented (), the gain is high and the output neurons report the true stimulus with high precision. (E) When multiple stimuli are presented , the gain is lower and the output has reduced precision (i.e., sometimes the wrong output neuron fires).
Figure 2
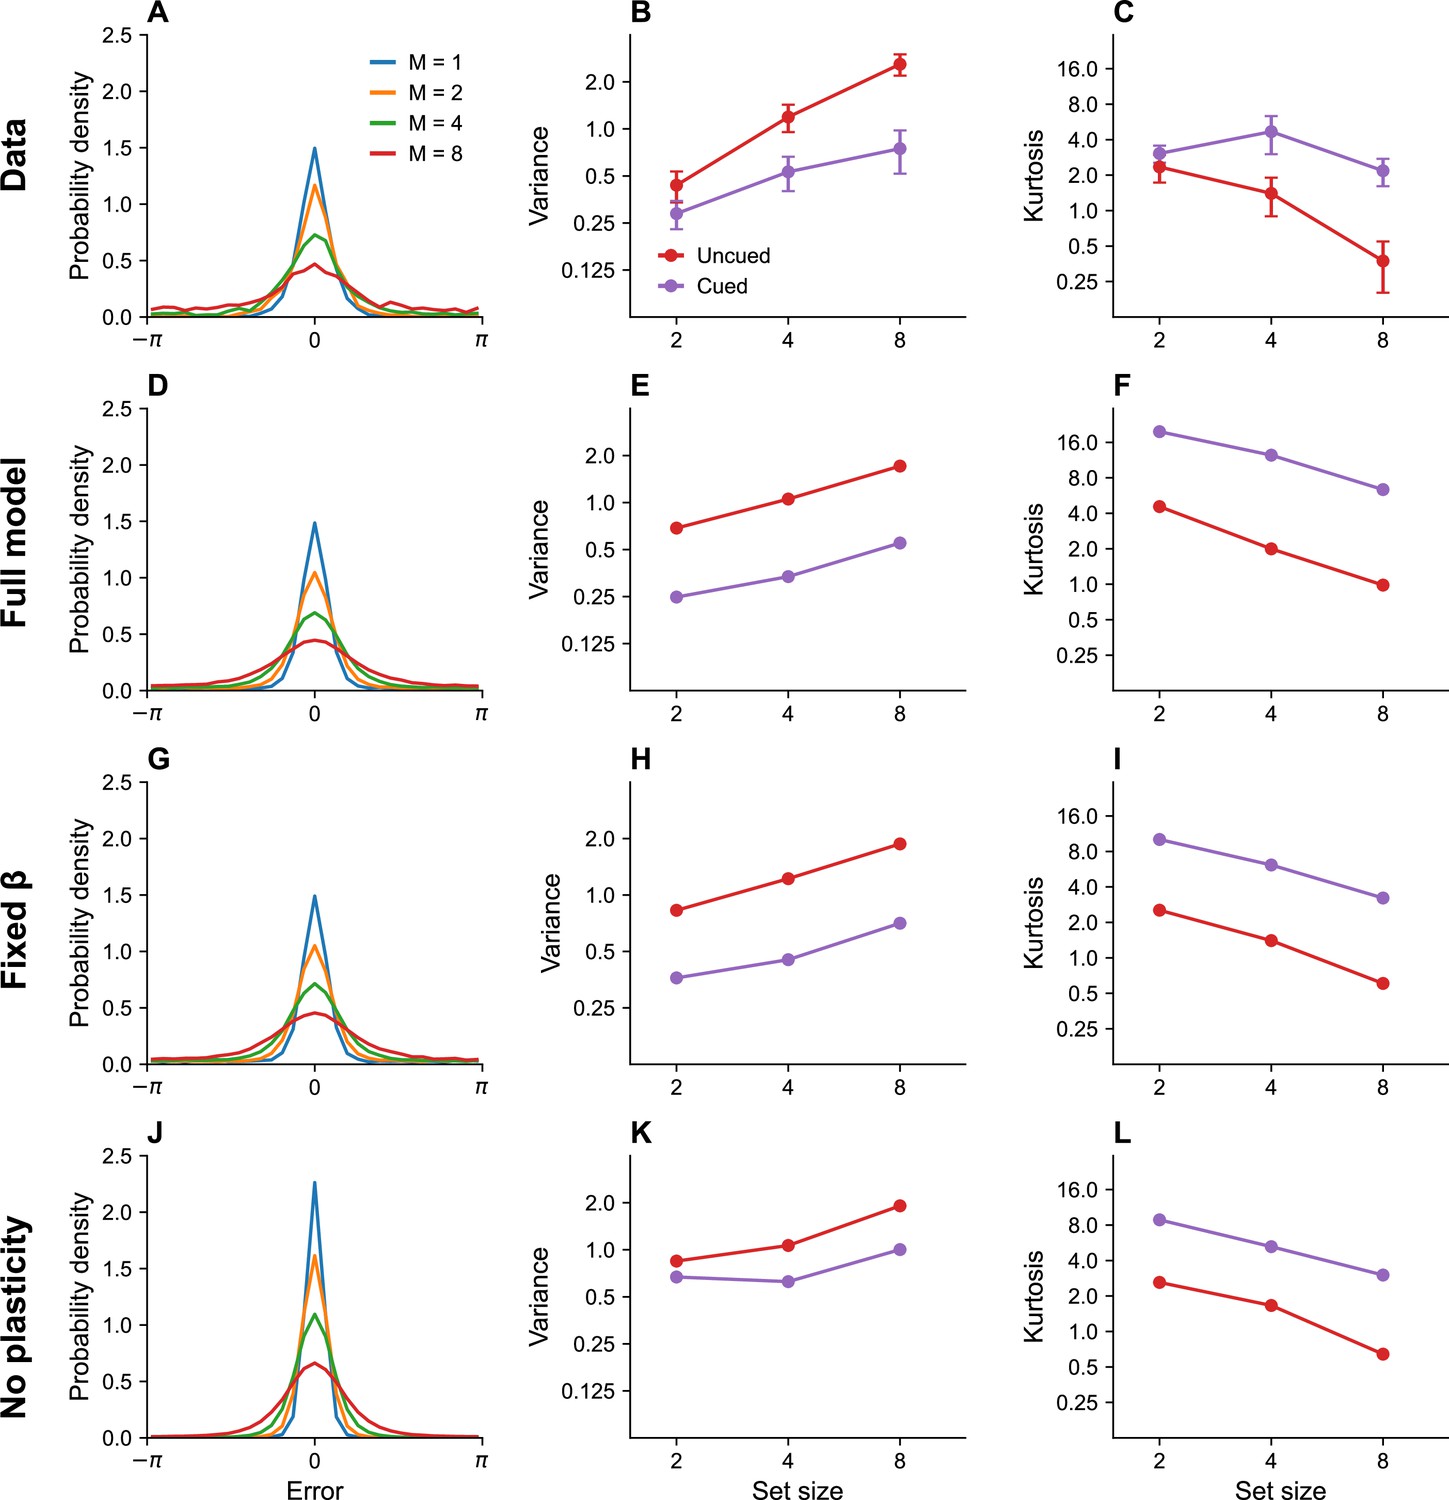
Set size effects and prioritization.
(A) Error distributions for different set sizes, as reported in Bays, 2014. Error variability increases with set size. (B) Error variance as a function of set size for cued and uncued stimuli. Reports for cued stimuli have lower error variance. (C) Kurtosis as a function of set size for cued and uncued stimuli. Simulation results for the full model (D–F), model with fixed gain parameter (G–I), and model without plasticity term (J–L). Error bars represent standard error of the mean.
Figure 3
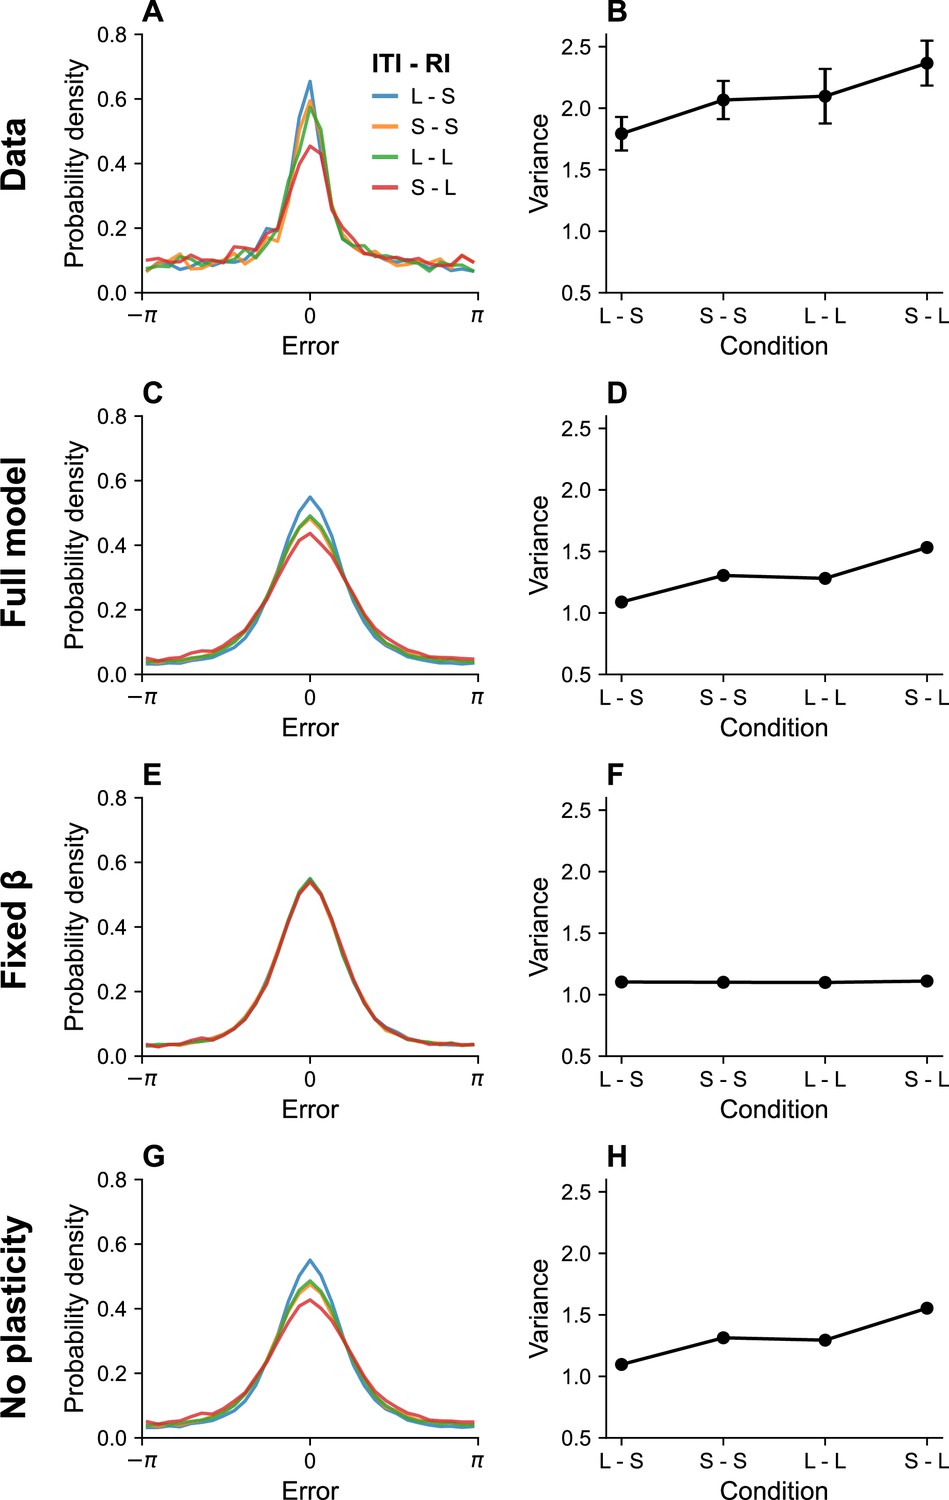
Timing effects.
(A) Error distributions for different intertrial intervals (ITIs) and retention intervals (RIs), as reported in Souza and Oberauer, 2015. ‘S’ denotes a short interval, and ‘L’ denotes a long interval. (B) Error variance as a function of timing parameters. Longer ITIs are associated with lower error variance, whereas longer RIs are associated with larger error variance. Simulation results for the full model (C, D), model with fixed gain parameter (E, F), and model without plasticity term (G, H). Error bars represent standard error of the mean.
Figure 4
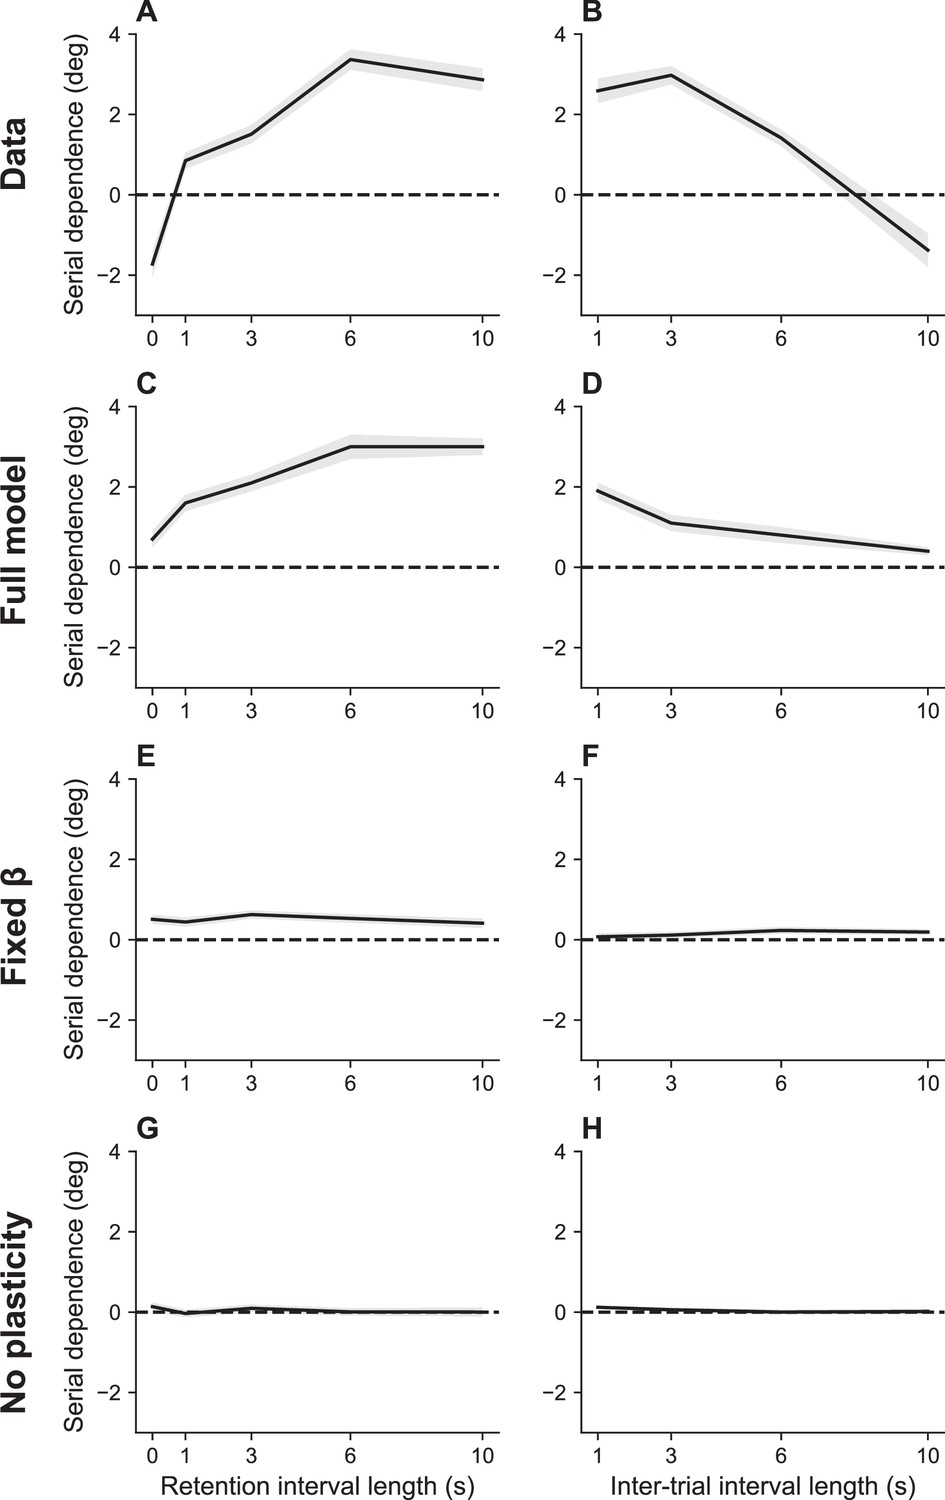
Serial dependence as a function of retention interval and intertrial interval.
(A) Serial dependence increases with the retention interval until eventually reaching an asymptote, as reported in Bliss et al., 2017. Serial dependence is quantified as the peak-to-peak amplitude of a derivative of Gaussian (DoG) tuning function fitted to the data using least squares (see Methods). (B) Serial dependence decreases with intertrial interval. Simulation results for the full model (C, D), model with fixed gain parameter (E, F), and model without plasticity term (G, H). Shaded area corresponds to standard error of the mean.
Figure 5
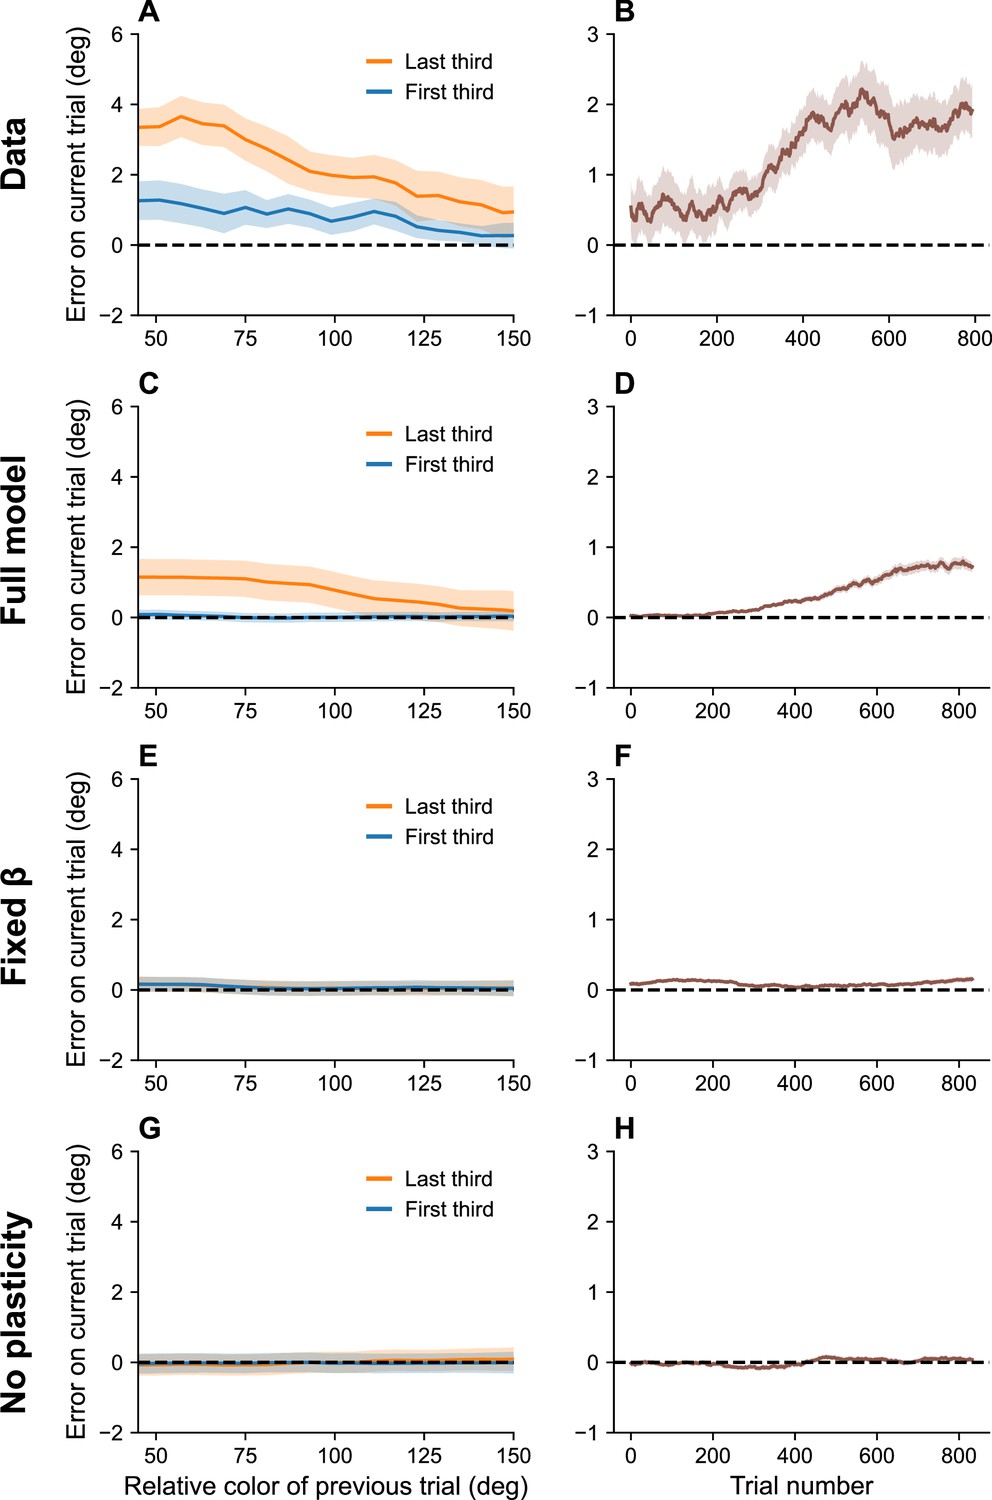
Serial dependence builds up during an experiment.
(A) Serial dependence computed using first third (blue) and last third (orange) of the trials within a session, as reported in Barbosa and Compte, 2020. Data shown here were originally reported in Foster et al., 2017. To obtain a trial-by-trial measure of serial dependence, we calculated the folded error as described in Barbosa and Compte, 2020 (see Methods). Positive values indicate attraction to the last stimulus, while negative values indicate repulsion. Serial dependence is stronger in the last third of the trials in the experiment compared to the first third. (B) Serial dependence increases over the course of the experimental session, computed here with a sliding window of 200 trials. Simulation results for the full model (C, D), model with fixed gain parameter (E, F), and model without plasticity term (G, H). Shaded area corresponds to standard error of the mean.
Figure 6
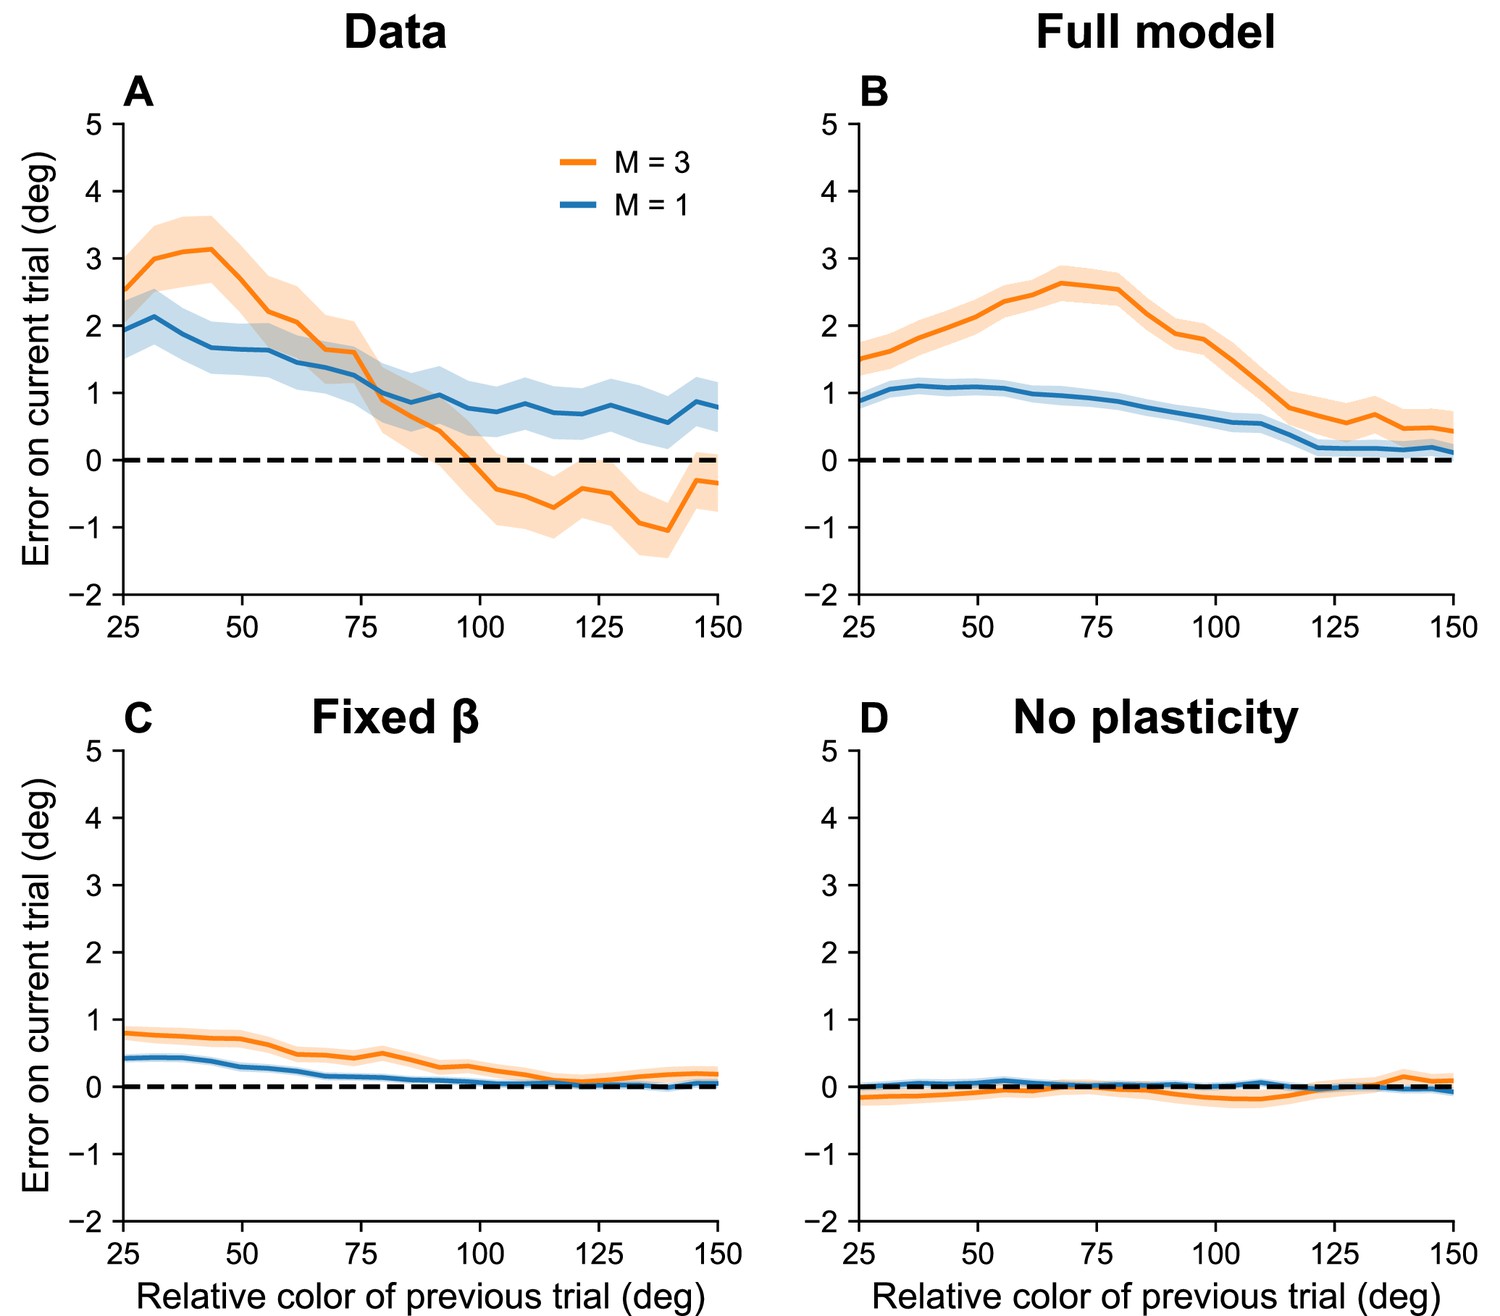
Serial dependence increases with set size.
(A) Serial dependence (quantified using folded error) for set sizes (blue) and (orange), using data originally reported in Panichello et al., 2019. Serial dependence computed as the peak amplitude of a derivative of Gaussian (DoG) tuning function fitted to the data using least squares is stronger for larger set sizes (see Methods). On the x-axis, ‘color of previous trial’ refers to the color of the single stimulus probed on the previous trial. (B–D) Simulation results for the full model, model with fixed gain parameter , and model without plasticity term . Shaded area corresponds to standard error of the mean.
Figure 7
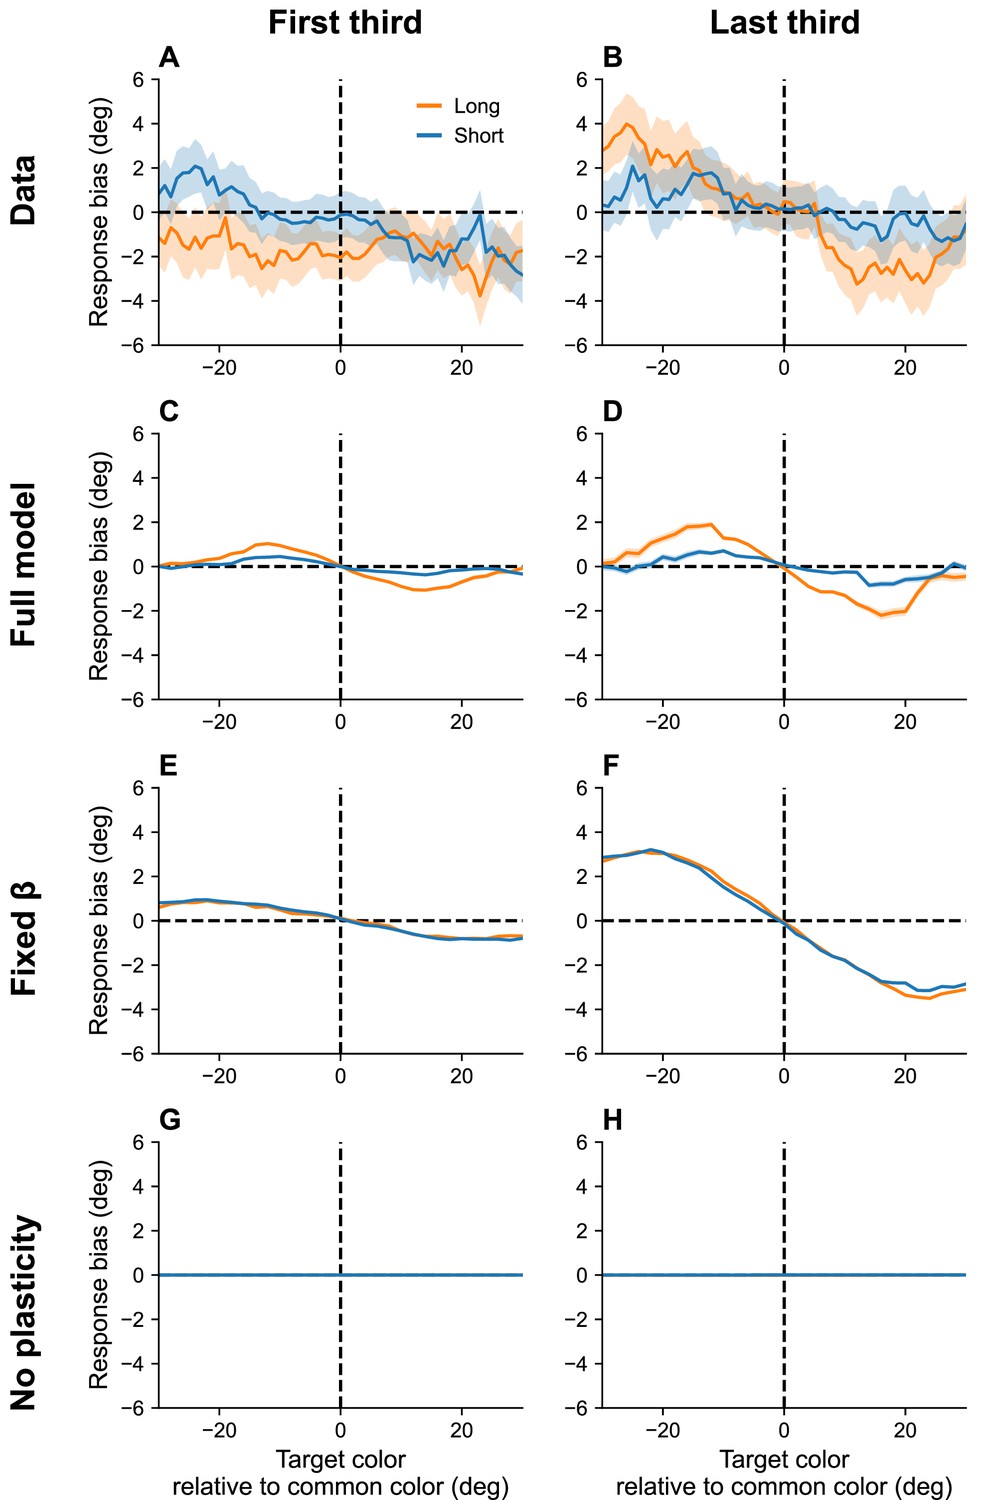
Continuous reports are biased toward high-frequency colors.
(A, B) Bias for targets around common colors during the first (Panel A) and last (Panel B) third of the session, as reported in Panichello et al., 2019. Bias refers to the difference between the stimulus and the mean reported color. x-Axis is centered around high-frequency colors. Bias increases with RI length (blue = short RI, orange = long RI). Bias also increases as the experiment progresses. Simulation results for the full model (C, D), model with fixed gain parameter (E, F), and model without plasticity term (G, H). Shaded area corresponds to standard error of the mean.
Figure 8
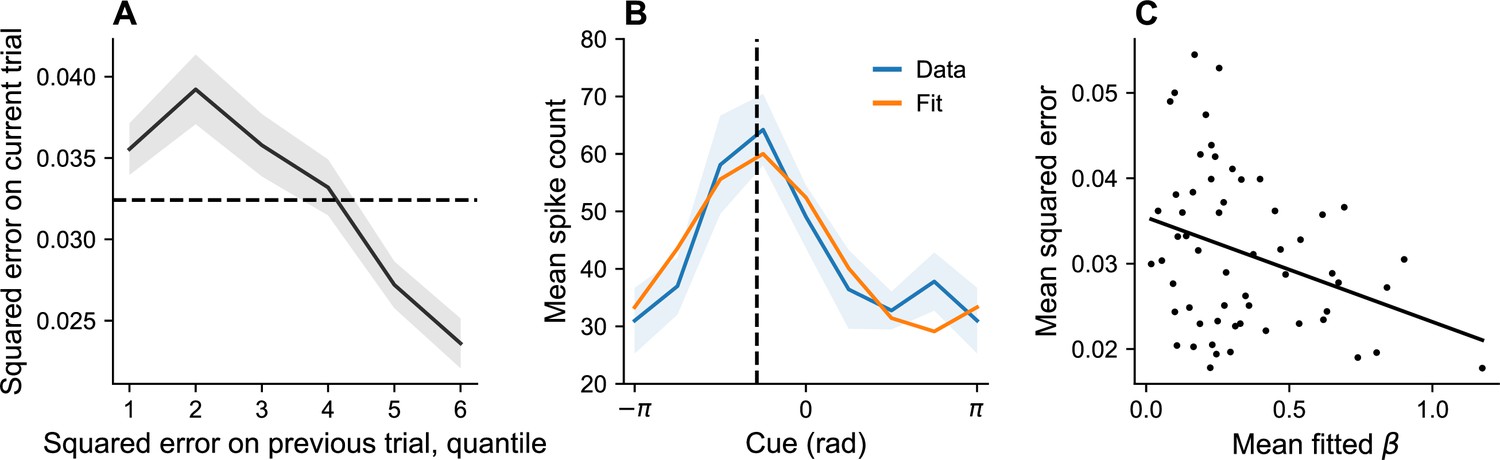
Dynamic variation in memory precision and neural gain.
(A) Mean squared error on current trial, classified by quantiles of squared error on previous trial. Squared error tends to be above average (dashed black line) following low squared error on the previous trial, and tends to be below average following large squared error on the previous trial. (B) Angular location tuning curve (orange) fitted to mean spike count (blue) during the retention interval, shown for one example neuron. The neuron’s preferred stimulus (dashed black line) corresponds to the peak of the tuning curve. Shaded region corresponds to standard error of the mean. (C) Mean squared error for different sessions plotted against mean fitted . According to our theory, plays the role of a gain control on the stimulus. Consistent with this hypothesis, memory error decreases with .
Tables
Table 1
Bayesian model comparison between the population coding (PC) model (Bays, 2014), the full rate-distortion (RD), and two variants of the RD model (fixed gain and no plasticity).
Each model is assigned a protected exceedance probability.
| Experiment | Figure | PC model | RD model(full) | RD model(fixed gain) | RD model(no plasticity) |
|---|---|---|---|---|---|
| Bays, 2014, Experiment 1 | 2 | 0.2141 | 0.2286 | 0.4128 | 0.1445 |
| Bays, 2014, Experiment 2 | 2 | 0.1853 | 0.7175 | 0.0487 | 0.0485 |
| Souza and Oberauer, 2015 | 3 | 0.0115 | 0.9785 | 0.0093 | 0.0007 |
| Bliss and D’Esposito, 2017, Experiment 1 | 4 | 0.0000 | 1.0000 | 0.0000 | 0.0000 |
| Bliss et al., 2017, Experiment 2 | 4 | 0.0029 | 0.7689 | 0.2264 | 0.0018 |
| Foster et al., 2017 | 5 | 0.3185 | 0.6638 | 0.0089 | 0.0088 |
| Panichello et al., 2019, Experiment 1a | 6 | 0.2613 | 0.7387 | 0.0000 | 0.0000 |
| Panichello et al., 2019, Experiment 2 | 7 | 0.0544 | 0.9456 | 0.0000 | 0.0000 |
Additional files
Download links
A two-part list of links to download the article, or parts of the article, in various formats.
Downloads (link to download the article as PDF)
Open citations (links to open the citations from this article in various online reference manager services)
Cite this article (links to download the citations from this article in formats compatible with various reference manager tools)
Rate-distortion theory of neural coding and its implications for working memory
eLife 12:e79450.
https://doi.org/10.7554/eLife.79450


