Inter-organ Wingless/Ror/Akt signaling regulates nutrient-dependent hyperarborization of somatosensory neurons
- Graduate School of Biostudies, Kyoto University, Japan
- Research Center for Dynamic Living Systems, Kyoto University, Japan
- AMED-CREST, Japan
- JST FOREST, Japan
Figures
Figure 1 with 2 supplements
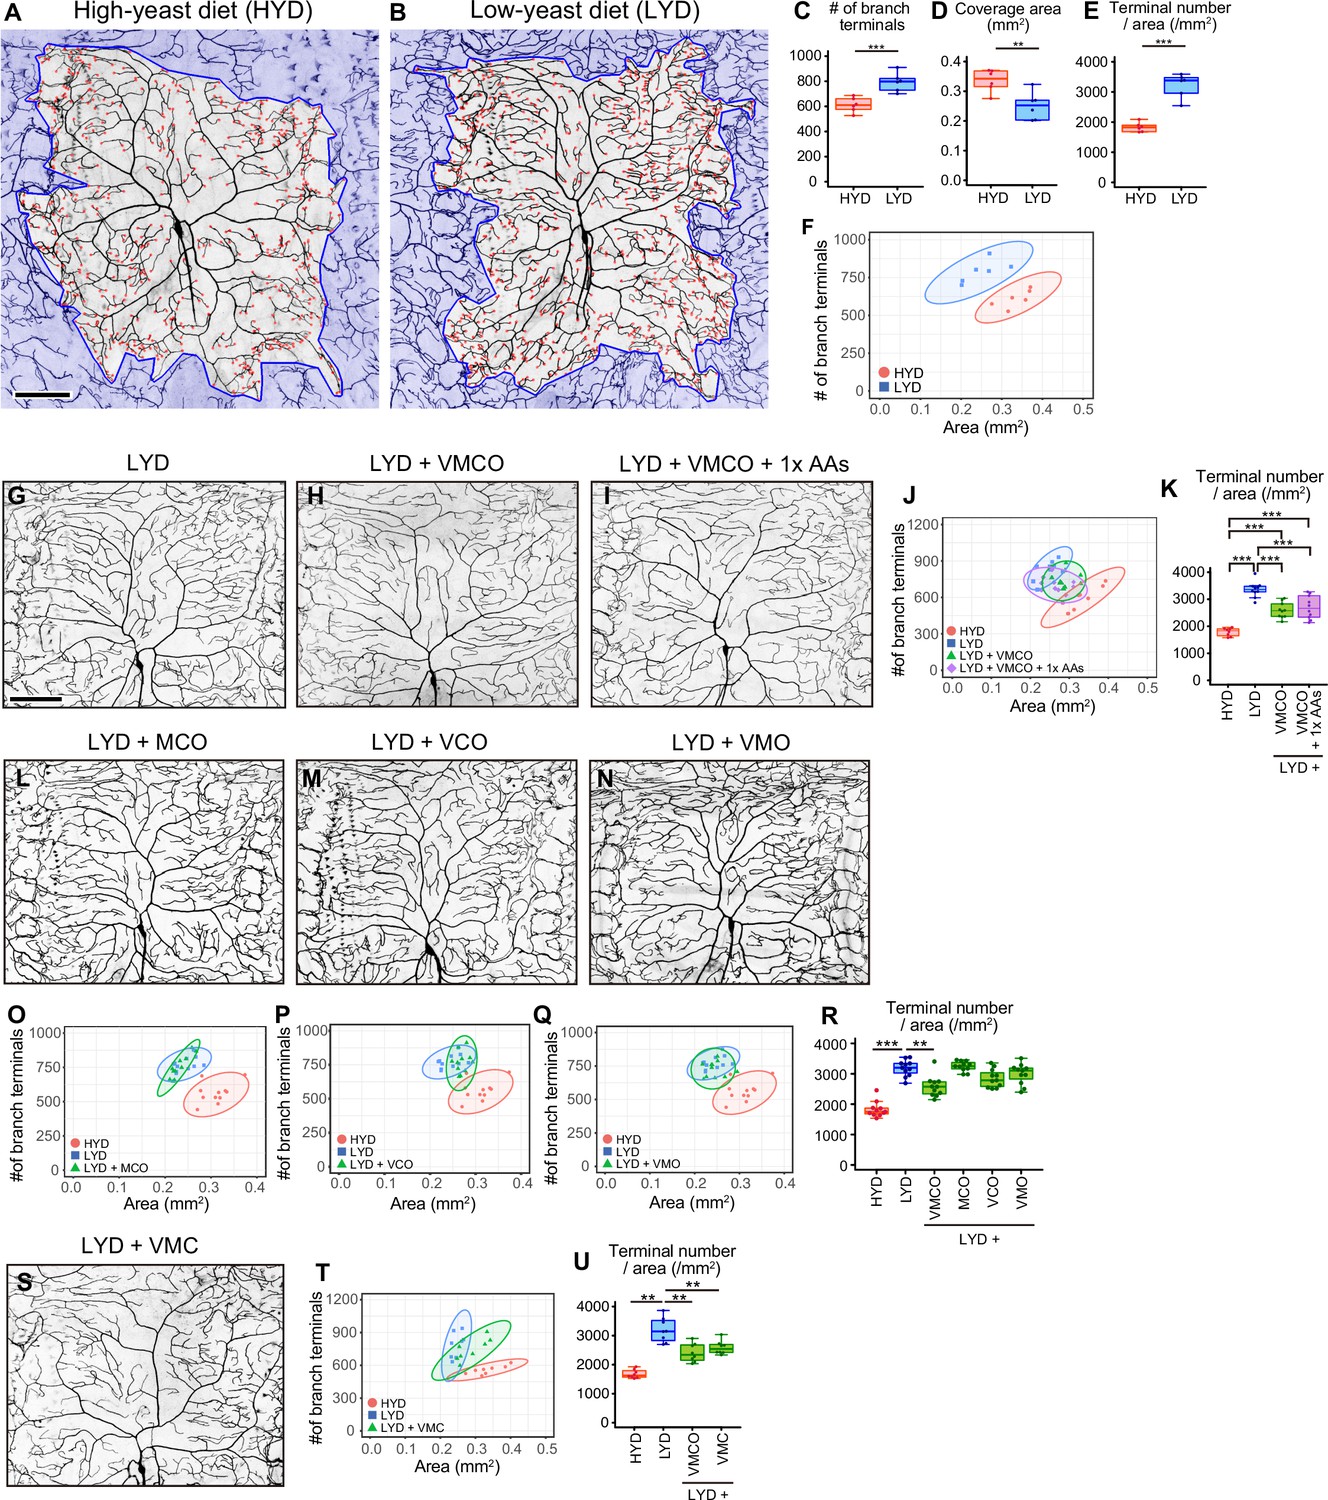
A mixture of vitamins, metal ions, and cholesterol ameliorates C4da neuron hyperarborization.
(A and B) Representative output images of DeTerm. DeTerm automatically detects dendritic terminals of C4da neuron ddaC in larvae reared on a high-yeast diet (HYD; A) or a low-yeast diet (LYD; B). Red points indicate detected branch terminals. (C–E) The numbers of branch terminals detected by DeTerm (C), coverage areas of dendrites (D), and densities of branch terminals (the number of branch terminals/coverage area; E) of individual neurons, on HYD or LYD (Student’s t-test, n=6). Boxes show the 25th–75th percentiles. The central lines indicate the medians. Whiskers extend to the most extreme data points, which are no more than 1.5 times the interquartile range. Boxes and points for HYD data and those for LYD data are colored red and blue, respectively, in this and subsequent figures. (F) Two-dimensional (2D) plot of the dendritic area and the number of branch terminals of each neuron. The ellipses represent the 95% confidence intervals, which are clearly separated for HYD and LYD. This plot shows a positive correlation between the area of the dendritic field and the number of branch terminals. (G–I) Images of ddaC neurons in larvae reared on LYD (G), LYD +vitamin + metal ion +cholesterol + other ingredients (LYD +VMCO; H), or LYD +VMCO + 1 x amino acids (LYD +VMCO + 1 x AAs; I). (J and K) Quantitative analysis of ddaC on LYD +VMCO or LYD +VMCO + 1 x AAs. (J) 2D plot. Note that the ellipse of LYD +VMCO and that of LYD +VMCO + 1 x AAs are located between those of HYD and LYD. (K) Densities of branch terminals (One-way ANOVA and Tukey’s HSD test, n=8–10). (L–N) Images of ddaC neurons in larvae reared on LYD +metal ion+cholesterol + other ingredients (LYD +MCO; L), LYD +vitamin + cholesterol +other ingredients (LYD +VCO; M), or LYD +vitamin + metal ion +other ingredients (LYD +VMO; N). (O–R) 2D plots of ddaC on LYD +MCO (O), LYD +VCO (P), or LYD +VMO (Q), and densities of branch terminals (R, Steel test, n=10). The elipses of these diets largely overlap with that of LYD and clearly or almost separare from that of HYD (O–Q). (S) Images of ddaC neurons in larvae reared on LYD +vitamin + metal ion +cholesterol (LYD +VMC). (T and U) 2D plots of ddaC neurons in larvae reared on LYD +VMC (T) and densities of branch terminals (U, Steel test, n=8). The ellipse of LYD +VMC is located between those of HYD and LYD (T). Boxplots in (K, R and U) are depicted as in (C). *p<0.05, **p<0.01, and ***p<0.001. Scale bars, 100 μm.
Figure 1—figure supplement 1
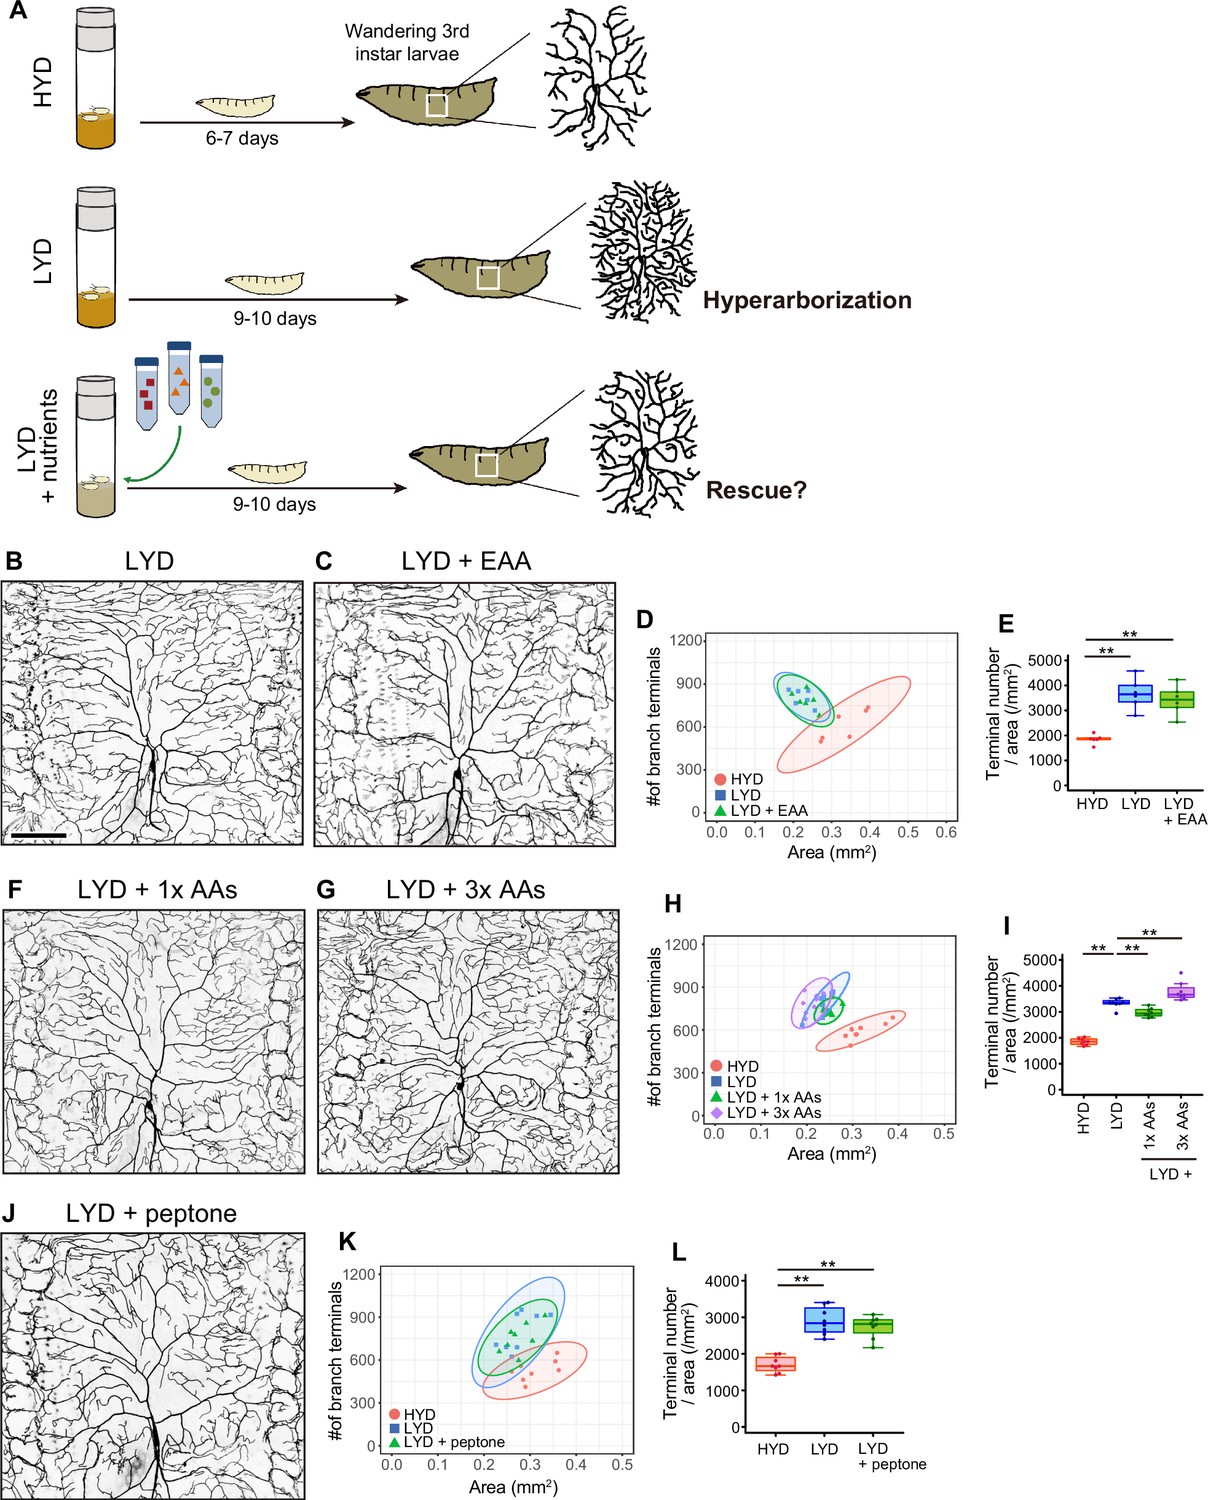
Addition of amino acids does not rescue the hyperarborization.
(A) A schematic diagram outlining the observation of C4da neurons in larvae reared on the different diets. We collected wandering 3rd instar larvae and imaged C4da neurons as scheduled throughout our dietary or genetic interventions. This is because the larval development took longer on LYD or LYD +nutrients compared to HYD. (B–E) Images of ddaC neurons in larvae reared on LYD (B) or LYD +essential amino acids (LYD +EAA; C). Two-dimensional (2D) plot (D) and densities of branch terminals (E, one-way ANOVA and Tukey’s HSD test, n=6). The 95% confidence elipse of LYD +EAA almost totally overlaps with that of LYD and remains largely separare from that of HYD (D). (F–I) Images of ddaC neurons in larvae reared on LYD +1 x amino acids, which is the same concentration as in the holidic medium (LYD +1 x AAs; F), or LYD +3 x AAs (G). 2D plot (H) and densities of branch terminals (I, Steel test, n=8). Terminal density on LYD +1 x AAs was significantly lower than on LYD, whereas that on LYD +3 x AAs was higher (I). In contrast to these opposoite effects, both the elipse of LYD +1 x AAs and that of LYD +3 x AAs partly overlap with the LYD elipse and both are located apart from that of HYD (H). These effects of supplementing amino acids to LYD make sharp contrast to that of supplementing VMCO or VMC (Figure 1J and T). (J–L) Images of ddaC neurons in larvae reared on LYD +peptone (J). 2D plot (K) and densities of branch terminals (L, Steel test, n=8). The elipse of LYD +peptone almost totally overlaps with that of LYD (K). The complete compositions of the diets can be found in Supplementary file 1. Boxplots in (E, I, and L) are depicted as in Figure 1C. **p<0.01. Scale bar, 100 μm.
Figure 1—figure supplement 2
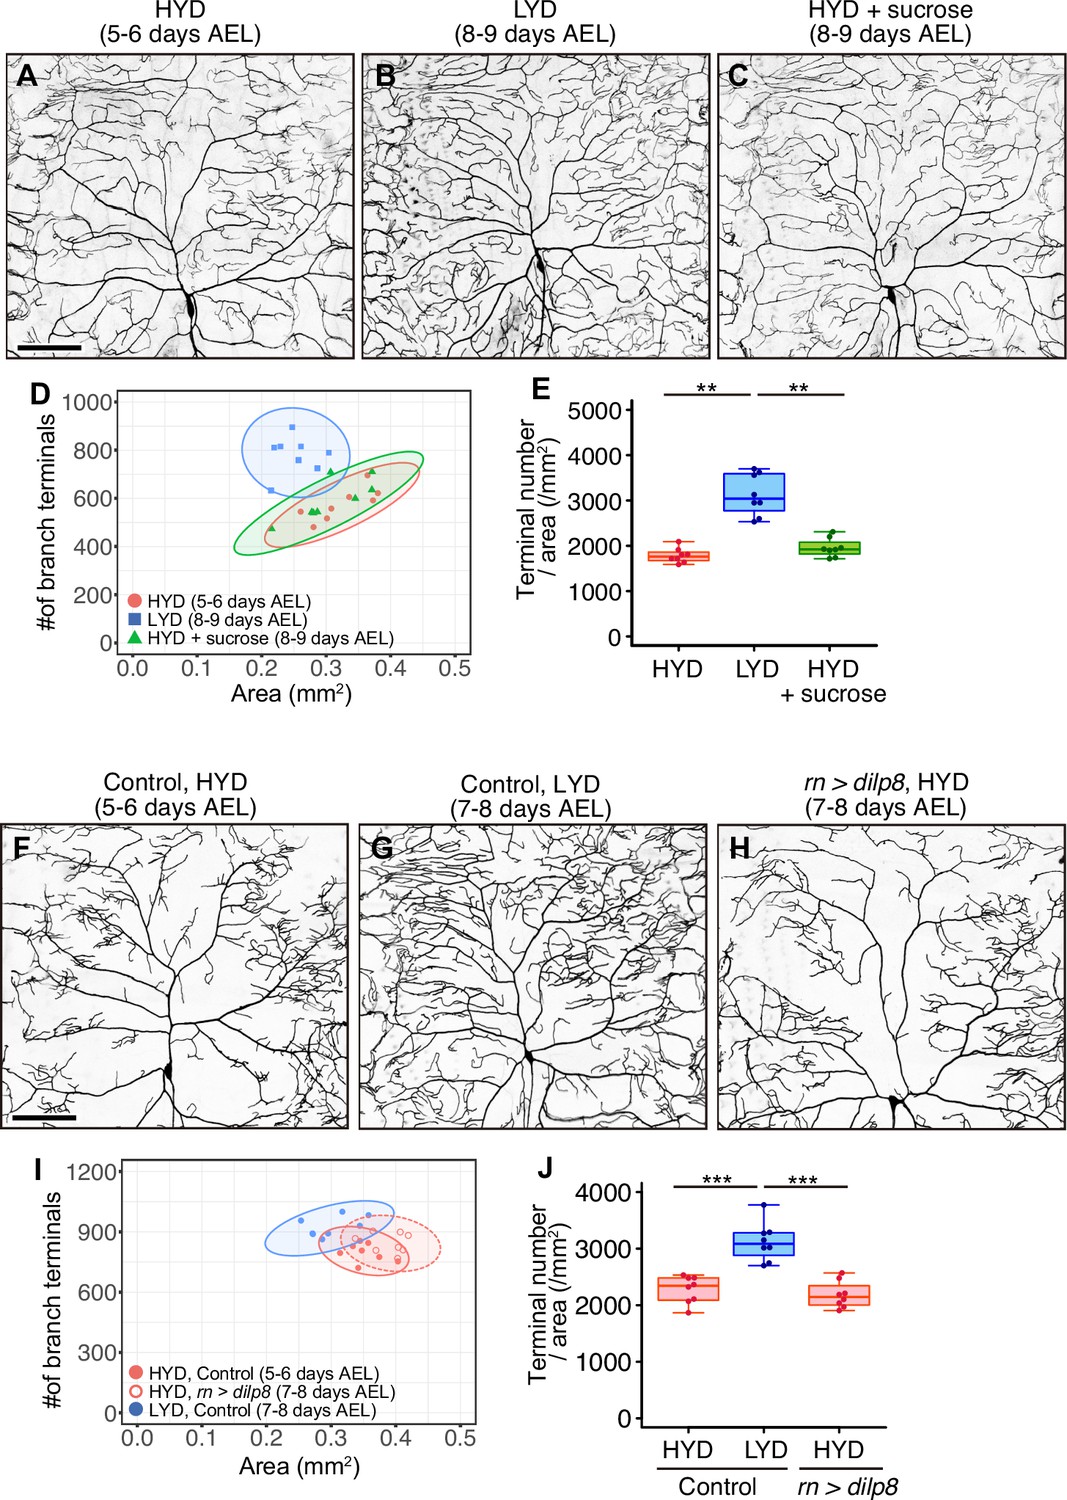
Extended larval growth is not associated with the hyperarborization.
(A–E) Images of ddaC neurons in larvae reared on HYD (A), LYD (B) or HYD +sucrose (C). 2D plot (D) and densities of branch terminals (E). 5–6 days after egg laying (AEL) larvae reared on HYD and 8–9 days AEL larvae reared on LYD or HYD +sucrose were observed. (F–J) Images of ddaC neurons in control larvae reared on HYD (F) or LYD (G) or in larvae that overexpressed dilp8 in wing imaginal discs and were reared on HYD (H). The ddaC neurons were visualized by expressing ppk-CD4:tdGFP. 2D plot (I) and densities of branch terminals (J). 5–6 days AEL control larvae on HYD and 7–8 days AEL control larvae on LYD or dilp8 overexpressing larvae on HYD were observed. Boxplots in (E and J) are depicted as in Figure 1C. *p<0.05, **p<0.01, ***p<0.001 (One-way ANOVA and Tukey’s HSD test, n=8). Scale bars, 100 μm.
Figure 2 with 6 supplements
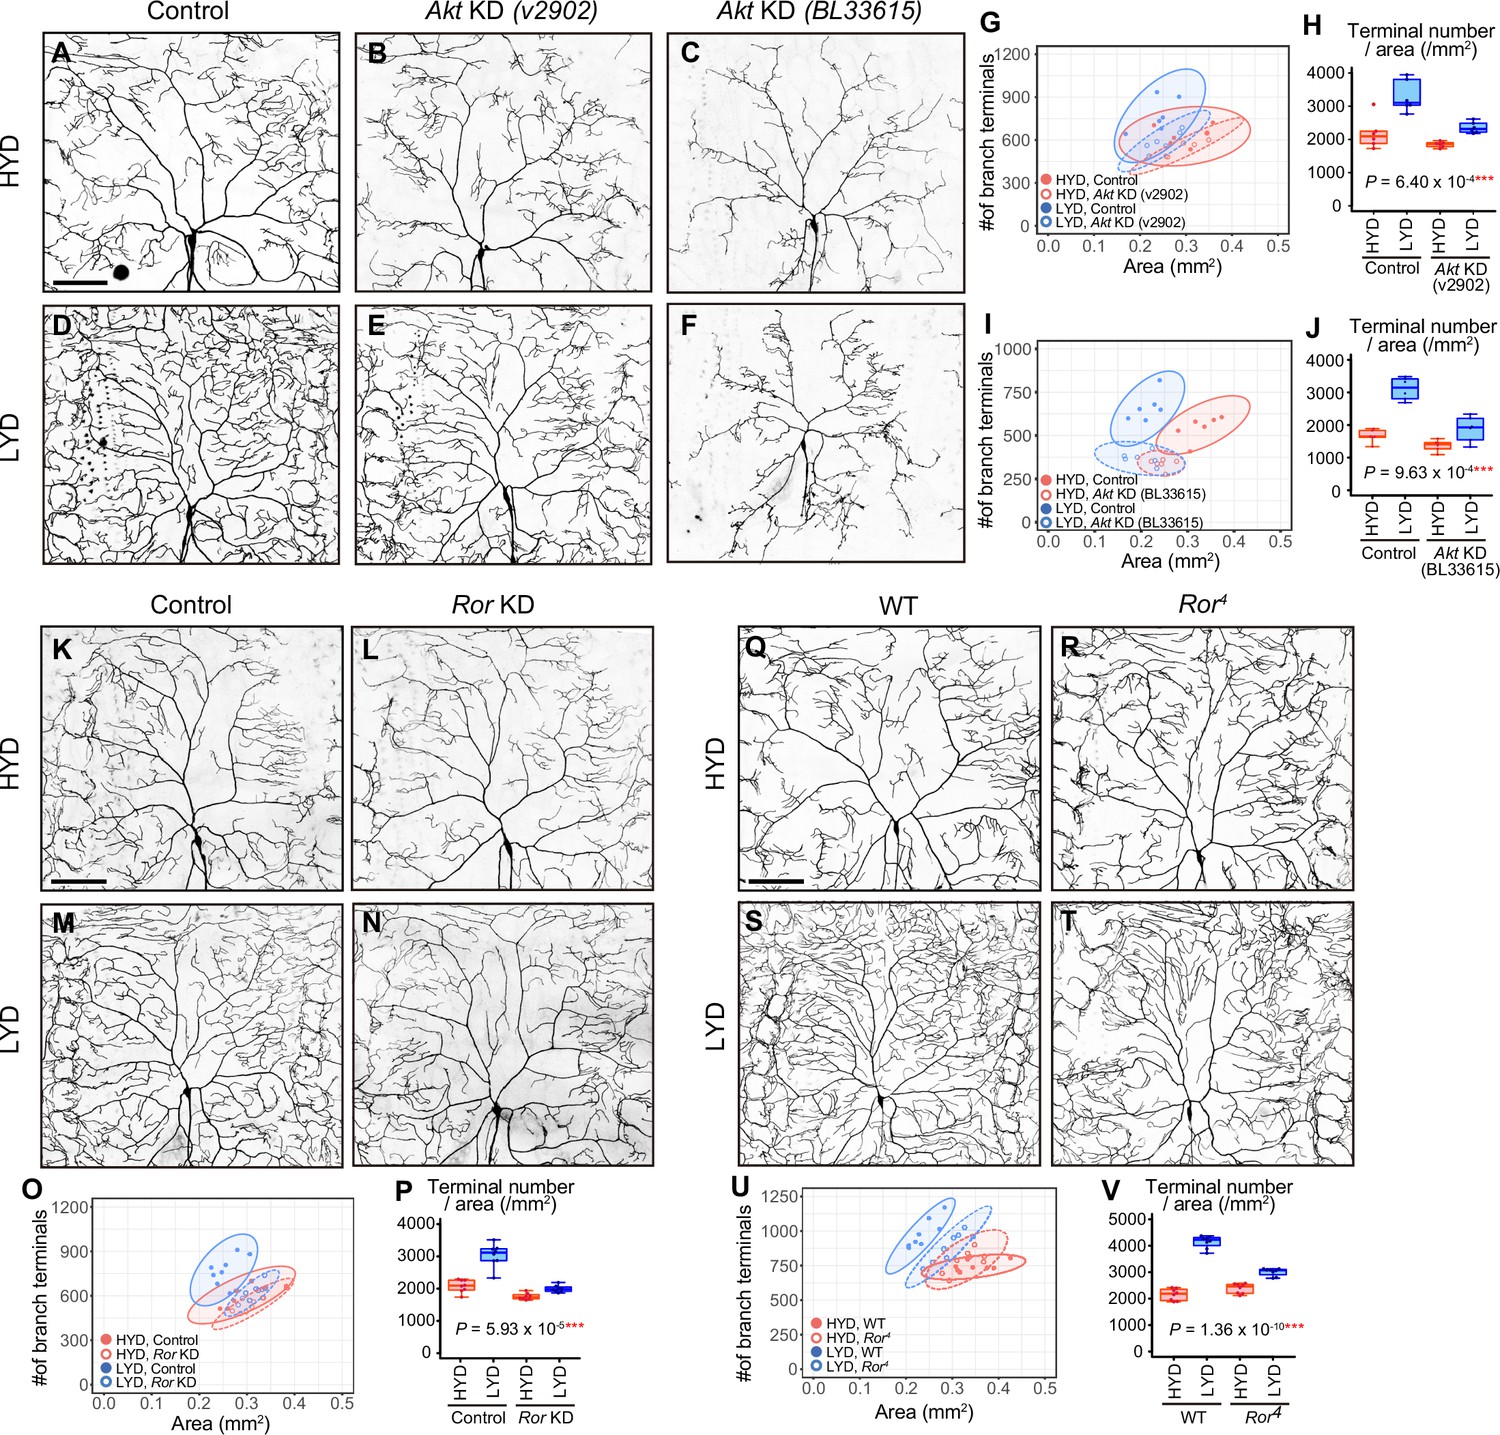
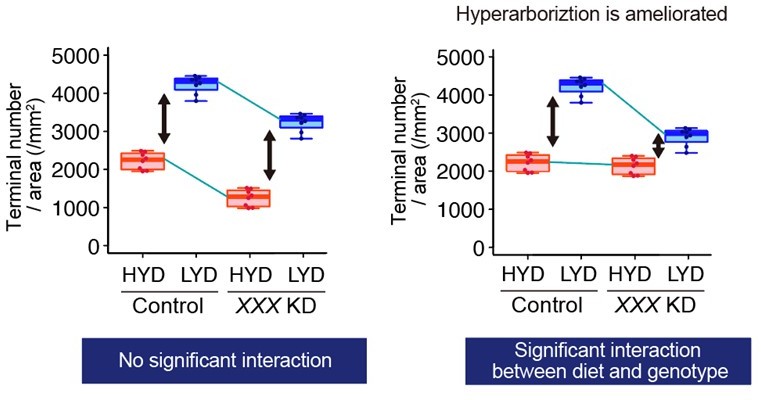
Akt and receptor tyrosine kinase Ror are required in C4da neurons to hyperarborize their dendrites.
(A–F) Images of control ddaC neurons (A and D), or Akt knockdown (KD) ddaC neurons using UAS-Akt RNAiv2902 (B and E) or UAS-Akt RNAiBL33615 (C and F), on HYD (A–C) or LYD (D–F). (G–J) Quantitative analysis of effects of Akt KD using UAS-Akt RNAiv2902 (G and H) or UAS-Akt RNAiBL33615 (I and J). (G and I) 2D plots. (H and J) Densities of branch terminals. As indicated by the p-values, there was a significant interaction between diet and genotype on terminal density in both Akt KD experiments (two-way ANOVA, n=6). That is, compared to the difference between HYD and LYD in control C4da neurons, that difference in Akt KD neurons using UAS-Akt RNAiv2902 or UAS-Akt RNAiBL33615 was significantly smaller, suggesting that the hyperarborization was blunted by the Akt KD. (K–P) Images of control (K and M) or Ror knocked down ddaC (L and N) on HYD (K and L) or LYD (M and N). 2D plot (O) and densities of branch terminals (p, two-way ANOVA, n=8). (Q–V) Images of ddaC in wild-type (WT; Q and S) or Ror4 mutant larvae (R and T) on HYD (Q and R) or LYD (S and T). The ddaC neurons were visualized by expressing ppk-CD4:tdGFP. 2D plot (U) and densities of branch terminals (V, two-way ANOVA, n=8). Boxplots in (H, J, P, and V) are depicted as in Figure 1C. ***p<0.001. Scale bars, 100 μm.
Figure 2—figure supplement 1
Contributions of intracellular signaling factors or Akt signaling components to the hyperarborization.
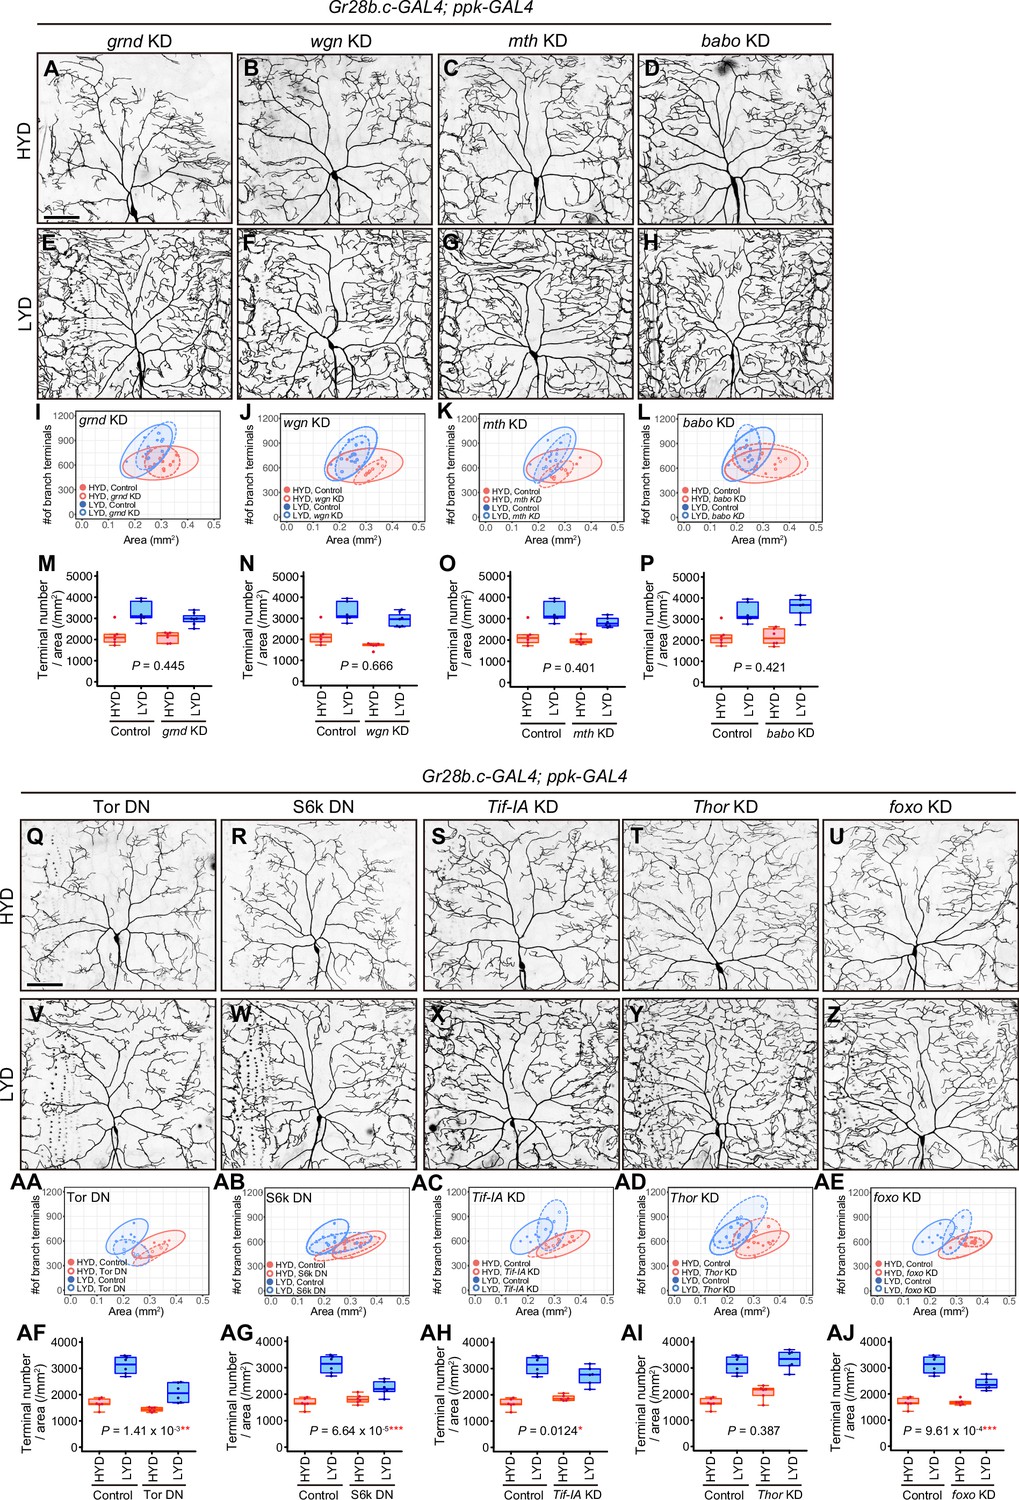
(A–H) Images of gnrd (A and E), wgn (B and F), mth (C and G), or babo (D and H) KD ddaC neurons, on HYD or LYD. Images of control ddaC neurons are shown in Figure 2A and D. 2D plots (I–L) and densities of branch terminals (M–P). (M–P) Compared to the difference between HYD and LYD in control C4da neurons, that difference in grnd, wgn, mth or babo KD neurons is not significantly affected as indicated by the p-value (two-way ANOVA, n=6). Gr28b.c-GAL4 and ppk-GAL4 were used together to enhance KD efficacy. (Q–Z) Images of ddaC neurons expressing a dominant-negative form of Tor (Tor DN) (Q and V) or S6k DN (R and W) and Tif-IA (S and X), Thor (T and Y), or foxo (U and Z) KD ddaC neurons, on HYD or LYD. 2D plots (AA-AE) and densities of branch terminals (AF-AJ). (AF-AJ) Compared to the difference between HYD and LYD in control C4da neurons, that difference in Tor DN, S6k DN, Tif-IA KD, or foxo KD neurons is smaller as indicated by the p-value (two-way ANOVA, n=6). Gr28b.c-GAL4 and ppk-GAL4 were used together to enhance KD efficacy. Control data in (I–L) and (M–P) are shared with Figure 2G and H and those in (AA-AE) and (AF-AJ) are shared with Figure 2I and J. Boxplots in (M–P and AF–AJ) are depicted as in Figure 1C. *p<0.05, **p<0.01, and ***p<0.001. Scale bars, 100 μm.
Figure 2—figure supplement 2
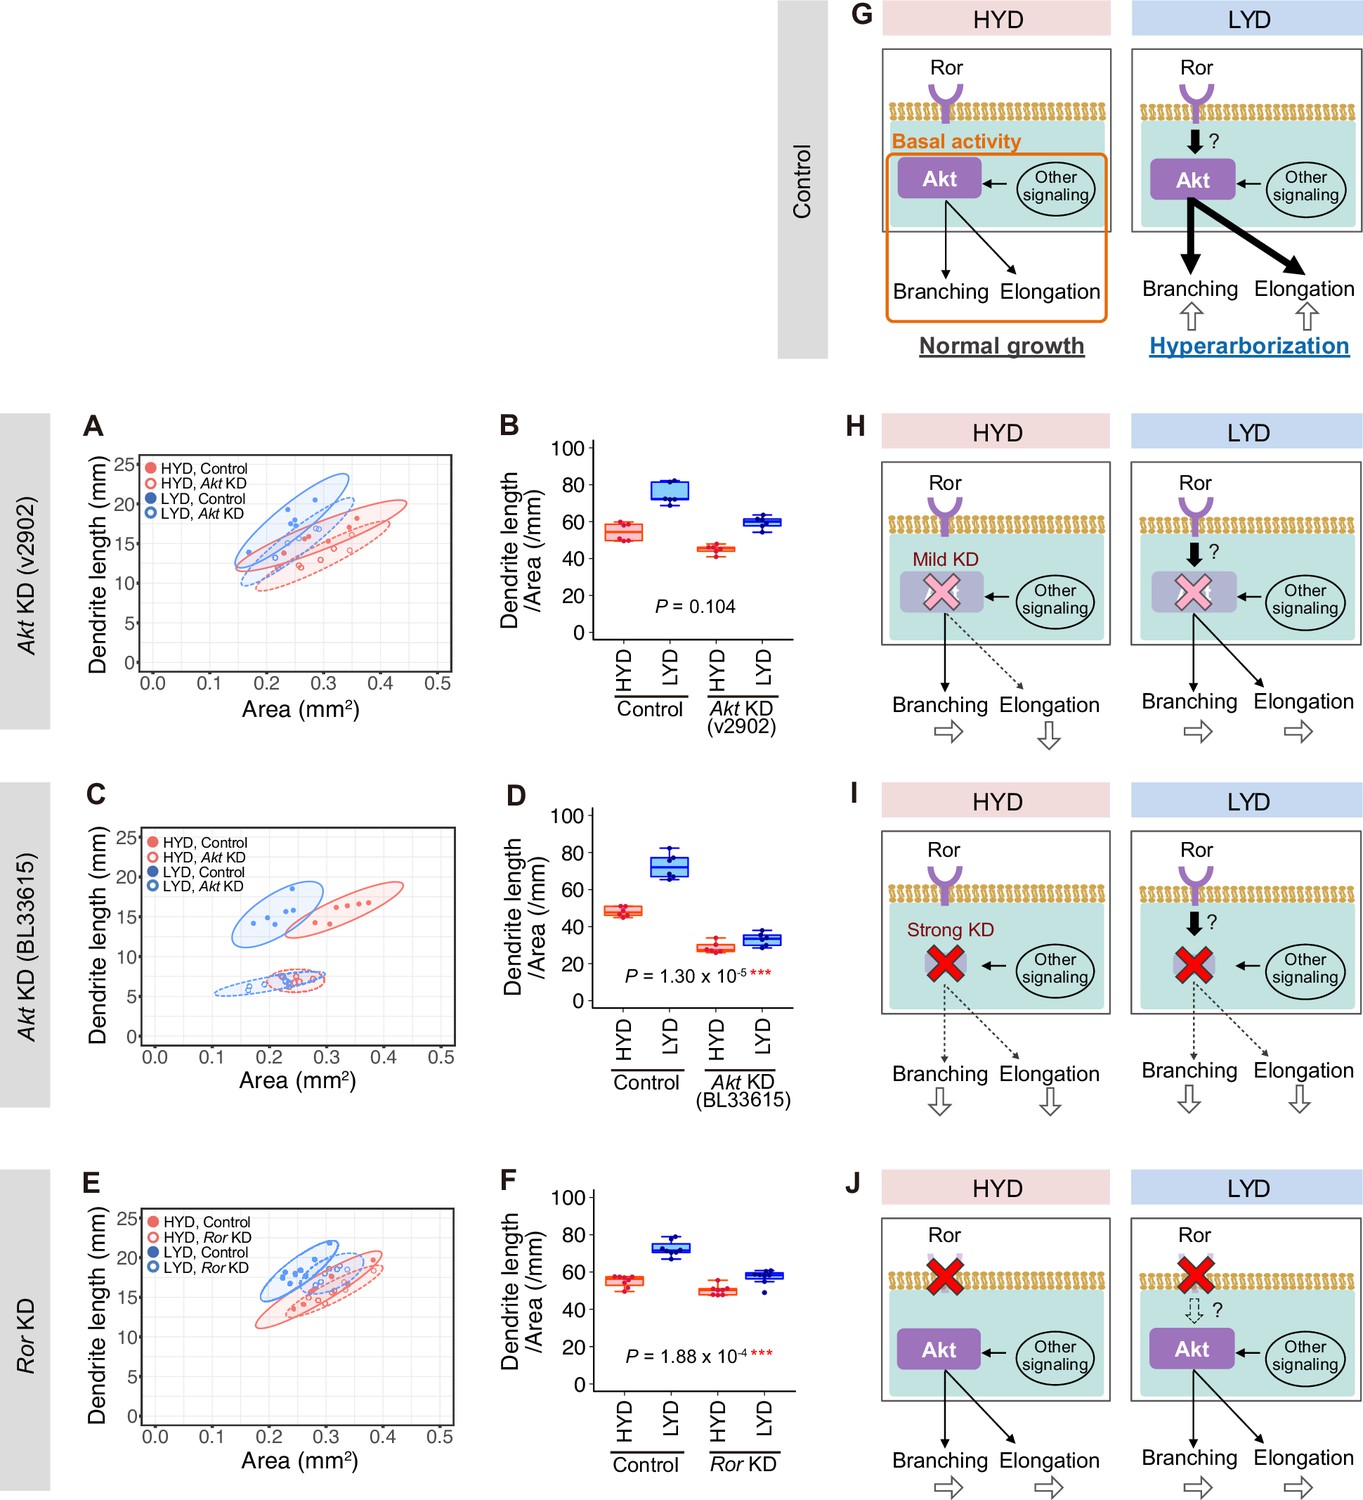
Roles of Akt and Ror in dendritic branching and elongation.
(A–F) Quantitative analyses of effects of Akt KD using UAS-Akt RNAiv2902 (A and B) or UAS-Akt RNAiBL33615 (C and D), or Ror KD (E and F), on dendrite elongation on HYD (red) or LYD (blue). (A, C and E) 2D plot of the dendritic area and the dendrite total length of each neuron. The ellipses represent the 95% confidence intervals. (B, D and F) Dendrite length divided by coverage area. Boxplots are depicted as in Figure 1C (two-way ANOVA, n=8). Akt KD using UAS-Akt RNAiBL33615 (C and D) strongly impaired elongation irrespective of the diet. (G–I) Diagrams showing our hypothesis about how dendrite branching and elongation are promoted in control C4da neurons (G) and how they are affected by the mild Akt KD using UAS-Akt RNAiv2902 (H), the strong Akt KD using UAS-Akt RNAiBL33615 (I), or Ror KD (J). Arrows depicted at the bottom of each daigram show changes in dendrite branching or elongation compared to the control neurons on HYD. See the text for details. *p<0.05, **p<0.01, and ***p<0.001.
Figure 2—figure supplement 3
Validation of knockdown efficiency of Akt RNAi lines and p-Akt antibody specificity.
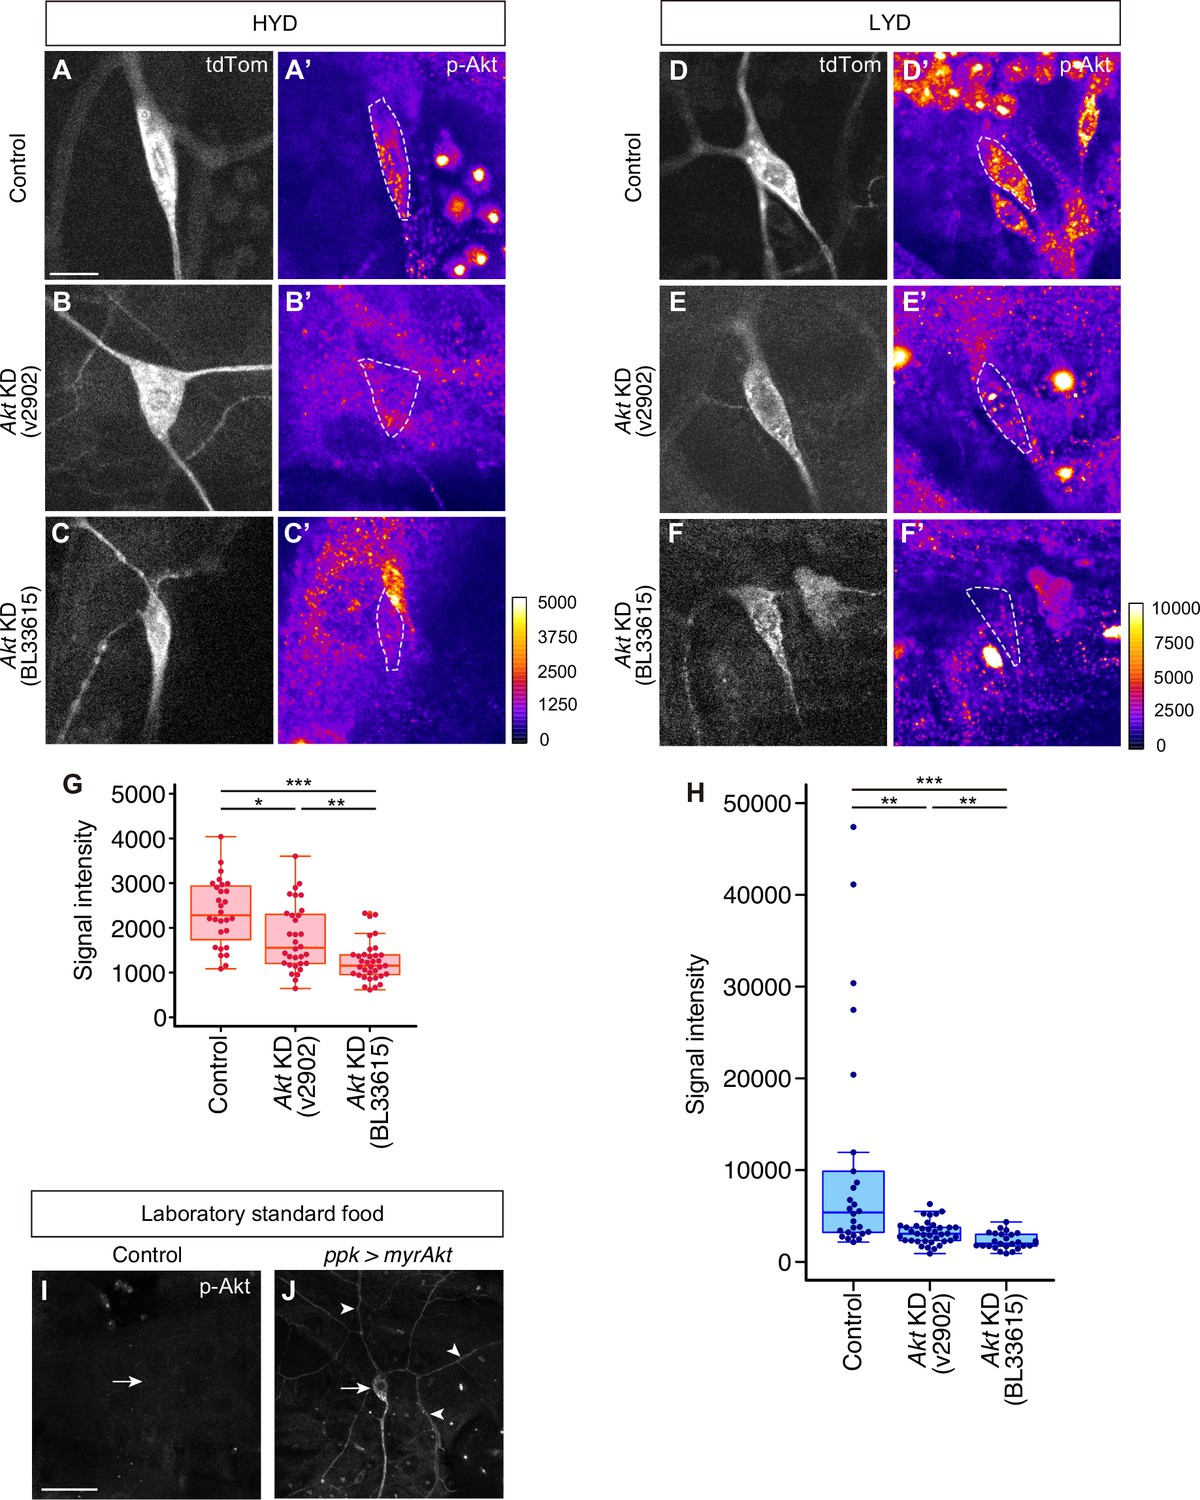
(A–H) Control ddaC (A, A’, D and D’) or Akt KD ddaC neurons using UAS-Akt RNAiv2902 (B, B’, D and D’) or UAS-Akt RNAiBL33615 (C, C’, F and F’), on HYD (A-C’) or LYD (D-F’), were stained for p-Akt (A’-F’) and co-imaged with a C4da neuron marker ppk-CD4:tdTom (A–F). The signal intensities of p-Akt correspond to the indicated color codes made for each diet, and cell bodies of ddaC neurons are outlined with white dashed lines. Scale bars, 10 μm. (G and H) Quantification of p-Akt intensity in cell bodies of the control or the Akt knocked down ddaC neurons on HYD (G) or LYD (H) (Steel Dwass test, n=26–37). The microscope used in these experiments was different from all the other immunostainig data (see Materials and methods in detail). (I and J) Control ddaC (I) or myrAkt (constitutively active form of Akt) expressing ddaC (J) were stained for p-Akt. White arrows indicate the cell bodies of those ddaC neurons. The myr-Akt expressing neuron showed dramatically stronger p-Akt signal in dendrites (white arrowheads) as well as in cell body than the control neuron. Scale bars, 100 μm. Boxplots in (G and H) are depicted as in Figure 1C. *p<0.05, **p<0.01, and ***p<0.001.
Figure 2—figure supplement 4
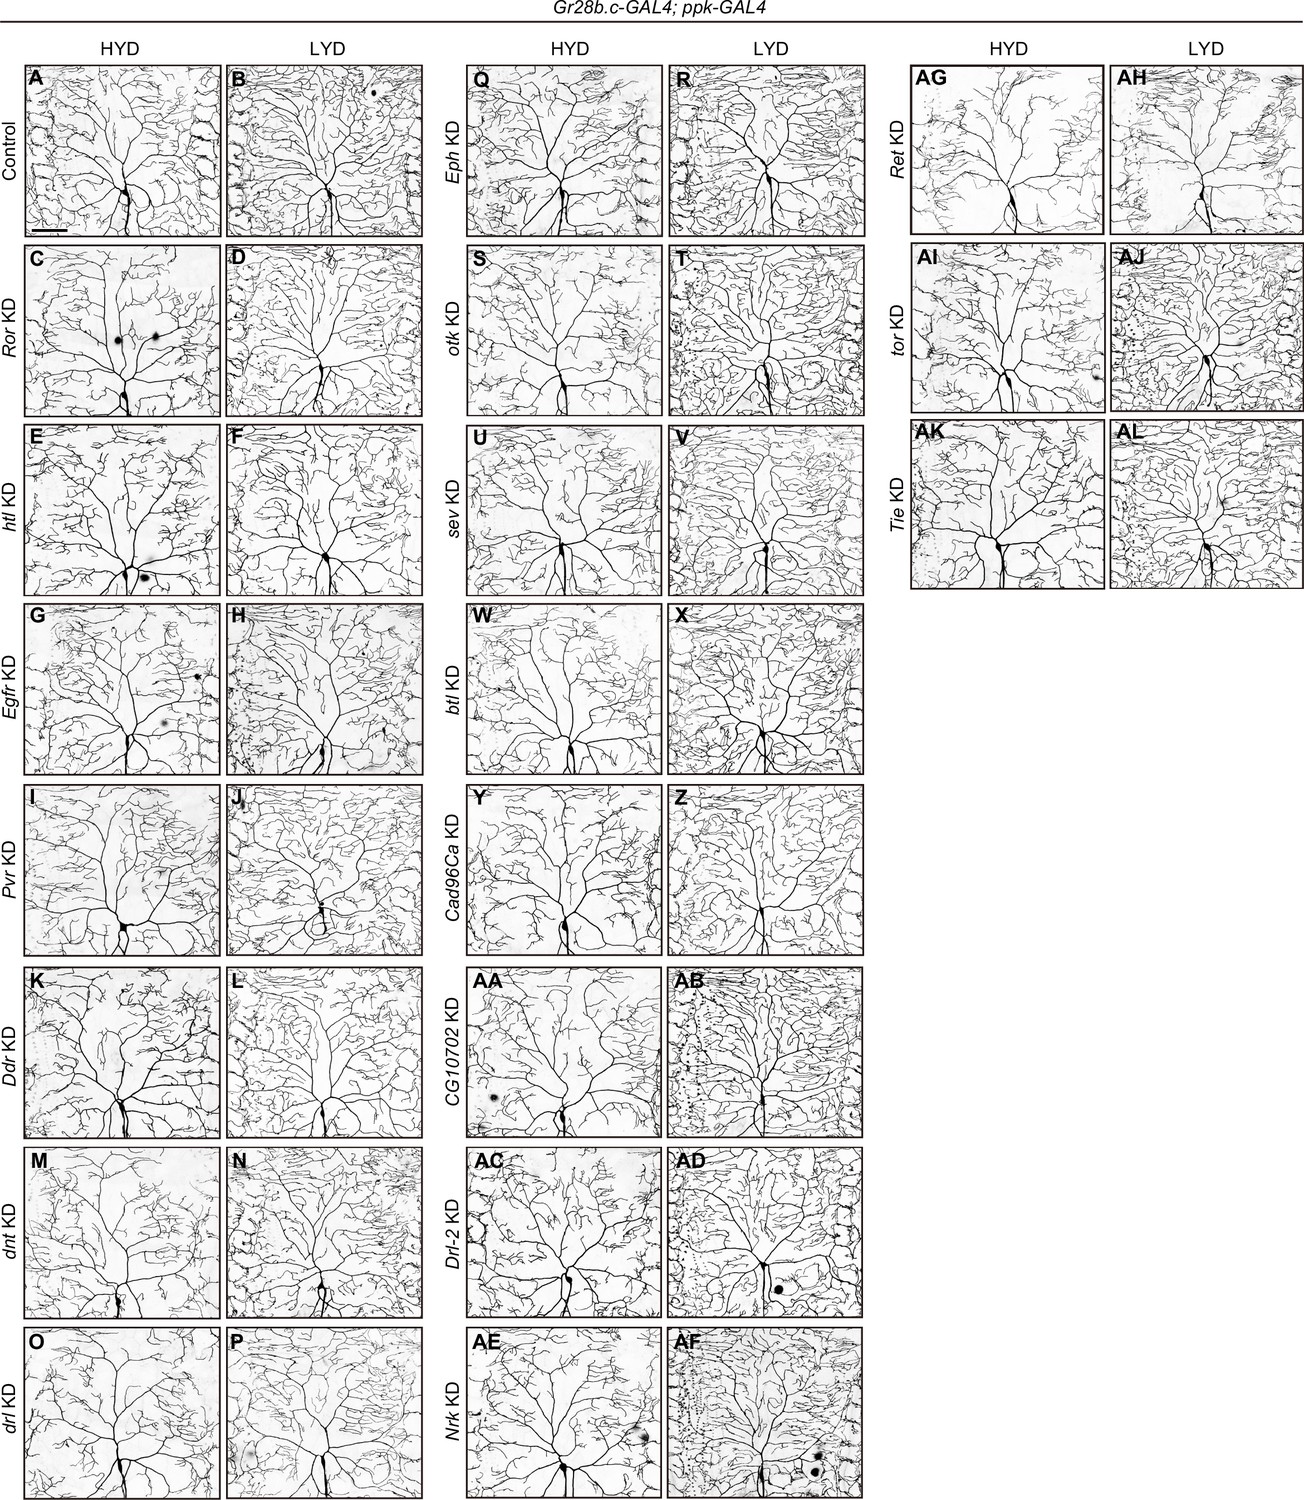
Results of the primary knockdown screening of RTK genes.
(A–AL) Images of ddaC neurons where individual RTK genes were knocked down either on HYD or on LYD. Gr28b.c-GAL4 and ppk-GAL4 were used together to enhance KD efficacy in this primary RTK screening. The results of InR or Alk KD are shown in Figure 2—figure supplement 5A–F and 5 M-5P. Results are summarized in Supplementary file 2. Scale bars, 100 μm.
Figure 2—figure supplement 5
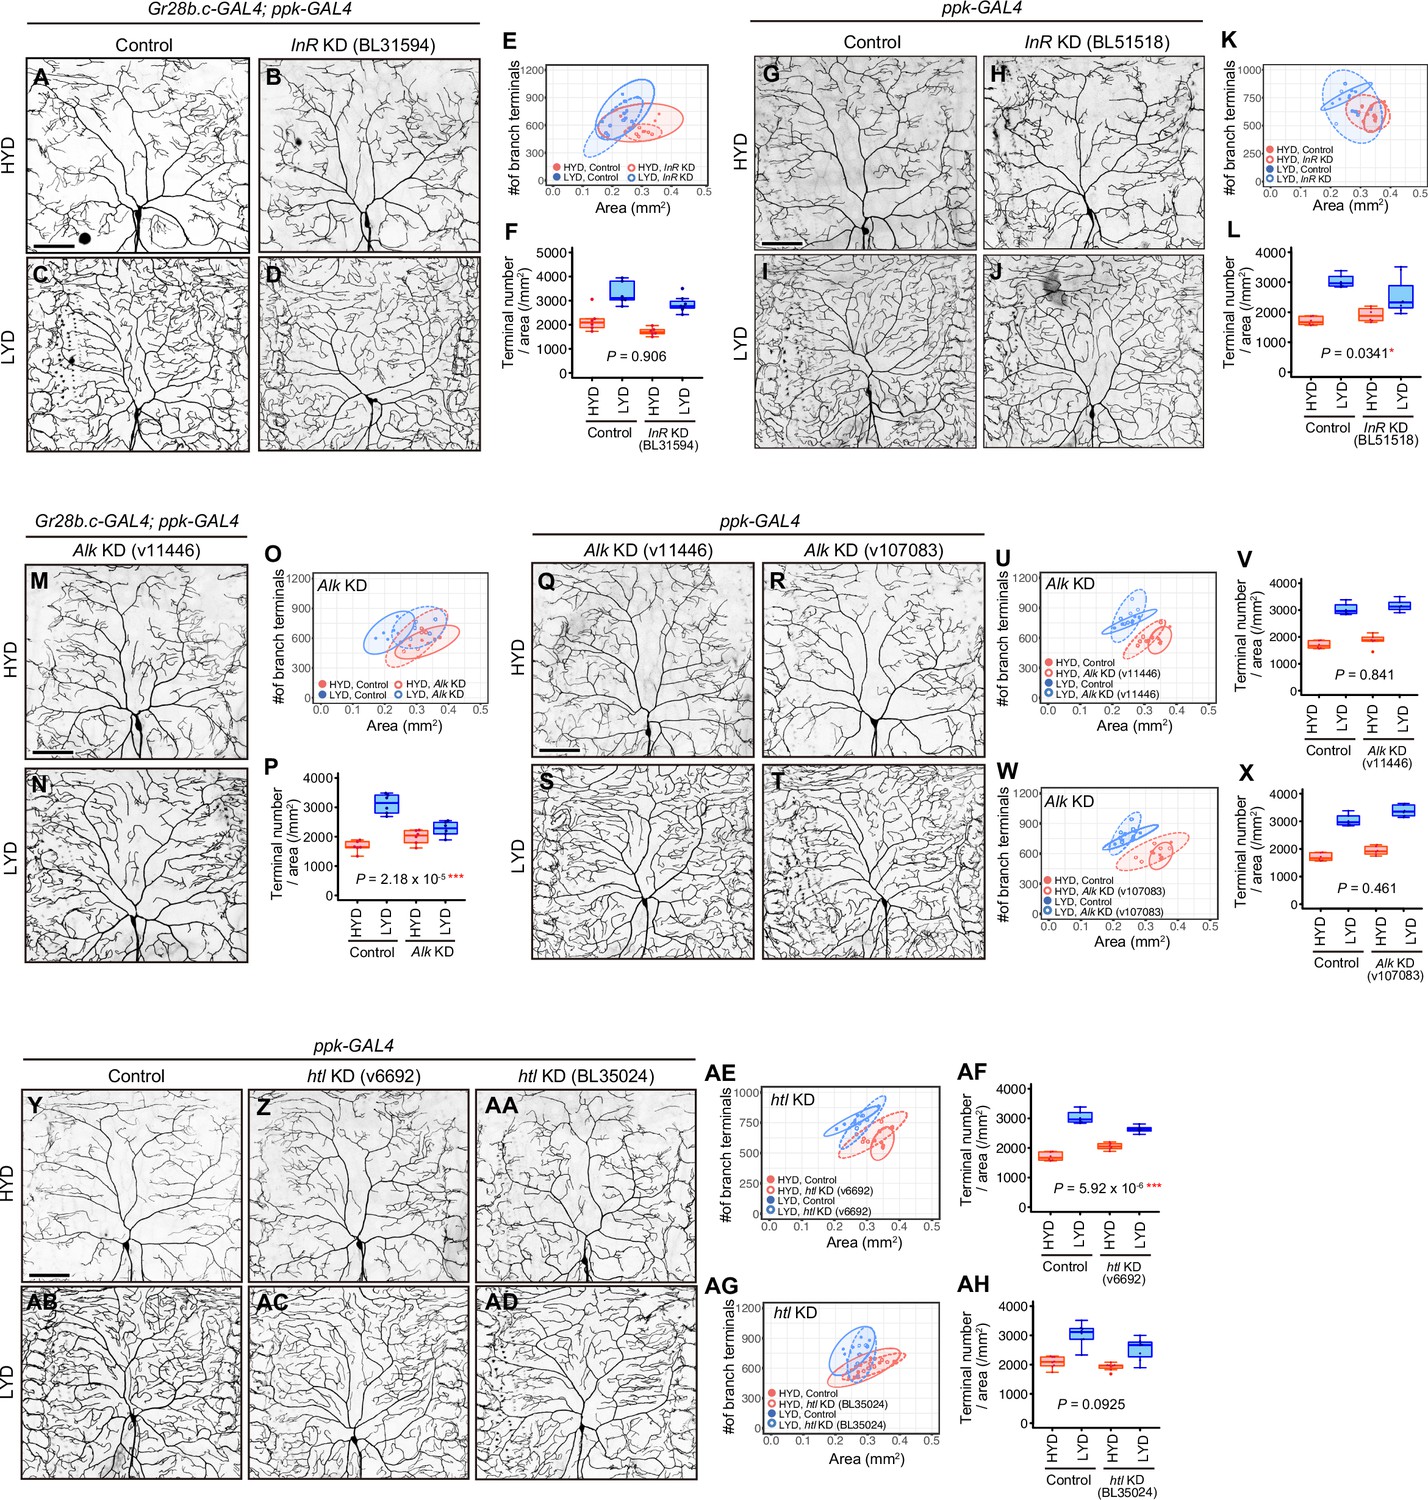
Knockdown effects of InR, Alk or htl in the primary and the secondary screenings.
(A–F) Images of control (A and C) or InR KD ddaC neurons using UAS-InR RNAiBL31594 (B and D), on HYD or LYD. Gr28b.c-GAL4 and ppk-GAL4 were used together for the KD in the primary screening. 2D plot (E) and densities of branch terminals (F). (F) Compared to the difference between HYD and LYD in control C4da neurons, that difference in InR KD neurons is not significantly affected as indicated by the P-value (two-way ANOVA, n=6), suggesting that InR KD neurons still exhibited hyperarborization under this experimental condition. (G–L) Images of control (G and I) or InR KD ddaC neurons using UAS-InR RNAiB51518 (H and J), on HYD or LYD. ppk-GAL4 was used for the KD in the secondary screening. 2D plot (K) and densities of branch terminals (L). (L) Compared to the difference between HYD and LYD in control C4da neurons, that difference in InR KD neurons is smaller as indicated by the p-value (two-way ANOVA, n=6), suggesting that the hyperarborization was blunted by the InR KD under this experimental condition. (M–P) Images of Alk KD ddaC neurons using UAS-Alk RNAiv11446, on HYD (M) or LYD (N). Images of control ddaC neurons are shown in (A) and (C). Gr28b.c-GAL4 and ppk-GAL4 were used together for the KD. 2D plot (O) and densities of branch terminals (P, two-way ANOVA, n=6). Hyperarborization was blunted by the Alk KD. (Q–X) Images of Alk KD ddaC neurons using UAS-Alk RNAiv11446 (Q and S) or UAS-Alk RNAiv107083 (R and T), on HYD or LYD. Images of control ddaC neurons are shown in (G) and (I). ppk-GAL4 was used for the KD. 2D plots (U and W) and densities of branch terminals (V and X, two-way ANOVA, n=6). In contarst to the result in (M–P), Alk KD using neither line blunted hyperarborization. (Y–AH) Images of control (Y and AB) or htl KD ddaC neurons using UAS-htl RNAiv6692 (Z and AC) or UAS-htl RNAi BL35024 (AA and AD), on HYD or LYD. ppk-GAL4 was used for the KD. 2D plots (AE and AG) and densities of branch terminals (AF and AH, two-way ANOVA, n=6–8). htl KD using UAS-htl RNAiv6692 blunted hyperarborization, while KD using UAS-htl RNAiBL35024 did not. Results are summarized in Supplementary file 2. The boxplots and the 2D plots are depicted as in Figure 1C and F, respectively. *p<0.05, **p<0.01, and ***p<0.001. Scale bars, 100 μm.
Figure 2—figure supplement 6
RTK genes that were negative in the secondary screening.
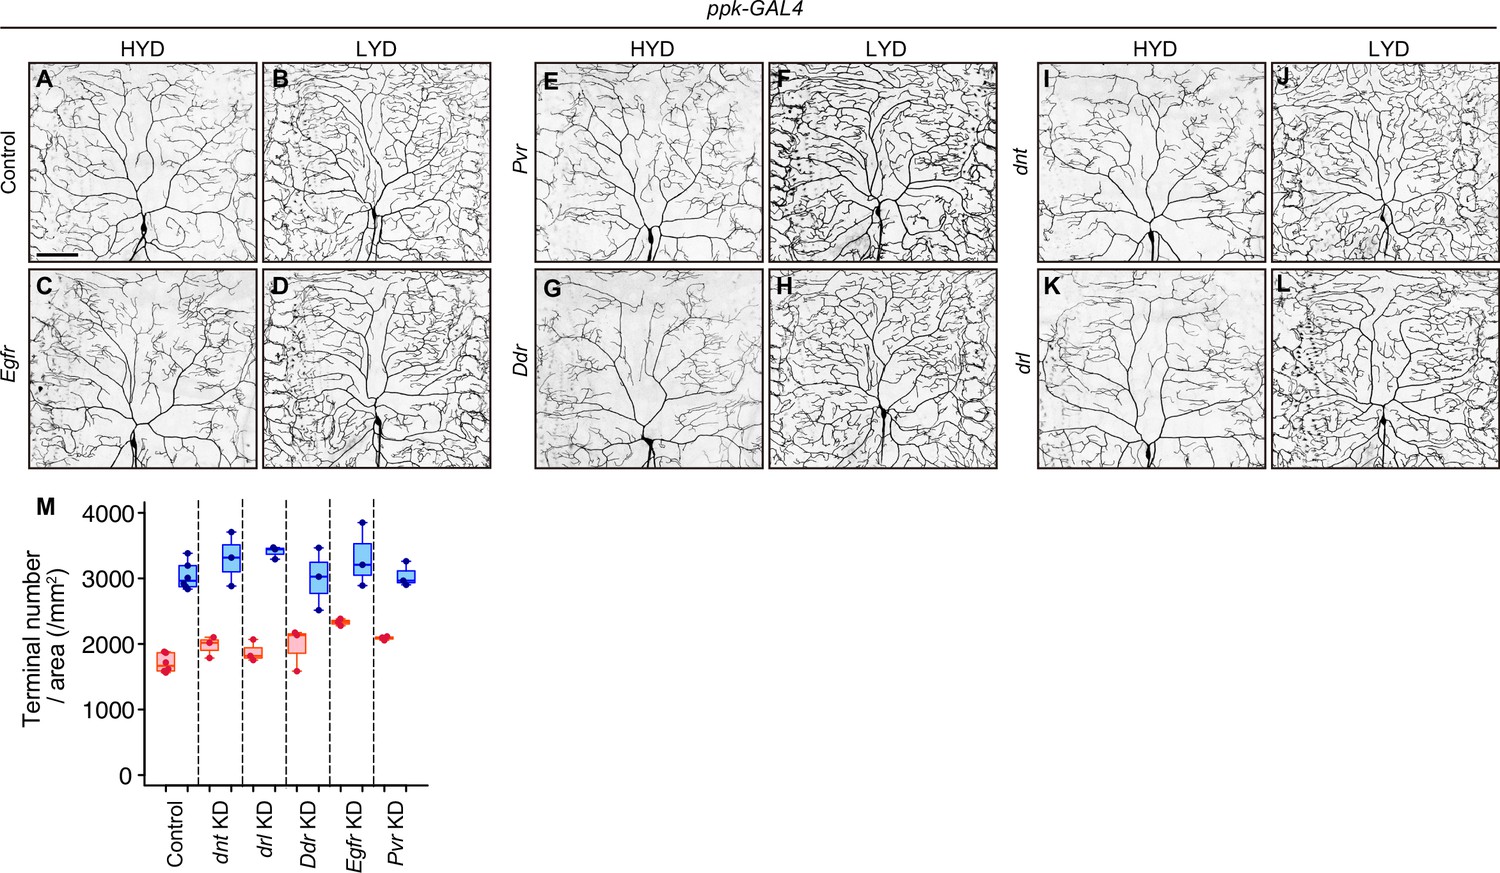
(A–L) Images of control (A and B) or Egfr (C and D), Pvr (E and F), Ddr (G and H), dnt (I and J) or drl (K and L) KD ddaC neurons, on HYD or LYD. (M) Densities of branch terminals are depicted as in Figure 1C. ppk-GAL4 was used for the konckdowns in the secondary screening. Results are summarized in Supplementary file 2. Scale bars, 100 μm.
Figure 3 with 1 supplement
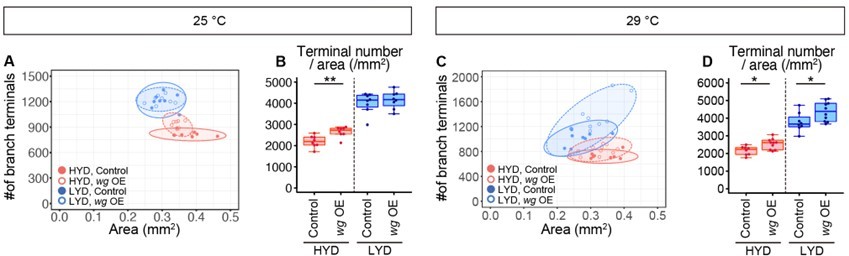
Wg in muscles is expressed more highly on LYD and promotes dendritic branching of C4da neurons.
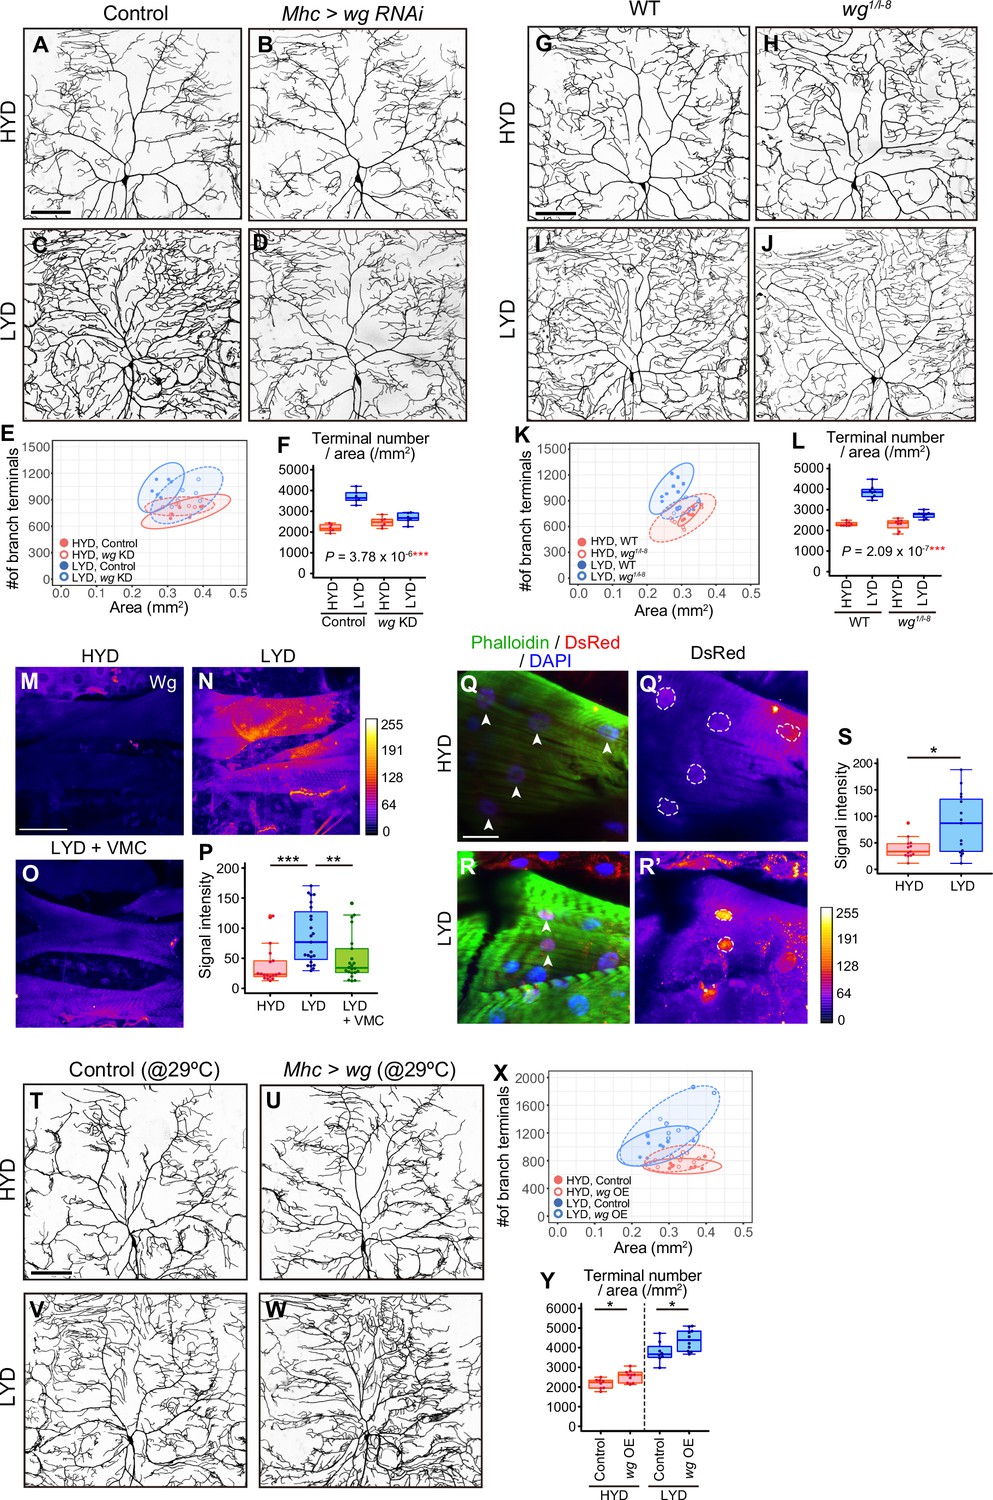
(A–F) Images of ddaC neurons in control larvae (A and C) or larvae with wg KD in muscles (B and D), on HYD or LYD. 2D plot (E) and densities of branch terminals (F, two-way ANOVA, n=6). (G–L) Images of ddaC neurons in WT (G and I) or wg1/l-8 larvae (H and J) on HYD or LYD. 2D plot (K) and densities of branch terminals (L, two-way ANOVA, n=8). (M–P) Muscles in larvae reared on HYD (M), LYD (N), or LYD +VMC (O) were stained for Wg. The signal intensities are represented by the indicated color code. (P) Quantification of the mean Wg immunofluorescence intensity in muscle 9, one of the closest muscles to the ddaC neuron (Steel Dwass test, n=18–23). (Q–S) Images of wg-Gal4 muscles driving the expression of RedStinger, which is DsRed tagged with a nuclear localization signal. Muscles, on HYD (Q) or LYD (R) were stained with phalloidin (green), an antibody to DsRed (red), and DAPI (blue). The signal intensities of DsRed are represented by the indicated color code, and white dashed circles indicate outlines of nuclei (Q’and R’). (S) Quantification of DsRed intensity in nuclei of muscle 9 (Wilcoxon-Mann-Whitney test, n=13–15). (T–Y) Images of ddaC neurons in control larvae (T and V) or larvae with wg overexpression at 29 °C in muscles (U and W) on HYD or LYD. 2D plot (X) and densities of branch terminals (Y, Wilcoxon-Mann-Whitney test, n=8–10). Experiments were couducted at both 29°C and 25°C, but only results at 29 °C are shown. At 29 °C, the effect of wg overexpression was expected to be higher, and in fact, branch terminal density increased on both HYD and on LYD, but only on HYD at 25 °C. The increase in the branch terminal density elicited by wg overexpression on both diets was less dramatic than the difference in the branch terminal density due to the diets in each respective genotype. The ddaC neurons were visualized by expressing ppk-CD4:tdGFP. Boxplots in (F, L, P, S, and Y) are depicted as in Figure 1C. *p<0.05, **p<0.01, and ***p<0.001. Scale bars, 100 μm (A-D, G-J, M-O, and T-W), 25 μm (Q-R’).
Figure 3—figure supplement 1
Wg from muscles, but not from epidermal cells, contributes to the hyperarboriztion phenotype.
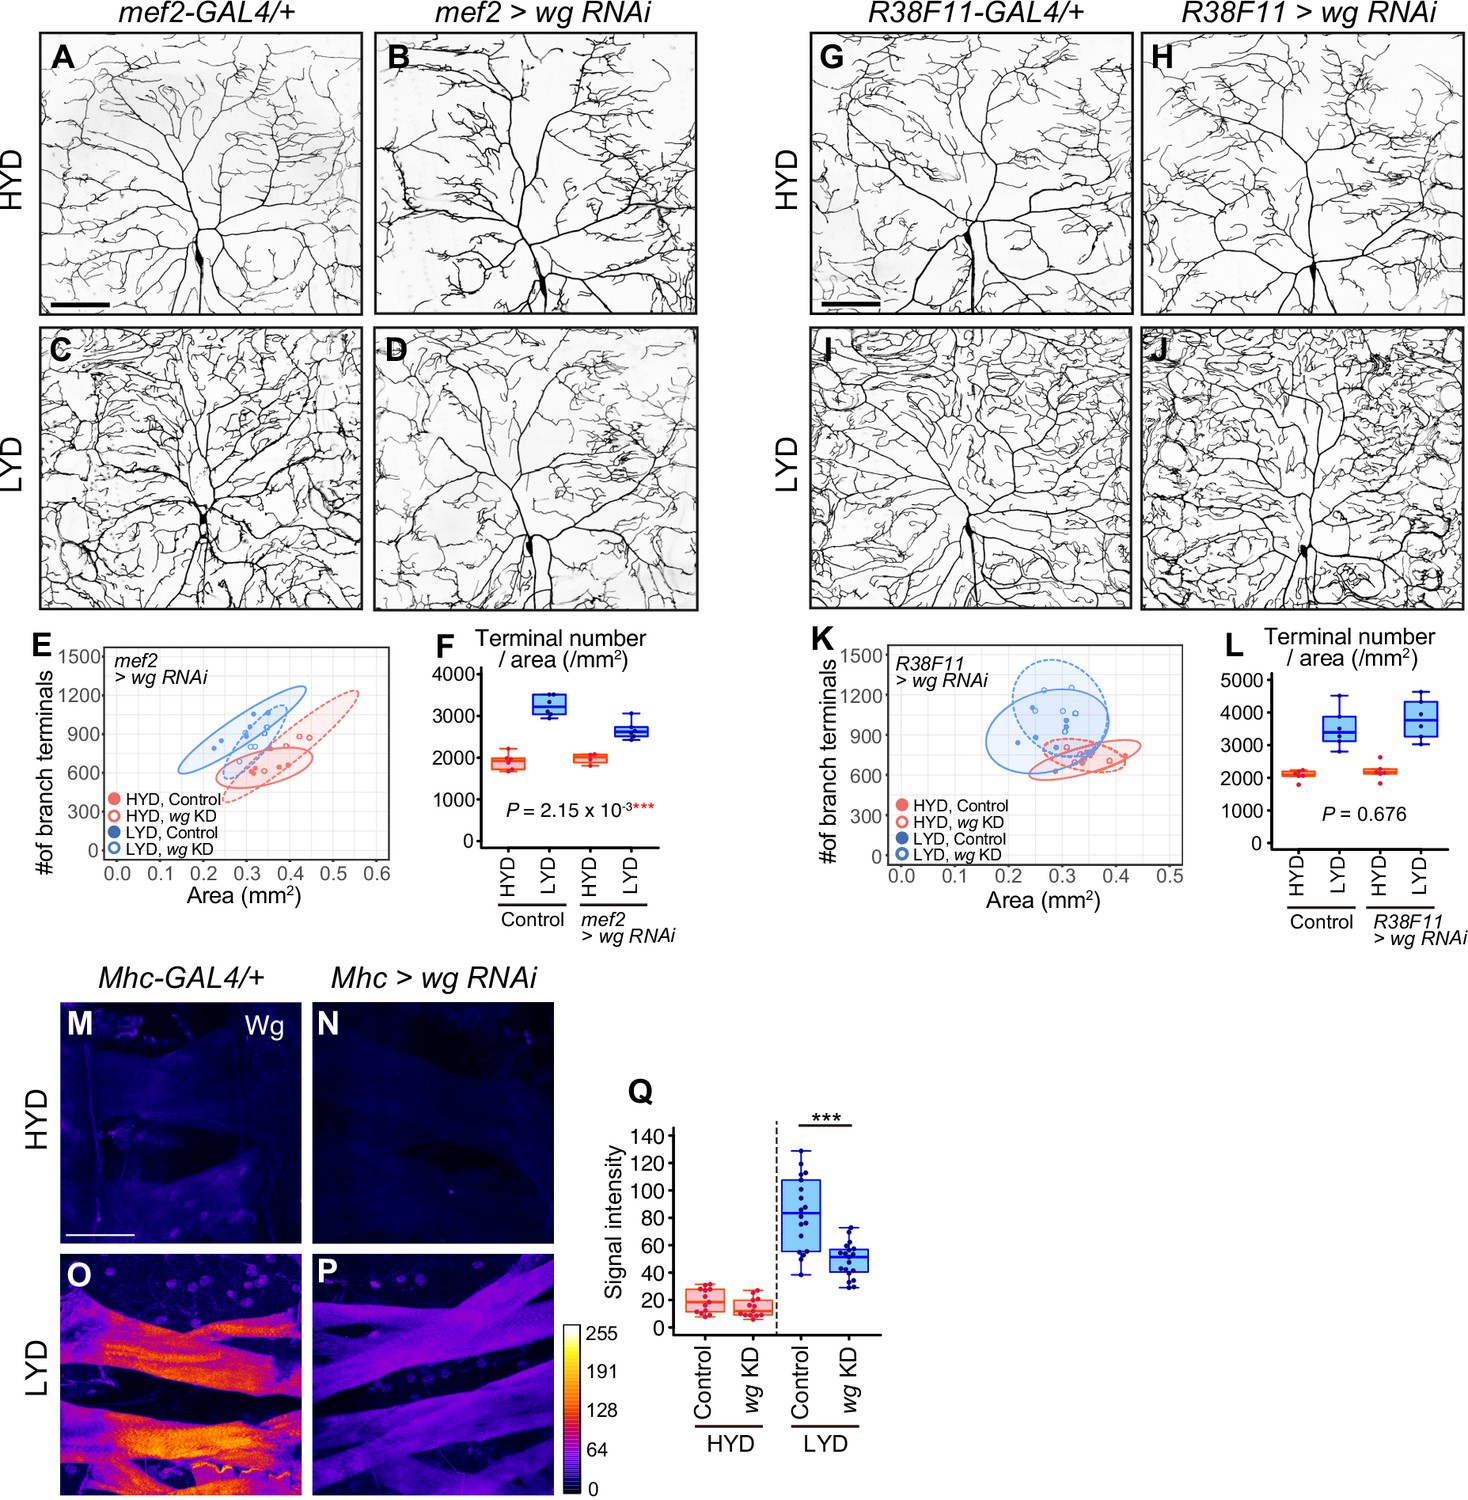
(A–F) Images of ddaC neurons in control larvae (A and C) or larvae with wg knocked down in muscles using mef2-Gal4 (B and D), on HYD or LYD. 2D plot (E) and densities of branch terminals (F, two-way ANOVA, n=4–6). (G–L) Images of ddaC neurons in control larvae (G and I) or larvae with wg knocked down in epidermal cells (H and J), on HYD or LYD. 2D plot (K) and densities of branch terminals (L, two-way ANOVA, n=6). (M–Q) Muscles in control larvae (M and O) or larvae with wg knocked down in muscles using Mhc-gal4 (N and P), on HYD or LYD, were stained for Wg. The signal intensities correspond to the indicated color code. (Q) Quantification of the mean Wg immunofluorescence in muscle 9 (Wilcoxon-Mann-Whitney test, n=13–19). Knocking down wg decreased the signal intensity in the muscle on LYD. The ddaC neurons were visualized by expressing ppk-CD4:tdGFP. Boxplots in (F, L and Q) are depicted as in Figure 1C. ***p<0.001. Scale bars, 100 μm.
Figure 4 with 3 supplements
Wg-Ror-mediated activation of Akt in C4da neurons evokes the hyperarborization.
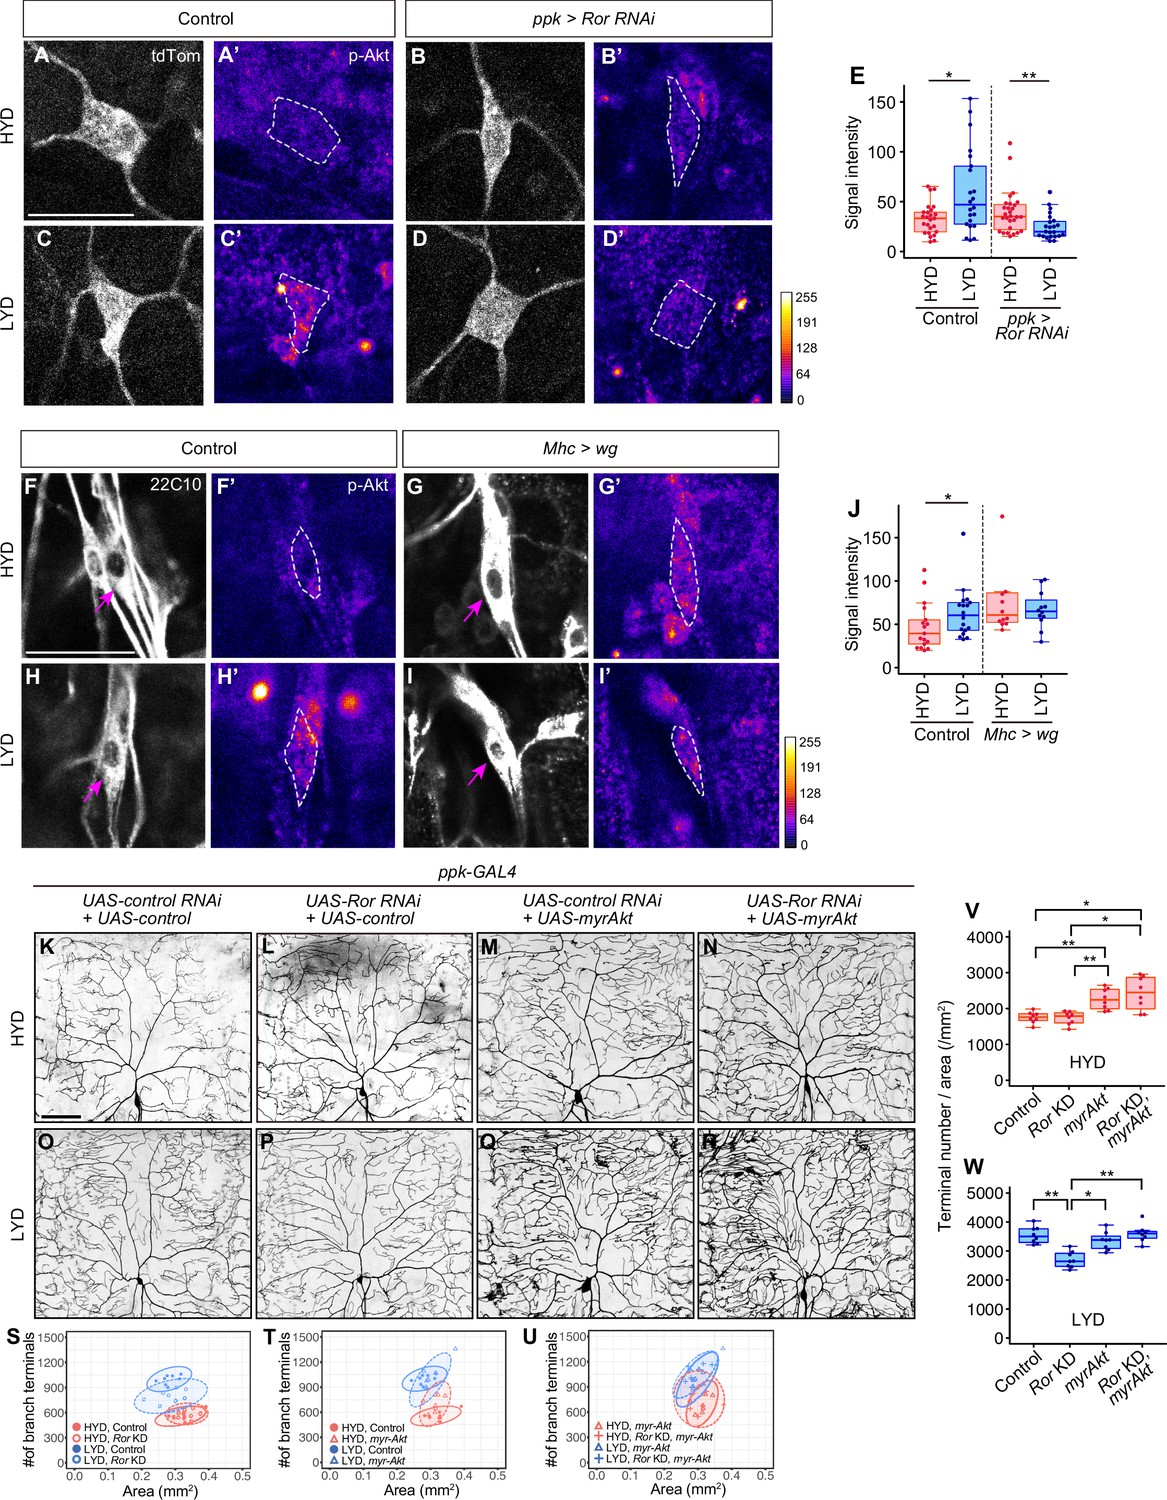
(A–E) Control ddaC (A, A’, C and C’) or Ror KD ddaC neurons (B, B’, D and D’) were stained for p-Akt (A’-D’) and co-imaged with a C4da neuron marker ppk-CD4:tdTom (A–D). The signal intensities of p-Akt correspond to the indicated color code, at right, and white dashed circles indicate the cell bodies of ddaC neurons. (E) Quantification of p-Akt intensity in cell bodies of control or Ror knocked down ddaC neurons (Wilcoxon-Mann-Whitney test, n=22–28). (F–J) ddaC in control larvae (F, F’, H and H’) or larvae with wg overexpression in muscles (G, G’, I and I’) were stained for a pan-sensory neuron marker (22C10; F–I) and for p-Akt (F’-I’). (F–I) Magenta arrows indicate the cell bodies of ddaC neurons. (F’-I’) The intensities of p-Akt signals correspond to the indicated color code, at right, and white dashed circles indicate the cell bodies of ddaC neurons. (J) Quantification of p-Akt intensity in control larvae or larvae with wg overexpression in muscles (Wilcoxon-Mann-Whitney test, n=12–18). (K–U) Images of UAS-control RNAi and UAS-control expressing ddaC neurons (K and O), UAS-Ror RNAi and UAS-control expressing ddaC neurons (L and P), UAS-control RNAi and UAS-myrAkt, a constitutively active form of Akt, expressing ddaC neurons (M and Q), or UAS-Ror RNAi and UAS-myrAkt expressing ddaC neurons (N and R), on HYD or LYD. We used UAS-grnd RNAi, which had no significant impact on the hyperarborization phenotype (Figure 2—figure supplement 1A and E, 1I, and 1 M), as the UAS-control RNAi and UAS-CD4:tdTom as the UAS-control. (S–W) Quantitative analysis of combinatorial effects of Ror KD and myrAkt expression. (S–U) 2D plots. (V and W) Densities of branch terminals on HYD (V) or LYD (W) (Steel Dwass test, n=8–9). Boxplots in (E, J, V and W) are depicted as in Figure 1C. *p<0.05 and **p<0.01. Scale bars, 25 μm (A-D’ and F-I’), 100 μm (K–R).
Figure 4—figure supplement 1

Fz2, a receptor for Wnt proteins, is required in C4da neurons to hyperarborize their dendrites.
(A–J) Images of control (A and D), fz KD (B and E), or fz2 KD (C and F) ddaC neurons, on HYD or LYD. 2D plots (G and H) and densities of branch terminals (I and J). (I and J) Compared to the difference between HYD and LYD in control C4da neurons, that difference in fz or fz2 KD neurons is smaller as indicated by the P-value (two-way ANOVA, n=8). Both the 2D-plots and the boxplot of the terminal density show that the degree of attenuation of dendrite branching on LYD is higher in fz2 knocked down neurons than fz knocked down ones. Therefore, we mentioned only the result of fz2 KD in the main text; however, we do not rule out the possibility that Fz may also contribute to the hyperarborization phenotype. (K–N) Images of ddaC neurons from a wild-type clone (WT; K and M) or a fz2C2 mutant clone (L and N), on HYD or LYD. The ddaC neurons were visualized by expressing ppk-CD4:tdGFP. 2D plots (O) and densities of branch terminals (P, two-way ANOVA, n=7–8). Hyperarborization was strongly suppressed in fz2 mutant ddaC neurons as indicated by the p-values. Control data in (G) and (I) are shared with (H) and (J). Boxplots in (I) and (J) are depicted as in Figure 1C. **p<0.01 and ***p<0.001. Scale bars, 100 μm.
Figure 4—figure supplement 2
Effects of inhibiting intracellular Wnt signaling components on hyperarborization.
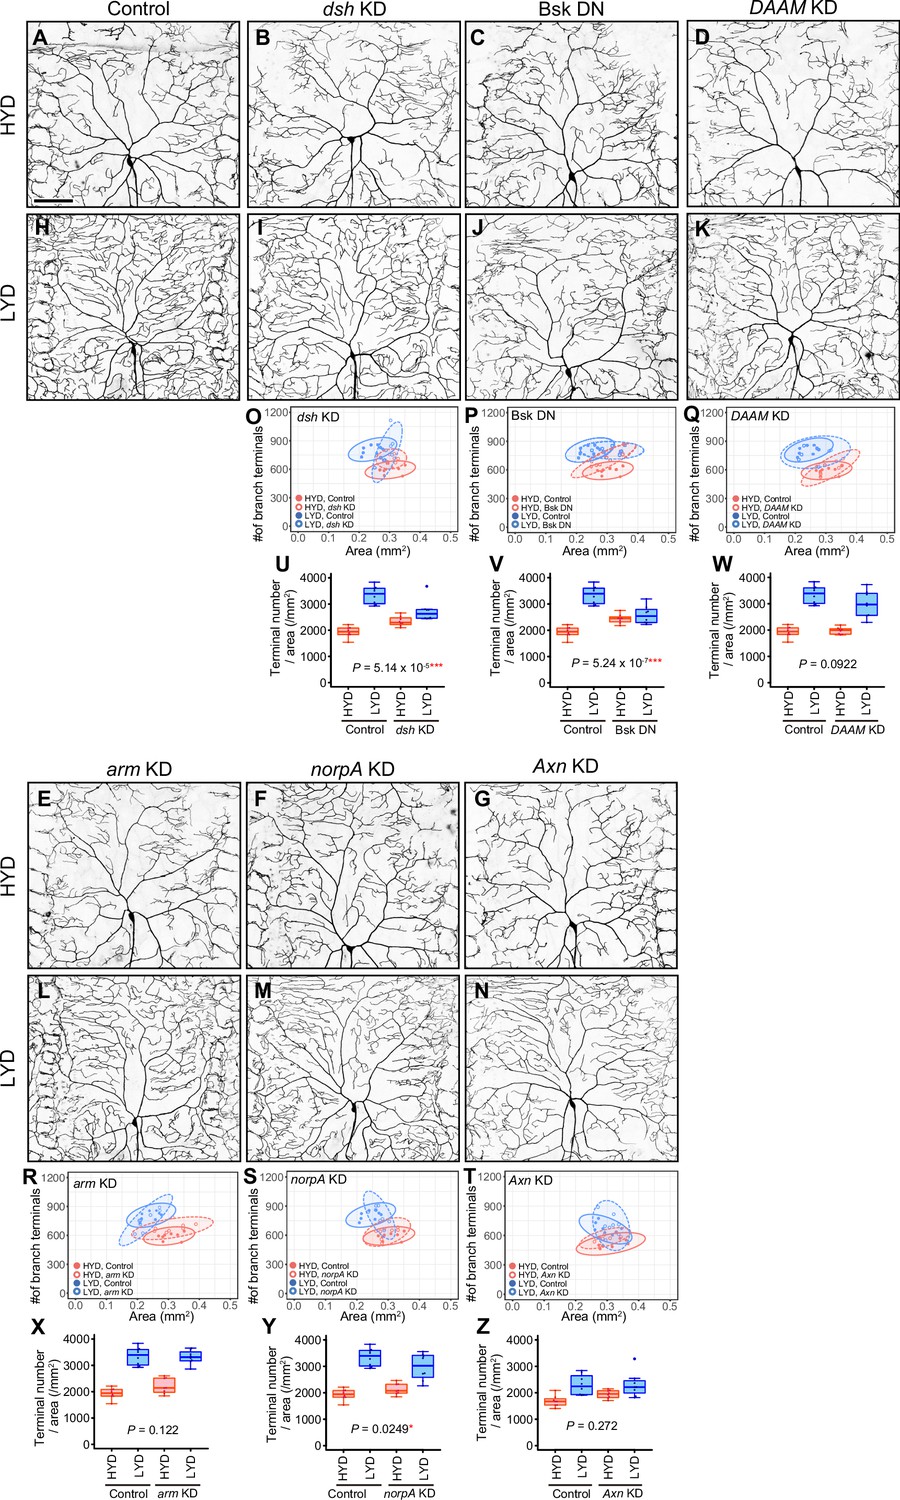
(A–N) Images of control ddaC neurons (A and H), dsh KD ddaC neurons (B and I), ddaC neurons expressing Bsk DN (C and J), DAAM KD ddaC neurons (D and K), arm KD ddaC neurons (E and L), norpA KD ddaC neurons (F and M), or Axn KD ddaC neurons (G and N), on HYD or LYD. (O–Z) Quantitative analysis. (O–T) 2D plots. (U–Z) Densities of branch terminals. Compared to the difference between HYD and LYD in control C4da neurons, that difference in dsh KD (U), bsk DN expressing (V), or norpA KD (Y) neurons is smaller as indicated by the respective P-values (two-way ANOVA, n=8). Reduction or loss of Ror function attenuated dendrite branching on LYD, while there were marginal effects on HYD (Figure 2K–V). On the other hand, dsh KD or expression of a dominant-negative form of Bsk not only reduced dendrite branching on LYD but also increased dendrite branching on HYD (O, P, U and V). This appears to be also the case with Axn KD although the effect was not statistically significant (G, N, T and Z). Given this phenotypic difference on HYD between Ror and dsh, bsk, or Axn, we speculate that Dsh, Bsk, and Axn might regulate the dendrite branching through a mechanism different from the low-nutrient dependent Wg-Ror pathway. We therefore did not focus on these factors further in this study. The effect of norpA KD was marginal and the distribution of the terminal densities was largely unaffected. Images of control neuron (A and H) are shared with Figure 4—figure supplement 1A, B. Control data in (O–S) and (U–Y) are shared with Figure 4—figure supplement 1G and I. Boxplots in (U–Z) are depicted as in Figure 1C. *p<0.05 and ***p<0.001. Scale bars, 100 μm.
Figure 4—figure supplement 3
C3da neurons increased the number of dendrite terminals and p-Akt levels on LYD, while C1da neurons did not.
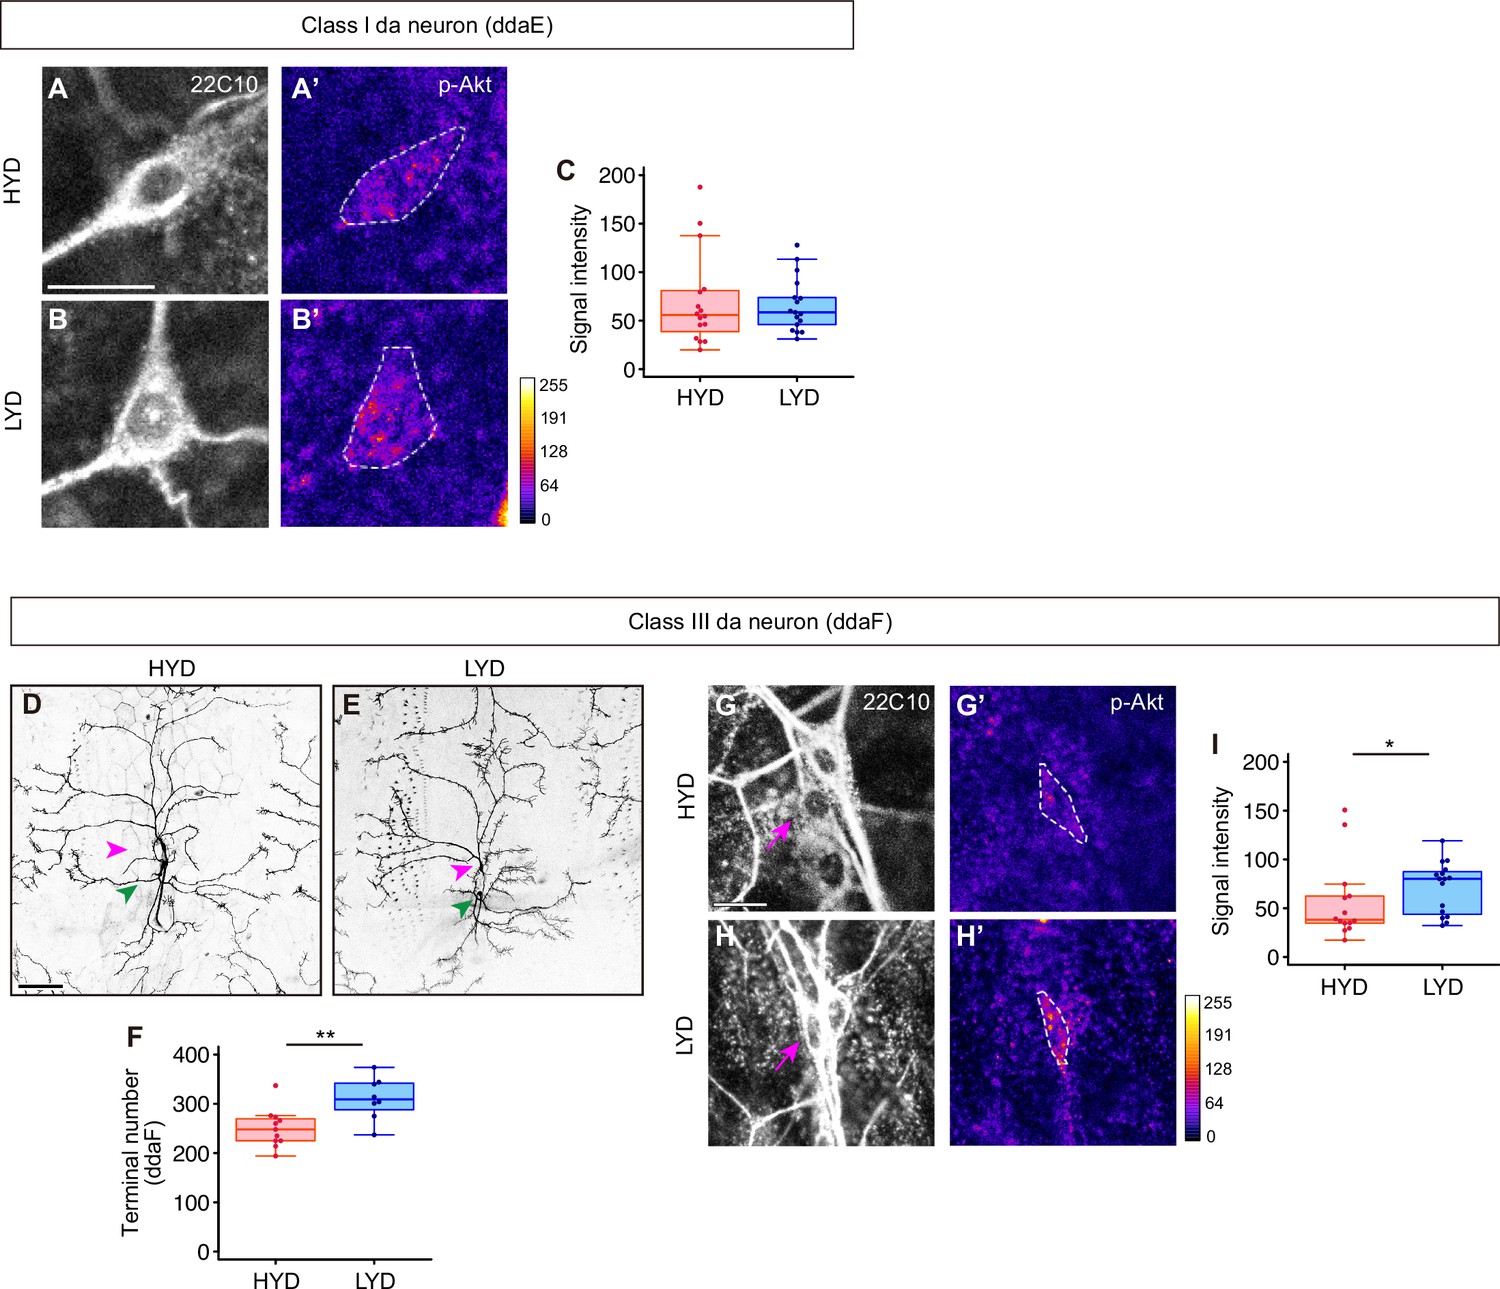
(A–C) C1da neurons, ddaE, on HYD (A and A’) or on LYD (B and B’) were stained for a pan-sensory neuron marker (22C10; A and B) and for p-Akt (A’ and B’). (A’ and B’) The intensities of p-Akt signals correspond to the indicated color code and cell bodies of ddaE are outlined with white dashed lines. Scale bar, 10 μm. (C) Quantification of p-Akt intensity (Wilcoxon-Mann-Whitney test, n=16–17). (D–F) Images of C3da neurons on HYD (D) or LYD (E). Magenta and green arrowheads indicate cell bodies of ddaF and ddaA neurons respectively. Scale bar, 100 μm. (F) The numbers of branch terminals of C3da neurons, ddaF, on HYD and LYD (Student’s t-test, n=8–11). Since it was difficult to precisely define the dendritic field of ddaF, we did not calculate dendritic area and terminal density. (G–I) C3da neurons, ddaF, on HYD (G and G’) or on LYD (H and H’) were stained for a pan-sensory neuron marker (22C10; G and H) and for p-Akt (G’ and H’). Magenta arrows in (G and H) indicate the cell bodies of ddaF. (G’ and H’) The intensities of p-Akt signals correspond to the indicated color code, and cell bodies of ddaF are outlined with white dashed lines. Scale bar, 10 μm. (I) Quantification of p-Akt intensity in ddaF neurons (Wilcoxon-Mann-Whitney test, n=14–16). Boxplots in (C, F, and I) are depicted as in Figure 1C. *p<0.05 and **p<0.01.
Figure 5 with 2 supplements
Downregulation of Wg expression by Stat92E on HYD suppresses the hyperarborization phenotype.
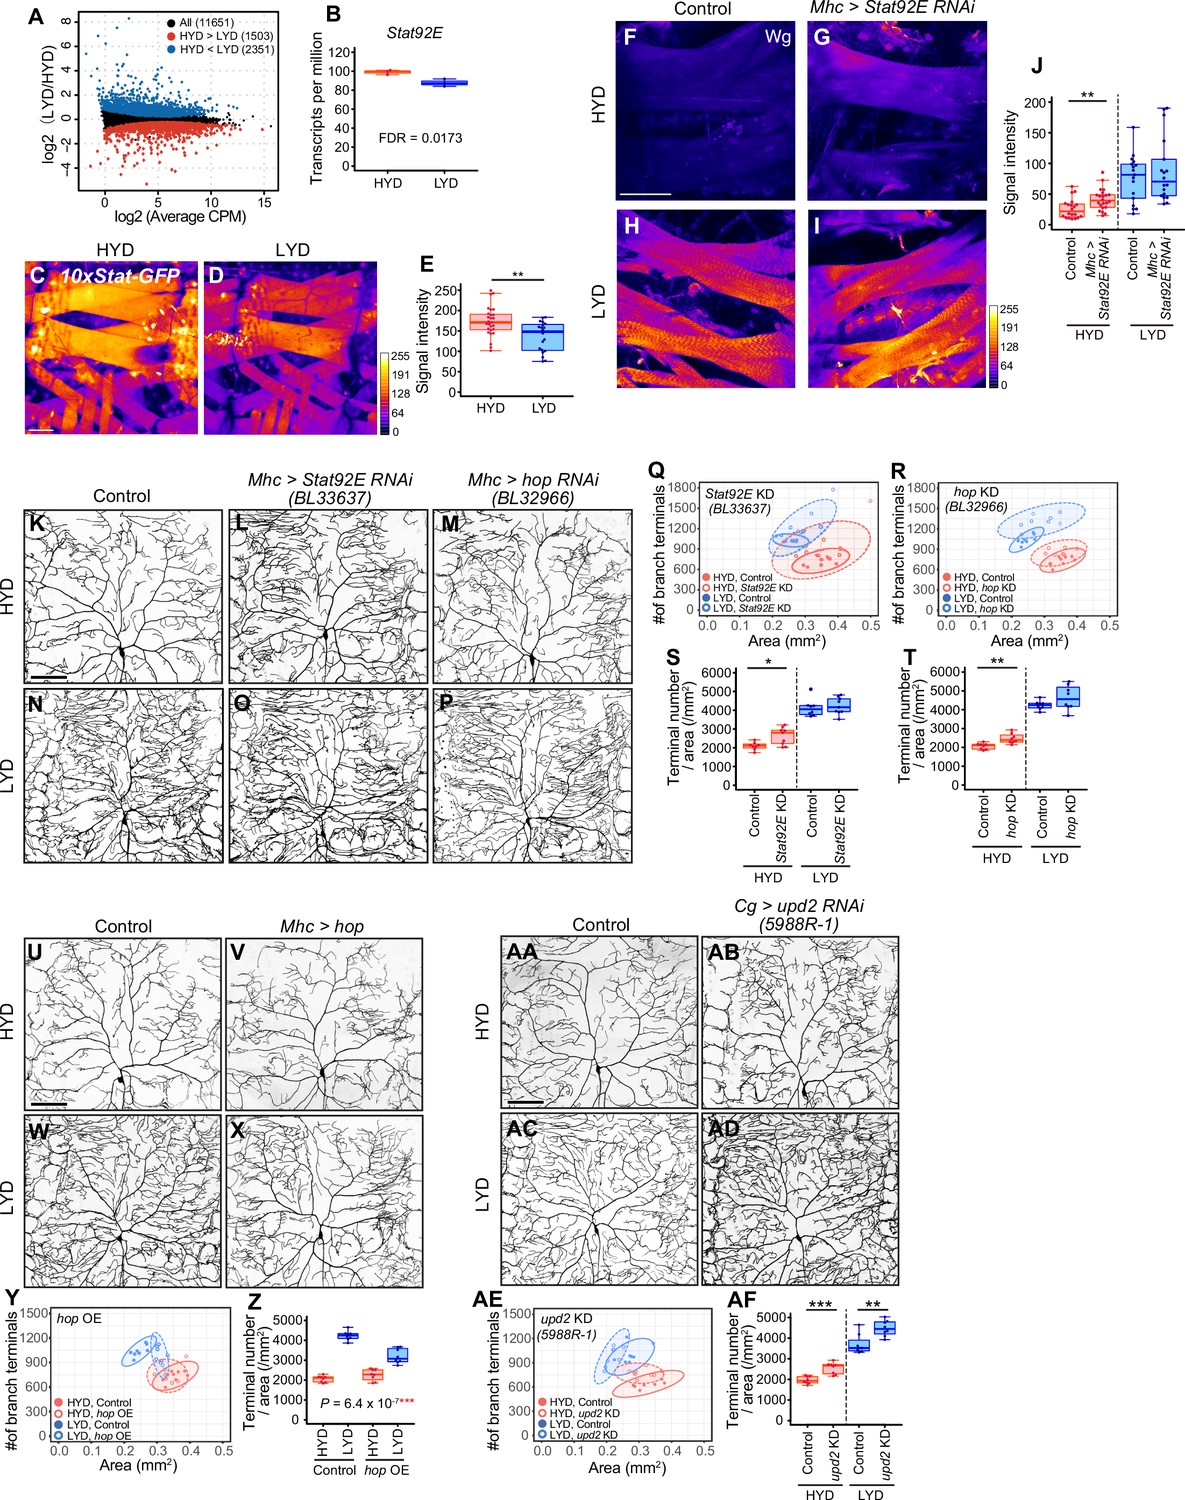
(A and B) Plots of whole-body RNA-seq of wandering 3rd instar larvae reared on HYD or LYD. (A) The fold change (LYD/HYD) in read counts was plotted against average counts per million mapped reads (CPM) for HYD and LYD. Dots that are statistically supported (FDR ≤0.05) are colored (red for HYD >LYD and blue for HYD <LYD). (B) Plot of transcripts per million (TPM) of Stat92E. Adjusted p-value with Benjamini & Hochberg correction (FDR) is indicated. (C–E) Muscles of 10 x Stat-GFP larvae on HYD (C) or LYD (D). The signal intensities of GFP correspond to the indicated color code. (E) Quantification of 10 x Stat-GFP intensity in muscle 9 (Student’s t-test, n=20–27). (F–J) Muscles of control larvae (F and H) or larvae with Stat92E KD in muscles (G and I) on HYD or LYD were stained for Wg. The signal intensities correspond to the indicated color code. (J) Quantification of the mean Wg immunofluorescence in muscle 9 (Wilcoxon-Mann-Whitney test, n=17–22). (K–T) Images of ddaC neurons in control larvae (K and N), larvae with Stat92E KD in muscles (L and O), or larvae with hop KD in muscles (M and P), on HYD or LYD. 2D plots (Q and R) and densities of branch terminals (S and T, Wilcoxon-Mann-Whitney test, n=8–9). (U–Z) Images of ddaC neurons in control larvae (U and W) or larvae with hop overexpression in muscles (V and X), on HYD or LYD. 2D plot (Y) and densities of branch terminals (Z, two-way ANOVA, n=8). (AA-AF) Images of ddaC neurons in control larvae (AA and AC) or larvae with upd2 KD in the fat body and hemocytes (AB and AD), raised on HYD or LYD. 2D plot (AE) and densities of branch terminals (AF, Wilcoxon-Mann-Whitney test, n=8). The ddaC neurons were visualized by expressing ppk-CD4:tdGFP. Control data in (R) and (T) are shared with (Y) and (Z). Boxplots in (B, E, J, S, T, Z and AF) are depicted as in Figure 1C. *p<0.05, **p<0.01, and ***p<0.001. Scale bars, 100 μm.
Figure 5—figure supplement 1
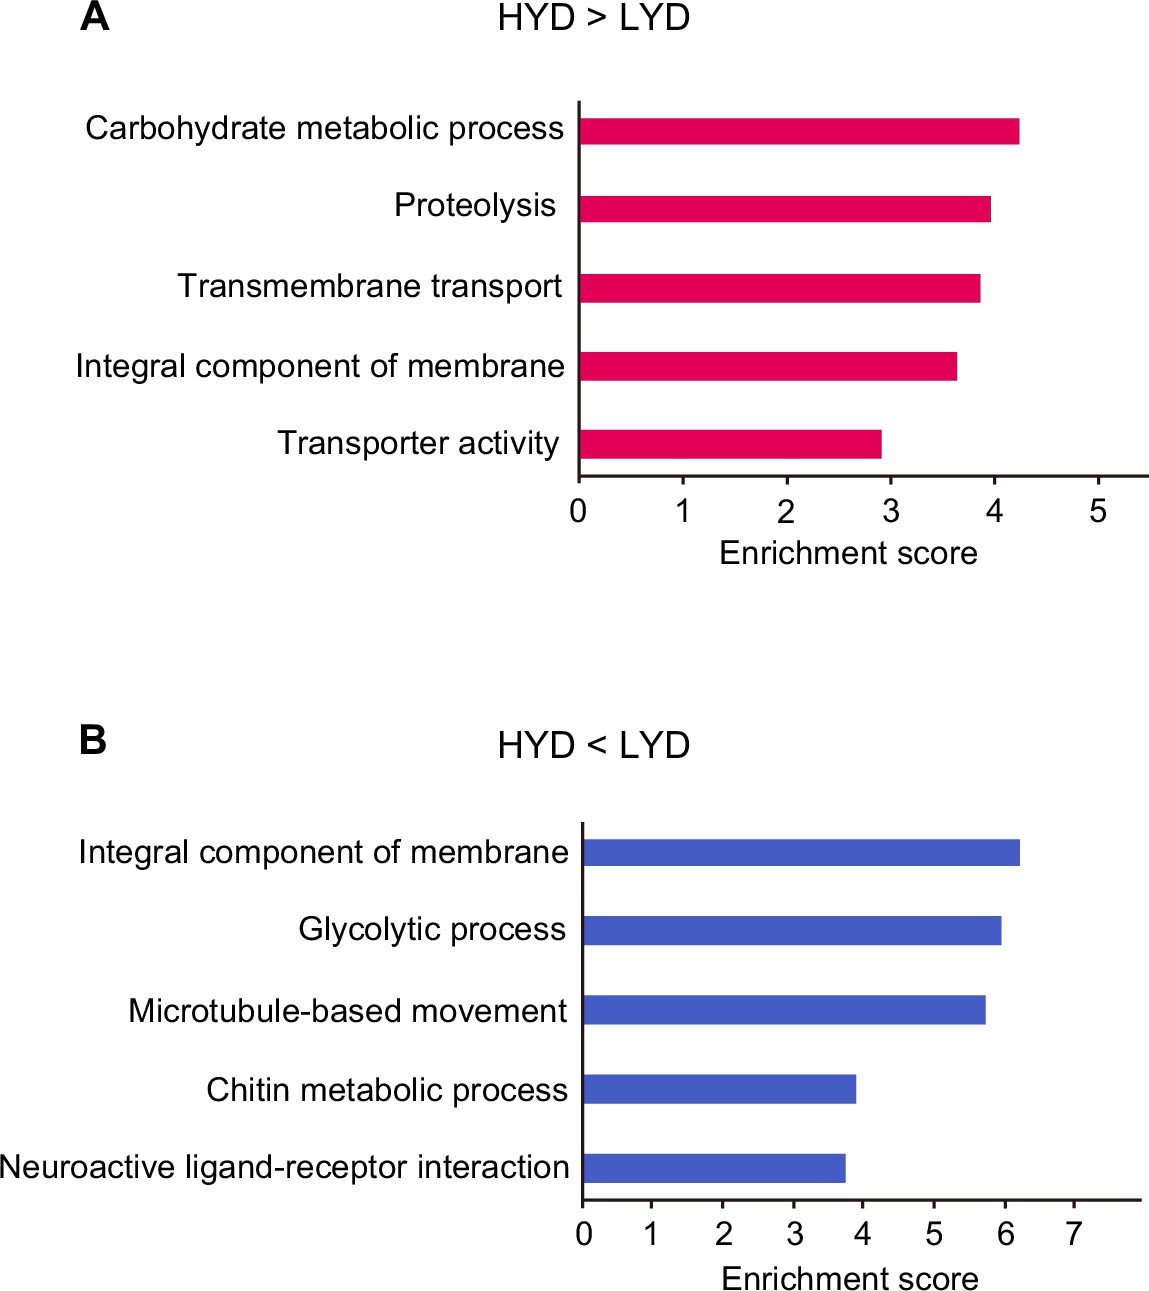
Enriched terms in functional annotation clustering of differentially expressed genes depending on diets in whole body RNA-seq data.
Enrichment score of the top five functional annotation clusters enriched in genes highly expressed on HYD rather than on LYD (A) or genes highly expressed on LYD rather than on HYD (B) in whole body RNA-seq data.
Figure 5—figure supplement 2
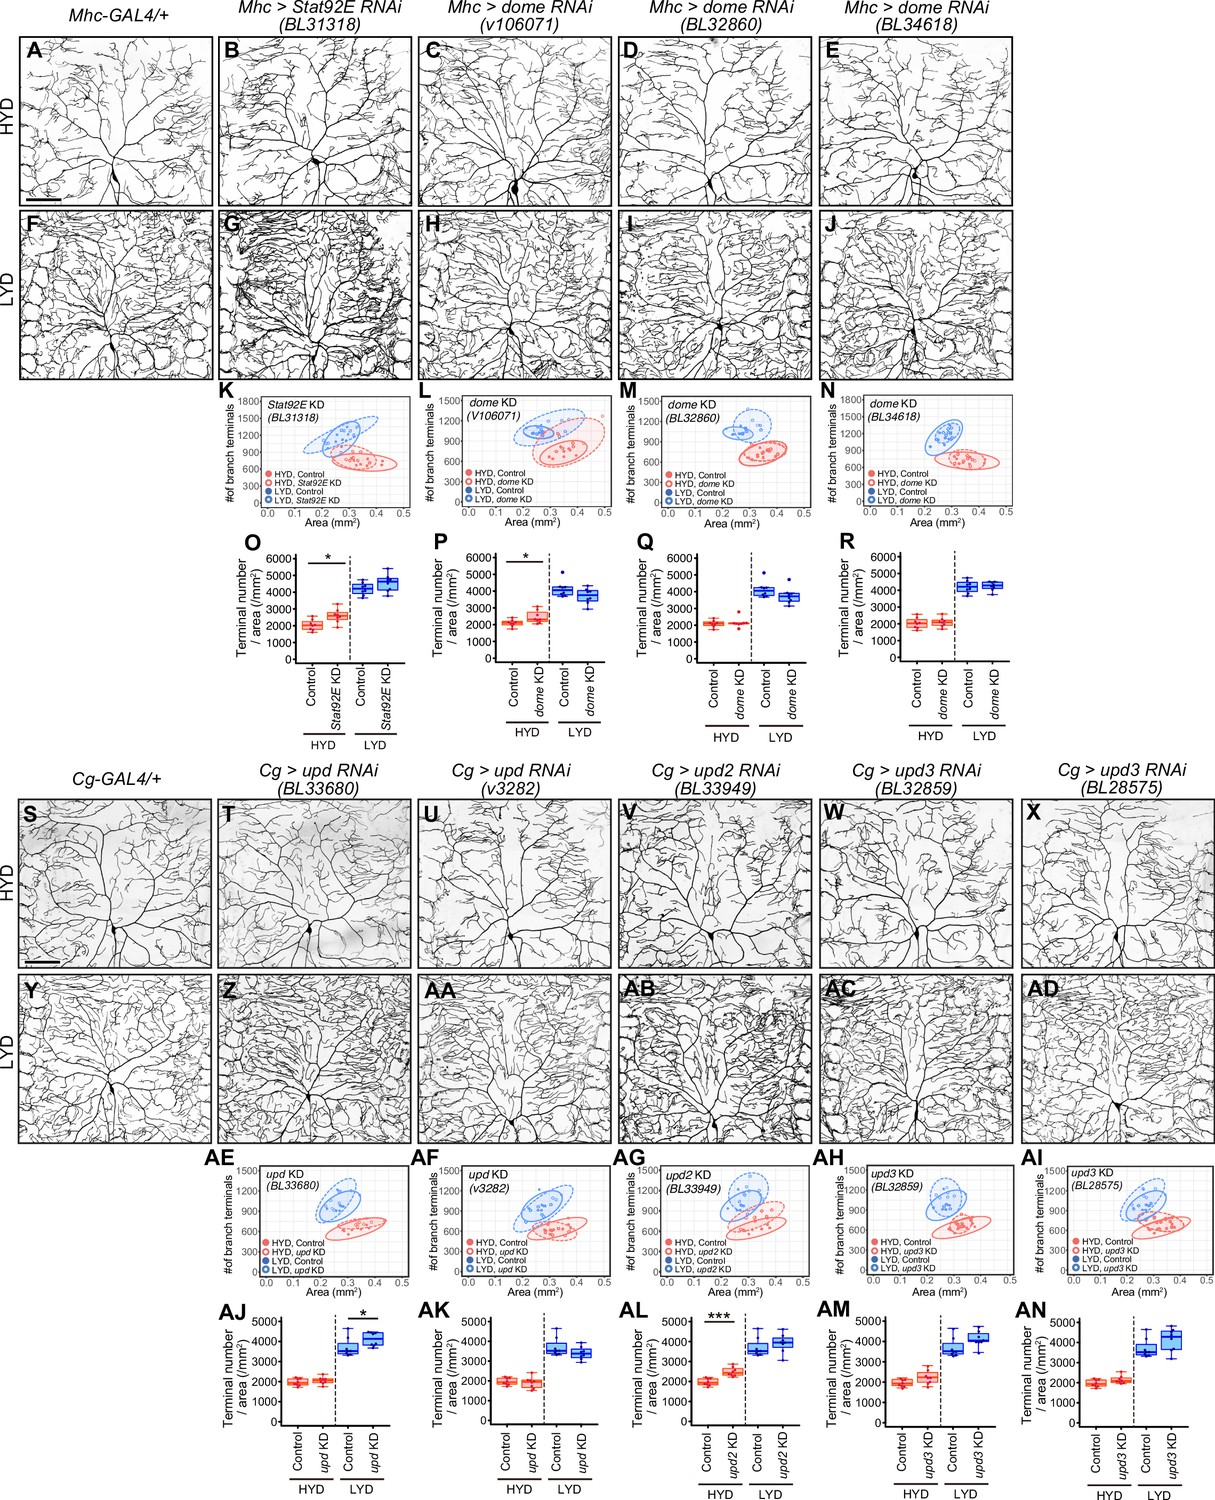
Effects of inhibiting components of JAK/STAT pathway on hyperarborization.
(A–R) Images of ddaC neurons in control larvae (A and F) and in larvae with Stat92E (B and G) or dome (C–E and H–J) knocked down in muscles, on HYD or LYD. 2D plots (K–N) and densities of branch terminals (O–R). (S–AN) Images of ddaC neurons in control larvae (S and Y) and in larvae with upd (T, U, Z and AA), upd2 (V and AB), or upd3 (W, X, AC and AD) knocked down in the fat body and hemocytes, on HYD or LYD. 2D plots (AE-AI) and densities of branch terminals (AJ-AN). The ddaC neurons were visualized by expressing ppk-CD4:tdGFP. Images of control neuron (S and Y) are shared with Figure 5AA and 5AC. Control data in (K) and (O) are shared with (N) and (R), those in (L and M) and (P and Q) are shared with Figure 5Q and S, and those in (AE-AI) and (AJ-AN) are shared with Figure 5AE and 5AF. Boxplots in (O–R and AJ–AN) are depicted as in Figure 1C. *p<0.05 and ***p<0.001 (Wilcoxon-Mann-Whitney test, n=8). Scale bars, 100 μm.
Figure 6
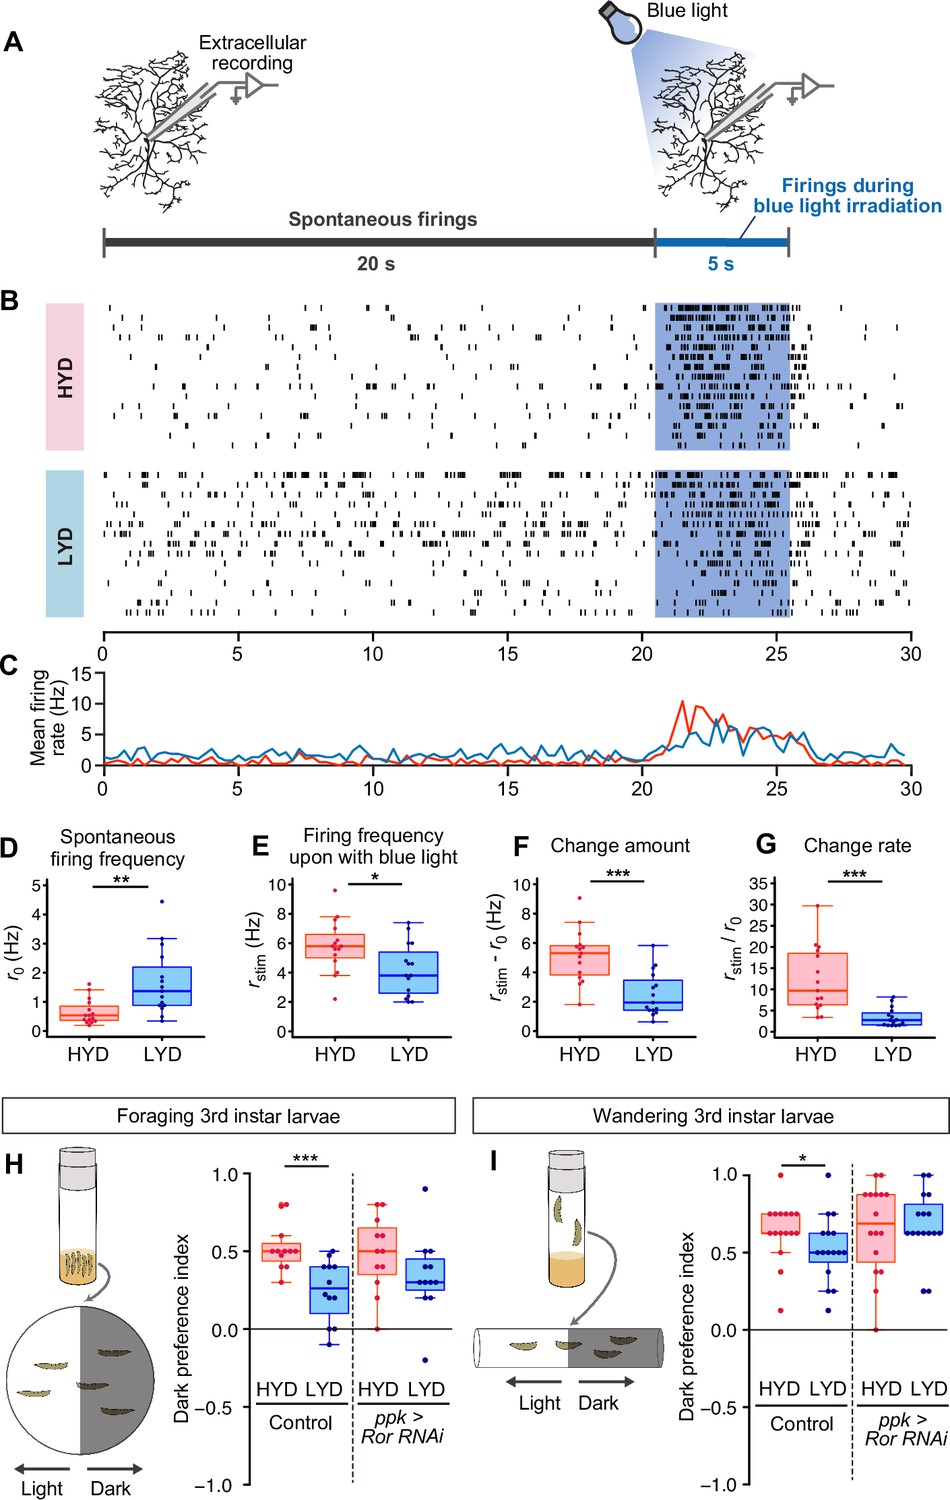
LYD blunts light responsiveness of C4da neurons and larval light avoidance behavior.
(A) A schematic diagram outlining the electrophysiological analysis. Firing activities of C4da neurons v’ada were recorded by measuring the extracellular membrane potential. After spontaneous firings were recorded for about 20 s, activities during blue light irradiation were monitored for 5 s. (B and C) Firing activities of C4da neurons on HYD or LYD. (B) Raster plots of firing. Blue shading indicates the 5 s blue light irradiation. Each row in the plots represents the data for a single cell. (C) Peristimulus time histograms calculated at 250 ms bins, on HYD (red line) or LYD (blue line). (D–G) Quantitative analysis of the firing activities. (D) Spontaneous firing frequency. (E) Firing frequency during blue light irradiation. (F) Change amount of the firing response to the blue light stimulus calculated by subtracting [spontaneous firing frequency] from [firing frequency during blue light irradiation] (G) Change rate of the firing response to the blue light stimulus calculated by dividing [firing frequency during blue light irradiation] by [spontaneous firing frequency]. (Wilcoxon-Mann-Whitney test, n=15). (H and I) Schematic diagram of light/dark choice assays and dark preference index of foraging 3rd instar larvae on agar plates (H), and wandering 3rd instar larvae in plastic tubes (I). Control larvae and larvae with Ror KD in C4da neurons were tested. (Wilcoxon-Mann-Whitney test, n=12–16) Boxplots in (D–I) are depicted as in Figure 1C. *p<0.05, **p<0.01, and ***p<0.001.
Figure 7
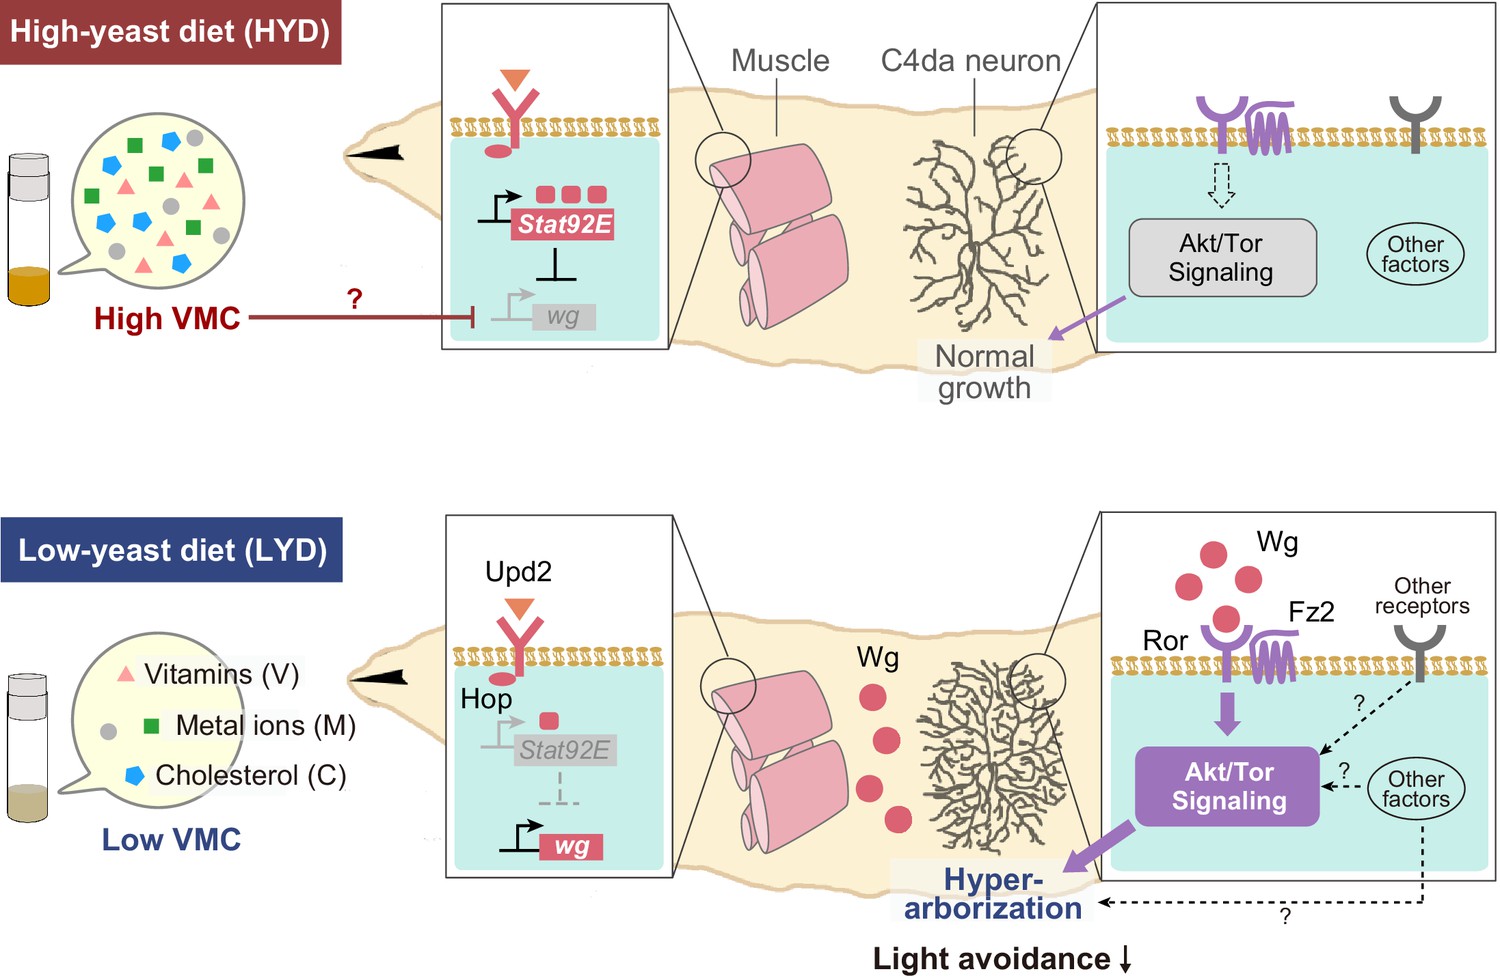
Model of the low-nutrient dependent dendritic hyperarborization.
Compared to C4da neurons of HYD-fed larvae (top), those of LYD-fed larvae (bottom) increase in dendritic branching (hyperarborization) due to a combined deficiency of vitamins, metal ions, and cholesterol in the food (‘Low VMC’). In the LYD-fed larvae, wg expression in muscles is higher than in muscles in the HYD-fed larvae; secreted Wg is bound by receptors Ror and Fz2 in C4da neurons, which in turn hyperactivate Akt signaling, thereby promoting dendrite branching. In the C4da neurons, other receptors (e.g. InR or Alk) upstream of Akt and intracellular components of Wnt signaling (‘Other factors’ such as Dsh and Bsk) might also contribute to the hyperarborization phenotype. The cellular response of C4da neurons is associated with a whole-animal level response (blunted light avoidance behavior). In the HYD-fed larvae, wg expression is suppressed partly by Upd2-Hop-Stat92E signaling and partly by an abundant VMC-mediated unknown molecular mechanism (red T bar and ‘?’). See Results and Discussion for details.
Author response image 1
Author response image 2
Tables
Appendix 1—key resources table
| Reagent type (species) or resource | Designation | Source or reference | Identifiers | Additional information |
|---|---|---|---|---|
| genetic reagent (Drosophila melanogaster) | ppk-GAL4 UAS-mCD8:GFP | Grueber et al., 2007 (https://doi.org/10.1242/dev.02666) | N/A | |
| genetic reagent (D. melanogaster) | Gr28b.c-GAL4 UAS-mCD8:GFP | Xiang et al., 2010 (https://doi.org/10.1038/nature09576) | N/A | |
| genetic reagent (D. melanogaster) | ppk-CD4-tdGFP1b | Han et al., 2011 (https://doi.org/10.1073/pnas.1106386108) | N/A | |
| genetic reagent (D. melanogaster) | ppk-CD4-tdGFP8 | Han et al., 2011 (https://doi.org/10.1073/pnas.1106386108) | N/A | |
| genetic reagent (D. melanogaster) | ppk-CD4-tdTom4a | Han et al., 2011 (https://doi.org/10.1073/pnas.1106386108) | N/A | |
| genetic reagent (D. melanogaster) | Ror4 | Ripp et al., 2018 (https://doi.org/10.1242/bio.033001) | N/A | |
| genetic reagent (D. melanogaster) | ppk-GAL4 | Bloomington Drosophila Stock Center | Stock #: 32079 | |
| genetic reagent (D. melanogaster) | Mhc-GAL4 | Schuster and Davis, 1996 (https://doi.org/10.1016/s0896-6273(00)80,197x) | N/A | |
| genetic reagent (D. melanogaster) | Cg-GAL4 | Bloomington Drosophila Stock Center | Stock #: 7011 | |
| genetic reagent (D. melanogaster) | apts78j wg1 | KYOTO Stock Center | Stock #: 107069 | |
| genetic reagent (D. melanogaster) | wgl-8 cn1 bw1 speck1 | KYOTO Stock Center | Stock #: 107019 | |
| genetic reagent (D. melanogaster) | wg-GAL4 | Bloomington Drosophila Stock Center | Stock #: 83627 | |
| genetic reagent (D. melanogaster) | UAS-RedStinger | Bloomington Drosophila Stock Center | Stock #: 8547 | |
| genetic reagent (D. melanogaster) | UAS-Akt RNAi (BL33615) | Bloomington Drosophila Stock Center | Stock #: 33615 | |
| genetic reagent (D. melanogaster) | UAS-Akt RNAi (v2902) | Vienna Drosophila Resource Center | Stock #: 2902 | |
| genetic reagent (D. melanogaster) | UAS-Ror RNAi | National Institute of Genetics | Stock #: 4926 R-1 | |
| genetic reagent (D. melanogaster) | UAS-wg RNAi | Vienna Drosophila Resource Center | Stock #: 6692 | |
| genetic reagent (D. melanogaster) | UAS-Stat92E RNAi (BL33637) | Bloomington Drosophila Stock Center | Stock #: 33637 | |
| genetic reagent (D. melanogaster) | UAS-hop RNAi | Bloomington Drosophila Stock Center | Stock #: 32966 | |
| genetic reagent (D. melanogaster) | UAS-upd2 RNAi (5988 R-1) | National Institute of Genetics | Stock #: 5988 R-1 | |
| genetic reagent (D. melanogaster) | UAS-hop | Bloomington Drosophila Stock Center | Stock #: 79033 | |
| genetic reagent (D. melanogaster) | UAS-myrAkt | Bloomington Drosophila Stock Center | Stock #: 50758 | |
| genetic reagent (D. melanogaster) | UAS-wg.H.T:HA1 | KYOTO Stock Center | Stock #: 108488 | |
| genetic reagent (D. melanogaster) | 10XSTAT92E-GFP | Bloomington Drosophila Stock Center | Stock #: 26197 | |
| genetic reagent (D. melanogaster) | UAS-InR RNAi (BL31594) | Bloomington Drosophila Stock Center | Stock #: 31594 | |
| genetic reagent (D. melanogaster) | UAS-InR RNAi (BL51518) | Bloomington Drosophila Stock Center | Stock #: 51518 | |
| genetic reagent (D. melanogaster) | UAS-grnd RNAi | Vienna Drosophila Resource Center | Stock #: 43454 | |
| genetic reagent (D. melanogaster) | UAS-wgn RNAi | Vienna Drosophila Resource Center | Stock #: 9152 | |
| genetic reagent (D. melanogaster) | UAS-mth RNAi | Vienna Drosophila Resource Center | Stock #: 102303 | |
| genetic reagent (D. melanogaster) | UAS-babo RNAi | Bloomington Drosophila Stock Center | Stock #: 25933 | |
| genetic reagent (D. melanogaster) | UAS-Tor.TED | Bloomington Drosophila Stock Center | Stock #: 7013 | |
| genetic reagent (D. melanogaster) | UAS-S6k.KQ | Bloomington Drosophila Stock Center | Stock #: 6911 | |
| genetic reagent (D. melanogaster) | UAS-Tif-IA RNAi | Vienna Drosophila Resource Center | Stock #: 20336 | |
| genetic reagent (D. melanogaster) | UAS-Thor RNAi | Vienna Drosophila Resource Center | Stock #: 35439 | |
| genetic reagent (D. melanogaster) | UAS-foxo RNAi | Bloomington Drosophila Stock Center | Stock #: 32427 | |
| genetic reagent (D. melanogaster) | UAS-Alk RNAi (v11446) | Vienna Drosophila Resource Center | Stock #: 11446 | |
| genetic reagent (D. melanogaster) | UAS-Alk RNAi (BL107083) | Vienna Drosophila Resource Center | Stock #: 107083 | |
| genetic reagent (D. melanogaster) | mef2-GAL4 | Bloomington Drosophila Stock Center | Stock #: 27390 | |
| genetic reagent (D. melanogaster) | R38F11-GAL4 | Bloomington Drosophila Stock Center | Stock #: 50014 | |
| genetic reagent (D. melanogaster) | UAS-fz RNAi | Vienna Drosophila Resource Center | Stock #: 43075 | |
| genetic reagent (D. melanogaster) | UAS-fz2 RNAi | National Institute of Genetics | Stock #: 9739 R-1 | |
| genetic reagent (D. melanogaster) | “GAL45-40 UAS-Venus:pm SOP-FLP#42; tubPGal80 FRT2A” | KYOTO Stock Center | Stock #: 109950 | |
| genetic reagent (D. melanogaster) | “w*; FRT2A” | KYOTO Stock Center | Stock #: 106623 | |
| genetic reagent (D. melanogaster) | “y w hs-flp; fz2C2 FRT2A” | Chen and Struhl, 1999 (https://doi.org/10.1242/dev.126.23.5441) | N/A | |
| genetic reagent (D. melanogaster) | UAS-dsh RNAi | Vienna Drosophila Resource Center | Stock #: 101525 | |
| genetic reagent (D. melanogaster) | UAS-bsk.DN | Bloomington Drosophila Stock Center | Stock #: 6409 | |
| genetic reagent (D. melanogaster) | UAS-DAAM RNAi | Vienna Drosophila Resource Center | Stock #: 24885 | |
| genetic reagent (D. melanogaster) | UAS-arm RNAi | Vienna Drosophila Resource Center | Stock #: 7767 | |
| genetic reagent (D. melanogaster) | UAS-norpA RNAi | Bloomington Drosophila Stock Center | Stock #: 31113 | |
| genetic reagent (D. melanogaster) | UAS-Axn RNAi | Bloomington Drosophila Stock Center | Stock #: 31703 | |
| genetic reagent (D. melanogaster) | UAS-Stat92E RNAi (BL31318) | Bloomington Drosophila Stock Center | Stock #: 31318 | |
| genetic reagent (D. melanogaster) | UAS-dome RNAi (v106071) | Vienna Drosophila Resource Center | Stock #: 106071 | |
| genetic reagent (D. melanogaster) | UAS-dome RNAi (BL32860) | Bloomington Drosophila Stock Center | Stock #: 32860 | |
| genetic reagent (D. melanogaster) | UAS-dome RNAi (BL34618) | Bloomington Drosophila Stock Center | Stock #: 34618 | |
| genetic reagent (D. melanogaster) | UAS-upd RNAi (BL33680) | Bloomington Drosophila Stock Center | Stock #: 33680 | |
| genetic reagent (D. melanogaster) | UAS-upd RNAi (v3282) | Vienna Drosophila Resource Center | Stock #: 3282 | |
| genetic reagent (D. melanogaster) | UAS-upd2 RNAi (BL33949) | Bloomington Drosophila Stock Center | Stock #: 33949 | |
| genetic reagent (D. melanogaster) | UAS-upd3 RNAi (BL32859) | Bloomington Drosophila Stock Center | Stock #: 32859 | |
| genetic reagent (D. melanogaster) | UAS-upd3 RNAi (BL28575) | Bloomington Drosophila Stock Center | Stock #: 28575 | |
| genetic reagent (D. melanogaster) | rn-GAL4 | St Pierre et al., 2002 (https://doi.org/10.1242/dev.129.5.1273) | N/A | |
| genetic reagent (D. melanogaster) | UAS-dilp8 | Colombani et al., 2012 (https://doi.org/10.1126/science.1216689) | N/A | |
| genetic reagent (D. melanogaster) | UAS-htl RNAi (v6692) | Vienna Drosophila Resource Center | Stock #: 6692 | |
| genetic reagent (D. melanogaster) | UAS-htl RNAi (BL35024) | Bloomington Drosophila Stock Center | Stock #: 35024 | |
| genetic reagent (D. melanogaster) | UAS-Egfr RNAi | Vienna Drosophila Resource Center | Stock #: 43267 | |
| genetic reagent (D. melanogaster) | UAS-Pvr RNAi | Vienna Drosophila Resource Center | Stock #: 13502 | |
| genetic reagent (D. melanogaster) | UAS-Ddr RNAi | Vienna Drosophila Resource Center | Stock #: 29720 | |
| genetic reagent (D. melanogaster) | UAS-dnt RNAi | National Institute of Genetics | Stock #: 17,559 R-3 | |
| genetic reagent (D. melanogaster) | UAS-drl RNAi | Bloomington Drosophila Stock Center | Stock #: 29602 | |
| genetic reagent (D. melanogaster) | UAS-Eph RNAi | Bloomington Drosophila Stock Center | Stock #: 28511 | |
| genetic reagent (D. melanogaster) | UAS-otk RNAi | Bloomington Drosophila Stock Center | Stock #: 25790 | |
| genetic reagent (D. melanogaster) | UAS-sev RNAi | Bloomington Drosophila Stock Center | Stock #: 31274 | |
| genetic reagent (D. melanogaster) | UAS-btl RNAi | Vienna Drosophila Resource Center | Stock #: 110277 | |
| genetic reagent (D. melanogaster) | UAS-Cad96Ca RNAi | Vienna Drosophila Resource Center | Stock #: 1089 | |
| genetic reagent (D. melanogaster) | UAS-CG10702 RNAi | Vienna Drosophila Resource Center | Stock #: 27052 | |
| genetic reagent (D. melanogaster) | UAS-Drl-2 RNAi | Vienna Drosophila Resource Center | Stock #: 40484 | |
| genetic reagent (D. melanogaster) | UAS-Nrk RNAi | Vienna Drosophila Resource Center | Stock #: 9653 | |
| genetic reagent (D. melanogaster) | UAS-Ret RNAi | Vienna Drosophila Resource Center | Stock #: 107648 | |
| genetic reagent (D. melanogaster) | UAS-tor RNAi | Vienna Drosophila Resource Center | Stock #: 36280 | |
| genetic reagent (D. melanogaster) | UAS-Tie RNAi | Vienna Drosophila Resource Center | Stock #: 26879 | |
| genetic reagent (D. melanogaster) | Gal419-12 | Xiang et al., 2010 (https://doi.org/10.1038/nature09576) | N/A | |
| antibody | anti-Wg (Mouse monoclonal) | Developmental Studies Hybridoma Bank | Cat# 4D4, RRID: AB_528512 | IF (1:15) |
| antibody | anti-Futch (Mouse monoclonal) | Developmental Studies Hybridoma Bank | Cat# 22C10, RRID: AB_528403 | IF (1:20) |
| antibody | anti-phospho-Akt (Rabbit polyclonal) | Cell Signaling | Cat# 9271 S | IF (1:100) |
| antibody | anti-DsRed (Rabbit polyclonal) | Clontech | Cat# 632496 | IF (1:250) |
| antibody | anti-Mouse IgG Alexa Fluor 488 (Goat polyclonal) | Invitrogen | Cat# A11029 | IF (1:1000) |
| antibody | anti-Rabbit IgG Alexa Fluor 488 (Goat polyclonal) | Invitrogen | Cat# A11034 | IF (1:1000) |
| antibody | anti-Mouse IgG Alexa Fluor 546 (Goat polyclonal) | Invitrogen | Cat# A11030 | IF (1:1000) |
| chemical compound, drug | Brewer’s Yeast | MPBio | Cat# 2903312 | |
| chemical compound, drug | Yeast extract | Sigma-Aldrich Fluka | Cat# 70161 | |
| chemical compound, drug | Peptone from casein, enzymatic digest | Sigma-Aldrich Fluka | Cat# 82303 | |
| chemical compound, drug | Glucose | Wako | Cat# 049–31165 | |
| chemical compound, drug | Sucrose | Wako | Cat# 196–00015 | |
| chemical compound, drug | MgSO4 | Wako | Cat# 132–00435 | |
| chemical compound, drug | CaCl2 | Wako | Cat# 031–00435 | |
| chemical compound, drug | agar | Matsuki Kanten | N/A | |
| chemical compound, drug | Agar Purified, powder | Nacalai Tesque | Cat# 01162–15 | |
| chemical compound, drug | propionic acid | Nacalai Tesque | Cat# 29018–55 | |
| chemical compound, drug | butyl p-hydroxybenzoate | Nacalai Tesque | Cat# 06327–02 | |
| chemical compound, drug | 50 x MEM Essential Amino Acids Solution | Wako | Cat# 132–15641 | |
| chemical compound, drug | BSA | Nacalai Tesque | Cat# 01863–77 | |
| chemical compound, drug | Alexa Fluor 488 Phalloidin | Invitrogen | Cat# A12379 | |
| chemical compound, drug | FluorSave Reagent | Calbiochem | Cat# 345789 | |
| chemical compound, drug | Formalin | Nacalai Tesque | Cat# 16222–65 | |
| chemical compound, drug | DAPI | Nacalai Tesque | Cat# 19178–91 | |
| software, algorithm | DeTerm | Kanaoka et al., 2019 ( https://doi.org/10.1111/gtc.12700) | N/A | |
| software, algorithm | R | R Core Team | RRID:SCR_001905 | |
| software, algorithm | Fiji | NIH | RRID:SCR_002285 | |
| software, algorithm | Photoshop | Adobe | RRID:SCR_014199 | |
| other | LED desk light | OHM | Cat# ODS-LKL6-W | This LED light was used in Light/dark choice assay |
Additional files
-
Supplementary file 1
Compositions of the experimental diets.
- https://cdn.elifesciences.org/articles/79461/elife-79461-supp1-v1.xlsx
-
Supplementary file 2
Summary of the RTK knockdown screening.
- https://cdn.elifesciences.org/articles/79461/elife-79461-supp2-v1.xlsx
-
Supplementary file 3
RNA-seq data of larval whole bodies at the wandering third-instar stage on HYD or LYD.
(A) List of Differentially expressed genes between HYD and LYD in whole larval bodies at the wandering third-instar stage (adjusted P value < 0.05). (B and C) List of functional annotation clusters that were significantly enriched (enrichment score ≥ 1.3) in genes highly expressed on HYD rather than on LYD (B) or genes highly 1385 expressed on LYD rather than on HYD (C).
- https://cdn.elifesciences.org/articles/79461/elife-79461-supp3-v1.xlsx
-
Supplementary file 4
Statistical details of experiments and a list of genotypes.
- https://cdn.elifesciences.org/articles/79461/elife-79461-supp4-v1.xlsx
-
MDAR checklist
- https://cdn.elifesciences.org/articles/79461/elife-79461-mdarchecklist1-v1.docx
Download links
A two-part list of links to download the article, or parts of the article, in various formats.
Downloads (link to download the article as PDF)
Open citations (links to open the citations from this article in various online reference manager services)
Cite this article (links to download the citations from this article in formats compatible with various reference manager tools)
Inter-organ Wingless/Ror/Akt signaling regulates nutrient-dependent hyperarborization of somatosensory neurons
eLife 12:e79461.
https://doi.org/10.7554/eLife.79461


