Observation of persister cell histories reveals diverse modes of survival in antibiotic persistence
- Research Center for Complex Systems Biology, The University of Tokyo, Japan
- Universal Biology Institute, The University of Tokyo, Japan
- Department of Basic Science, Graduate School of Arts and Sciences, The University of Tokyo, Japan
- Department of Neuropathology, Graduate School of Medicine, The University of Tokyo, Japan
- Department of Optical Imaging, Advanced Research Promotion Center, Tokushima University, Japan
- Department of Biology, New York University, United States
- Department of Physics, New York University, United States
Figures
Figure 1 with 4 supplements
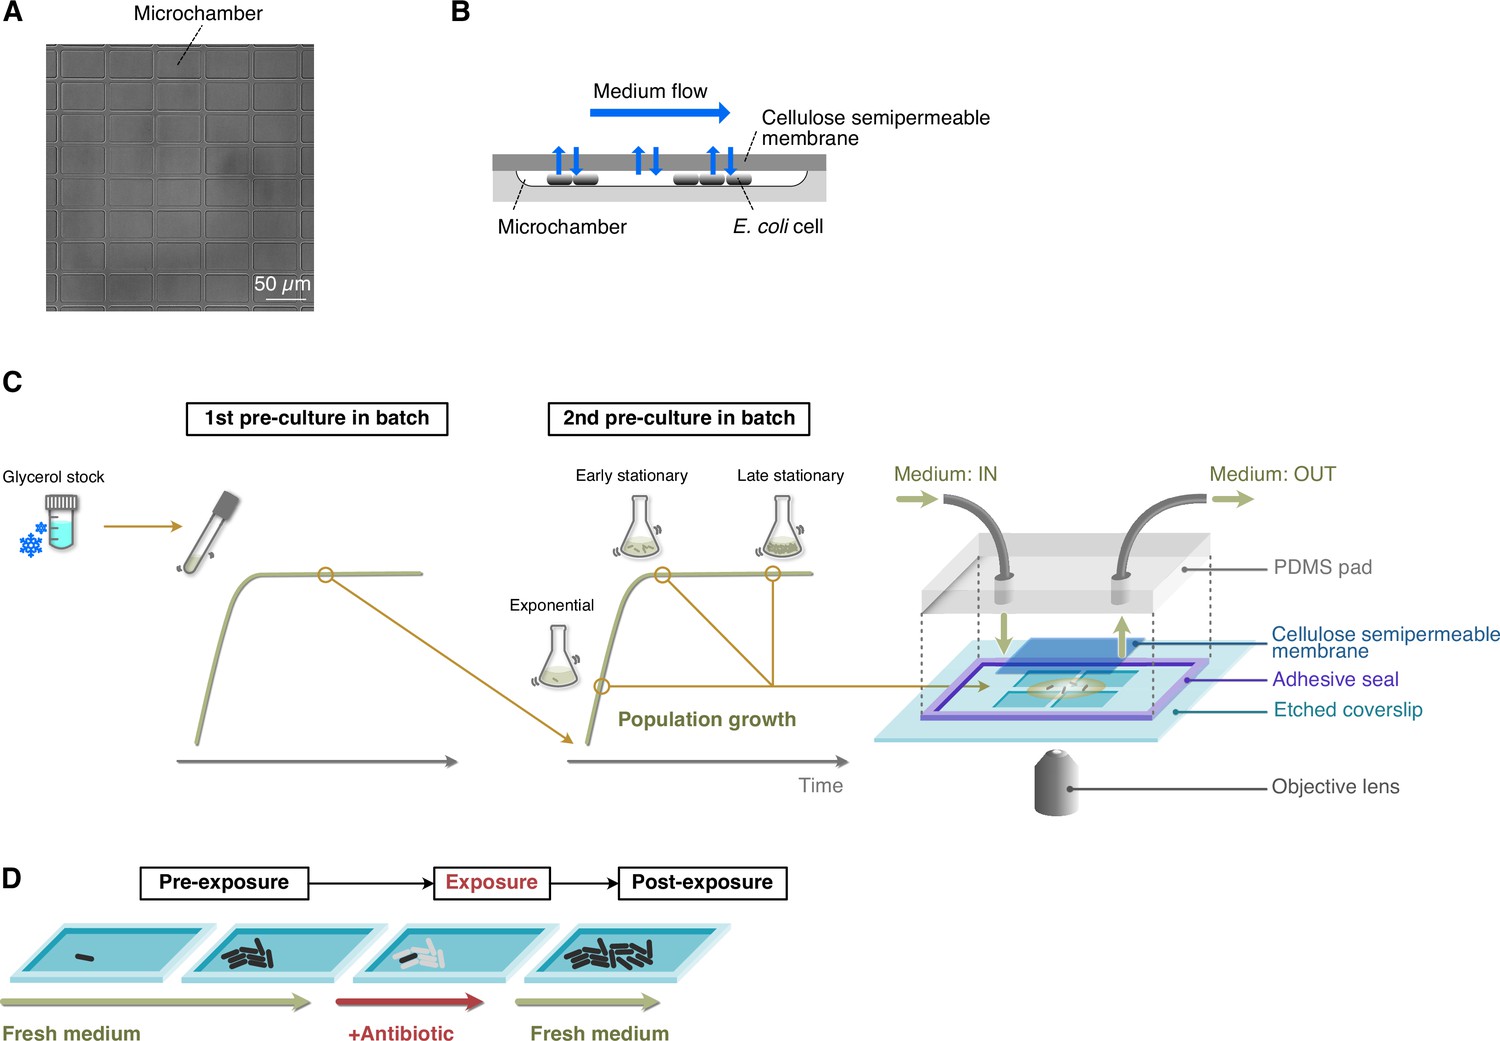
Experimental procedures for single-cell time-lapse measurements using the MCMA device.
(A) A micrograph of the microchamber array etched in a glass coverslip. (B) Schematic drawing of cell cultivation in the MCMA device. Cells are enclosed in the microchambers by a cellulose semipermeable membrane cover. A culture medium flows above the membrane. The medium in the microchambers is exchanged through diffusion across the membrane. Cells grow in a monolayer until they are thoroughly packed in the microchambers. (C) Loading E. coli cells in the MCMA device. E. coli cells from a glycerol stock were inoculated into a fresh medium and incubated overnight at 37°C with shaking (first pre-culture). The first pre-culture was diluted to the pre-determined cell density in the fresh medium, and incubated again at 37°C with shaking (second pre-culture). We sampled cells from the second pre-culture at the pre-determined time points for each experiment (exponential phase, early stationary phase, and late stationary phase, see Figure 1—figure supplement 4). A suspension of E. coli cells sampled from the batch culture was placed on the microchamber array etched in a coverslip. Placing a semipermeable membrane on the cell suspension randomly seeds the cells in the microchambers. The semipermeable membrane tightly seals the microchambers via the biotin-streptavidin binding. A PDMS pad attached to the coverslip via an adhesive frame seal chamber allows medium perfusion. The scale of the microchambers is exaggerated in this diagram for an intuitive explanation. (D) Sequence of environmental conditions in time-lapse measurements. E. coli cells enclosed in the microchambers were first grown under the flow of fresh medium (pre-exposure period) and exposed to an antibiotic by switching the flowing medium to the antibiotic-containing medium (exposure period). After the pre-determined exposure period, the flowing medium was switched back to the antibiotic-free medium, and the surviving cells were allowed to proliferate again (post-exposure period).
Figure 1—figure supplement 1

Evaluation of the RpoS expression and the sensitivity to oxidative stress of the MF1 strain.
(A) Transition of RpoS-mCherry fluorescence levels of MF1 cells along the growth curve in LB. The top panel shows the growth curve of MF1 in LB measured by the optical density of the cell culture at 600 nm; the bottom panel shows the transition of RpoS-mCherry fluorescence levels represented as boxplots. The 1 h growth curve data point is missing due to a sample handling error during the measurement. The numbers of cells whose RpoS-mCherry fluorescence levels were measured are 113, 172, 344, 455, 3584, 371, 1140, 303, 530, 564, 564, 234, 459, and 682 from 0 to 24 h, respectively. (B) Transition of RpoS-mCherry fluorescence levels of MF1 cells along the growth curve in M9. The plots are displayed in the same way as in A. The numbers of cells whose RpoS-mCherry fluorescence levels were measured are 369, 476, 937, 1028, 776, 2064, 2379, 809, 204, 231, 569, 469, 775, 523, 575 from 0 to 24 h, respectively. (C) Survival rates of MG1655, MG1655 ΔrpoS, and MF1 exposed to an oxidative stress. E. coli cells of the three strains were exposed to 20 mM H2O2 for 20 min, and their survival rates were estimated by colony forming-unit assay. We repeated the test three times for each strain. The bar graph shows the average of the survival rates of the three experiments, and the dots show the survival rate of each experiment ( = 0.05 for MG1655 vs. MG1655 ΔrpoS, and = 0.05 for MG1655 vs. MF1, one-sided Wilcoxon rank sum test).
Figure 1—figure supplement 2
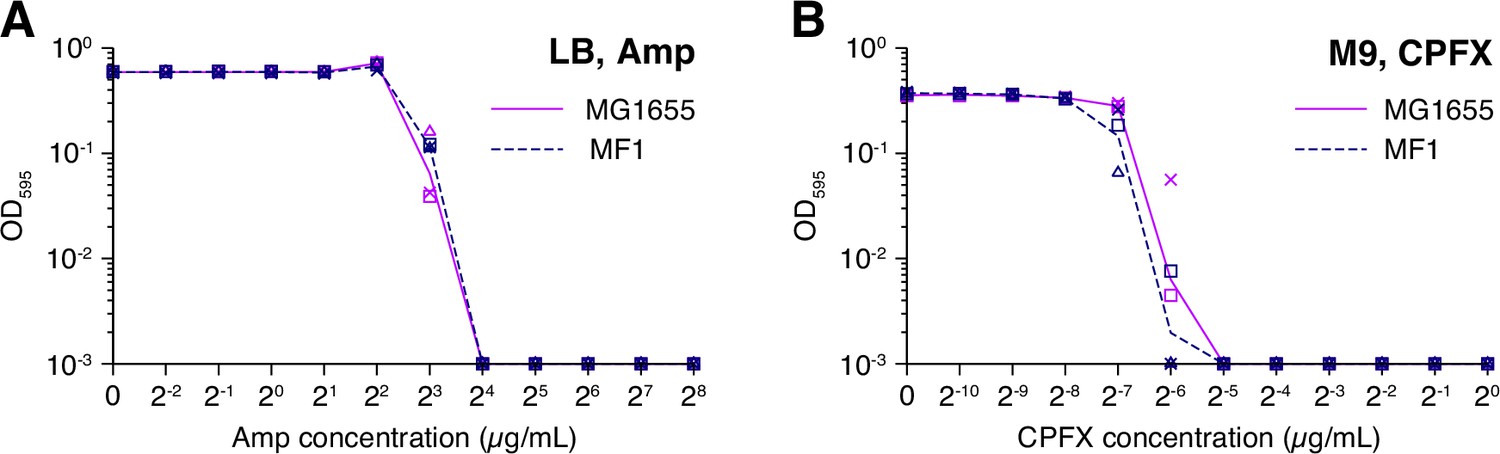
MIC tests.
(A) MIC test against Amp. The optical density at 595 nm of the E. coli cell cultures after the incubation of 23 h at 37°C in the LB media containing different concentrations of Amp (horizontal axis) is shown. Dark magenta is for the MG1655 strain, and navy is for the MF1 strain. The points (triangles, squares, and crosses) represent the results of three replicate experiments. The lines connect the geometric means of the replicates. The optical density values below 0.001 were plotted as 0.001 as they were indistinguishable from the fluctuation of background signals. (B) MIC test against CPFX. The color correspondences to the E. coli strains are the same as that in A. The cells were incubated in the M9 media containing different concentrations of CPFX (horizontal axis) in this test. We measured the optical density at 595 nm after the incubation of 23 h at 37°C.
Figure 1—figure supplement 3
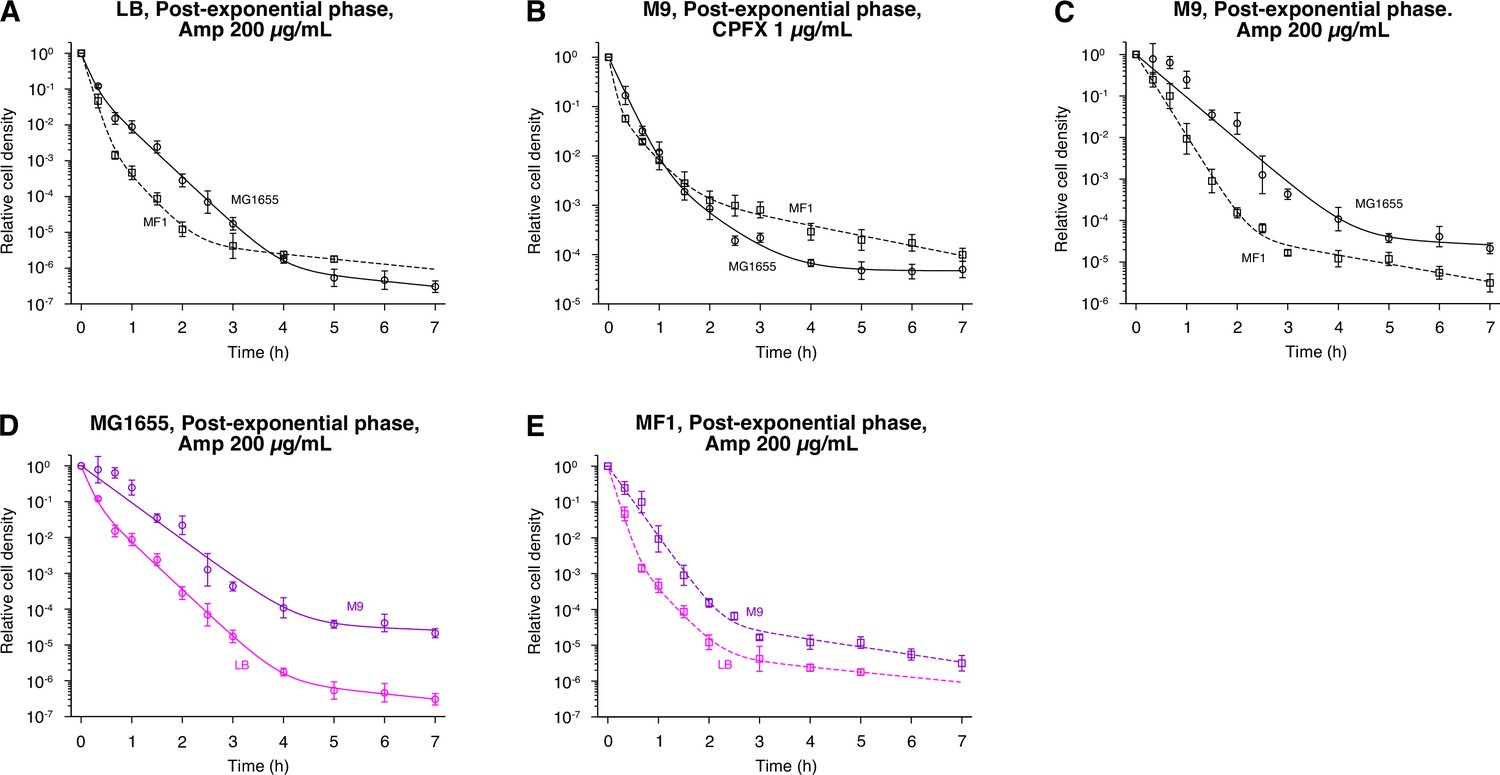
Comparison of the killing curves between MG1655 and MF1.
(A) Population killing curves of exponential phase cells in LB exposed to 200 µg/mL Amp. Circles for MG1655; and squares for MF1. Points and error bars represent means and standard errors of the logarithm of cell density among replicate experiments ( = 6 for MG1655 and = 3 for MF1). The solid and dashed lines represent the fitting of the triple exponential decay curves to the data: for MG1655; and for MF1, where is the relative cell density at time . We used the triphasic exponential decay instead of the biphasic exponential decay to fit the experimental data because it gave a better fit as judged by Aakaike’s Information Criterion (AIC; see Methods for the choice of fitting functions). (B) Population killing curves of exponential phase cells in M9 exposed to 1 µg/mL CPFX. Points and error bars represent means and standard errors of the logarithm of cell density among replicate experiments ( = 3 for MG1655, and = 4 for MF1). The lines represent the fitting of the triple exponential decay curves to the data: for MG1655; and for MF1. (C) Population killing curves of exponential phase cells in M9 exposed to 200 µg/mL Amp. Points and error bars represent means and standard errors of the logarithm of cell density among replicate experiments ( = 3 for both MG1655 and MF1). The lines represent the fitting of the double exponential decay curves to the data: for MG1655; and for MF1. (D) Comparison of population killing curves of MG1655 exposed to 200 µg/mL Amp between the LB and M9 conditions. The killing curves of MG1655 shown in A and C are compared. (E) Comparison of population killing curves of MF1 exposed to 200 µg/mL Amp between the LB and M9 conditions. The killing curves of MF1 shown in A and C are compared.
Figure 1—figure supplement 4
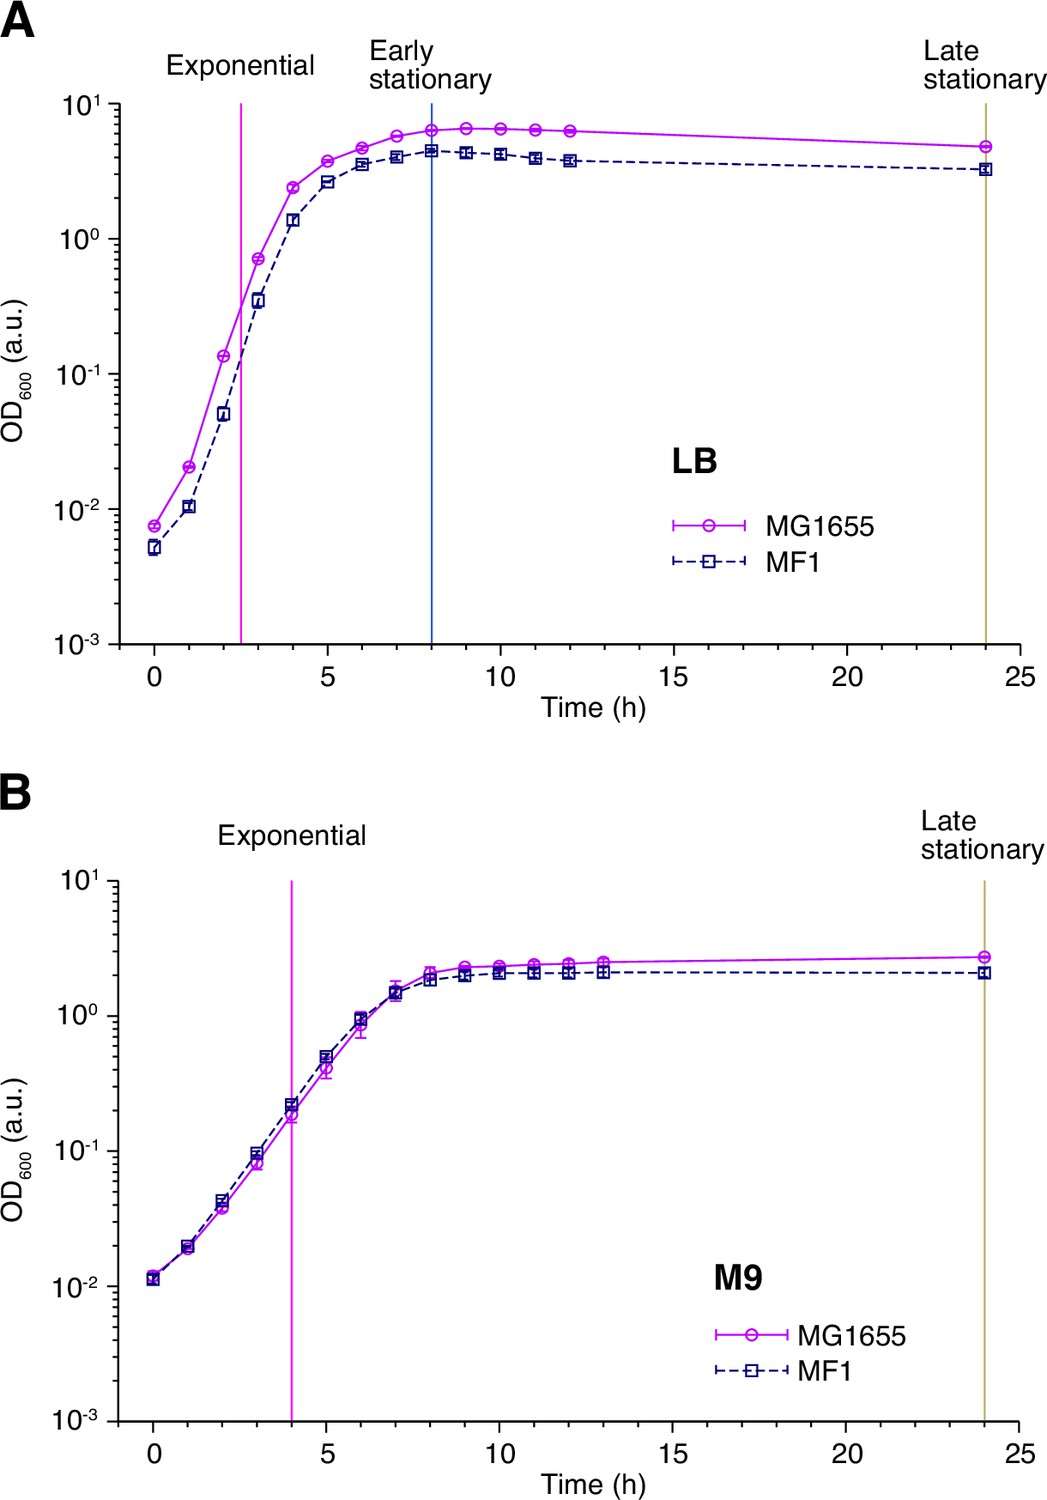
Population growth curves of MG1655 and MF1.
(A) Growth curves in LB medium. Optical density transitions of the cell cultures at 600 nm are shown. Points represent the geometric mean of replicate experiments ( = 4 for MG1655 and = 5 for MF1). Error bars represent the standard errors of the logarithm of the optical density, which are smaller than the point size. The vertical lines represent the time points at which we sampled the cell cultures for the single-cell measurements and the killing curve assay. The magenta, blue, and yellow dashed lines indicate the sampling time points for the post-exponential, post-early stationary, and post-late stationary phase conditions, respectively. (B) Growth curves in M9 medium. The data is plotted in the same way as in A. n = 3 for MG1655 and n = 5 for MF1. The vertical lines represent the time at which cells were sampled for the single-cell measurements and the killing curve assay.
Figure 2
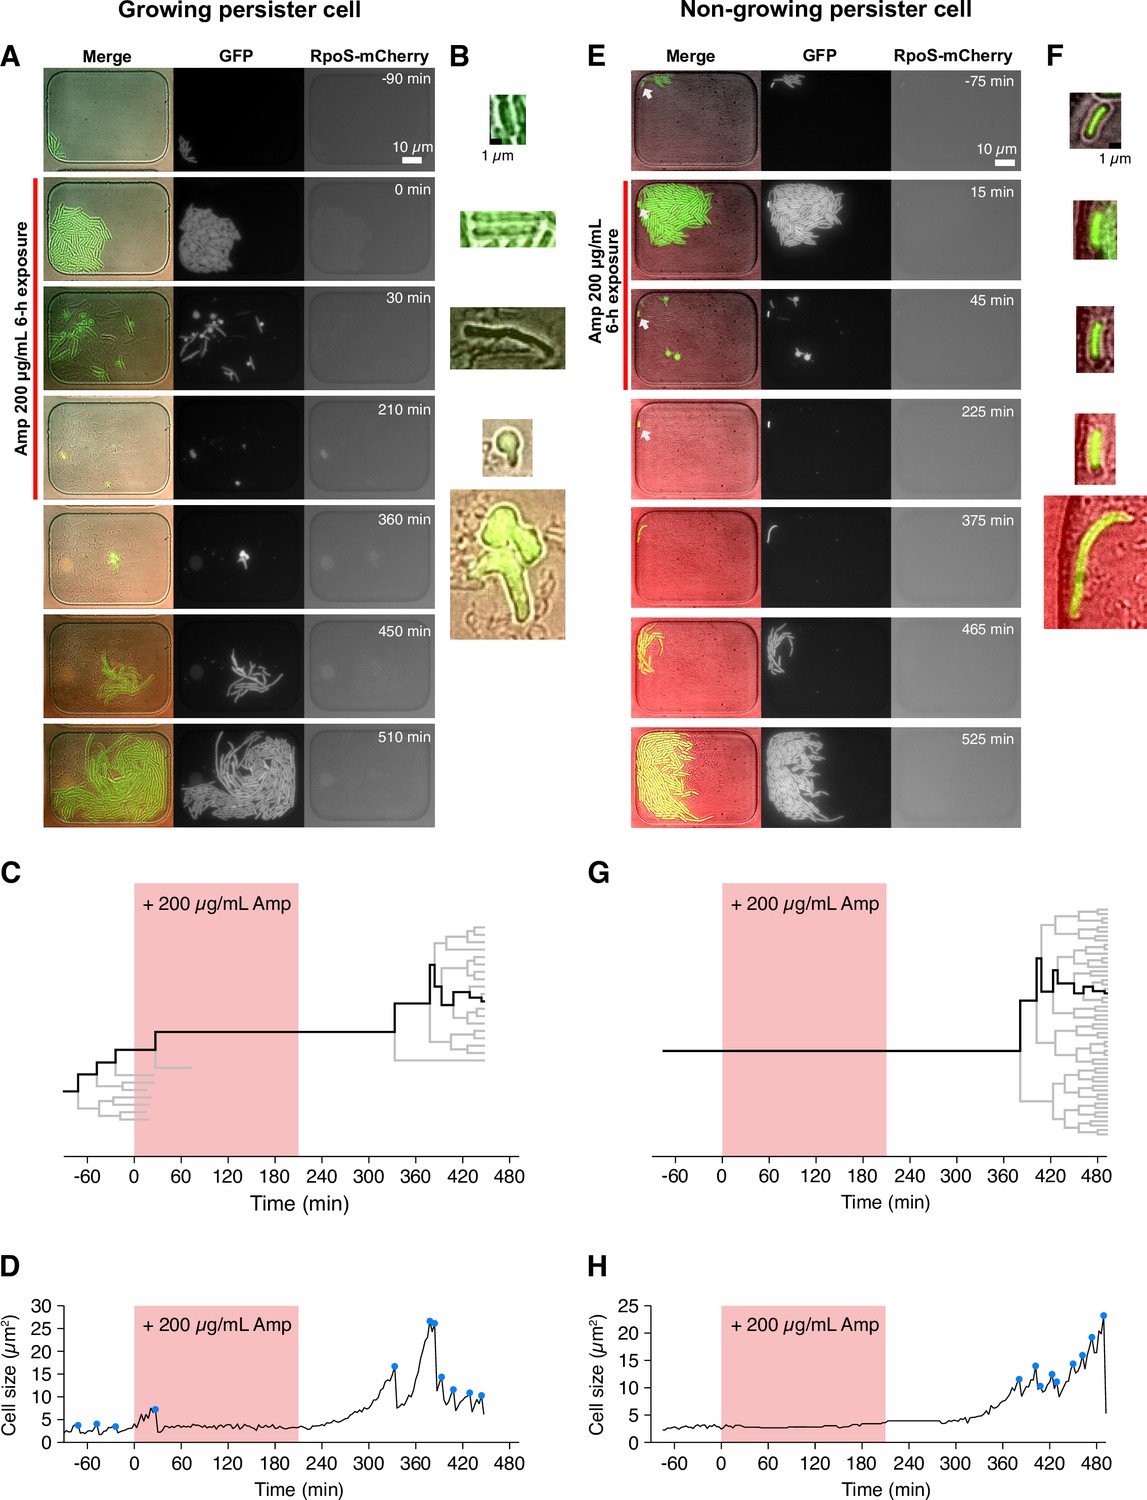
Detecting single-cell histories of persister cells using the MCMA device.
(A) Time-lapse images of a growing persister cell of MF1 against Amp in the post-exponential phase cell populations in LB. The right and middle image sequences show the RpoS-mCherry and GFP fluorescence images. The left image sequence shows the merged images of bright-field (grayscale), GFP (green), and RpoS-mCherry (red) channels. The red line to the left of the images indicates the images under Amp exposure. (B) Enlarged micrographs of the growing persister cell in A. (C) Single-cell lineage tree that produced the growing persister cell. The red background indicates the 3.5 h period of the 200 µg/mL Amp exposure. The bifurcations of the branches represent cell divisions. The endpoints of the branches under the Amp exposure represent cell lysis events. The thick black line indicates the cell whose cell size is shown in D. (D) Cell size transition of the growing persister cell. The blue dots indicate the points where cell divisions or cell body fissions occurred. (E) Time-lapse images of a non-growing persister cell. The correspondence of the image sequences to the acquisition channels is the same as in B. The white arrows indicate the non-growing cell that eventually proliferated after the Amp exposure. (F) Enlarged micrographs of the non-growing persistent cell in E. (G) Single-cell lineage tree that produced the non-growing persister. (H) Cell size transition of the non-growing persister cell indicated by the thick line in G.
Figure 3 with 1 supplement

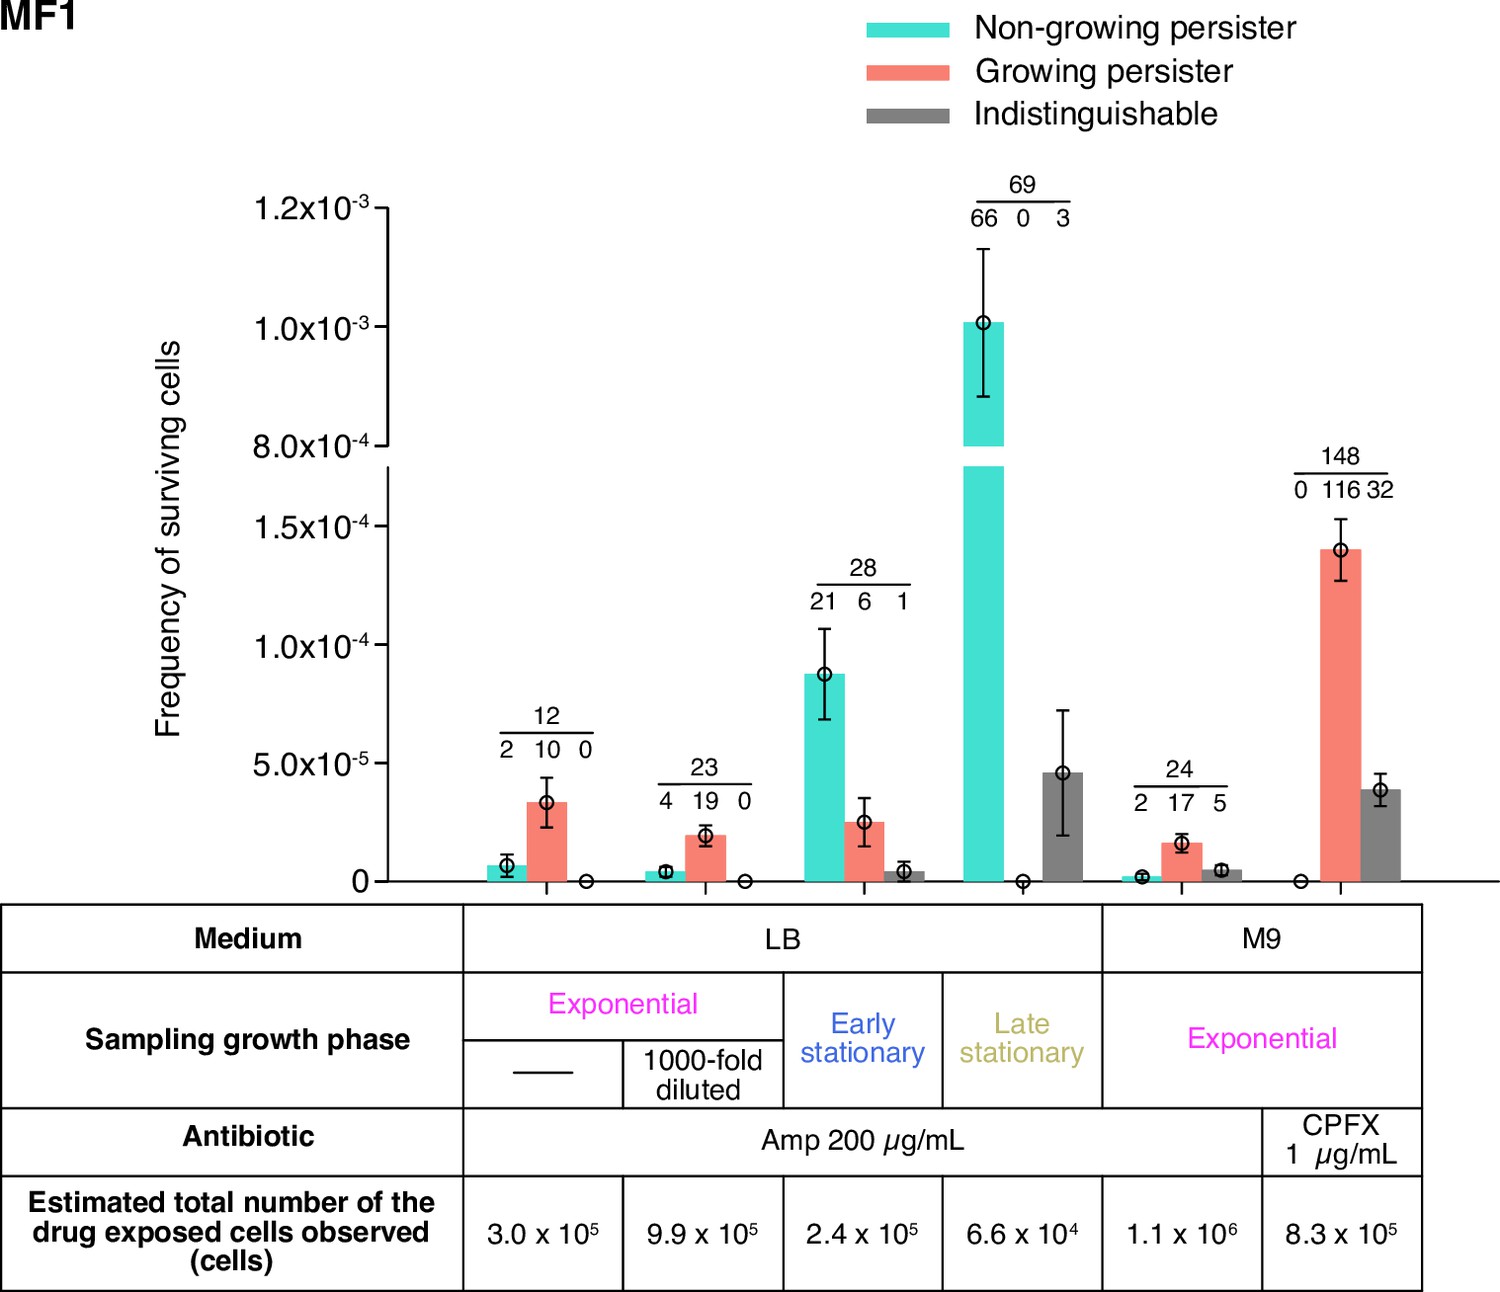
Fractions of growing and non-growing persisters of MG1655 against Amp and CPFX with different pre-exposure histories.
Green and orange bars represent the frequencies of non-growing and growing persisters in the cell populations detected in the time-lapse measurements of the MG1655 cells. Gray bars show the frequencies of persister cells whose pre-exposure growth traits were indistinguishable. Error bars represent binomial standard errors. The number of cells categorized into each mode is shown above the bar, and the total number of persister cells detected in the time-lapse measurements is shown above the horizontal line. The table shows the estimated total numbers of the drug-exposed cells observed in the time-lapse measurements.
Figure 3—figure supplement 1
Fractions of growing and non-growing persisters of MF1 against Amp and CPFX with different pre-exposure histories.
Green and orange bars represent the frequencies of non-growing and growing persisters in the cell populations detected in the time-lapse measurements of the MF1 cells. Gray bars show the frequencies of persister cells whose pre-exposure growth traits were indistinguishable. Error bars represent binomial standard errors. The number of cells categorized into each mode is shown above the bar, and the total number of persister cells detected in the time-lapse measurements is shown above the horizontal line. The table shows the estimated total numbers of the drug-exposed cells observed in the time-lapse measurements. Note that the duration of Amp exposure in LB in the single-cell measurements was 3.5 h for MF1 due to the earlier decay rate shift of the population killing curve than for MG1655 (Figure 1—figure supplement 3A).
Figure 4 with 2 supplements
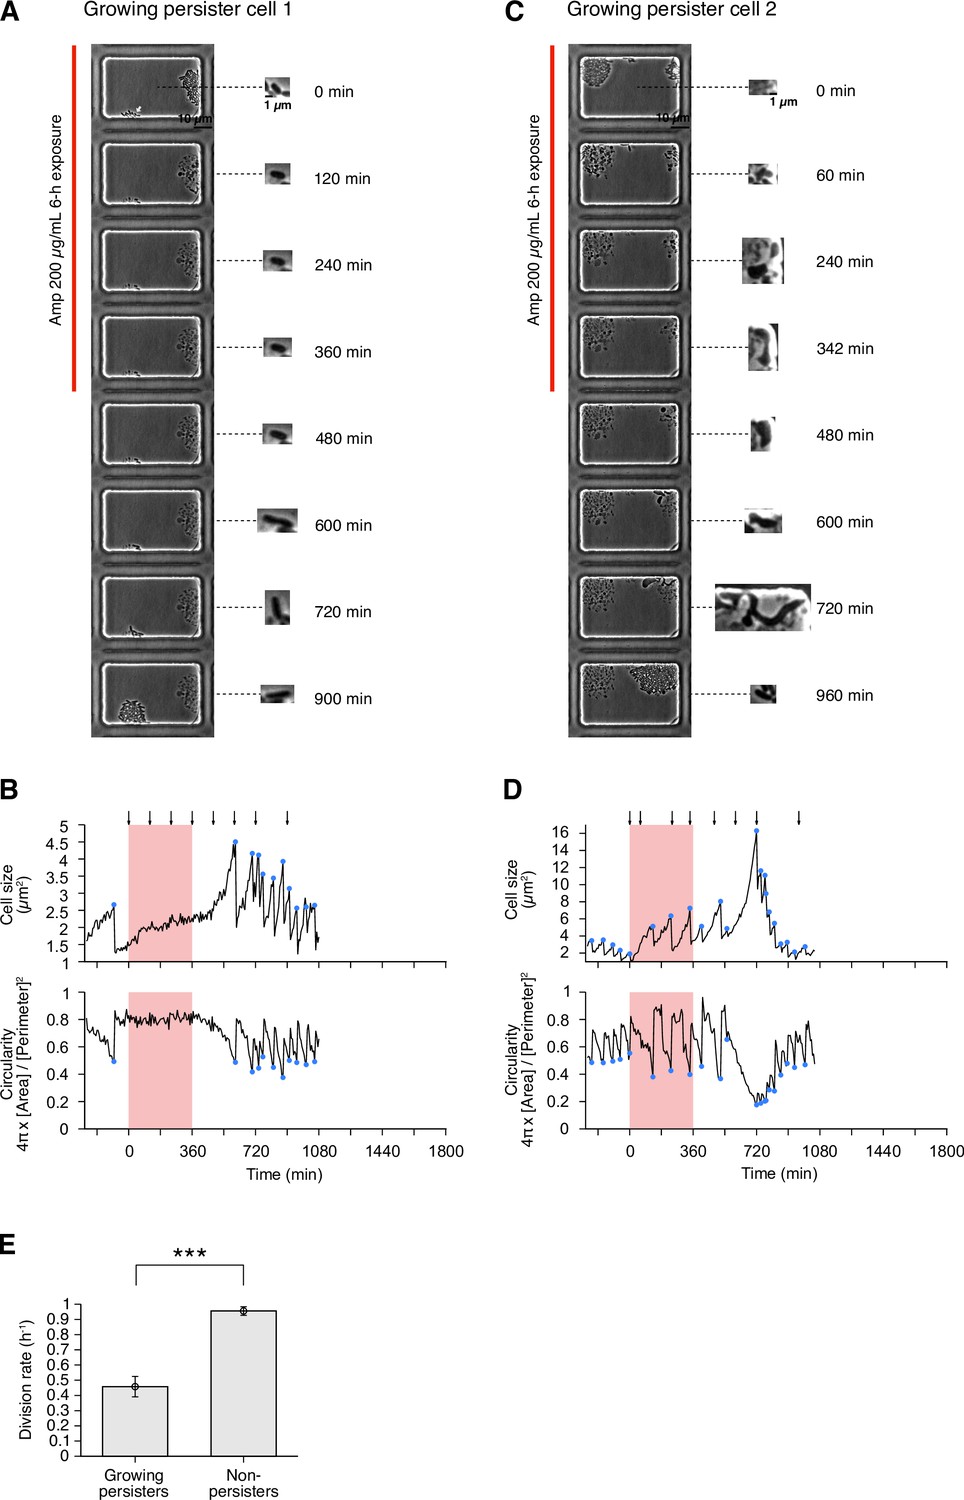
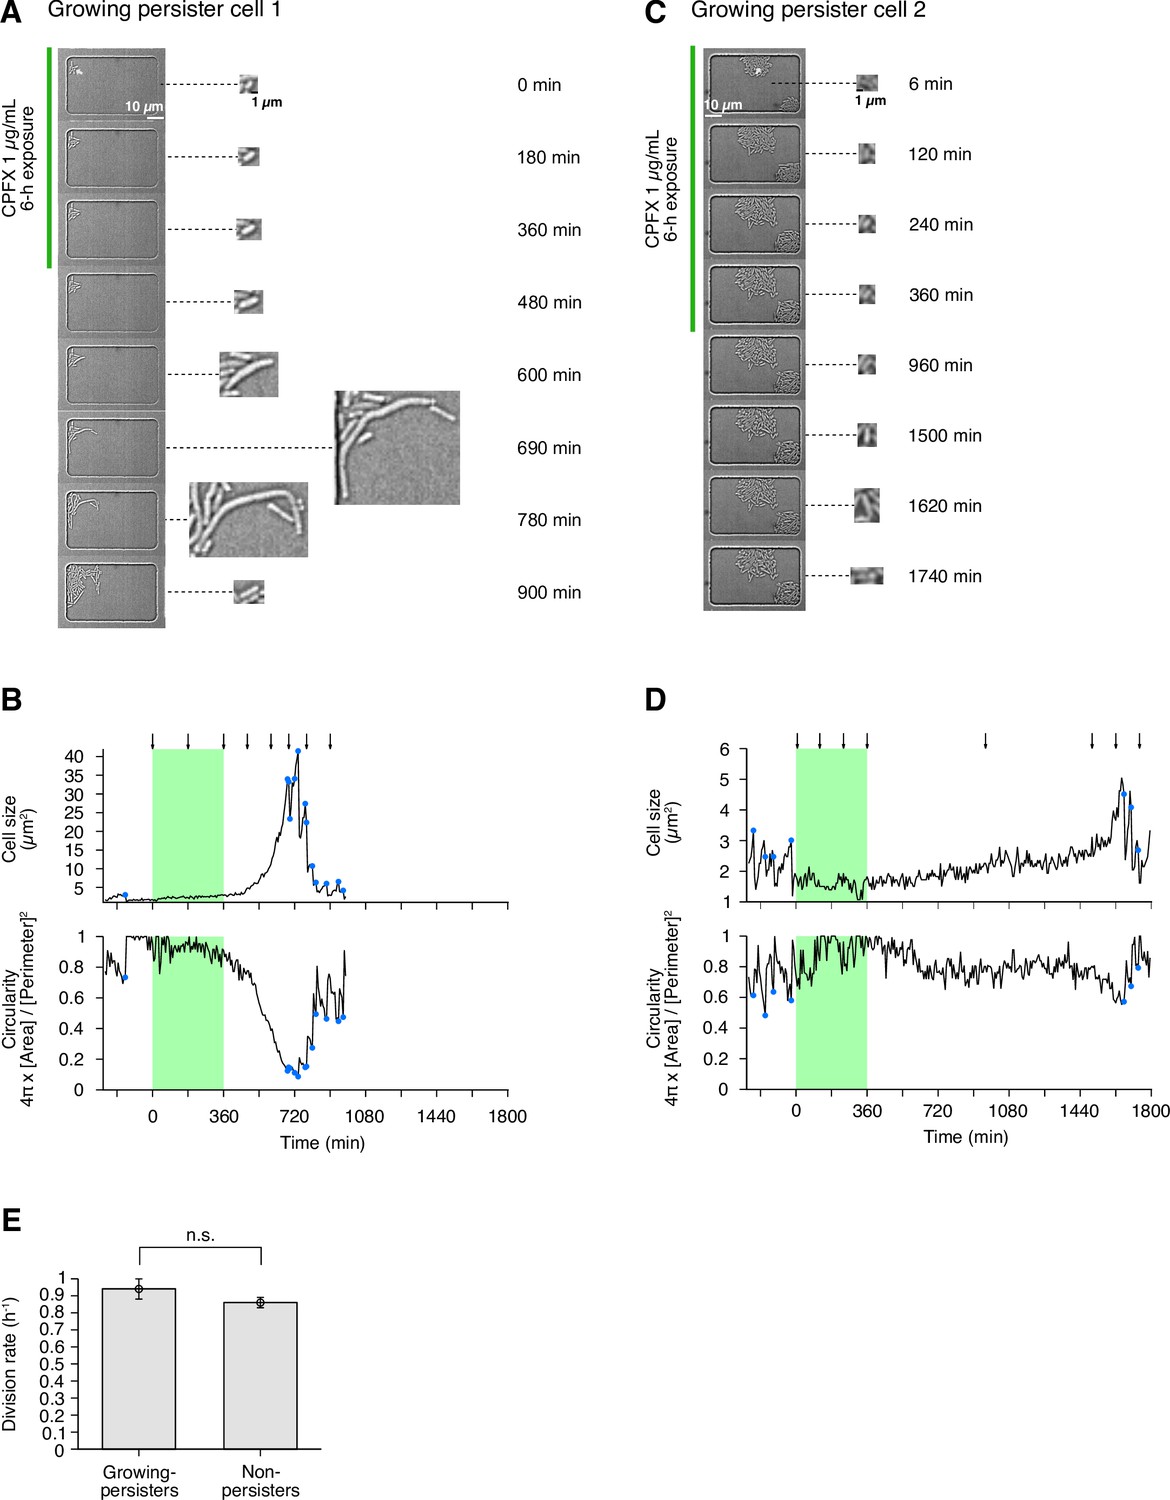
Persisters against Amp observed in the post-exponential phase cell populations of MG1655 in LB.
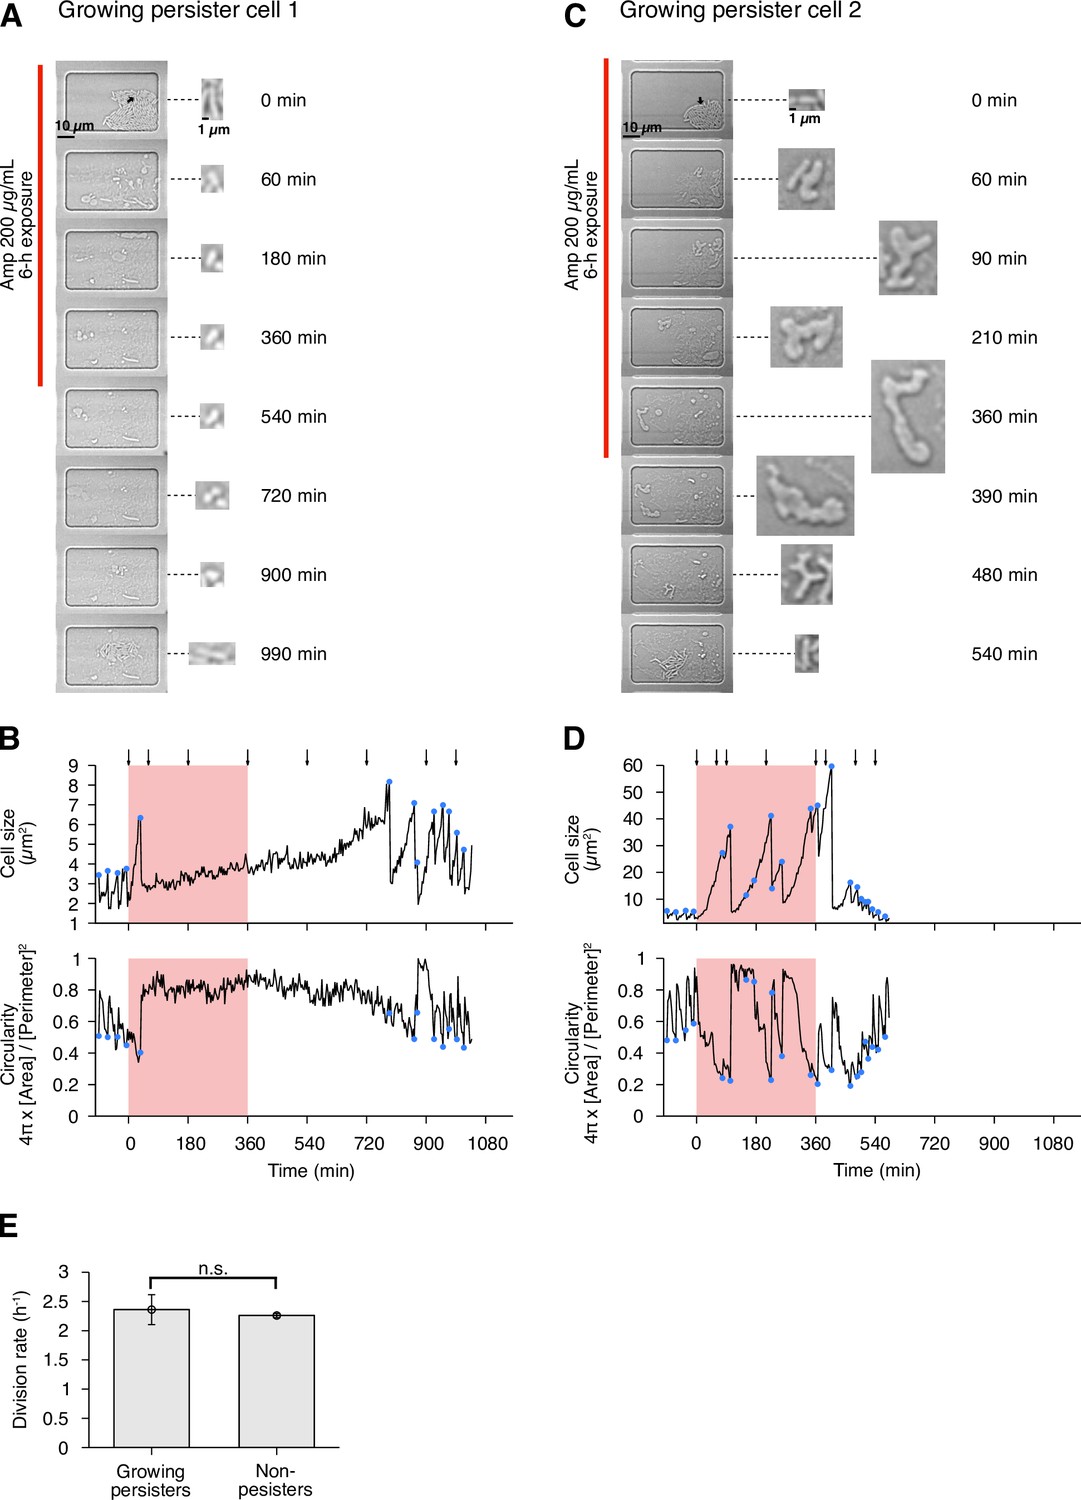
(A) Time-lapse images of a growing persister whose growth was suppressed during the exposure to 200 µg/mL Amp in LB medium. The left image sequences show the bright-field images. The right image sequences show the enlarged micrographs of the persister cell at each time point. The red line to the left of the images indicates the images under the Amp exposure. The black arrow indicates the growing persister cell. (B) Temporal changes in cell size (top graph) and cell shape circularity (bottom graph) of the growing persister cell shown in A. The red background indicates the 6-h period of the Amp exposure. The black arrows indicate the time points at which the enlarged micrographs in A were taken. The blue dots indicate the points where cell divisions or cell body fissions occurred. (C) Time-lapse images of a growing persister that continued to grow and divide during the Amp exposure. Images are displayed in the same way as in A. (D) Temporal changes in cell size (top graph) and cell shape circularity (bottom graph) of the growing persister shown in C. (E) Comparison of pre-exposure division rates between growing persisters ( = 6) and non-persisters ( = 204). Error bars represent standard errors. No significant difference in division rates was detected at the significance level of 0.05 ( = 0.74, Wilcoxon rank sum test).
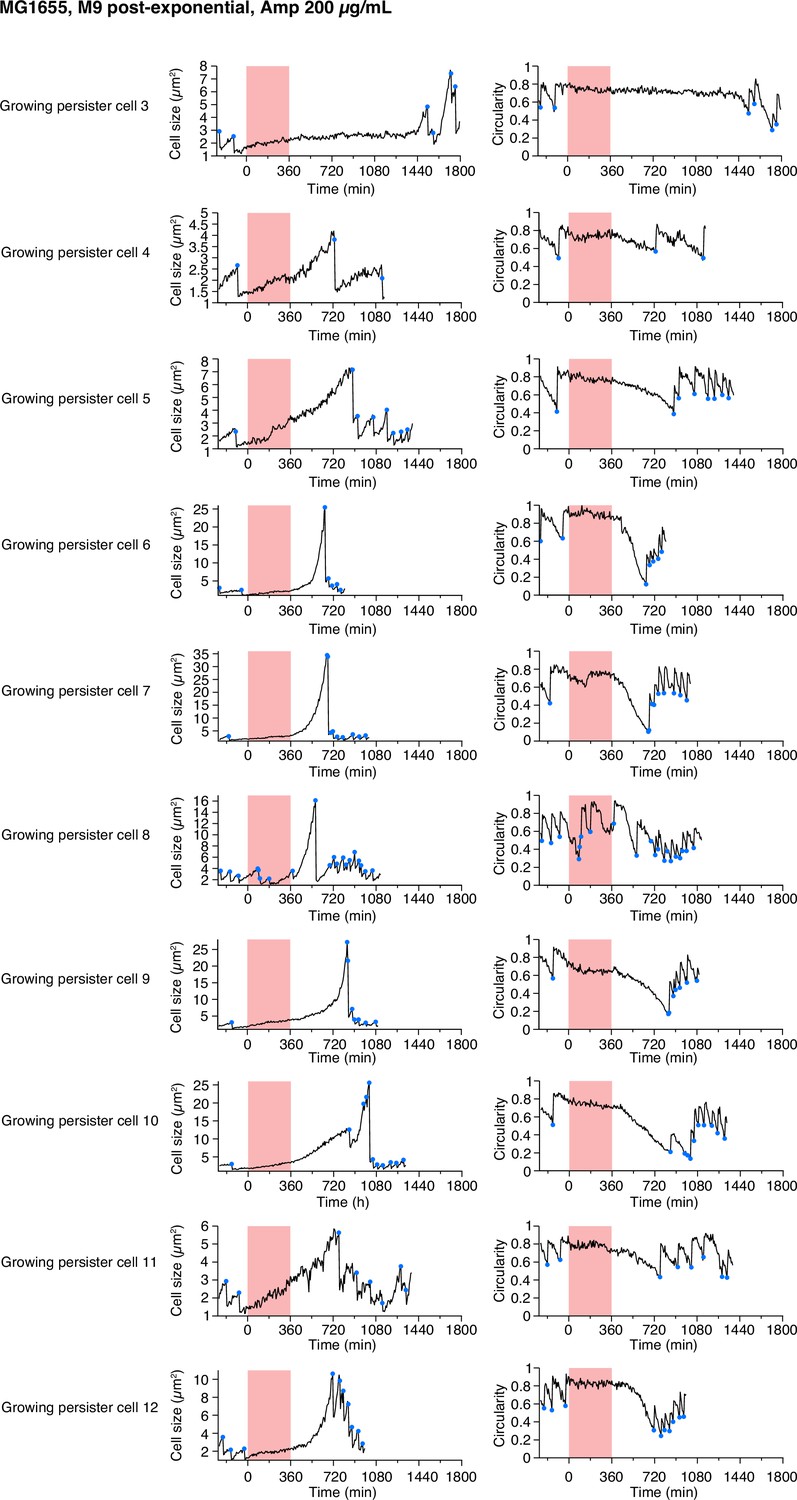
Figure 4—figure supplement 1
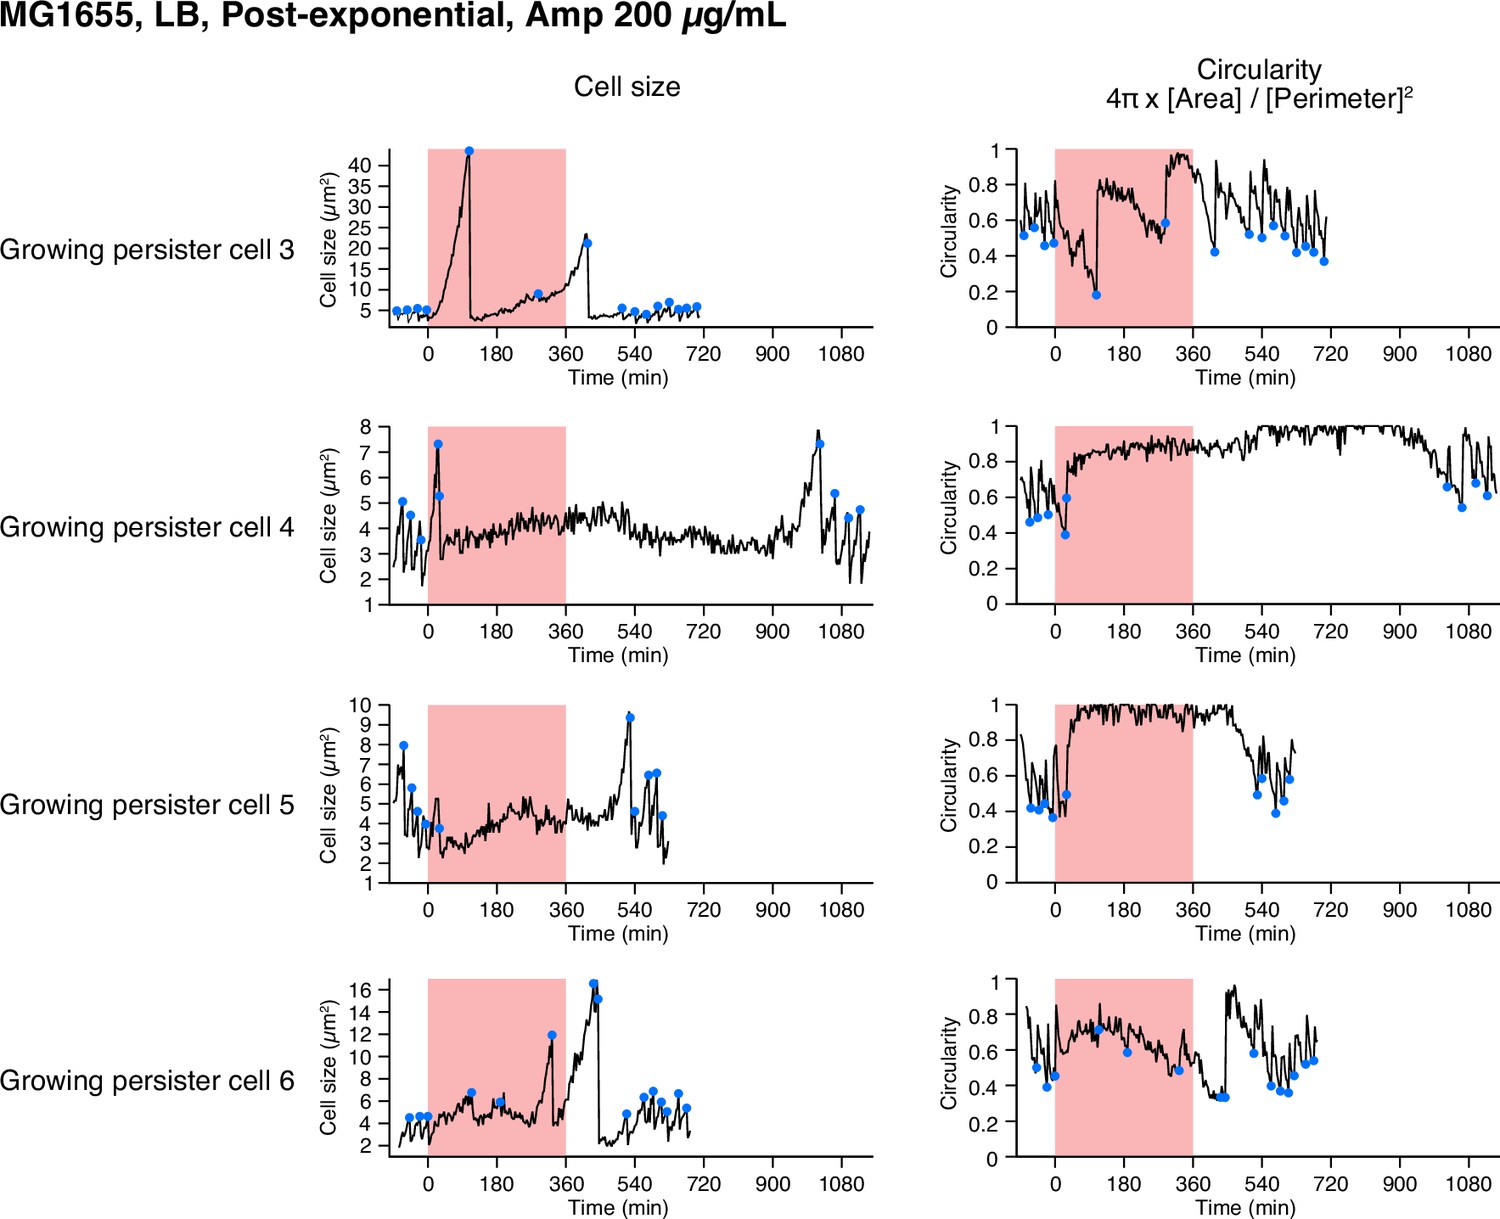
Single-cell dynamics of the MG1655 persisters against Amp in the post-exponential phase cell populations in LB.
Temporal changes in cell size (left) and cell shape circularity (right) of the other persisters not shown in Figure 4 are shown here. All persisters detected in this condition were growing persisters.
Figure 4—figure supplement 2

Single-cell dynamics of the MF1 persisters against Amp in the post-exponential phase cell populations in LB.
(A) Temporal changes in cell size (left) and cell shape circularity (right) of 7 out of 10 growing persisters and of 2 non-growing persisters detected in the post-exponential phase cell populations of MF1 exposed to Amp for 3.5 h. The dynamics of three growing persisters are not shown here due to the difficulty of tracking in part of the pre-exposure period. (B) Comparison of pre-exposure division rates between growing persisters and non-persisters of MF1. = 10 for growing persisters and = 77 for non-persisters. A significant difference in division rates was detected at the significance level of 0.05 ( = 0.011, Wilcoxon rank sum test).
Figure 5 with 1 supplement
Growing persisters against Amp observed in the post-exponential phase cell populations of MG1655 in M9.
(A) Time-lapse images of a growing persister whose growth was suppressed during the exposure to 200 µg/mL Amp in M9 medium. The left image sequences show the bright-field images. The right image sequences show the enlarged micrographs of the persister cell at each time point. The red line to the left of the images indicates the images under the Amp exposure. The white arrow indicates the growing persister cell. (B) Temporal changes in cell size (top graph) and cell shape circularity (bottom graph) of the growing persister cell shown in A. The red background indicates the 6-h period of the Amp exposure. The black arrows indicate the time points at which the enlarged micrographs in A were taken. The blue dots indicate the points where cell divisions or cell body fissions occurred. (C) Time-lapse images of a growing persister that continued to grow and divide during the Amp exposure. Images are displayed in the same way as in A. (D) Temporal changes in cell size (top graph) and cell shape circularity (bottom graph) of the growing persister shown in C. (E) Comparison of pre-exposure division rates between growing persisters ( = 14) and non-persisters ( = 106). Error bars represent standard errors. Due to the difficulty in counting the number of pre-exposure cell divisions, two growing persister cells were excluded from this analysis. A significant difference in division rates was detected between the two groups at the significance level of 0.05 ( = 9.65×10⁻⁷, Wilcoxon rank sum test).
Figure 5—figure supplement 1
Single-cell dynamics of the growing persisters of MG1655 against Amp in the post-exponential phase cell populations in M9.
Temporal changes in cell size (left) and cell shape circularity (right) of ten growing persisters not shown in Figure 5 are shown here. The dynamics of four growing persisters are not shown due to the difficulty of tracking in part of the pre-exposure period.
Figure 6 with 2 supplements
Growth phase-dependent persistence dynamics of MG1655 cell populations exposed to Amp in LB medium.
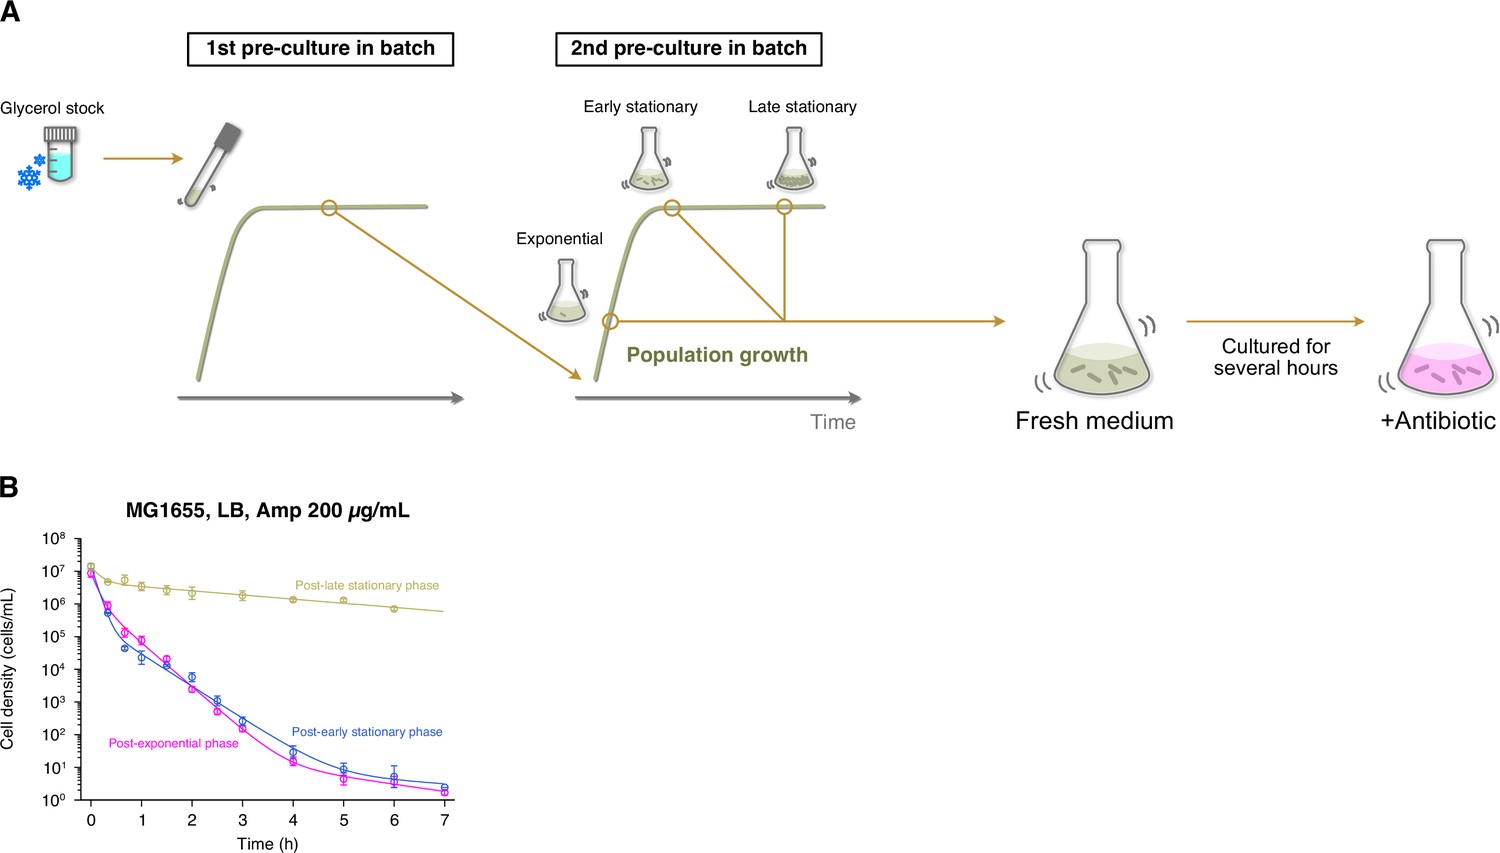
(A) Experimental procedure for measuring killing curves of post-exponential, post-early stationary, and post-late stationary phase cell populations. E. coli cells were inoculated from a glycerol stock into fresh medium and incubated overnight at 37°C with shaking (first pre-culture). The first pre-culture was diluted to the pre-determined cell density in fresh medium and incubated again at 37°C with shaking (second pre-culture). We sampled cells from the second pre-culture at the pre-determined time point for each condition (exponential phase, early stationary phase, or late stationary phase; see Figure 1—figure supplement 4). A suspension of E. coli cells from the second pre-culture was diluted again in fresh medium, cultured for 2 h, and then treated with 200 µg/mL Amp. We introduced this pre-exposure cultivation in fresh medium to align the pre-exposure history conditions between batch and single-cell measurements (see Figure 1C). We collected cell suspensions at the pre-determined time points and estimated the viable cell density in the population by a limiting dilution method (see Methods). (B) Killing curves of MG1655 cell populations sampled from different growth phases. The dynamics of post-exponential, post-early stationary, and post-late stationary phase cell populations are shown in magenta, blue, and yellow, respectively. Points and error bars represent means and standard errors of the logarithm of cell density among replicate experiments ( = 6 for the post-exponential phase, = 3 for the post-early and post-late stationary phase conditions). The lines represent the fitting of the double or triple exponential decay curves to the data: for the post-exponential phase; for the post-early stationary phase; and for the post-late stationary phase, where is the viable cell density in the cell populations at time . We chose a biphasic or triphasic exponential decay curve based on the Akaike’s Information Criterion (AIC) of the fit to the experimental data (see Methods).
Figure 6—figure supplement 1
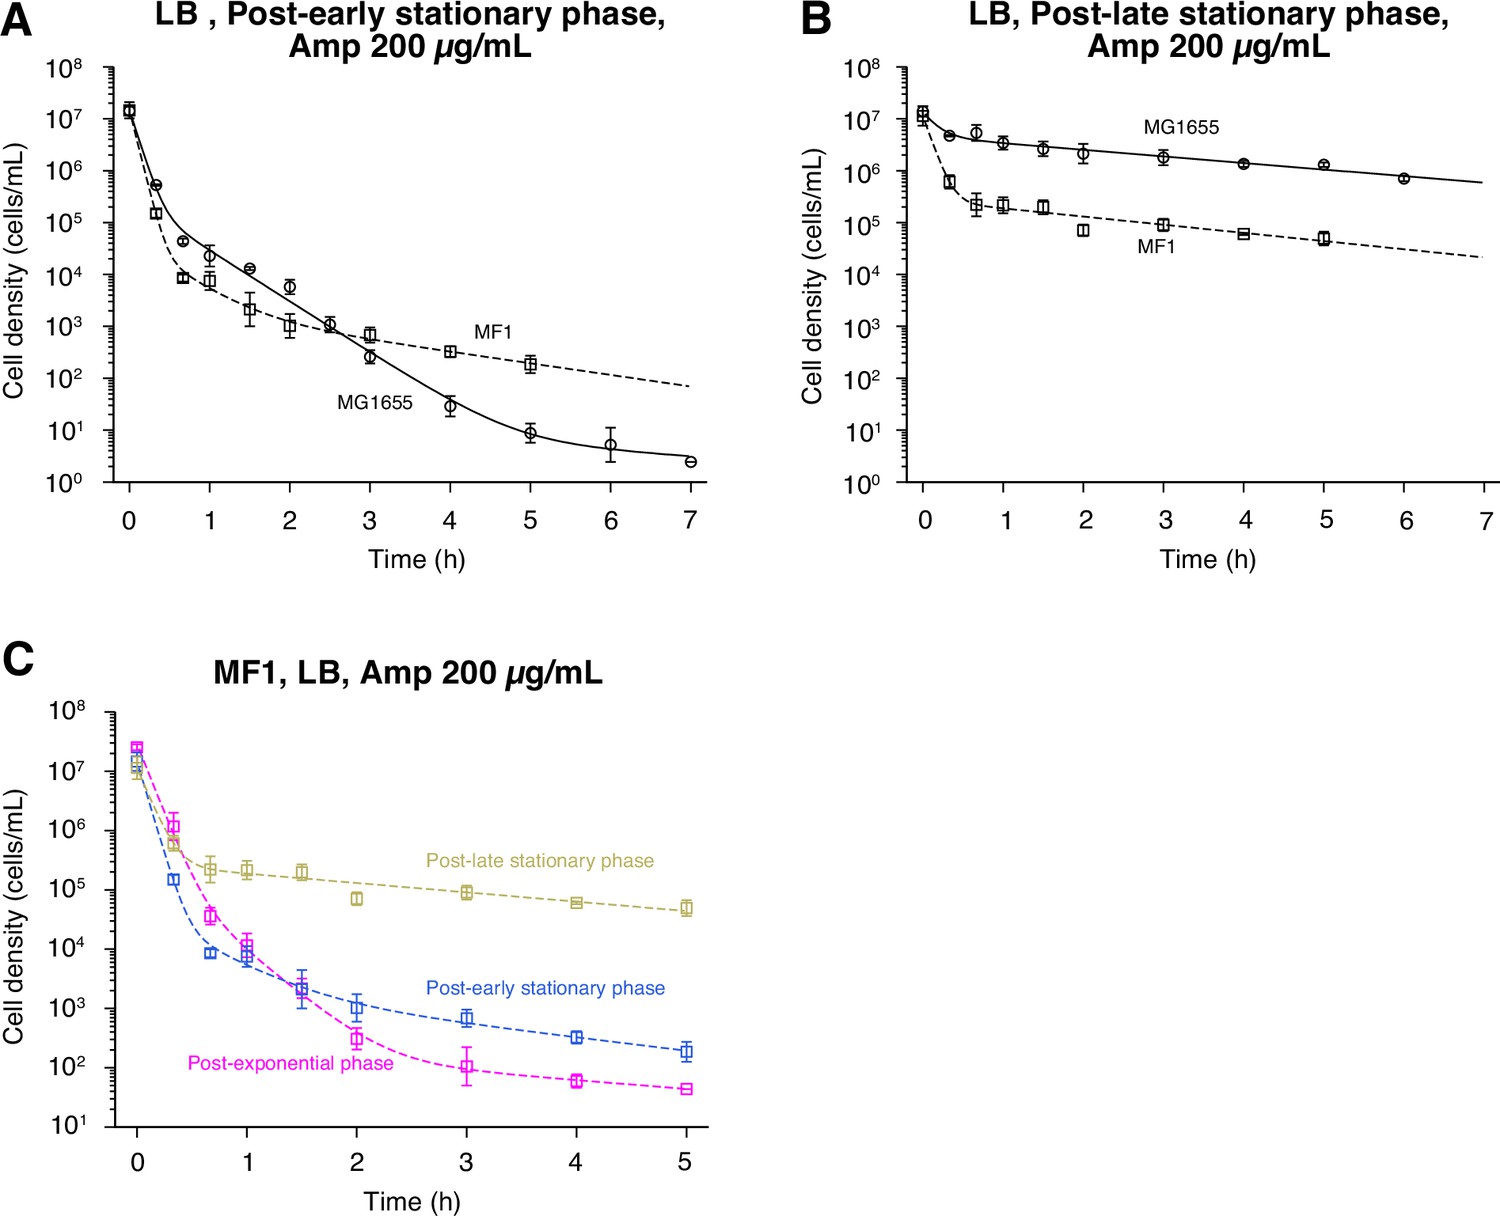
Killing curves of post-early stationary and post-late stationary phase cell populations of MF1.
(A) Killing curve of post-early stationary phase cells of MF1 exposed to 200 µg/mL Amp in LB medium. The killing curve of MF1 (squares) is shown with that of the MG1655 (circles) for comparison. Points and error bars represent means and standard errors of the logarithm of cell density among replicate experiments ( = 3 for both MG1655 and MF1). The dashed line represents the fitting of the triple exponential decay curves to the data of MF1: . The solid line is the fitting for the post-early stationary phase cells of MG1655 and is the same as in Figure 6B. E. coli cells were prepared for this assay according to the pre-culture procedure shown in Figure 6A. (B) Killing curve of post-late stationary phase cells of MF1 exposed to 200 µg/mL Amp in LB medium. The plots are displayed in the same way as in A. = 3 for both MG1655 and MF1. The dashed line represents the fitting of the double exponential decay curves to the data of MF1: . The solid line is the fitting for the post-late stationary phase cells of MG1655 and is the same as in Figure 6B. (C) Killing curves of MF1 cell populations sampled from different growth phases. The dynamics of post-exponential, post-early stationary, and post-late stationary phase cell populations exposed to 200 µg/mL Amp are shown in magenta, blue, and yellow, respectively.
Figure 6—figure supplement 2

Viability check of non-growing cells by PI staining.
The MG1655/pUA66-PrpsL-gfp strain was used in this experiment. The cells sampled from the late stationary phase were observed in the MCMA microfluidic device with a 100× objective. PI was added to the flowing media from the time the Amp exposure began. Cells were exposed to 200 µg/mL of Amp for 6 h. The right and middle image sequences show the images of the PI and GFP fluorescence, respectively. The left image sequence shows the merged images of the bright-field (grayscale), GFP (green), and PI (red) channels. The white arrows in the merged images at 360 min and 630 min indicate several non-growing cells that did not regrow after the Amp exposure. We detected no fluorescence signals of PI in these cells, which suggests that they may be viable. However, we do not exclude the possibility that PI may not correctly report the viability of these non-growing cells under these experimental conditions and that they are actually dead.
Figure 7
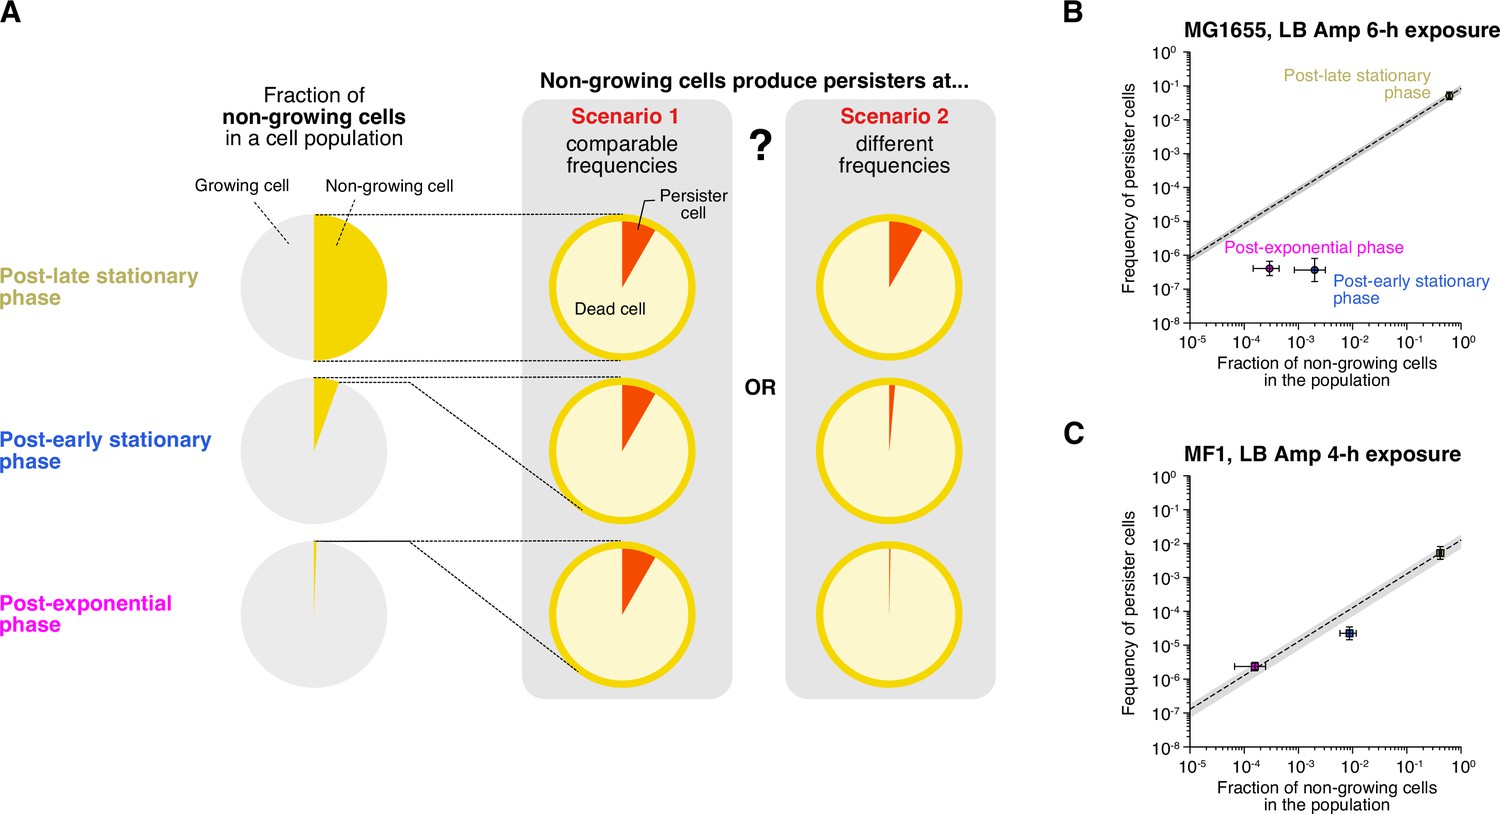
Characterization of growth phase-dependent changes in the proportion of non-growing cells in cell populations and their survivability against Amp exposure.
(A) Schematic illustration of the purpose of the analysis. In this analysis, we asked how the fraction of non-growing cells in a cell population changes depending on growth phase and whether these non-growing cells produce persisters (non-growing persisters) at comparable frequencies (scenario 1) or at different frequencies (scenario 2) under different conditions. (B) Relationship between the fractions of non-growing cells and the frequencies of surviving cells of MG1655 after exposure to 200 µg/mL Amp for 6 h in LB medium. The horizontal axis represents the fraction of non-growing cells characterized by single-cell measurements. The vertical axis represents the frequency of surviving cells estimated from the data points at 6 h in the population killing curves shown in Figure 1—figure supplement 3A, Figure 6B (points). The error bars along the horizontal axis represent the binomial standard errors, and those along the vertical axis represent the standard errors of the frequencies of the surviving cells. The dashed line represents the predicted frequency of non-growing persisters in a cell population, i.e., Equation 1 with the assumption of constant (scenario 1). The gray background indicates the prediction error range derived from the estimation error range of (6.18×10⁻²–1.06×10⁻¹). (C) Relationship between the fractions of non-growing cells and the frequencies of surviving cells of MF1 after exposure to 200 µg/mL Amp for 4 h in LB medium. The frequency of surviving cells was estimated from the data points at 4 h in the population killing curves in Figure 1—figure supplement 3A, Figure 6—figure supplement 1C. The gray background indicates the prediction error range derived from the estimation error range of (7.19×10⁻³–1.84×10⁻²).
Figure 8 with 2 supplements
Persisters against CPFX observed in the post-exponential phase cell populations of MG1655 in M9.
(A) Time-lapse images of a growing persister showing extreme filamentation after exposure to 1 µg/mL CPFX for 6 h. The left image sequences show the bright-field images. The right image sequences show the enlarged micrographs of the persister cell. The green line to the left of the images indicates the images under the CPFX exposure. The white arrow indicates the growing persister cell. (B) Temporal changes in cell size (top graph) and cell shape circularity (bottom graph) of the growing persister shown in A. The green background indicates the 6-h period of the CPFX exposure. The black arrows indicate the time points at which the micrographs in A were taken. The blue dots indicate the points where cell divisions occurred. (C) Time-lapse images of a growing persister showing no extreme filamentation during and after the CPFX exposure. Images are displayed in the same way as in A. (D) Temporal changes in cell size (top graph) and cell shape circularity (bottom graph) of the growing persister shown in C. (E) Comparison of pre-exposure division rates between growing persisters ( = 24) and non-surviving cells ( = 76). Due to the difficulty in counting the number of pre-exposure cell divisions, five growing persisters were excluded from this analysis. No significant difference in division rates was detected at the significance level of 0.05 ( = 0.12, Wilcoxon rank sum test).
Figure 8—figure supplement 1

Single-cell dynamics of MG1655 persisters against CPFX in the post-exponential phase cell populations in M9.
Temporal changes in cell size (left) and cell shape circularity (right) of 16 persisters of MG1655 in the post-exponential phase cell populations not shown in Figure 8 are shown here. The dynamics of 11 persisters are not shown here due to the difficulty of tracking in part of the pre-exposure period. All persisters for which we could identify their pre-exposure growth traits were growing persisters.
Figure 8—figure supplement 2

Killing curves of post-late stationary phase cell populations of MG1655 against CPFX.
The dynamics of the post-late stationary phase cell populations of MG1655 exposed to 1 µg/mL CPFX in M9 are shown and compared with those of the post-exponential phase cell populations. Orange for the post-late stationary phase condition; and green for the post-exponential phase condition. Points and error bars represent means and standard errors of the logarithm of cell density among three replicate experiments in each condition. The orange line represents the fitting of the triple exponential decay curves to the data for the post-late stationary phase condition: . The green points and line are the same as those of ‘MG1655’ in Figure 1—figure supplement 3B.
Author response image 1

Regrowing population kinetics of MF1 from different growth phases.
Videos
Video 1
Time-lapse observation of the growing persister of the MF1 strain against the exposure to 200 µg/mL Amp for 3.5 h.
The time-lapse images were acquired with a 100× objective. Left: Merged images of the bright-field (grayscale), GFP (green), and RpoS-mCherry (red) channels; Middle: GFP channel; Right: RpoS-mCherry channel. The medium conditions are indicated near the upper-left corner. The counter near the lower-right corner indicates the time after the onset of Amp exposure. Scale bar, 10 µm.
Video 2
Time-lapse observation of the non-growing persister of the MF1 strain against the exposure to 200 µg/mL Amp for 3.5 h.
The time-lapse images were acquired with a 100× objective. Left: Merged images of the bright-field (grayscale), GFP (green), and RpoS-mCherry (red) channels; Middle: GFP channel; Right: RpoS-mCherry channel. The medium conditions are indicated near the lower-right side. The counter near the lower-right corner (right side of the noted medium conditions) indicates the time after the onset of Amp exposure. Scale bar, 10 µm.
Video 3
Simultaneous time-lapse observation of the drug responses of many individual cells using the MCMA microfluidic device.
This movie shows a single field of view observed in a time-lapse measurement with the MCMA microfluidic device using a 40× objective. 40 microchambers can be visualized per position. We imaged 50–150 positions in a single time-lapse measurement. In this movie, one microchamber contained a persister cell against Amp exposure (in the upper left microchamber). The medium conditions and the time after the onset of Amp exposure are indicated near the upper-right corner. Scale bar, 50 µm.
Video 4
Time-lapse movie of all six growing persister cells in the post-exponential phase cell populations of MG1655 against the exposure to 200 µg/mL Amp for 6 h in LB.
This movie shows all six growing persister cells observed in all the replicated single-cell measurements of the post-exponential phase cells of MG1655 exposed to 200 µg/mL Amp for 6 h in LB (Figure 3). We used a 40× objective in this measurement. Scale bar, 10 µm.
Video 5
Time-lapse movie of the 10 growing persisters in the post-exponential phase cell populations of MF1 against the exposure to 200 µg/mL Amp for 3.5 h in LB.
This movie shows the 10 growing persister cells observed in all the replicated single-cell measurements of the post-exponential phase cells of MF1 exposed to 200 µg/mL Amp for 3.5 h in LB (Figure 3—figure supplement 1). We used a 40× objective in this measurement. Scale bar, 10 µm.
Video 6
Time-lapse movie of the two non-growing persisters in the post-exponential phase cell populations of MF1 against the exposure to 200 µg/mL Amp for 3.5 h in LB.
This movie shows the two non-growing persister cells observed in all the replicated single-cell measurements of the post-exponential phase cells of MF1 exposed to 200 µg/mL Amp for 3.5 h in LB (Figure 3—figure supplement 1). We used a 40× objective in this measurement. Scale bar, 10 µm.
Video 7
Non-growing persister of MF1 in the post-exponential phase cell populations grown from a 1000-fold smaller inoculum.
This movie shows a representative non-growing persister cell of MF1 found in the post-exponential phase cell population in LB grown from a 1000-fold smaller inoculum to eliminate long lagging cells. We used a 40× objective in this measurement. Scale bar, 10 µm.
Video 8
Time-lapse movie of all 18 persister cells in the post-exponential phase cell populations of MG1655 against the exposure to 200 µg/mL Amp for 6 h in M9.
This movie shows all the 18 persister cells observed in all the replicated single-cell measurements of the post-exponential phase cells of MG1655 exposed to 200 µg/mL Amp for 6 h in M9 (Figure 3). We used a 100× objective in this measurement. Scale bar, 10 µm.
Video 9
Time-lapse movie of all 24 persister cells in the post-exponential phase cell populations of MF1 against the exposure to 200 µg/mL Amp for 6 h in M9.
This movie shows all the 24 persister cells observed in all the replicated single-cell measurements of the post-exponential phase cells of MF1 exposed to 200 µg/mL Amp for 6 h in M9 (Figure 3—figure supplement 1). We used a 40× objective in this measurement. Scale bar, 10 µm.
Video 10
Amoeba-like locomotion of L-form-like cells of MF1 in the microchambers.
This movie shows representative three microchambers in which L-form-like E. coli cells exhibited amoeba-like locomotion. In this experiment, 200 µg/mL of Amp was exposed to the MF1 cells cultured in the M9 medium. Fission of cell bodies occurred in these cells during the locomotion. Furthermore, regrowing cell populations emerged from left-behind cell bodies.
Video 11
Time-lapse movie of all 7 persister cells in the post-early stationary phase cell populations of MG1655 against the exposure to 200 µg/mL Amp for 6 h in LB.
This movie shows all the seven persister cells observed in all the replicated single-cell measurements of the post-early stationary phase cells of MG1655 exposed to 200 µg/mL Amp for 6 h in LB (Figure 3). We used a 40× objective in this measurement. Scale bar, 10 µm.
Video 12
Time-lapse movie of 10 representative persister cells in the post-late stationary phase cell populations of MG1655 against the exposure to 200 µg/mL Amp for 6 h in LB.
This movie shows 10 representative persister cells observed in one of the single-cell measurements of the post-late stationary phase cells of MG1655 exposed to 200 µg/mL Amp for 6 h in LB (Figure 3). We used a 40× objective in this measurement. Scale bar, 10 µm.
Video 13
Time-lapse movie of all 28 persister cells in the post-early stationary phase cell populations of MF1 against the exposure to 200 µg/mL Amp for 3.5 h in LB.
This movie shows all the 28 persister cells observed in all the replicated single-cell measurements of the post-early stationary phase cells of MF1 exposed to 200 µg/mL Amp for 3.5 h in LB (Figure 3—figure supplement 1). We used a 40× objective in this measurement. Scale bar, 10 µm.
Video 14
Time-lapse movie of 17 representative persister cells in the post-late stationary phase cell populations of MF1 against the exposure to 200 µg/mL Amp for 3.5 h in LB.
This movie shows 17 representative persister cells observed in one of the single-cell measurements of the post-late stationary phase cells of MF1 exposed to 200 µg/mL Amp for 3.5 h in LB (Figure 3—figure supplement 1). We used a 40× objective in this measurement. Scale bar, 10 µm.
Video 15
Viability check of the non-regrowing non-growing cells by PI staining (6-h Amp exposure).
This movie shows the time-lapse observation of the post-late stationary phase cells of MG1655/pUA66-PrpsL-gfp in LB medium. We used a 100× objective in this measurement. Left: Merged images of the bright-field (grayscale), GFP (green), and PI (red) channels; Middle: GFP channel; Right: PI channel. PI was added to the flowing media from the beginning of the Amp exposure as indicated by the text at the bottom of the movie. We found many non-growing cells that did not regrow even after the removal of Amp. They were visible in the GFP channel but negative for PI staining. Scale bar, 10 µm.
Video 16
Time-lapse observation of 29 representative persister cells in the post-exponential phase cell populations of MG1655 exposed to 1 µg/mL CPFX for 6 h in M9.
This movie shows 29 representative persister cells observed in one of the single-cell measurements of the post-exponential phase cells of MG1655 exposed to 1 µg/mL CPFX for 6 h in M9 (Figure 3). We used a 40× objective in this measurement. Scale bar, 10 µm.
Video 17
Time-lapse observation of 10 representative persister cells in the post-exponential phase cell populations of MF1 exposed to 1 µg/mL CPFX for 6 h in M9.
This movie shows 10 representative persister cells observed in one of the single-cell measurements of the post-exponential phase cells of MF1 exposed to 1 µg/mL CPFX for 6 h in M9 (Figure 3—figure supplement 1). We used a 40× objective in this measurement. Scale bar, 10 µm.
Video 18
Time-lapse observation of 10 representative persister cells in the post-late stationary phase cell populations of MG1655 exposed to 1 µg/mL CPFX for 6 h in M9.
This movie shows 10 representative persister cells observed in one of the single-cell measurements of the post-late stationary phase cells of MG1655 exposed to 1 µg/mL CPFX for 6 h in M9 (Figure 3). We used a 40× objective in this measurement. Scale bar, 10 µm.
Additional files
Download links
A two-part list of links to download the article, or parts of the article, in various formats.
Downloads (link to download the article as PDF)
Open citations (links to open the citations from this article in various online reference manager services)
Cite this article (links to download the citations from this article in formats compatible with various reference manager tools)
Observation of persister cell histories reveals diverse modes of survival in antibiotic persistence
eLife 14:e79517.
https://doi.org/10.7554/eLife.79517


