Genome-wide base editor screen identifies regulators of protein abundance in yeast
- Department of Human Genetics, University of California, Los Angeles, United States
- Department of Biological Chemistry, University of California, Los Angeles, United States
- Howard Hughes Medical Institute, University of California, Los Angeles, United States
- Institute for Quantitative and Computational Biology, University of California, Los Angeles, United States
- Department of Environmental Systems Science, Swiss Federal Institute of Technology (ETH), Switzerland
- Department of Environmental Microbiology, Swiss Federal Institute of Aquatic Science and Technology (Eawag), Switzerland
Figures
Figure 1 with 3 supplements

Base editor characterization in yeast.
For eight gRNAs, following base editing for 44 hr, the genomic target site was PCR-amplified and subjected to deep sequencing. (A) Base editing outcome for the eight gRNAs with target genomic regions aligned by PAM site. Light gray shading delineates the gRNA target site, and dark gray shading delineates the window of greatest editing (13–17 base pairs upstream of the PAM sequence). (B) Base editing outcome classified by editing pattern for each of the eight gRNAs tested. The editing window is indicated in the gRNA sequence. The horizontal axis of the plot reflects the fraction of reads for each editing pattern out of all reads acquired for the respective gRNA. Only alleles with >1% frequency were classified.
Figure 1—figure supplement 1
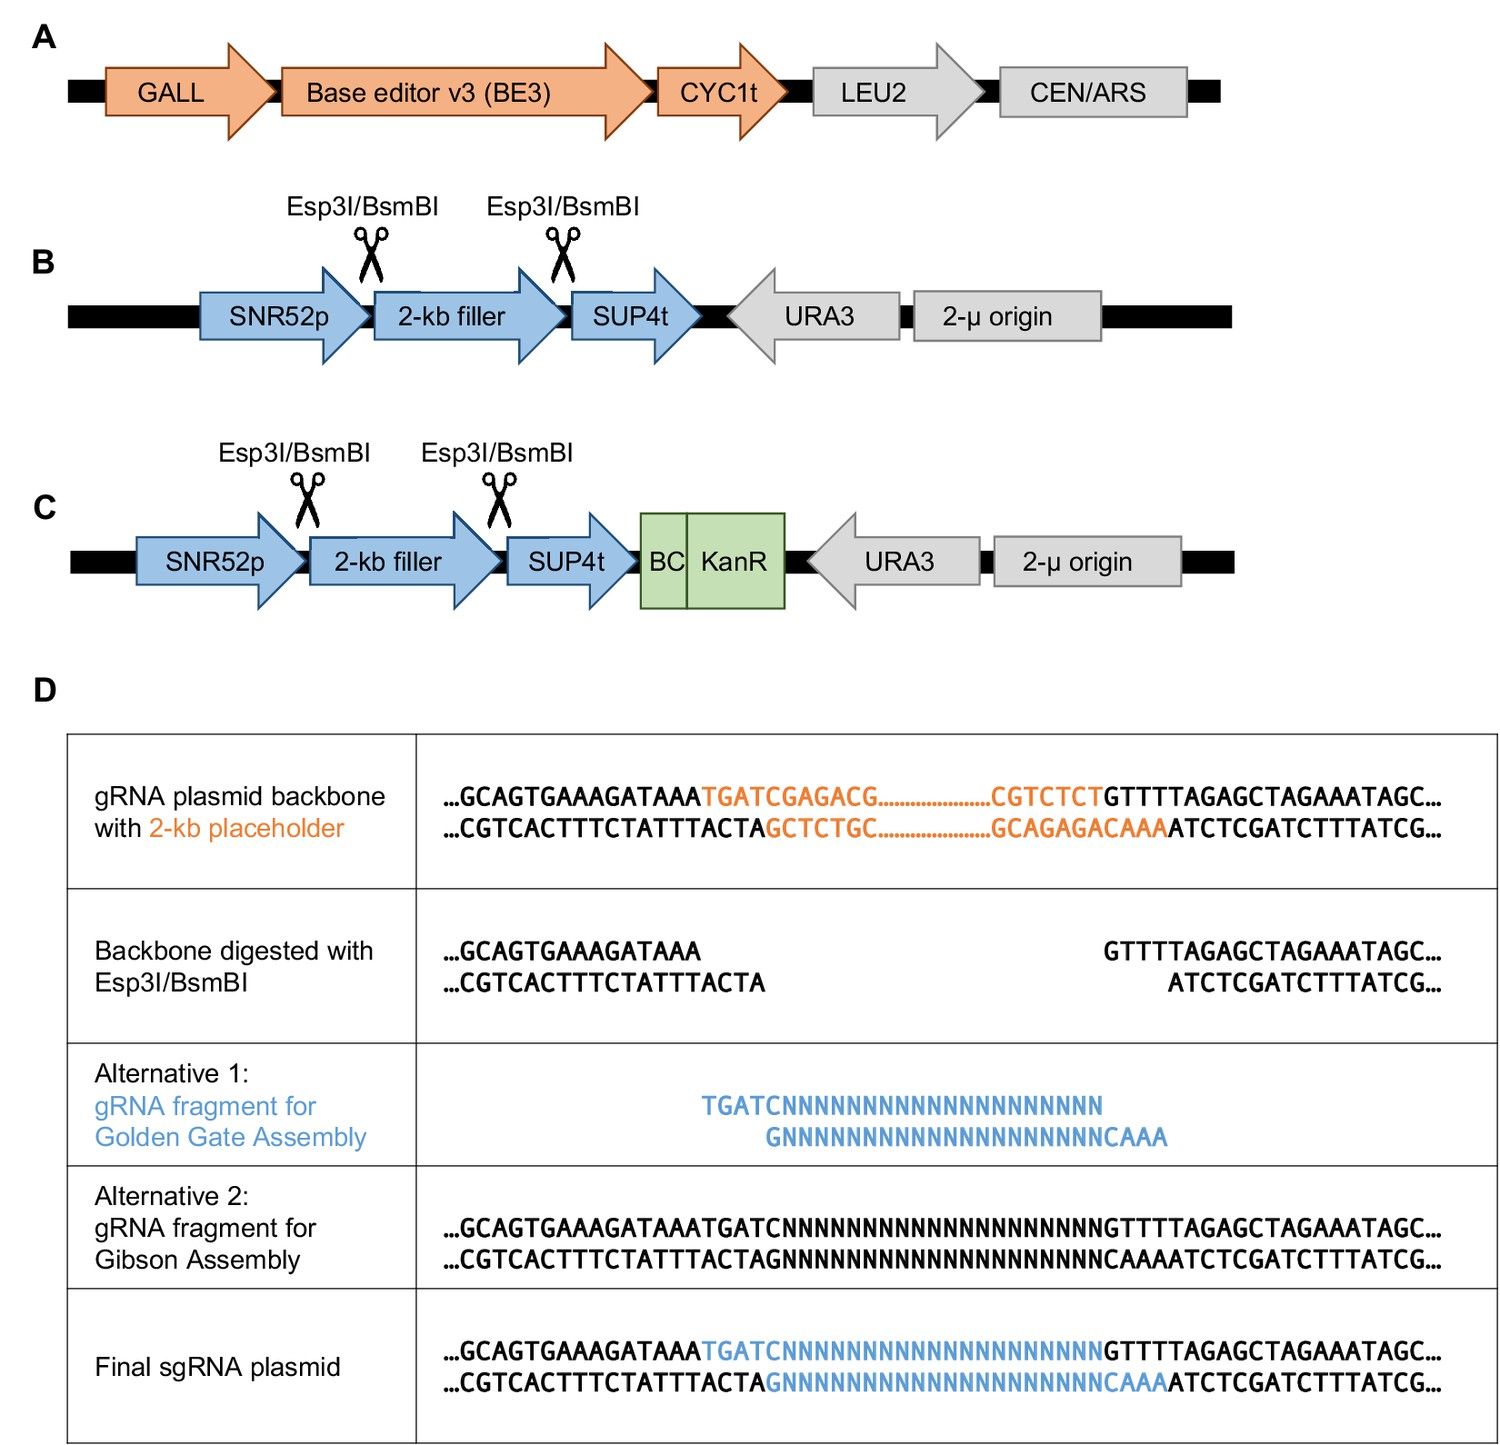
Base editor and gRNA plasmid design for base editing in S.cerevisiae.
(A) The low-copy plasmid pGal-BE3 encodes the base editor v3 (BE3; Komor et al., 2016) under a galactose-inducible promoter (GALL). This plasmid also encodes LEU2 for selection. (B) The high-copy pgRNA-backbone plasmid encodes a 2 kb placeholder flanked by the SNR52 promoter (a Polymerase-III promoter) and SUP4 terminator. The placeholder can be removed by Esp3I/BsmBI restriction digest and then a gRNA can be cloned in either by Golden Gate Assembly or by Gibson Assembly. This plasmid also encodes the URA3 gene for selection. (C) This plasmid is identical to the one shown in (B) but with a barcode cassette added. The barcode cassette contains a Kanamycin resistance gene. (D) Sequences at the gRNA cloning site of the pgRNA-backbone plasmid to facilitate gRNA plasmid cloning (individually by Golden Gate Assembly or as a library by Gibson Assembly). Rows 3 and 4 show the two types of DNA fragments containing the gRNA that can be cloned into the digested backbone plasmid.
Figure 1—figure supplement 2
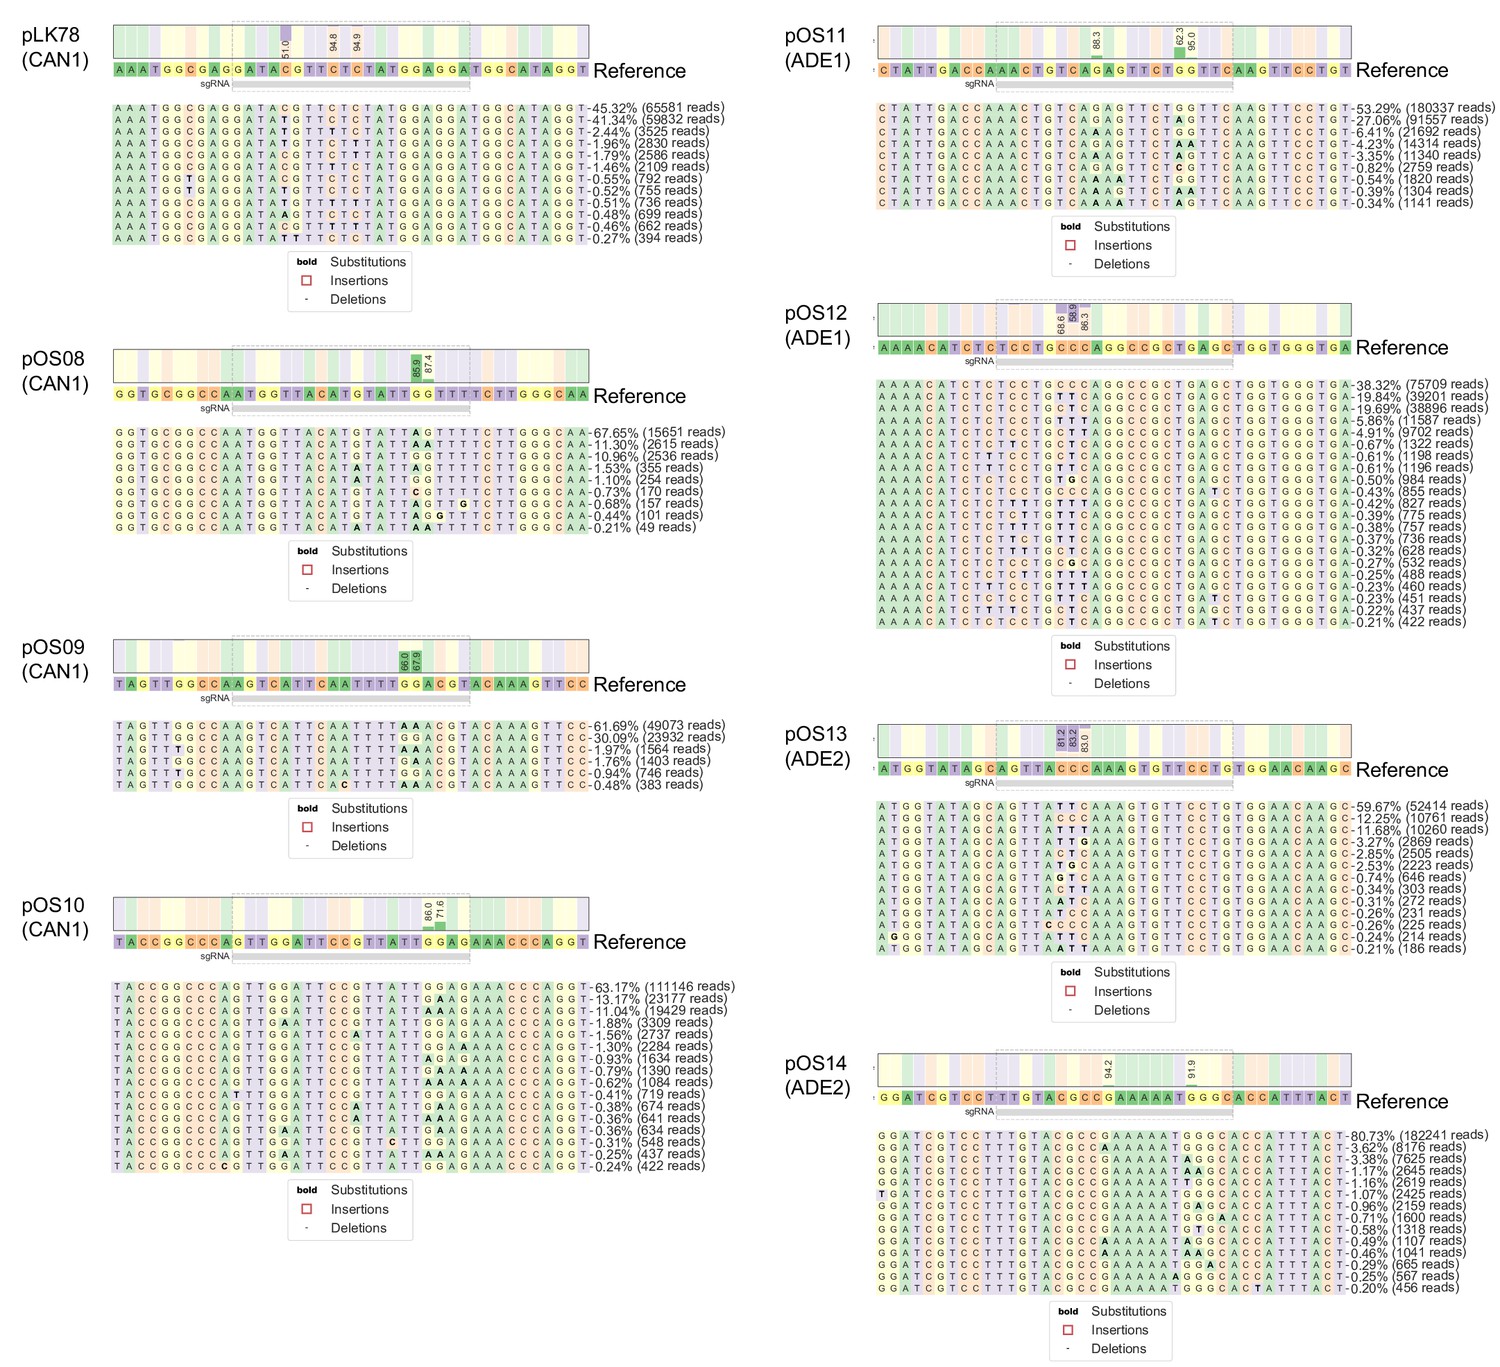
Base editing profile at the genomic target site of each of eight gRNAs.
After base editing with eight gRNAs for 44 hr (individually in eight different cultures), the genomic target sites were PCR-amplified and the amplicons subjected to deep sequencing. The base editing profile at the genomic target site for each of the eight gRNAs is shown. Only alleles with a frequency >0.2% of the total number of reads are shown. Visualizations generated by CRISPResso2 (Clement et al., 2019).
Figure 1—figure supplement 3
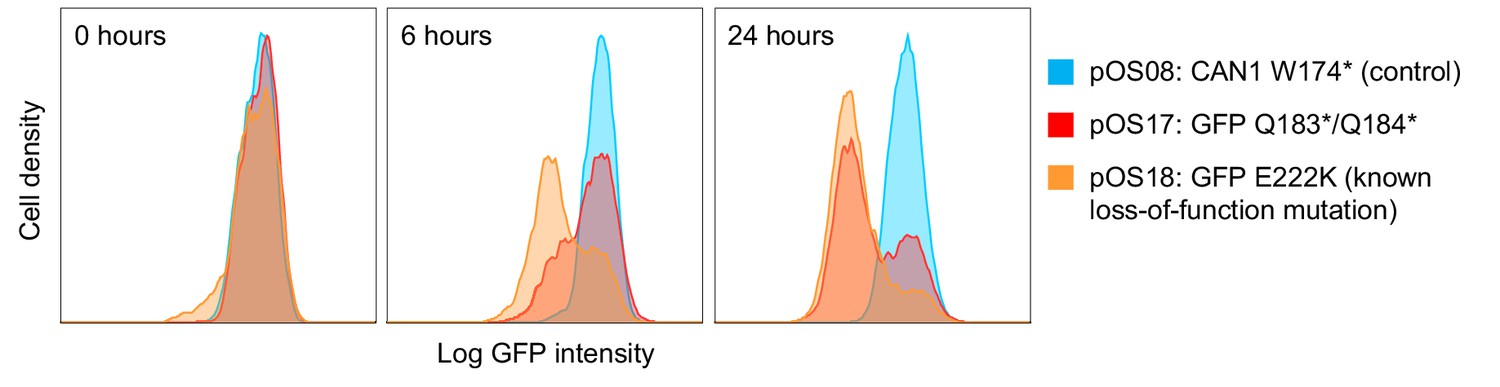
Base editing rate as assessed by editing of the GFP encoding gene.
Yeast cells with a genomically inserted GFP (translationally fused to Hxk2) were transformed with the base editor plasmid and a gRNA plasmid targeting loss-of-function mutations either into the GFP gene (pOS17: GFP Q183*/Q184*; pOS18: GFP E222K) or a control gene (pOS08: CAN1 W174*) (Fu et al., 2015). GFP fluorescence of 20,000 cells was measured by flow cytometry at 0 hr, 12 hr, and 24 hr after induction of base editor expression with galactose. The histogram plots show that by 24 hr, a majority of cells in which GFP was targeted has lost the GFP signal.
Figure 2 with 1 supplement
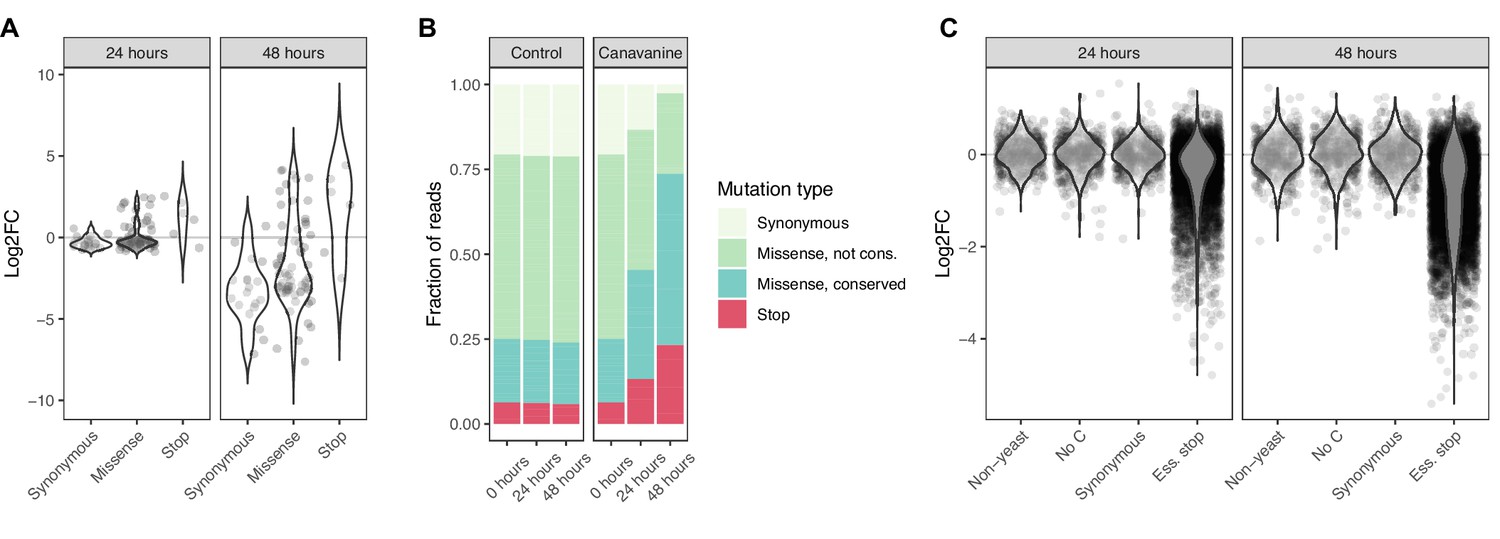
Base editor screens identify loss-of-function mutations in positive and negative selection schemes.
(A) For the canavanine screen, canavanine was added to cultures of cells that were base edited with a library of 90 gRNAs targeting the CAN1 gene. The log2 fold change of reads per gRNA at 24 and 48 hr after canavanine treatment compared to before treatment is shown. gRNAs are grouped by the type of mutation they are predicted to introduce. (B) The fraction of reads that map to gRNAs introducing different types of mutations into CAN1 48 hr after starting the canavanine treatment is shown. gRNAs expected to introduce missense mutations are split according to the conservation of the expected amino acid mutation, where ‘conserved’ is defined by PROVEAN scores <–5 and ‘not conserved’ by PROVEAN scores ≥–5. (C) For the fitness screen, yeast cultures were base edited using a library of gRNAs predicted to introduce premature stop codons into essential genes. These mutations are therefore expected to lead to a drop out of affected cells (and the responsible gRNA) from the cultures. The log2 fold change of reads per gRNA 24 and 48 hr compared to 0 hr after induction of base editing is shown. The gRNAs belong to either of four classes: (i) not targeting the yeast genome, (ii) no cytosine residue in the base editing window, (iii) predicted to introduce synonymous mutations only, (iv) predicted to introduce stop codons into essential genes.
-
Figure 2—source data 1
Results of canavanine survival screen with 90 gRNAs targeting the CAN1 gene.
- https://cdn.elifesciences.org/articles/79525/elife-79525-fig2-data1-v1.xlsx
-
Figure 2—source data 2
Results of fitness screen with 5430 gRNAs predicted to introduce stop codons into essential genes.
- https://cdn.elifesciences.org/articles/79525/elife-79525-fig2-data2-v1.xlsx
Figure 2—figure supplement 1
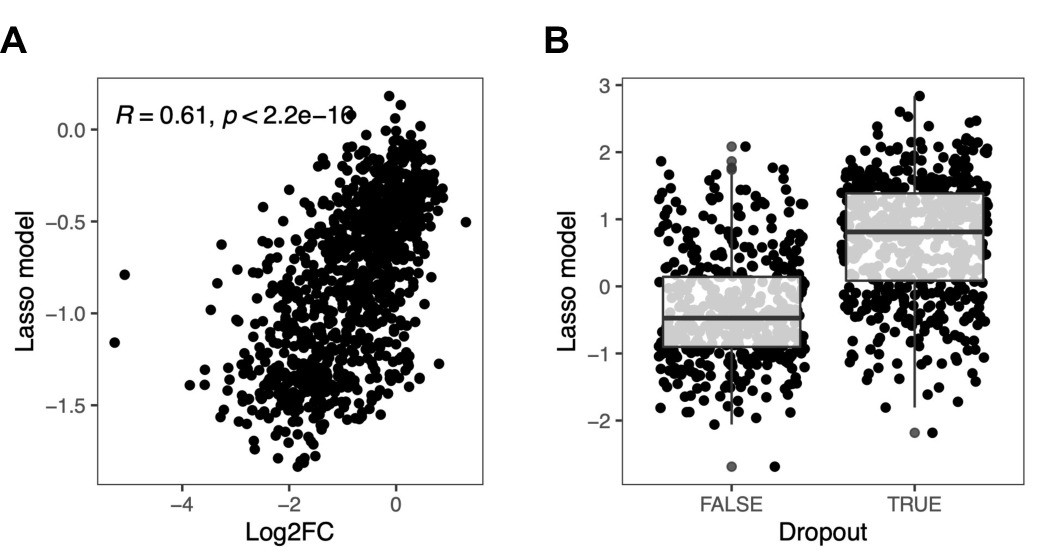
Effect of sequence context on base editing efficiency.
Base editing efficiency as a function of sequence context was assessed by applying an ordinary (A) or a logistic (B) lasso regression model on over 8000 sequence features for each of the gRNAs from classes (ii) and (iv) described in (Figure 2C). For the logistic lasso regression model, dropout was defined as a log2 fold change <–0.5. Box plot overlays summarize the underlying data points (center line: median; box limits: first and third quartiles; whiskers: 1.5-fold interquartile range).
Figure 3 with 4 supplements
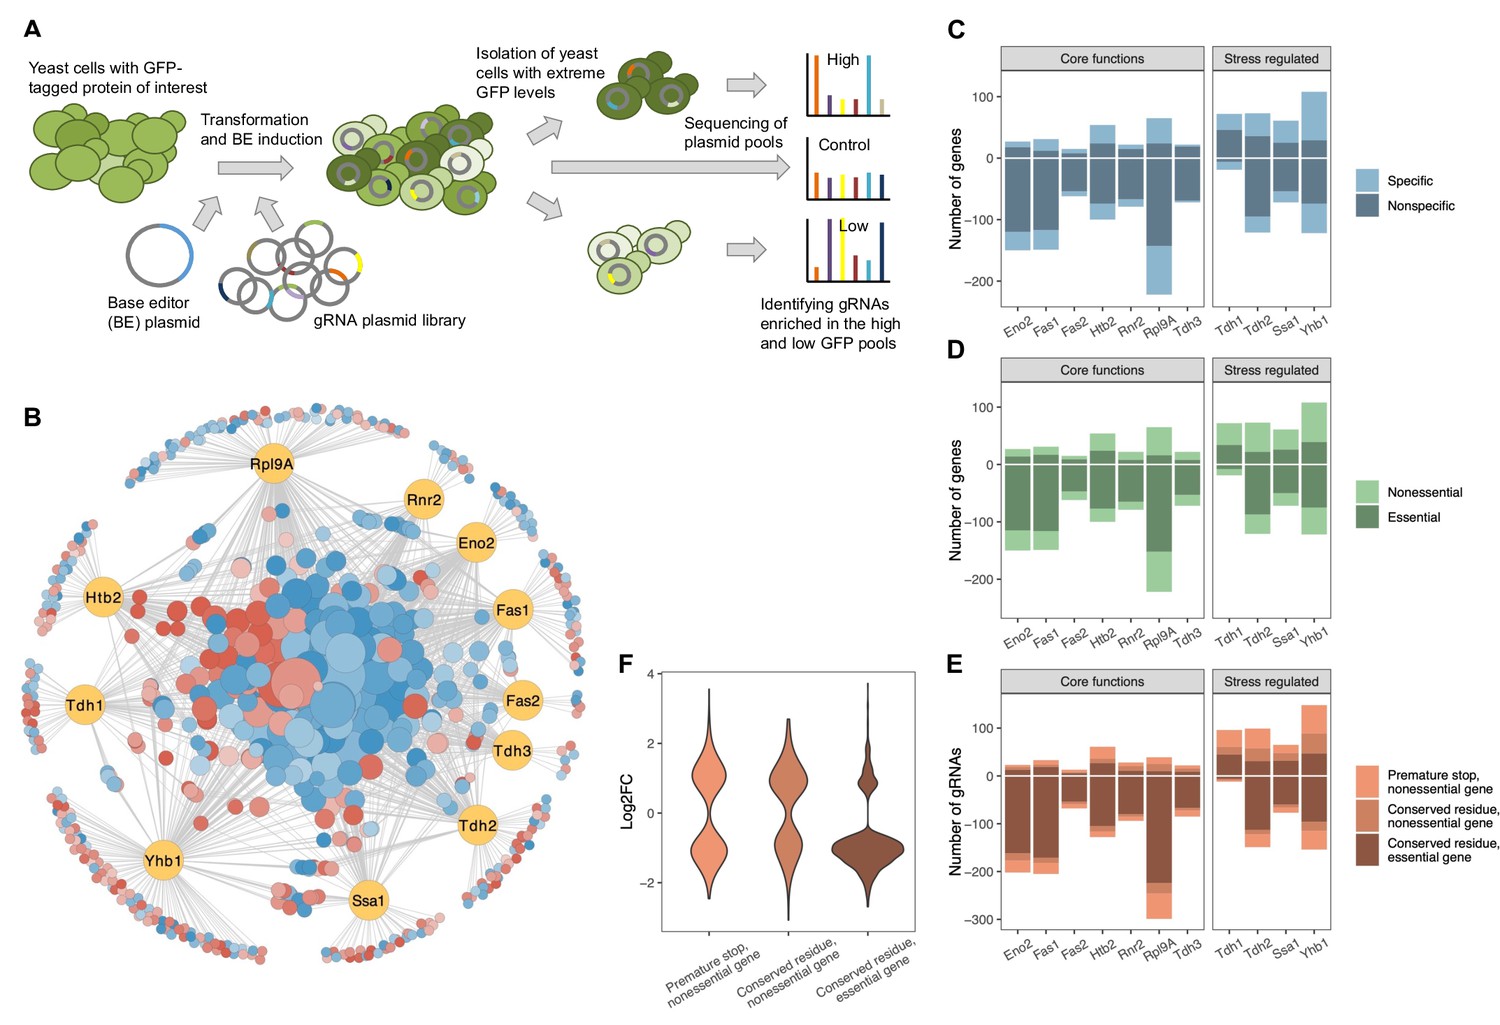
A CRISPR base editor screen for protein abundance.
(A) Schematic overview of the screen. (B) Network representing all identified gene-protein relationships. In yellow are the eleven proteins and in blue-red are all the gene perturbations that affect at least one of the proteins significantly (FDR<0.05). On the outer circle are gene perturbations that affect only a single protein, whereas on the inside are those that affect two or more proteins. Node sizes correlate with the number of proteins affected. Colors indicate whether a perturbation (predominantly) increases (red) or decreases (blue) the protein(s). The figure was created with Cytoscape (Shannon et al., 2003). (C) For each protein, the number of gene perturbations that cause a significant increase (positive vertical axis) or decrease (negative vertical axis) (FDR<0.05). The darker shade indicates gene perturbations that affect only one or two of the eleven proteins (‘specific’), whereas the lighter shade indicates gene perturbations that affect three or more of the eleven proteins (‘nonspecific’). (D) Same as in (C) but the darker shade indicates perturbations of essential genes, whereas the lighter shade indicates perturbations of nonessential genes. (E) Same as in (C) but the different shades reflect different types of expected mutations introduced by the particular gRNA. (F) Effect sizes (log2 fold changes) of gRNAs that cause a significant change in protein abundance grouped by the type of expected mutation introduced by each gRNA (FDR<0.05).
-
Figure 3—source data 1
Results of protein abundance screens with 16,452 gRNAs.
- https://cdn.elifesciences.org/articles/79525/elife-79525-fig3-data1-v1.xlsx
Figure 3—figure supplement 1
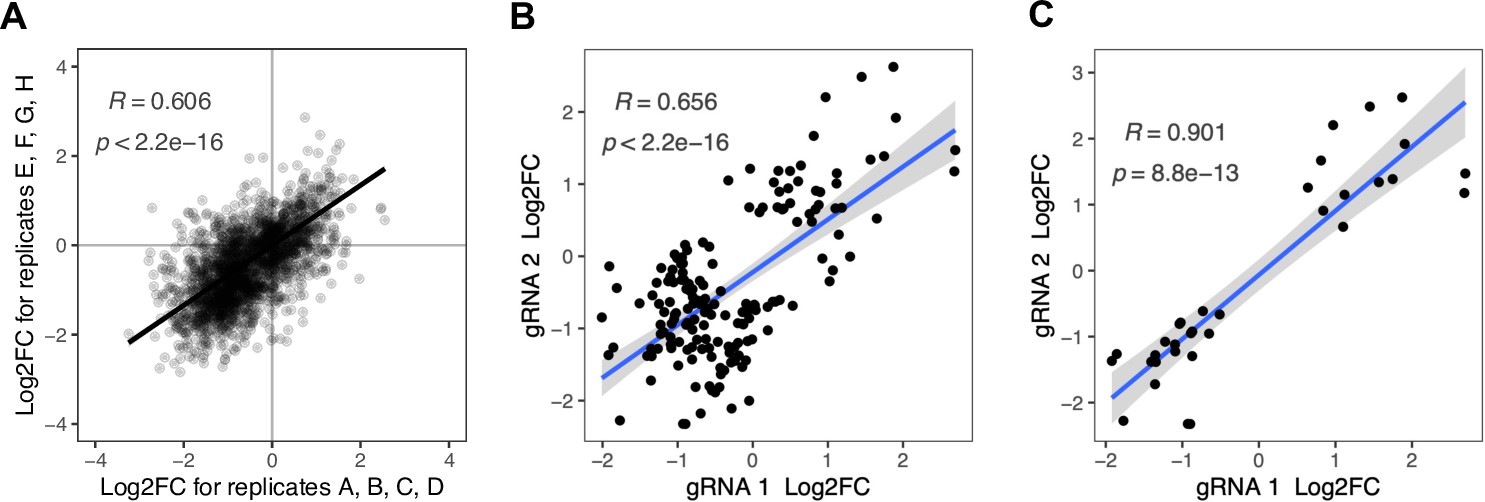
Correlation between replicates and among gRNAs targeting the same mutation.
(A) The eight replicates of each protein screen were split into two groups of four and log2 fold changes per gRNA were determined with the same analysis strategy that was used for the overall analysis of eight replicates. All gRNAs that were significant in the overall analysis of the eight replicates are shown. (B and C) Comparison of gRNA pairs that are predicted to target the same mutation into the genome. (B) All gRNA pairs for which at least one gRNA had a significant effect (FDR<0.05) on at least one protein. There are 78 gRNA pairs fulfilling this condition, some of which affect multiple proteins significantly, resulting in 164 data points. (C) All gRNA pairs for which both gRNAs had a significant effect (FDR<0.05) on at least one protein. There are 20 gRNA pairs fulfilling this condition, some of which affect multiple proteins significantly, resulting in 33 data points. Pearson’s correlation coefficients and corresponding p-values are indicated in each plot. The blue line represents the linear regression model with standard error indicated as gray shade.
Figure 3—figure supplement 2
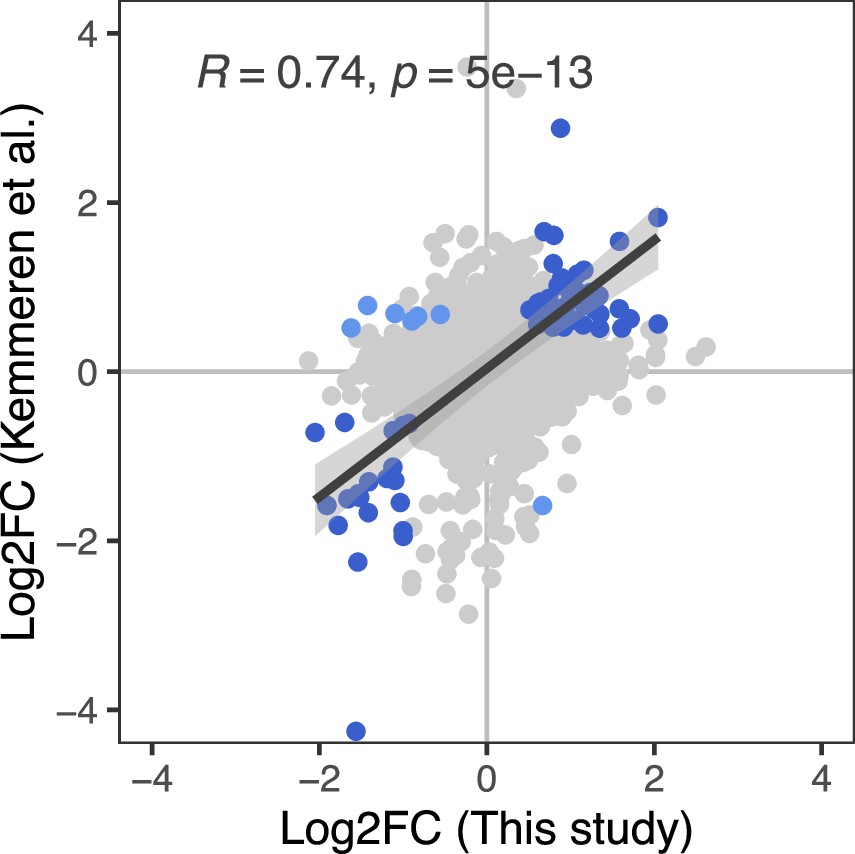
Correlation between the effect of genetic perturbations on mRNA and protein abundances.
The effect of gene perturbations on protein abundances (this study) and on mRNA abundances (Kemmeren et al., 2014) is shown. For this study, the effects of multiple gRNAs were summarized per gene as described in the Methods section. The Kemmeren et al. study used gene deletion strains (Giaever et al., 2002). Each dot in the figure represents the effect of one of 1106 gene perturbations on mRNA and protein abundances of a gene covered in both data sets. Gene perturbations that had a significant effect on both mRNA and protein abundances of a gene in the two studies (q<0.05 and Log2FC>0.5) are indicated as blue dots. For these data points, the regression line, standard error, as well as the Pearson's correlation coefficient and corresponding p-value are shown.
Figure 3—figure supplement 3
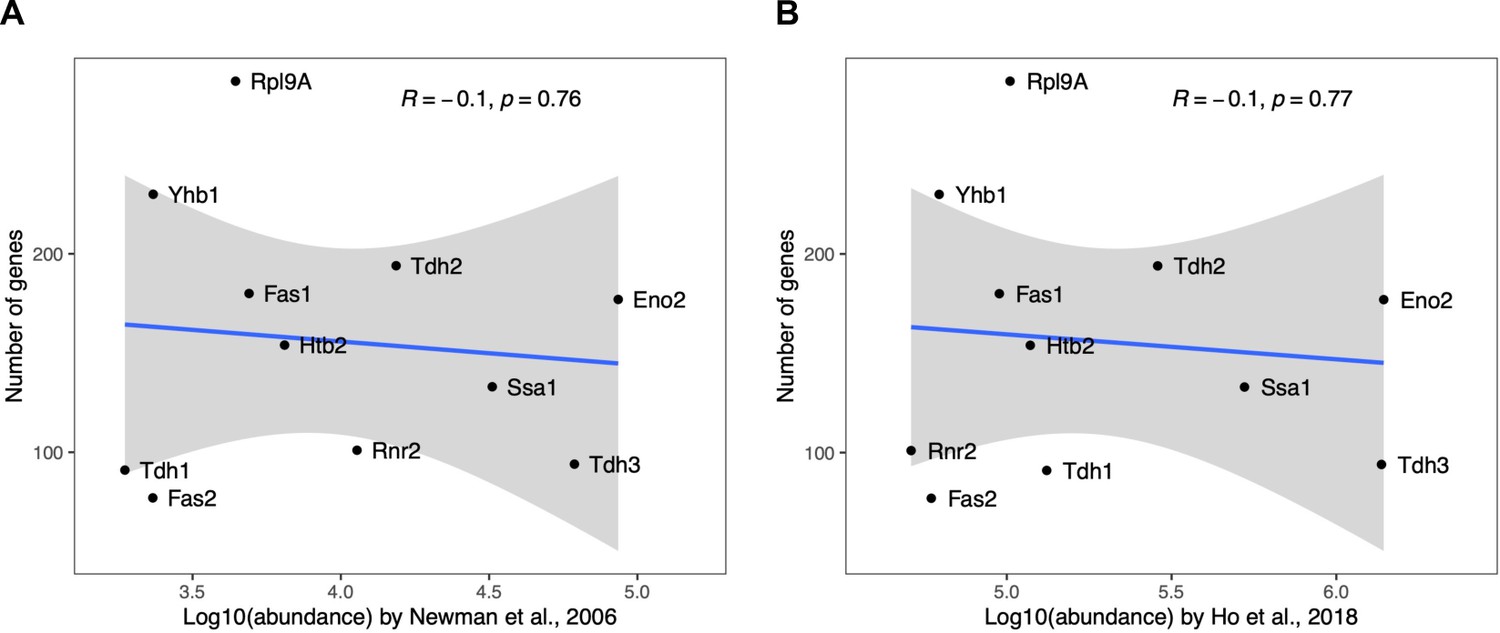
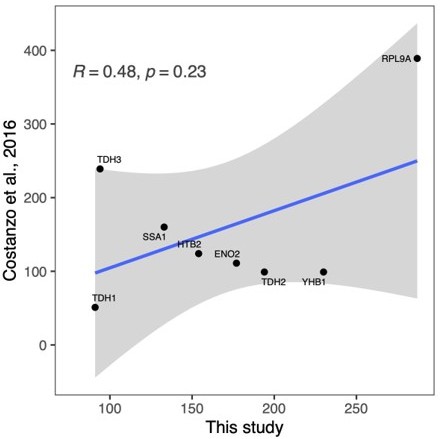
Correlation between the number of gene perturbations significantly affecting a protein and the absolute abundance of that protein.
The number of gene perturbations with significant effect (FDR<0.05) is not dependent on the absolute abundance of the protein. Absolute protein abundances were obtained from (A) Newman and colleagues (Newman et al., 2006) and (B) Ho and colleagues (Ho et al., 2018). Pearson's correlation coefficients and corresponding p-values are indicated. The blue line represents the linear regression model with standard error indicated as gray shade.
Figure 3—figure supplement 4

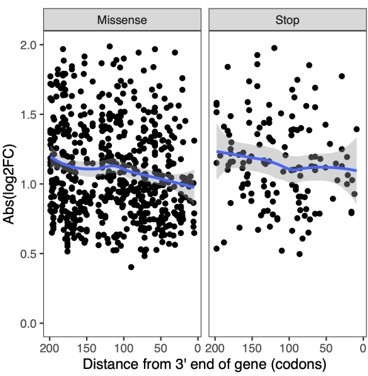
Correlation between number and effect size of perturbations with significant effects and their target site across the gene.
Perturbations toward the end of a gene tend to have fewer and lower effects. (A) Ratio of gRNAs with significant effect vs all gRNAs as a function of target gene position. (B) Absolute effect size of gRNAs with significant effect as a function of target gene position. The blue line shows a local polynomial regression fit (loess) with gray shades indicating the standard error. The plot was generated using the geom_smooth(method = 'loess') function from ggplot2 R package with default parameters.
Figure 4
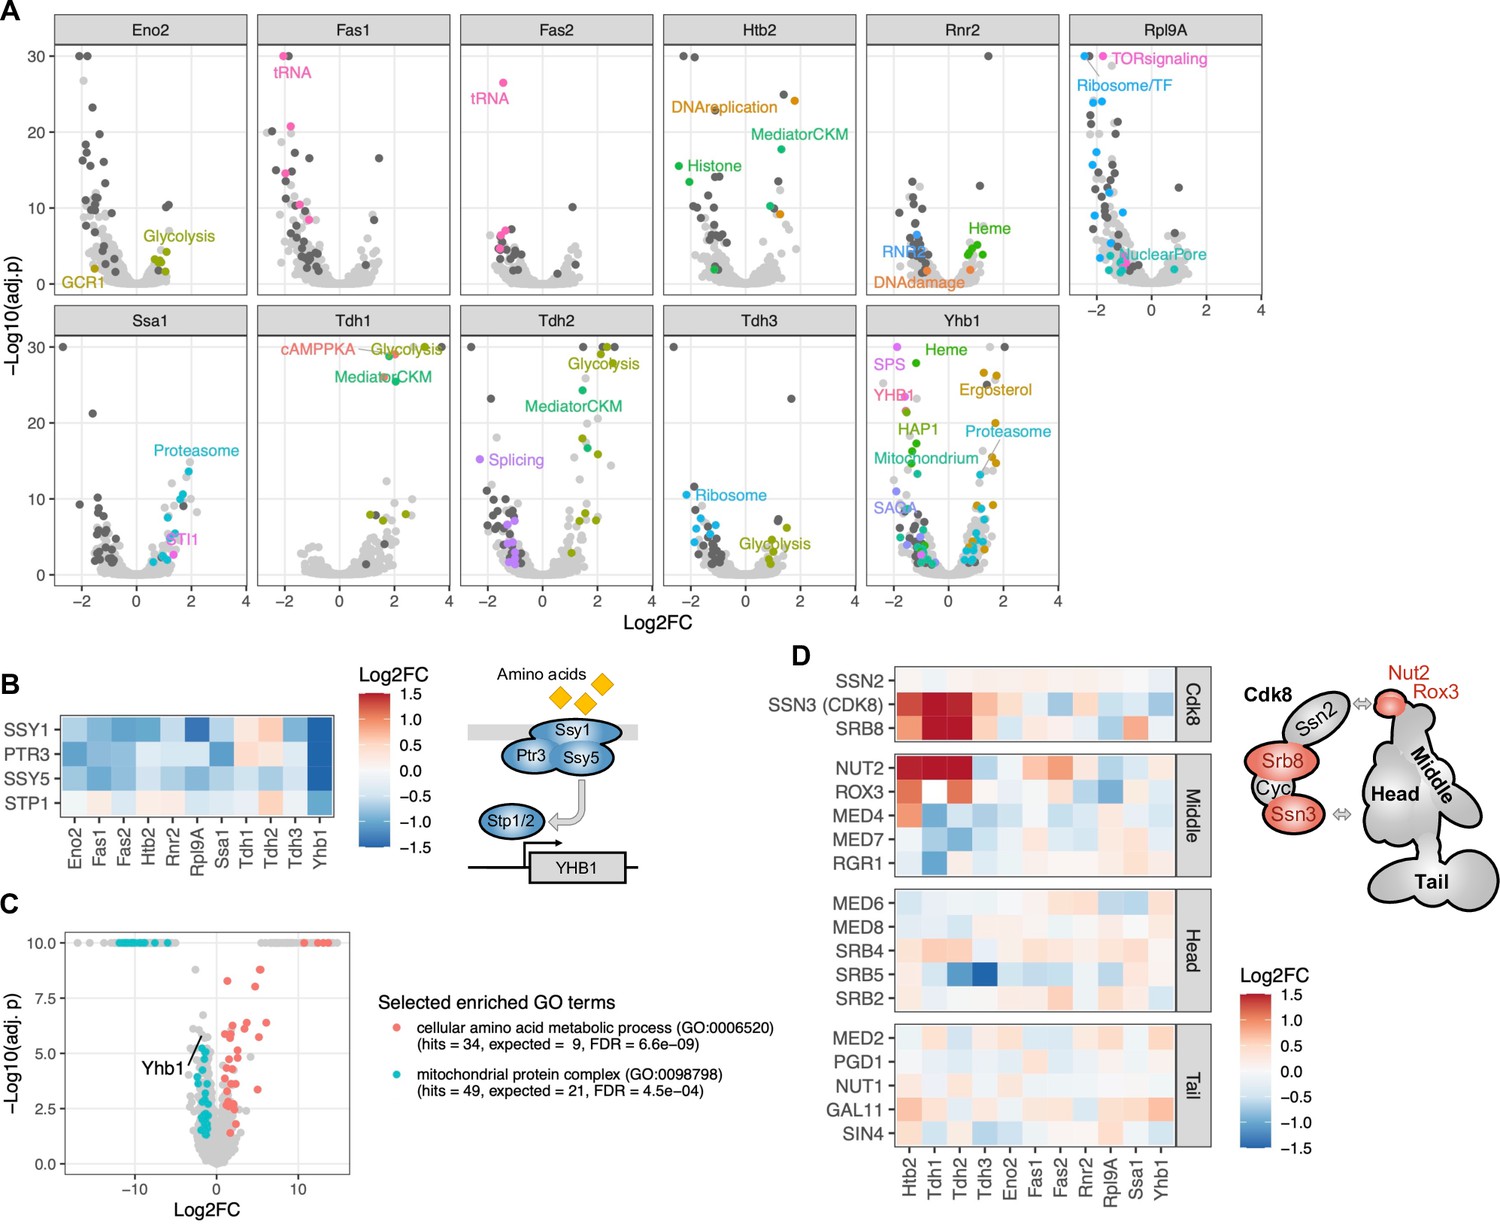
Regulators of protein abundance.
(A) Each volcano plot contains the results for a single protein, with each dot representing the effect of a gene’s perturbation on that protein. The vertical axis represents the negative logarithm of the FDR-corrected p-value. Selected dots are colored to highlight functional classes. Dark gray dots indicate genes that significantly affect eight or more proteins (FDR<0.05). (B) Heatmap showing effects of gene perturbations in the SPS amino acid sensor on the eleven proteins. In the scheme, all subunits with significant effect on Yhb1 are colored (FDR<0.05). (C) Volcano plot showing abundance changes of proteins in the SSY5 G638Q mutant compared to wild type as measured by LC-MS proteomics. The vertical axis represents the negative logarithm of the FDR-corrected p-value. Selected enriched functional categories (gene ontology (GO) terms) are colored. (D) Heatmap showing effects of gene perturbations in Mediator on the eleven proteins. In the scheme, all subunits with significant effects on Htb2 are colored (FDR<0.05); arrows indicate suggested interaction points between the Cdk8 module and mediator (Tsai et al., 2014; Tsai et al., 2013). The color scale for the heatmaps is capped at –1.5 and 1.5.
-
Figure 4—source data 1
Results of mass spectrometry-based proteomics analysis of individual mutant strains.
- https://cdn.elifesciences.org/articles/79525/elife-79525-fig4-data1-v1.xlsx
Figure 5 with 2 supplements
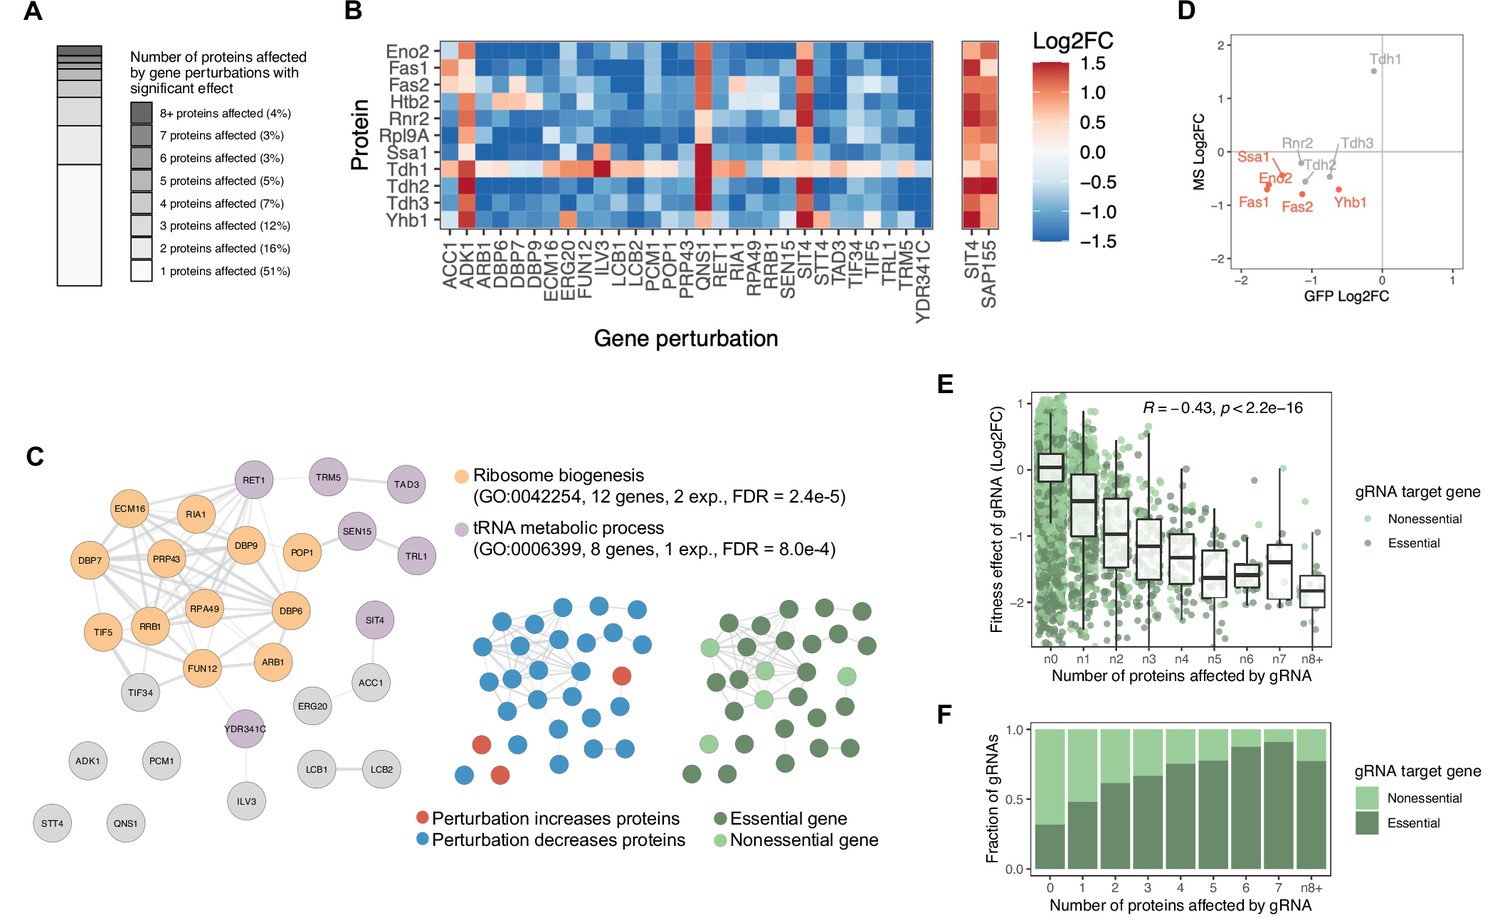
Gene perturbations with broad effects on protein abundance.
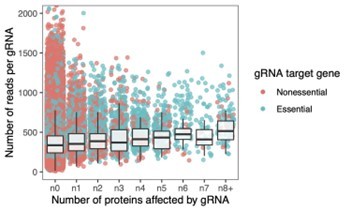
(A) Number of proteins significantly affected by each gene perturbation (FDR<0.05). The entire bar represents all gene perturbations with at least one significant effect on a protein. (B) Heatmap of protein-level effects of the 29 gene perturbations with broad effects (left panel) and of SIT4 and SAP155 gene perturbations for direct comparison (right panel). The color scale is capped at –1.5 and 1.5. (C) Network representation of the 29 genes with broad effects. Edges of the network reflect the overall confidence score for protein-protein interactions reported in the STRING database and colors represent enriched functional categories (orange: ribosome biogenesis, purple: tRNA metabolism) (Doncheva et al., 2018; Szklarczyk et al., 2020). Miniature networks are colored by the prevalent direction of effect on protein abundance (blue: decreased abundance, red: increased abundance) or by gene essentiality (light green: nonessential, dark green: essential). (D) Validation of observations from the base editor screen ('GFP') by LC-MS proteomics ('MS') for a hypomorphic mutation in POP1 (H642Y). Red data points reflect proteins that change significantly in both experiments upon POP1 perturbation (FDR<0.1). (E) For each gRNA, the fitness effect (vertical axis) is plotted against the number of proteins significantly affected by each gRNA (FDR<0.05) (horizontal axis). For the fitness analysis, the 24 hr base editor induction period with galactose was followed by 24 hr of growth in glucose media. Box plot overlays summarize the underlying data points (center line: median; box limits: first and third quartiles; whiskers: 1.5-fold interquartile range). The coloring of the data points reflects whether the gRNA targets an essential or nonessential gene. (F) The fraction of gRNAs targeting essential and nonessential genes as a function of the number of proteins significantly affected by each gRNA (FDR<0.05). Note that at the reference time point of the fitness experiment, there was no bias in read counts across the gRNAs affecting different numbers of proteins (data not shown).
-
Figure 5—source data 1
Results of fitness screen with 16,452 gRNAs.
- https://cdn.elifesciences.org/articles/79525/elife-79525-fig5-data1-v1.xlsx
Figure 5—figure supplement 1
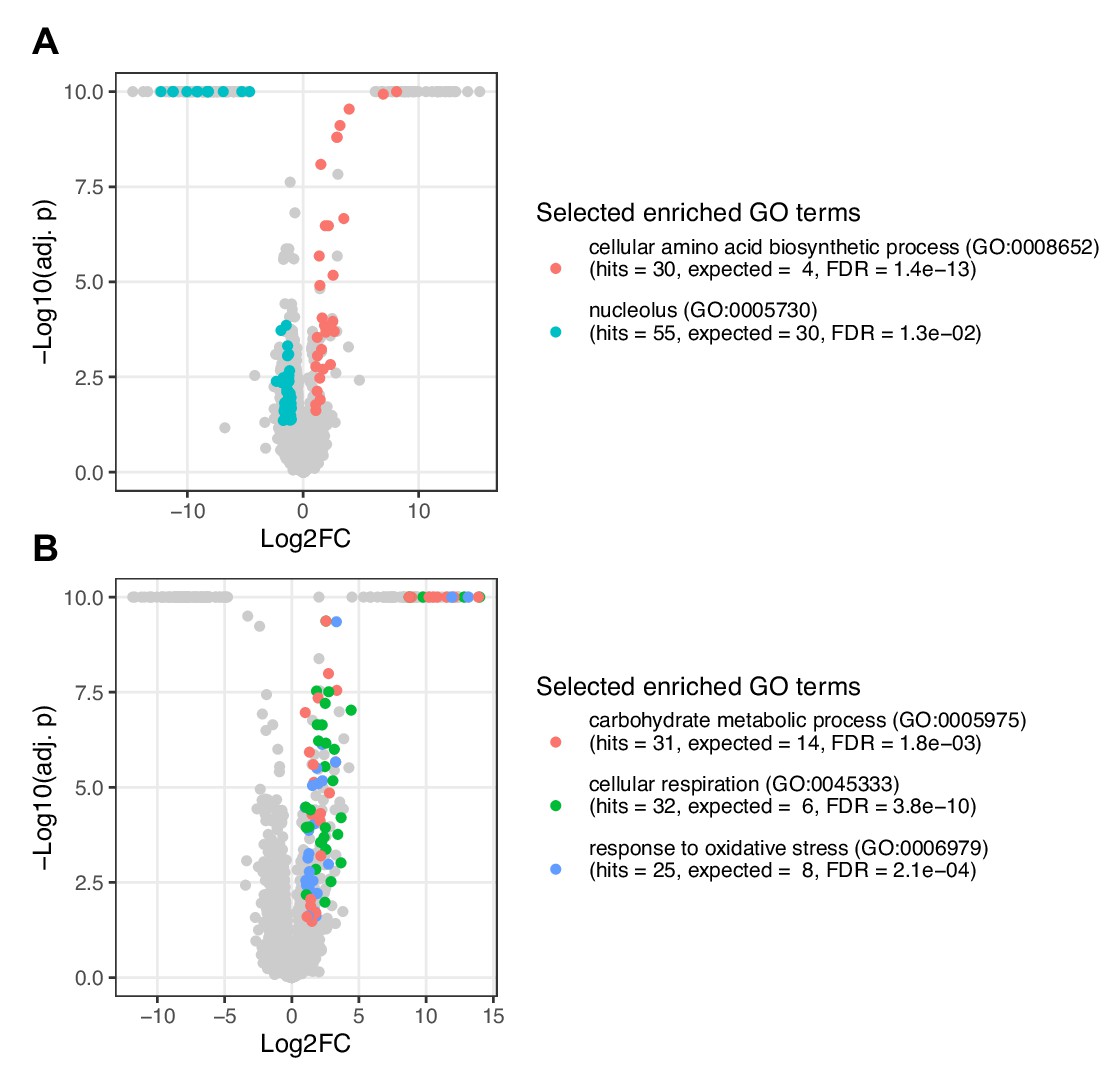
Proteomics analysis of POP1 and SIT4 mutants represented as volcano plot.
Shown are changes in protein abundances in response to genetic perturbations of the mutants (A) POP1 (H642Y) and (B) SIT4 (Q184*) compared to wildtype. Selected enriched functional categories (gene ontology (GO) terms) are colored. The underlying data is provided in Figure 4—source data 1.
Figure 5—figure supplement 2
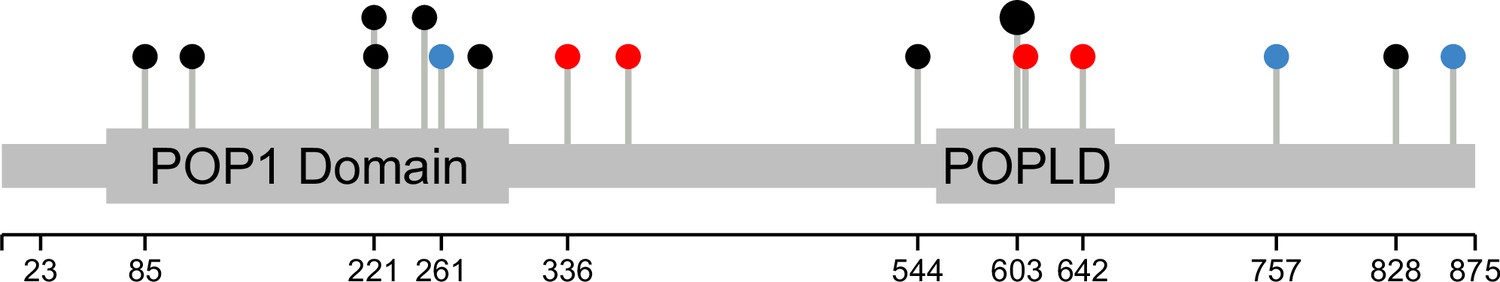
Base edits and natural variants across the POP1 gene.
All 14 gRNAs targeting the POP1 coding sequence are shown as pins along the gene. Annotated protein domains (PFAM) are indicated by wider bars. In red are gRNAs with significant effects on the abundance of at least one of the eleven proteins of interest. In blue are coding variants between the yeast strains BY S288C and RM11-1a. The larger pin head indicates two gRNAs targeting the same nucleotides. The plot was generated with the Lollipops software (Jay and Brouwer, 2016).
Figure 6

Regulators of the three GAPDH isoenzymes Tdh1, Thd2, and Tdh3.
(A) Pairwise comparison of effects of gene perturbations on Tdh1, Tdh2, and Tdh3 protein abundances. Only genes that upon perturbation affect both Tdh proteins significantly are shown (FDR<0.05). (B) Ras/cAMP/PKA pathway representation with components colored if they showed a significant signal for one or more of the GAPDH isoenzymes (red: activators, blue: inhibitors). The scheme in (B) has been adapted from Figure 1 from Peeters et al., 2017, with added Mck1 (Griffioen et al., 2003; Peeters et al., 2017). (C) Heatmap representing all genes involved in the PKA pathway that upon perturbation affect at least one of the three GAPDH isoenzymes significantly (FDR<0.1). (D) Effects of IRA2 W342* and RAS2 Q272* mutations on Tdh1 and Tdh2 protein abundance observed in the base editor screen (‘GFP’) and by LC-MS-based proteomics on the individual mutants ('MS'). (E) Effects of IRA2 W342*, RAS2 Q272* and RAS2 S46L mutations on Tdh1, Tdh2, and Tdh3 protein abundance observed in the base editor screen. The heatmap color scale is identical for C, D, and E, and is capped at –1 and 1.
Author response image 1
Author response image 2
Author response image 3
Additional files
-
Supplementary file 1
gRNAs used in this study.
- https://cdn.elifesciences.org/articles/79525/elife-79525-supp1-v1.xlsx
-
Supplementary file 2
Yeast strains used in this study.
- https://cdn.elifesciences.org/articles/79525/elife-79525-supp2-v1.xlsx
-
Supplementary file 3
Plasmids used in this study.
- https://cdn.elifesciences.org/articles/79525/elife-79525-supp3-v1.xlsx
-
Supplementary file 4
Primers used in this study.
- https://cdn.elifesciences.org/articles/79525/elife-79525-supp4-v1.xlsx
-
Supplementary file 5
Candidate causal genes for eQTL and pQTL hotspots.
The table lists candidate causal genes for previously described eQTL (Albert et al., 2018) and pQTL (Albert et al., 2014) hotspots identified in segregants of a cross between the S. cerevisiae strains BY S288C and RM11-1a. The candidate genes each affect at least three of our eleven proteins and contain at least one variant between BY and RM with a predicted medium or strong effect (i.e., missense mutation, indel, or premature stop codon). Note that the pQTLs were mapped for 160 proteins, five of which overlap with the eleven proteins studied here (Tdh1, Tdh3, Rpl9A, Ssa1, Yhb1); the eQTLs were mapped for transcripts of thousands of genes, including the genes encoding the eleven proteins studied here.
- https://cdn.elifesciences.org/articles/79525/elife-79525-supp5-v1.xlsx
-
MDAR checklist
- https://cdn.elifesciences.org/articles/79525/elife-79525-mdarchecklist1-v1.docx
Download links
A two-part list of links to download the article, or parts of the article, in various formats.
Downloads (link to download the article as PDF)
Open citations (links to open the citations from this article in various online reference manager services)
Cite this article (links to download the citations from this article in formats compatible with various reference manager tools)
Genome-wide base editor screen identifies regulators of protein abundance in yeast
eLife 11:e79525.
https://doi.org/10.7554/eLife.79525


