Inflammatory stress signaling via NF-kB alters accessible cholesterol to upregulate SREBP2 transcriptional activity in endothelial cells
- Vascular Biology and Therapeutics Program, Department of Pharmacology, Yale University School of Medicine, United States
Figures
Figure 1 with 1 supplement
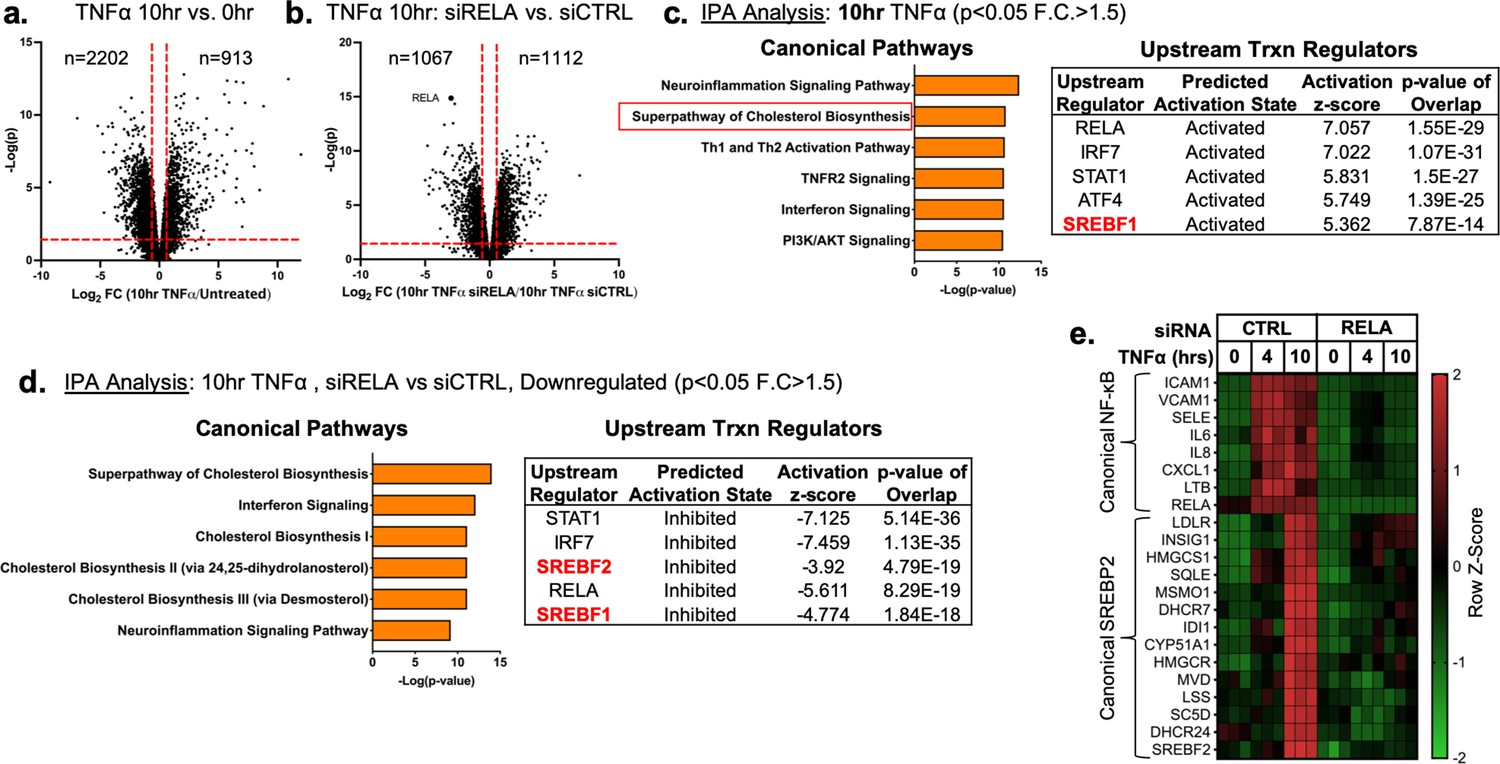
TNFα and NF-κB control SREBP2-dependent gene expression in human endothelial cells.
Primary HUVEC were treated siRNA against non-targeting sequence (siCTRL) or RELA for 48 hr and then incubated with or without 10 ng/mL TNFα for 10 hr. (a) Volcano plot for RNA-seq analysis of differentially expressed genes. Dotted red lines indicate cutoff used for IPA analysis (p<0.05, 1.5<Fold Change (F.C)<−1.5). (b) IPA analysis of most significant canonical pathways and predicted upstream transcriptional regulators for genes that increase at 10 hr TNFα. (c) IPA analysis of most significant canonical pathways and predicted upstream transcriptional regulators for genes that decrease in cells knocked down with RELA siRNA and treated 10 hr TNFα compared to control cells treated with 10 hr TNFα. (d) Representative heatmap of NF-κB and SREBP2 transcriptionally controlled genes from (b) and (c) showing three independent donors.
Figure 1—figure supplement 1

Complete transcriptomic pathway analysis in HUVEC treated with TNFa for 0, 4, and 10 hr and with or with RELA siRNA.
(a) Ingenuity pathway analysis for pathways and upstream transcription regulators using differentially expressed genes (upregulated) in HUVEC after 4 hr TNFα treatment (F.C.>1.5; p<0.05). (b) Metacore metabolic network analysis using upregulated genes from (Figure 1a) (p<0.005). (c) GSEA hallmark analysis using upregulated genes from (Figure 1a). (d) Ingenuity pathway analysis of gene set overlap between significantly upregulated genes in 10 hr TNFα compared to 0 hr TNFα and significantly downregulated genes after 10 hr TNFα and in siRELA compared to siCTRL.
Figure 2 with 1 supplement
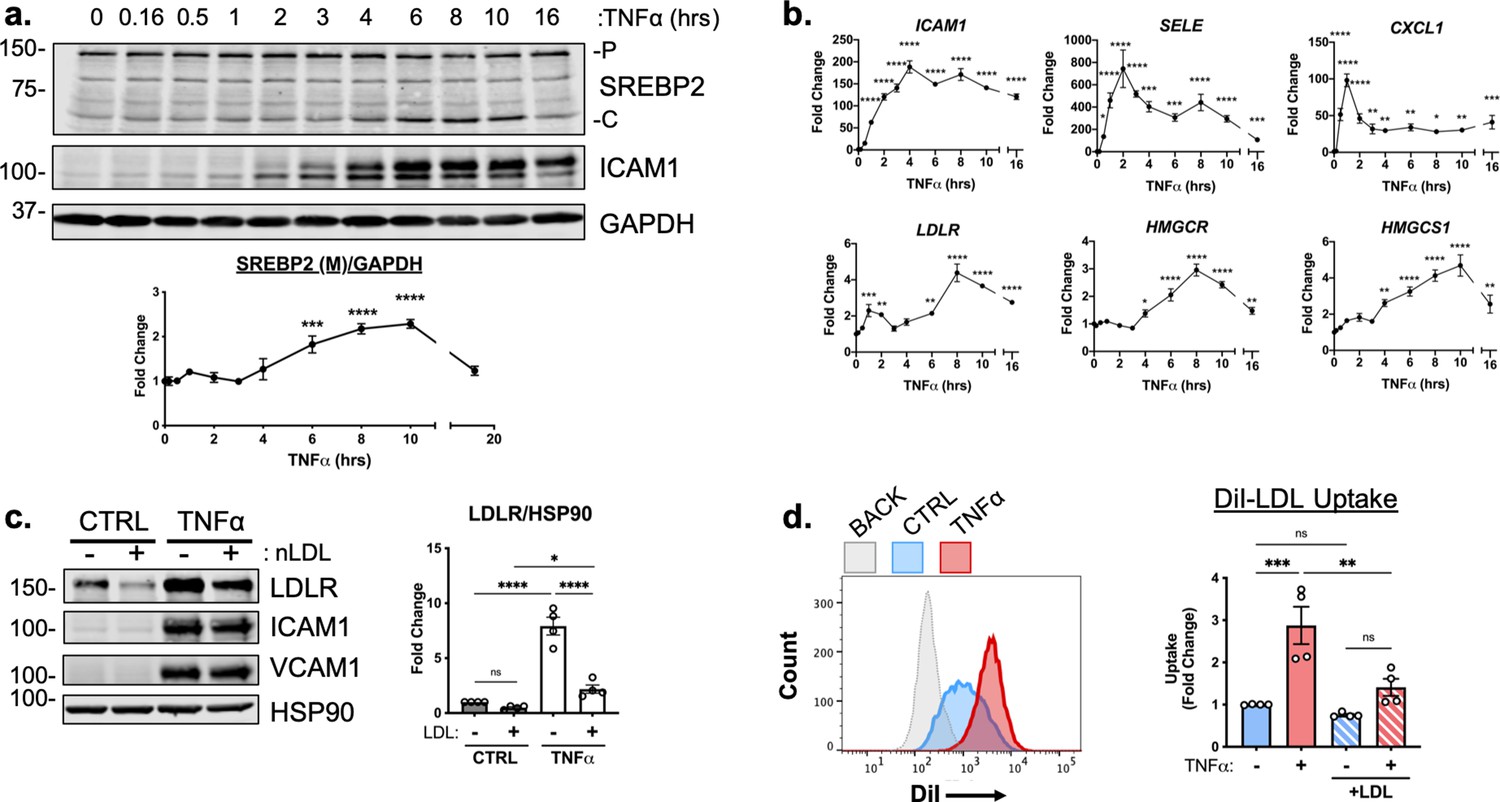
TNFα increases SREBP2 cleavage and transcription of canonical sterol-responsive genes.
(a) SREBP2 immunoblot from whole-cell lysates from HUVEC treated with TNFα (10 ng/mL) for indicated time. Data are normalized to respective GAPDH and then to untreated cells (n=3). (b) qRT-PCR analysis of RNA from HUVEC treated with TNFα (10 ng/mL) for indicated time. Data are normalized to respective ACTB and then to untreated cells (n=8). (c) LDLR protein levels of TNFα-treated HUVEC treated with or without native LDL (25 μg/mL). Data are normalized to respective HSP90 levels and then to untreated cells (n=4). (d) Flow cytometry analysis of exogenous DiI-LDL uptake in HUVEC treated with TNFα and with indicated media. 2.5 μg/mL DiI-LDL was incubated for 1 hr at 37 °C before processing for flow cytometry. Uptake was quantified by PE mean fluorescence intensity per cell and normalized to untreated cells in LPDS across two experiments (10,000 events/replicate, n=4). *p<0.05; **p<0.01; ***p<0.001; ***p<0.0001 by one-way ANOVA with Dunnett’s multiple comparisons test (a and b) or two-way ANOVA with Sidak’s multiple comparisons test (c and d).
-
Figure 2—source data 1
Blots corresponding to Figure 2a and c.
- https://cdn.elifesciences.org/articles/79529/elife-79529-fig2-data1-v2.pdf
-
Figure 2—source data 2
Raw data supporting Figure 2a-d.
- https://cdn.elifesciences.org/articles/79529/elife-79529-fig2-data2-v2.xlsx
Figure 2—figure supplement 1
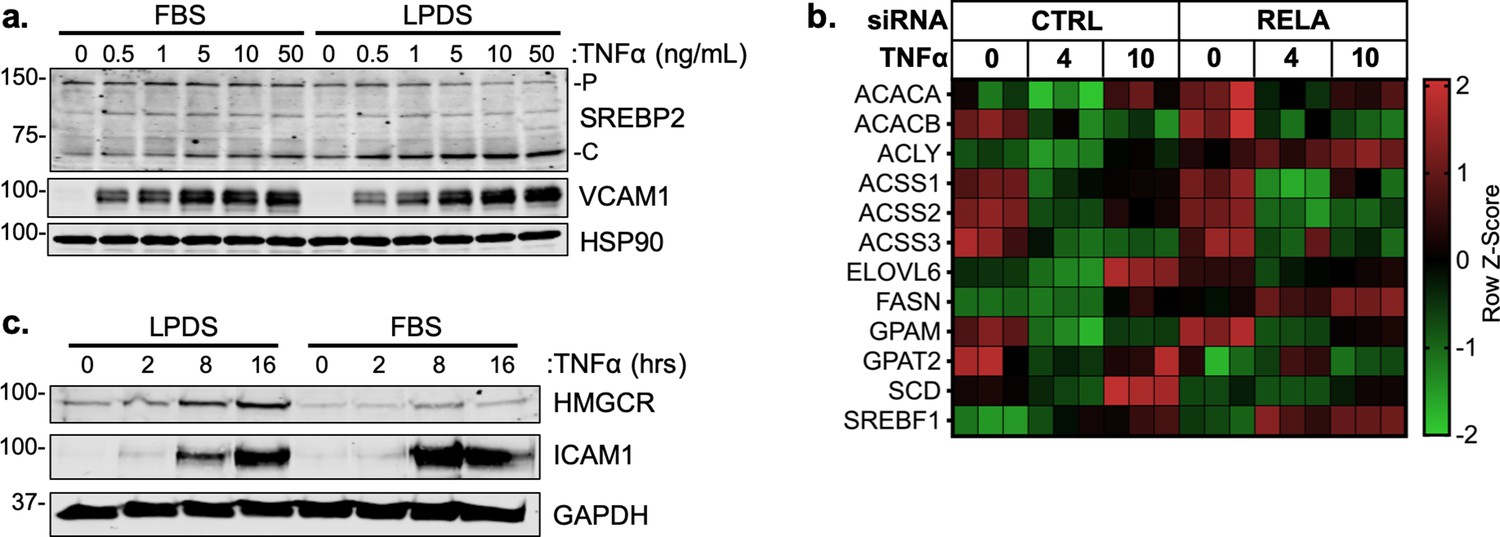
TNFa predominantly activates targets involved in cholesterol biosynthesis, not fatty acid synthesis.
(a) Representative SREBP2 immunoblot from whole-cell lysates from HUVEC treated with TNFα (16 hr) at indicated dose. Cells were incubated with fetal bovine serum (FBS) or lipoprotein depleted serum (LPDS). (b) Heatmap of classical SREBP1-dependent fatty acid synthesis genes from previous RNA-seq analysis. (c) Representative HMGCR immunoblot of HUVEC treated with TNFα (10 ng/mL) for indicated time and media.
-
Figure 2—figure supplement 1—source data 1
Blots corresponding to Figure 2—figure supplement 1a and c.
- https://cdn.elifesciences.org/articles/79529/elife-79529-fig2-figsupp1-data1-v2.pdf
Figure 3
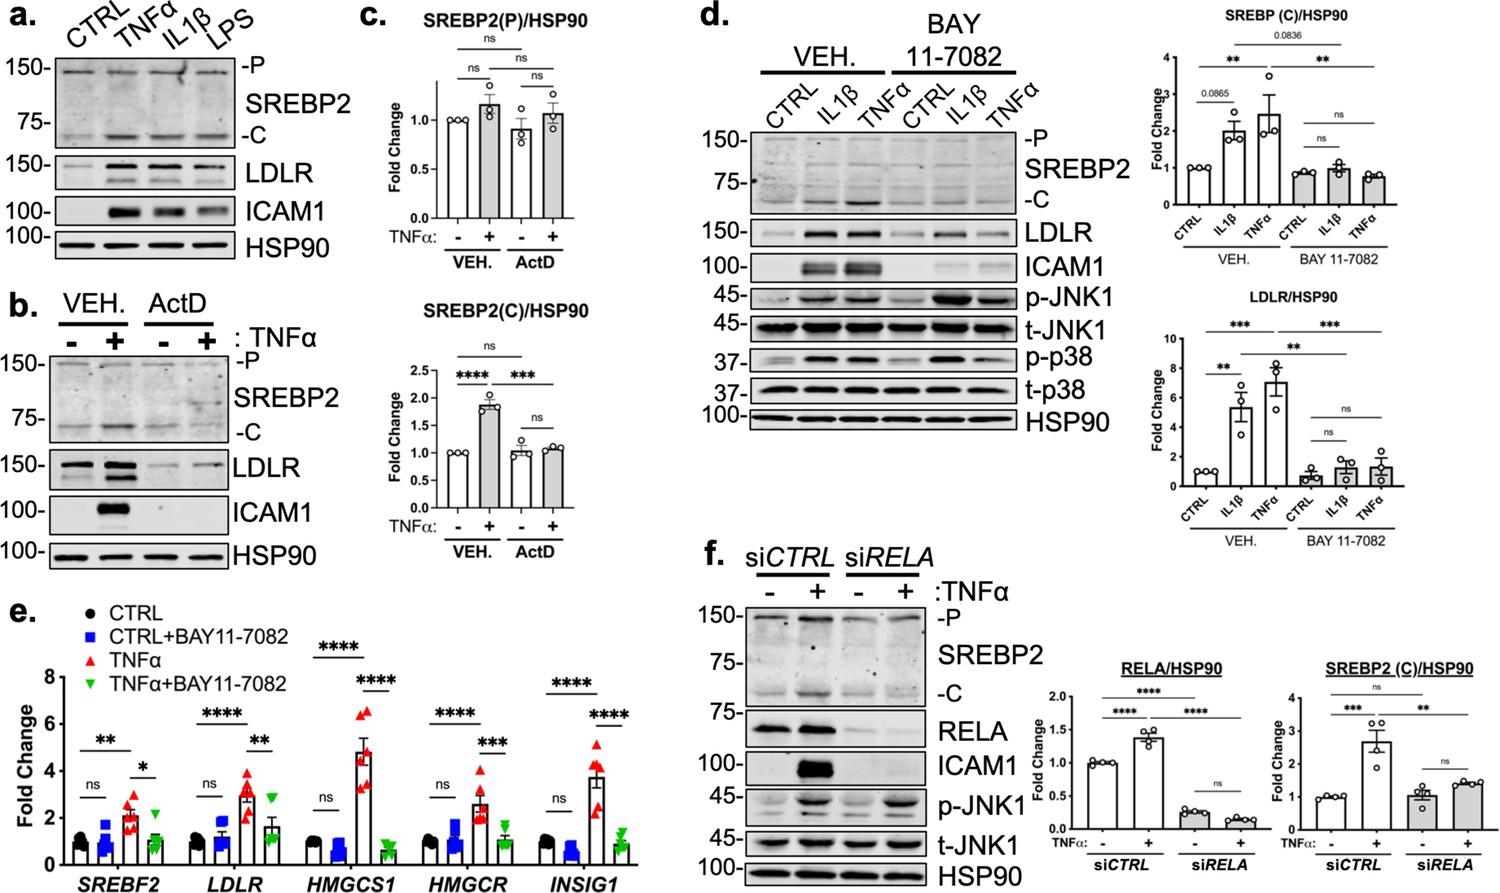
RELA DNA-binding is necessary for activation of SREBP2 by inflammatory stress.
(a) Representative immunoblot of SREBP2 and LDLR protein levels in HUVEC treated with TNFα (10 ng/mL), IL1β (10 ng/mL), or LPS (100 ng/mL). (b) Representative immunoblot of SREBP2 and LDLR protein levels in HUVEC treated with actinomycin D (ActD, 10 ng/mL) and with or without TNFα (10 ng/mL). (c) Quantification of SREBP2 precursor (p) and cleaved (c) from (b). Data are normalized to respective HSP90 and then to untreated cells (n=4). (d) SREBP2 and LDLR protein levels in HUVEC treated with IL1β (10 ng/mL) or TNFα (10 ng/mL) and with or without NF-κB inhibitor, BAY11-7082 (5 μM). Data are normalized to respective HSP90 and then to untreated cells (n=3). (e) qRT-PCR analysis of SREBP2-dependent genes, SREBF2, LDLR, HMGCS1, HMGCR, and INSIG1, expression in HUVEC treated with or without TNFα (10 ng/mL) and BAY11-7082 (5 μM). Data are normalized to respective ACTB and then to untreated cells (n=6). (f) SREBP2 and RELA levels in TNFα (10 ng/mL)-treated HUVEC treated with or without siRNA targeting RELA. Data are normalized to respective HSP90 and then to untreated cells (n=4). *p<0.05; **p<0.01; ***p<0.001; ***P<0.0001 by one-way ANOVA (c, d, and f) or two-way ANOVA (e) with Tukey’s multiple comparison’s test.
-
Figure 3—source data 1
Blots corresponding to Figure 3a, b, d and f.
- https://cdn.elifesciences.org/articles/79529/elife-79529-fig3-data1-v2.pdf
-
Figure 3—source data 2
Raw data supporting Figure 3c, d, e and f.
- https://cdn.elifesciences.org/articles/79529/elife-79529-fig3-data2-v2.xlsx
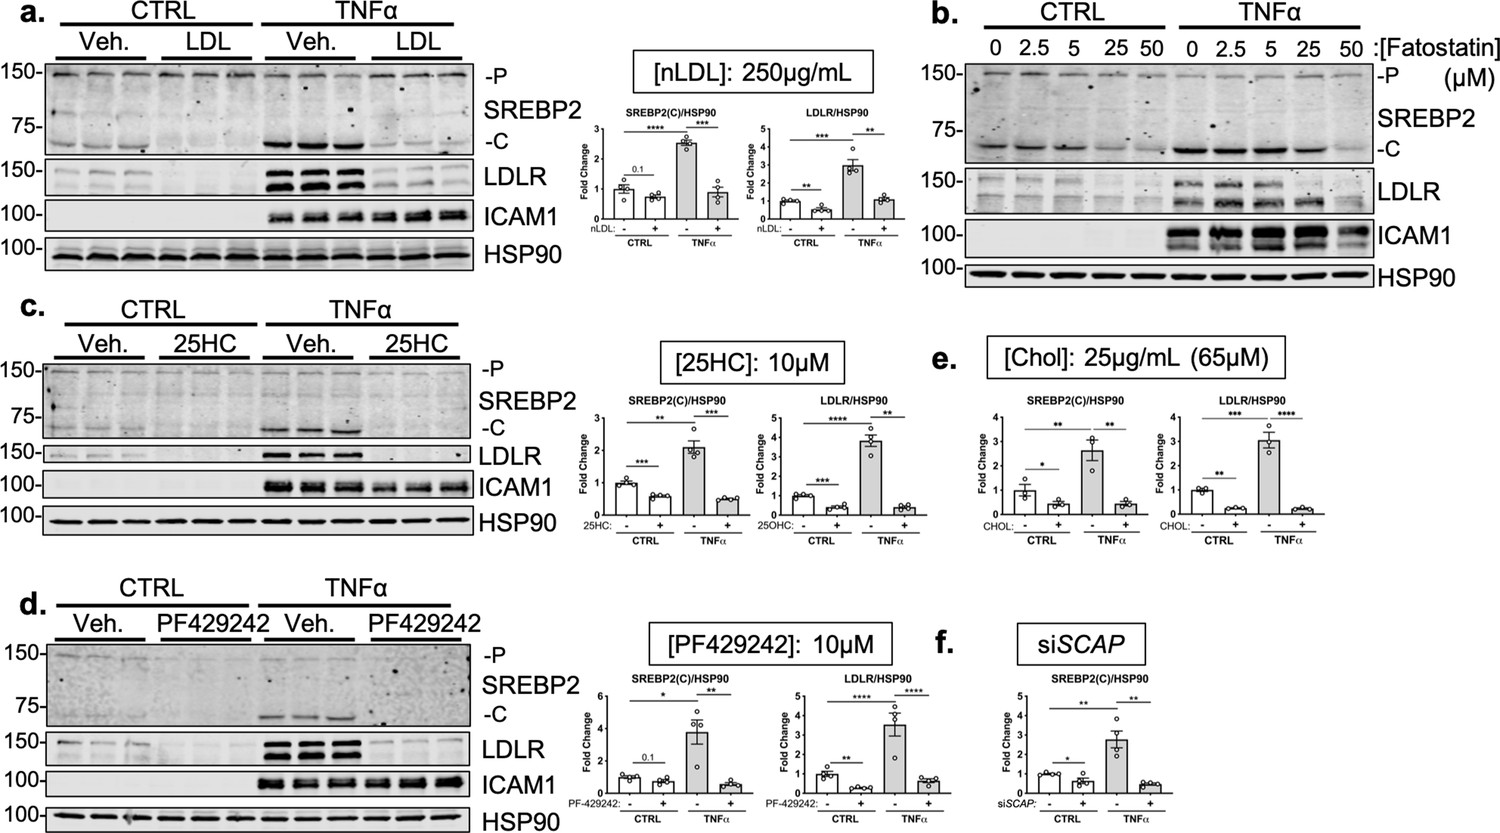
Figure 4 with 1 supplement
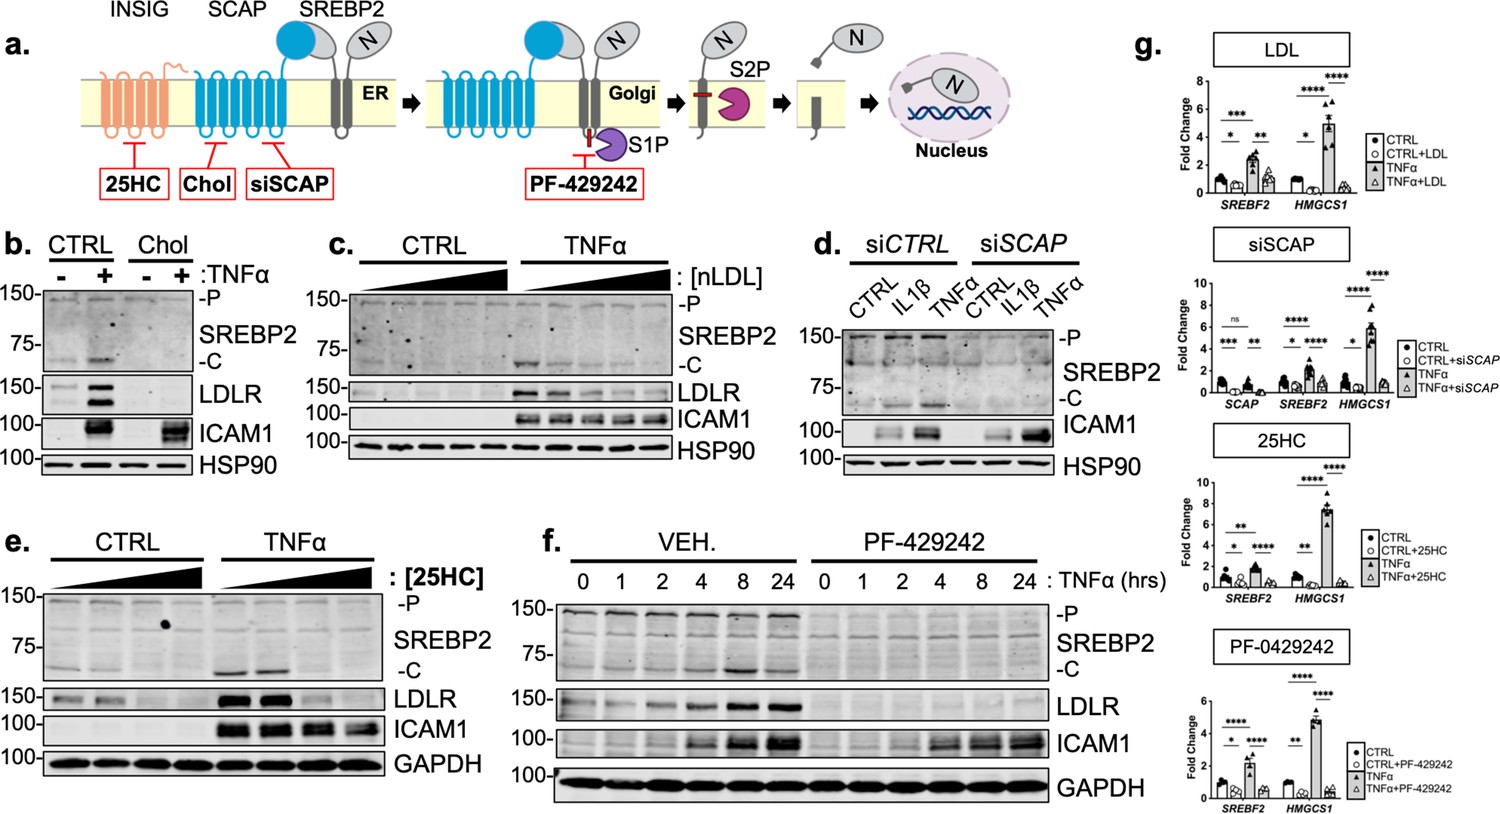
Cytokine-mediated upregulation of SREBP2 cleavage requires proper SCAP shuttling and proteolytic processing in the Golgi.
(a) Schematic of where 25-hyroxycholesterol (25HC), cholesterol, siSCAP, and PF-429242 inhibit SREBP processing throughout the pathway. (b) Representative immunoblot of SREBP2 and LDLR protein levels in HUVEC treated with TNFα (10 ng/mL) and cholesterol (Chol) (25 μg/mL). Data are normalized to respective HSP90 and then to untreated cells. (c) Representative immunoblot of SREBP2 and LDLR protein levels in HUVEC treated with TNFα (10 ng/mL) and increasing concentrations of LDL. Data are normalized to respective HSP90 and then to untreated cells. (d) Representative immunoblot SREBP2 cleavage in HUVEC treated with IL1β (10 ng/mL) or TNFα (10 ng/mL) and SCAP siRNA. Data are normalized to respective HSP90 and then to untreated cells. (e) Representative immunoblot of SREBP2 and LDLR protein levels in HUVEC treated with TNFα (10 ng/mL) and increasing concentrations of 25-hydroxycholesterol (25HC). Data are normalized to respective HSP90 and then to untreated cells. (f) Representative immunoblot of SREBP2 and LDLR protein levels in HUVEC treated with TNFα (10 ng/mL) and PF-429242 (10 μM) for indicated time. Data are normalized to respective HSP90 and then to untreated cells. (g) qRT-PCR analysis of SREBF2, HMGCS1, and SCAP from RNA of HUVECs treated with TNFα (10 ng/mL) and indicated SREBP2 inhibitor. Data are normalized to respective ACTB and then to untreated cells (n=6). *p<0.05; **p<0.01; ***p<0.001; ***p<0.0001 by two-way ANOVA with Sidak’s multiple comparisons test.
-
Figure 4—source data 1
Blots corresponding to Figure 4b, c, d, e and f.
- https://cdn.elifesciences.org/articles/79529/elife-79529-fig4-data1-v2.pdf
-
Figure 4—source data 2
Raw data supporting Figure 4g and Figure 4—figure supplement 1 a, c, d, e, and f.
- https://cdn.elifesciences.org/articles/79529/elife-79529-fig4-data2-v2.xlsx
Figure 4—figure supplement 1
Immunoblots of SREBP2 processing inhibitors at effective doses.
(a) SREBP2 and LDLR protein levels in HUVEC treated with TNFα (10 ng/mL) and with or without low density lipoprotein (LDL) (250 μg/mL). Data are normalized to respective HSP90 and then to untreated cells (n=4). (b) Representative immunoblot of SREBP2 and LDLR protein levels in HUVEC treated with TNFα (10 ng/mL) and increasing concentrations of fatostatin. (c) SREBP2 and LDLR protein levels in HUVEC treated with TNFα (10 ng/mL) and with or without 25-hydroxycholesterol (25HC) (10 μM). Data are normalized to respective HSP90 and then to untreated cells (n=4). (d) SREBP2 and LDLR protein levels in HUVEC treated with TNFα (10 ng/mL) and with or without PF-429242 (10 μM). Data are normalized to respective HSP90 and then to untreated cells (n=4). (e) Quantification of SREBP2 and LDLR protein levels in HUVEC treated with TNFα (10 ng/mL) and with or without MβCD-cholesterol (Chol) (65 μM). Data are normalized to respective HSP90 and then to untreated cells (n=3). (f) Quantification of SREBP2 protein levels in HUVEC treated with TNFα (10 ng/mL) and with or without siSCAP. Data are normalized to respective HSP90 and then to untreated cells (n=4). *p<0.05; **p<0.01; ***p<0.001; ***p<0.0001 by two-way ANOVA with Sidak’s multiple comparisons test.
-
Figure 4—figure supplement 1—source data 1
Blots corresponding to Figure 4—figure supplement 1a, b, c, and d.
- https://cdn.elifesciences.org/articles/79529/elife-79529-fig4-figsupp1-data1-v2.pdf
Figure 5 with 1 supplement
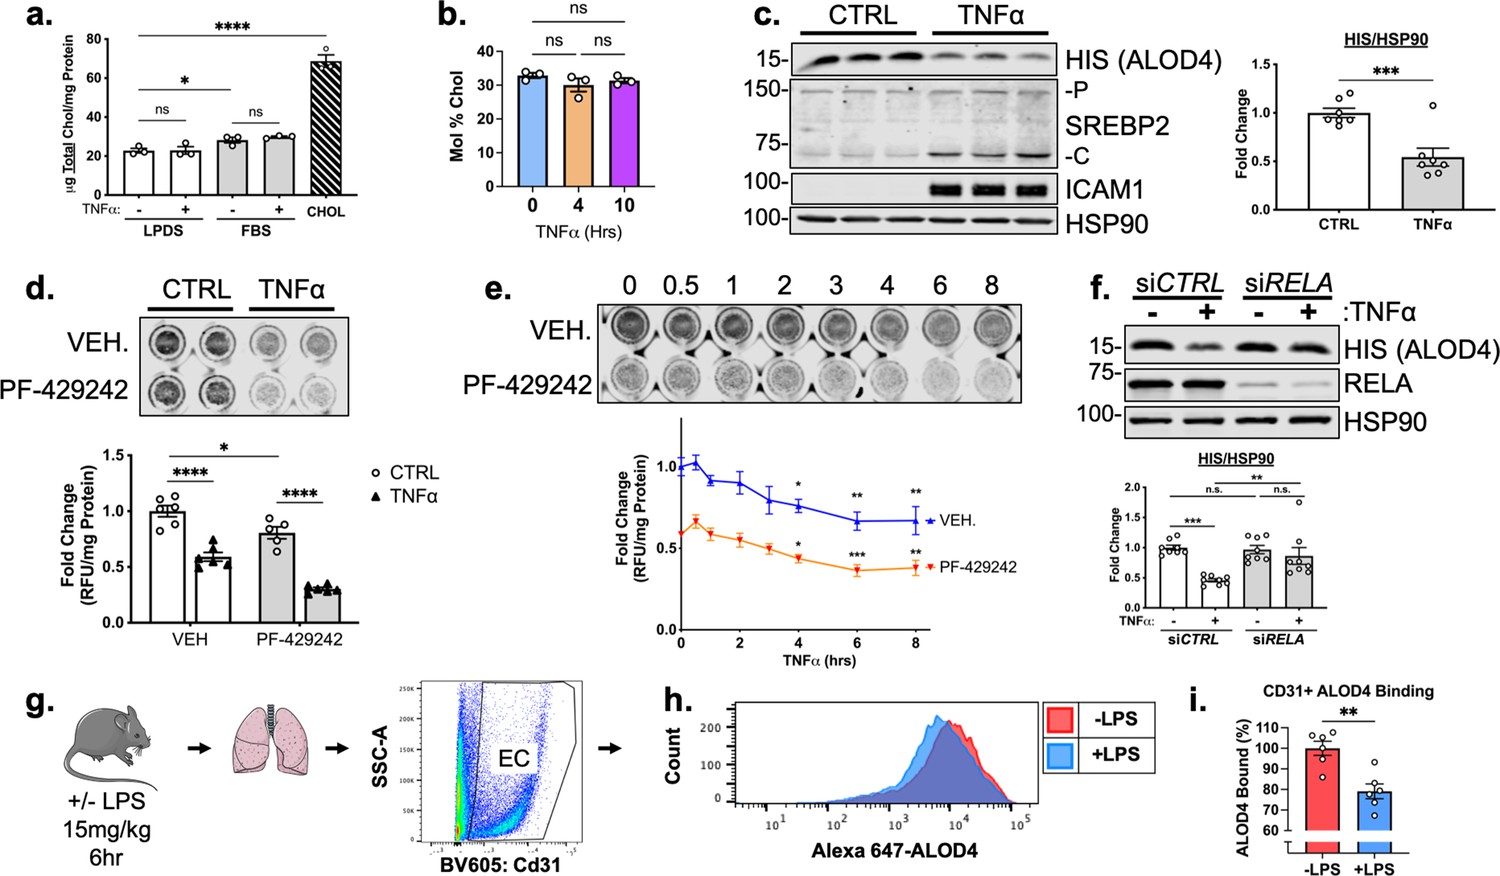
TNFα decreases accessible cholesterol in cultured HUVEC and mouse lung ECs in vivo.
(a) Quantification of total cholesterol extracted from HUVEC treated with or without TNFα (10 ng/mL) and indicated positive controls, lipoprotein deficient serum (LPDS), fetal bovine serum (FBS), or MβCD-cholesterol. Data were normalized to respective total protein (n=3). (b) Total cholesterol in HUVEC after 4 or 10 hr of TNFα (10 ng/mL) quantified by mass spectrometry (n=3). (c) ALOD4 protein levels in HUVEC treated with TNFα (10 ng/mL). Data are normalized to respective HSP90 and then to untreated cells (n=7). (d) In-cell western blot of ALOD4 protein levels in HUVEC treated with TNFα (10 ng/mL) and PF-429242 (10 μM). Data are normalized to respective total protein and then to untreated cells (n=6). (e) In-cell western blot of ALOD4 protein levels in HUVEC treated with TNFα (10 ng/mL) and PF-429242 (10 μM) for indicated time. Data are normalized to respective total protein and then to untreated cells (n=6). (f) ALOD4 protein levels in TNFα (10 ng/mL)-treated HUVEC treated with or without RELA siRNA. Data are normalized to respective HSP90 and then to untreated cells (n=8). (g) Schematic of protocol to isolate mouse lung endothelial cells and quantify ALOD4 binding by flow cytometry. (h) Representative histogram of ALOD4 binding in Cd31 +lung endothelial cells in mice treated with or without LPS (15 mg/kg) for 6 hr. (i) Quantification of ALOD4 binding across 2 flow cytometry experiments in mice treated with or without LPS (15 mg/kg). Binding was quantified as AlexaFluor647 mean fluorescent intensity per cell (100,000 events/replicate). Data are normalized to nontreated mice (-LPS, n=6;+LPS, n=6). *p<0.05; **p<0.01; ***p<0.001; ***p<0.0001 by one-way ANOVA with Tukey’s multiple comparison’s test (a and d) or Dunnett’s multiple comparisons test (e), unpaired t-test (c and i), or two-way ANOVA with Sidak’s multiple comparisons test (f).
-
Figure 5—source data 1
Blots corresponding to Figure 5c and f.
- https://cdn.elifesciences.org/articles/79529/elife-79529-fig5-data1-v2.pdf
-
Figure 5—source data 2
Raw data supporting Figure 5a, c, d, e, f and i and Figure 5—figure supplement 1e, f, g, and h.
- https://cdn.elifesciences.org/articles/79529/elife-79529-fig5-data2-v2.xlsx
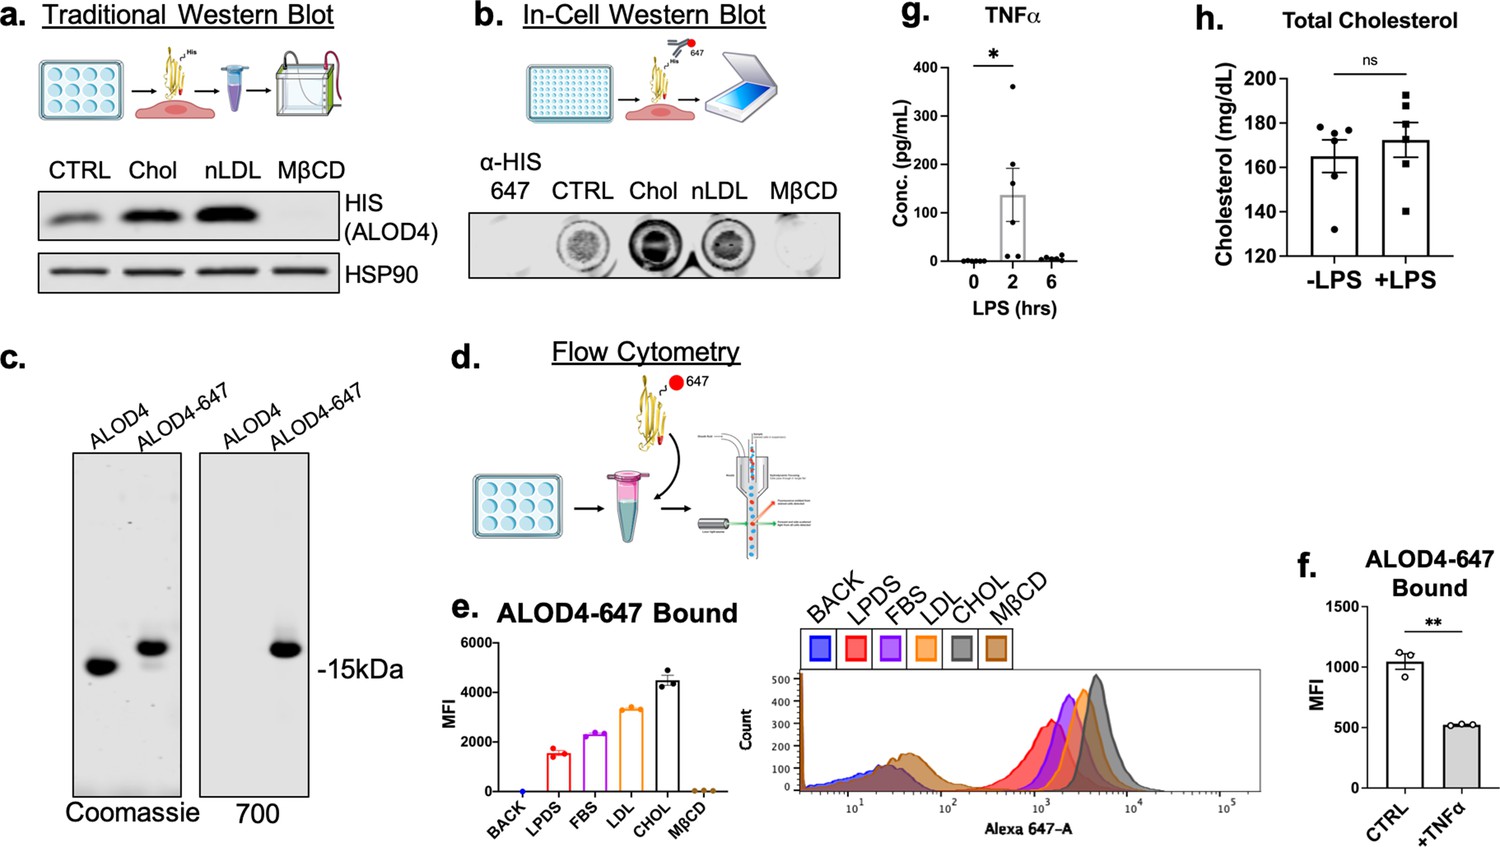
Figure 5—figure supplement 1
Optimization of assays used to quantify accessible cholesterol on cellular plasma membranes.
(a) Diagram of pipeline for immunoblotting protocol to quantify EC accessible cholesterol (top). Representative immunoblot of HIS (ALOD4) after treatment with cholesterol modifying agents: MβCD-cholesterol (Chol) (25 μg/mL), LDL (100 μg/ml), or MβCD (1%) (bottom). (b) Diagram of pipeline for in-cell Western blotting protocol to quantify EC accessible cholesterol (top). Representative in-cell western blot of secondary alone (α-HIS-647) or HIS (ALOD4) after treatment with cholesterol modifying agents: MβCD-cholesterol (Chol) (25 μg/mL), LDL (100 μg/ml), or MβCD (1%) (bottom). (c) Representative SDS-PAGE gel of purified unconjugated ALOD4 and fluorescent ALOD4-647 stained with Coomassie (left) or recorded with the 700 nm channel on LICOR Biosciences Odyssey CLx platform. (d) Schematic of flow cytometry pipeline to quantify ALOD4 binding in cultured ECs with ALOD4-647. (e) Flow cytometry analysis of bound ALOD4-647 per HUVEC after treatment with positive controls, lipoprotein depleted serum (LPDS), fetal bovine serum (FBS), LDL (100 μg/mL), MβCD-cholesterol (Chol) (25 μg/mL), or MβCD (1%). ALOD4 binding was quantified by mean fluorescence intensity of AlexaFluor647 channel (10,000 events/replicate, n=3). (f) Flow cytometry analysis of ALOD4-647 bound to HUVEC treated with TNFα (10 ng/mL) for 16 hr. ALOD4 binding was quantified by mean fluorescence intensity of AlexaFluor647 channel (10,000 events/replicate, n=3). (g) Circulating TNFα from serum of mice treated with LPS (15 mg/kg) for 2 or 6 hr (n=6). (h) Total cholesterol from serum of mice used in (Figure 5g) (n=6). *p<0.05; **p<0.01; ***p<0.001; ***p<0.0001 by unpaired t-test (f and g) or one-way ANOVA with Tukey’s multiple comparison’s test.
-
Figure 5—figure supplement 1—source data 1
Blots corresponding to Figure 5—figure supplement 1a and c.
- https://cdn.elifesciences.org/articles/79529/elife-79529-fig5-figsupp1-data1-v2.pdf
Figure 6 with 3 supplements
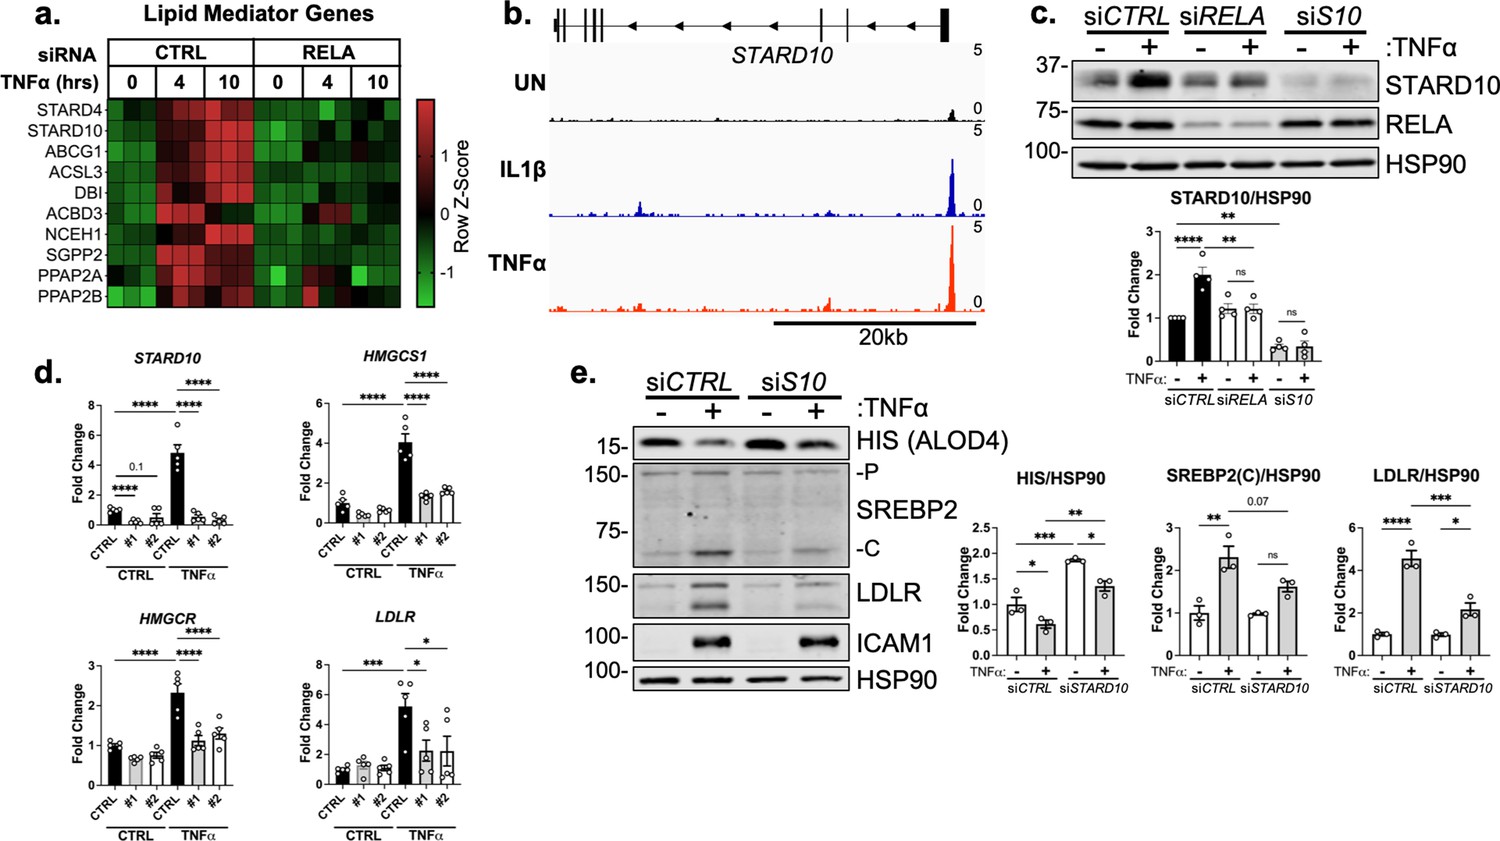
STARD10 is necessary for complete TNFα-mediated accessible cholesterol reduction and SREBP2 activation.
(a) Heatmap of genes that regulate lipid homeostasis, significantly increased with TNFα (10 ng/mL) treatment after 4 or 10 hr, and were significantly inhibited by RELA knockdown. (b) STARD10 gene locus from RELA ChIP-seq analysis of human aortic endothelial cells (HAEC) treated with TNFα (2 ng/mL) or IL1β (10 ng/mL) for 4 hr. Data are scaled from 0 (bottom) to 5 (top). Data originated from GSE89970. (c) Immunoblot of STARD10 protein levels in HUVEC treated with RELA or STARD10 (S10) siRNA and with or without TNFα (10 ng/mL). Data are normalized to respective HSP90 levels and then to untreated cells (n=4). (d) qRT-PCR analysis of RNA from HUVEC treated with TNFα (10 ng/mL) and two independent siRNA targeting STARD10 (#1,#2). Data are normalized to respective ACTB and then to untreated cells (n=5). (e) Immunoblot of ALOD4, SREBP2, and LDLR protein levels in HUVEC treated with STARD10 siRNA (siS10) and with or without TNFα (10 ng/mL). Data are normalized to respective HSP90 levels and then to untreated cells (n=3). *p<0.05; **p<0.01; ***p<0.001; ***p<0.0001 by two-way ANOVA with Sidak’s multiple comparisons test (d and e).
-
Figure 6—source data 1
Blots corresponding to Figure 6c and e.
- https://cdn.elifesciences.org/articles/79529/elife-79529-fig6-data1-v2.pdf
-
Figure 6—source data 2
Raw data supporting Figure 6c, d and e, Figure 6—figure supplement 1 c and e, and Figure 6—figure supplement 3c.
- https://cdn.elifesciences.org/articles/79529/elife-79529-fig6-data2-v2.xlsx
Figure 6—figure supplement 1
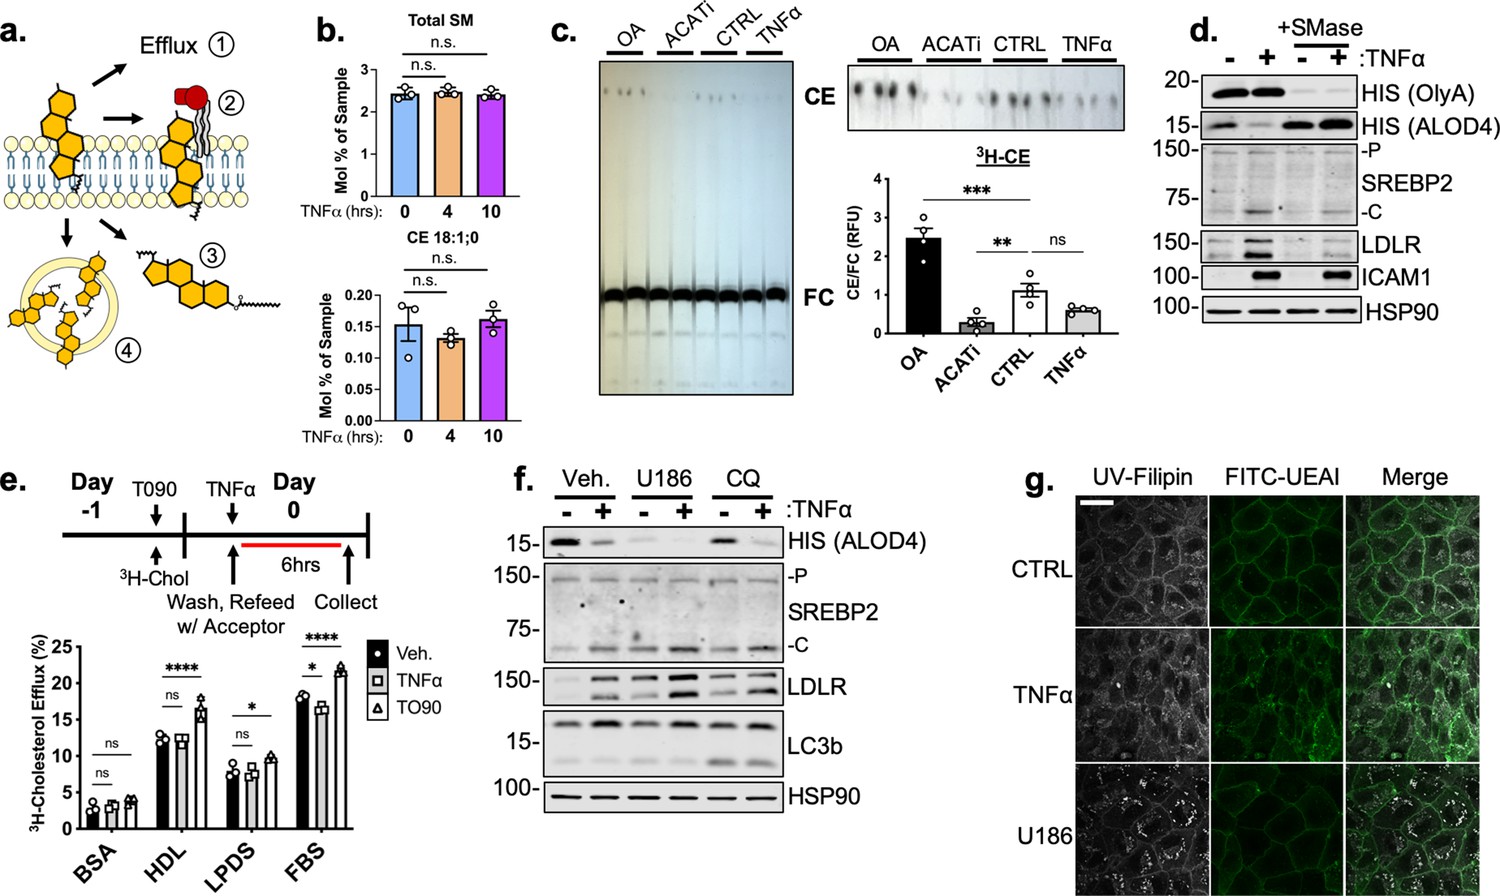
Complete analysis of common cholesterol transport mechanisms in HUVEC under inflammatory stress.
(a) Schematic of possible mechanisms to deplete plasma membrane accessible cholesterol: (1) efflux, (2) sphingomyelin shielding, (3) esterification, and (4) lysosomal/endosomal accumulation. (b) Total sphingomyelin (SM) and cholesteryl ester (CE) content in HUVEC after 4 or 10 hr of TNFα (10 ng/mL) quantified by mass spectrometry (n=3). (c) Thin layer chromatography of 3H-cholesterol isolated from HUVEC treated with oleic acid (OA) (0.5 mM), Sandoz 58–035 (ACATi) (1 μM), or TNFα (10 ng/mL) for 16 hr. Esterification was quantified as a ratio between cholesteryl ester (CE) and free cholesterol (FC) (n=4). (d) Representative immunoblot of OlyA, ALOD4, SREBP2, and LDLR protein levels in HUVEC treated with TNFα (10 ng/mL) and sphingomyelinase (SMase) (100mU/mL). (e) Schematic of protocol for measurement of cholesterol efflux (top). 3H-cholesterol efflux in HUVEC treated with T0901317 (T090) (5 μM) or TNFα (10 ng/mL) and with indicated acceptors, BSA, HDL, lipoprotein depleted serum (LPDS), or fetal bovine serum (FBS). Efflux was quantified as the ratio of 3H-cholesterol in the media compared to lysates (n=4). (f) Immunoblot of ALOD4, SREBP2, and LDLR protein levels in HUVEC treated with U18666A (U186) (5 μM) or choloroquine (CQ) (10 μM) and with or without TNFα (10 ng/mL). Data are normalized to respective HSP90 and then to untreated cells (n=3). (g) Representative images of Filipin and FITC-ulex eruopaeus agglutinin I (UEAI) stained HUVEC after treatment with TNFα (10 ng/mL) or U18666A (U186) (5 μM). White scale bar = 30 μm. *p<0.05; **p<0.01; ***p<0.001; ***p<0.0001 by one-way ANOVA with Tukey’s multiple comparison’s test (c and e).
-
Figure 6—figure supplement 1—source data 1
Blots corresponding to Figure 6—figure supplement 1c, d, and f.
- https://cdn.elifesciences.org/articles/79529/elife-79529-fig6-figsupp1-data1-v2.pdf
Figure 6—figure supplement 2
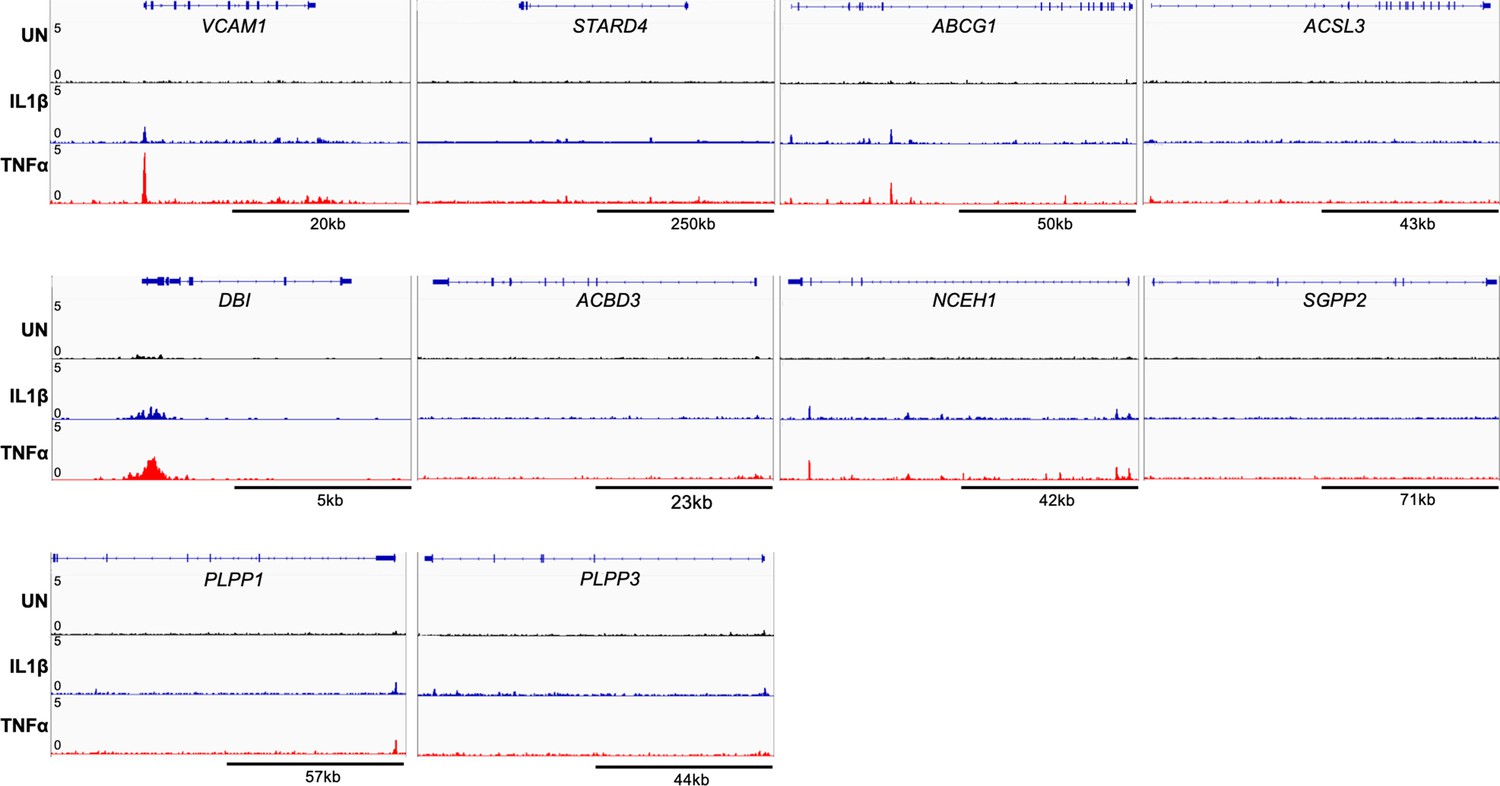
RELA ChIP-seq analysis of lipid mediator genes.
RELA ChiP-seq analysis of lipid mediator genes of human aortic endothelial cells (HAEC) treated with TNFα (2 ng/mL) or IL1β (10 ng/mL) for 4 hr. Data are scaled from 0 (bottom) to 5 (top). VCAM1 is shown in first panel as a positive control. Data originated from GSE89970.
Figure 6—figure supplement 3
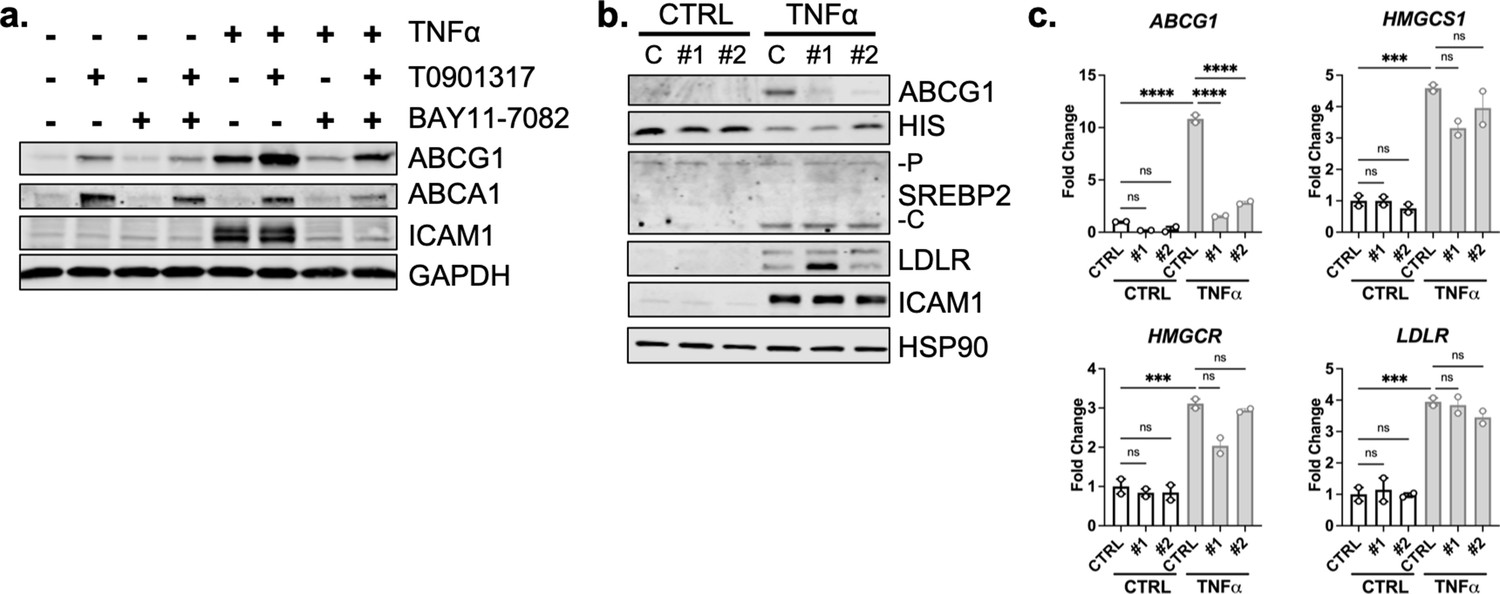
ABCG1 is significantly upregulated by TNFa, but is not responsible for accessible cholesterol depletion or SREBP2 activation.
(a) Representative immunoblot of ABCG1 and ABCA1 protein levels in HUVEC treated with TNFα (10 ng/mL), T0901317 (T090) (5 μM), and/or BAY11-7082 (5 μM). (b) Representative immunoblot of ABCG1, ALOD4, SREBP2, and LDLR protein levels in HUVEC treated with TNFα (10 ng/mL) and two independent siRNA targeting ABCG1 (#1,#2). (c) qRT-PCR analysis of RNA from HUVEC treated with TNFα (10 ng/mL) and two independent siRNA targeting ABCG1 (#1,#2). Data are normalized to respective ACTB and then to untreated cells (n=2). *p<0.05; **p<0.01; ***p<0.001; ***p<0.0001 by two-way ANOVA with Sidak’s multiple comparisons test.
-
Figure 6—figure supplement 3—source data 1
Blots corresponding to Figure 6—figure supplement 3a and b.
- https://cdn.elifesciences.org/articles/79529/elife-79529-fig6-figsupp3-data1-v2.pdf
Figure 7
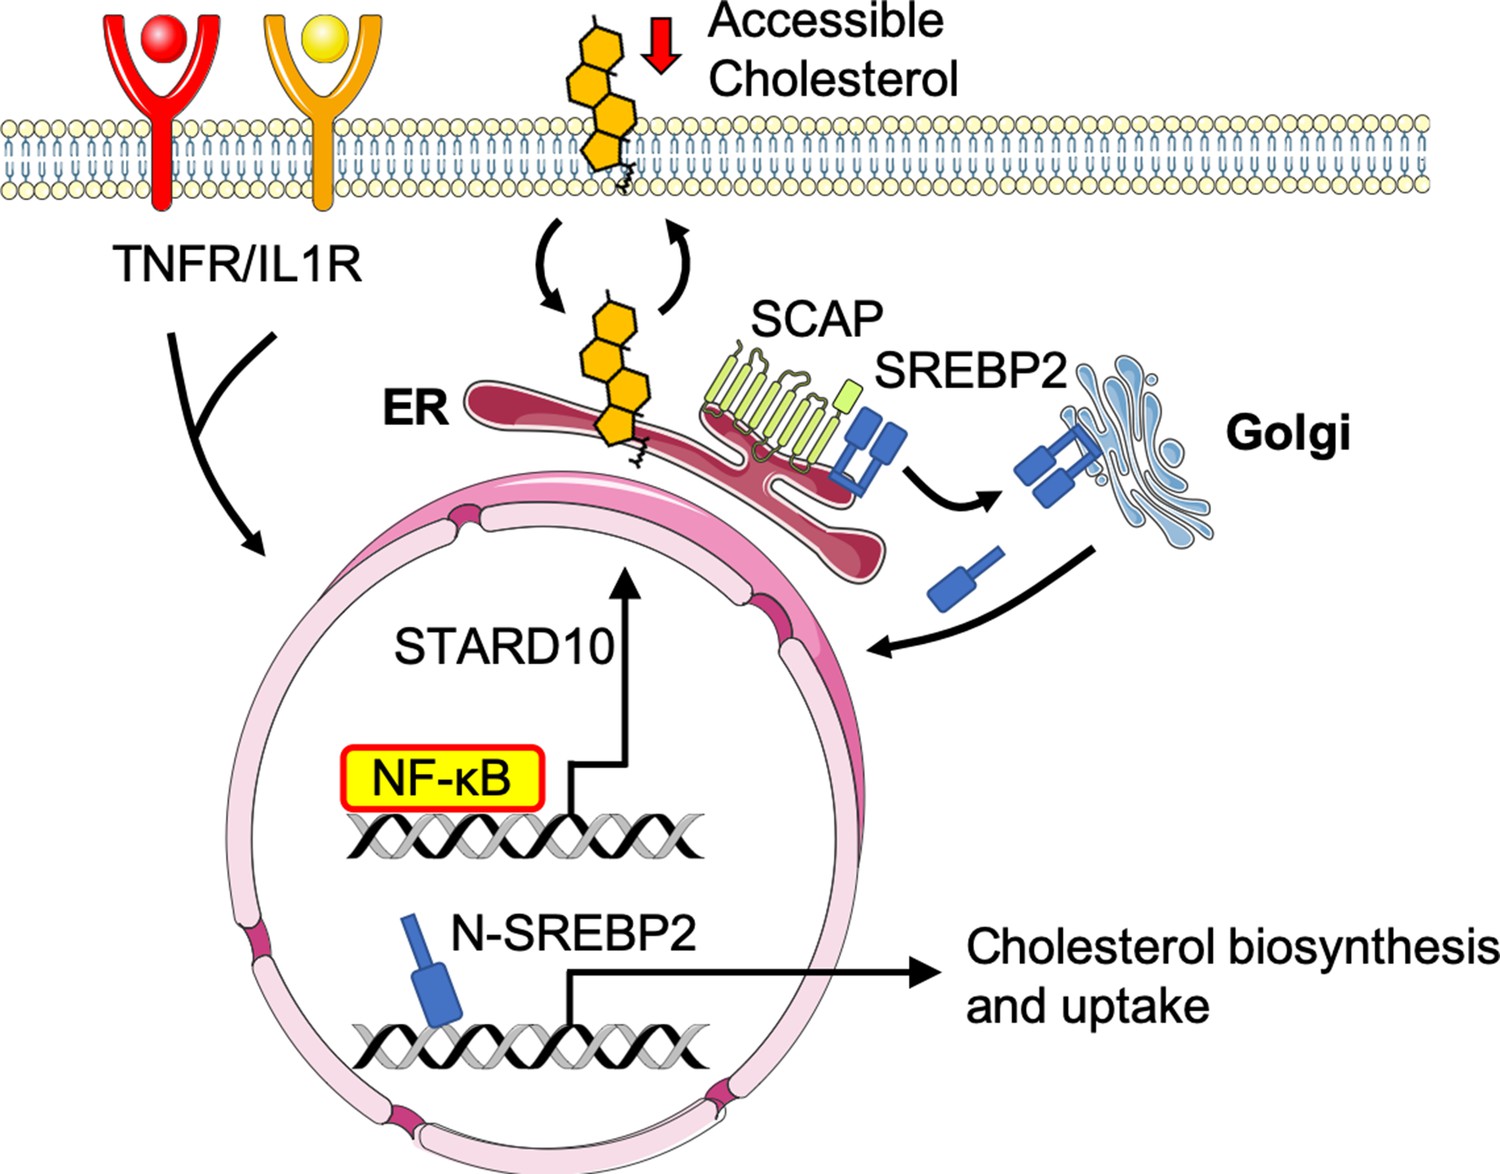
Working model of the relationship between sterol sensing and EC acute inflammatory response.
Pro-inflammatory cytokines, such as TNFα and IL1β, promote NF-κB activation of gene transcription in endothelial cells. NF-κB upregulates factors, such as STARD10, that significantly decrease accessible cholesterol on the plasma membrane. SCAP senses the reduction in accessible cholesterol and shuttles SREBP2 to the Golgi to initiate classical proteolytic processing. Active N-SREBP2 translocates to the nucleus to transcriptionally upregulate canonical cholesterol biosynthetic genes.
Tables
Appendix 1—key resources table
| Reagent type (species) or resource | Designation | Source or reference | Identifiers | Additional information |
|---|---|---|---|---|
| antibody | Anti-His Tag Dylight 680 (Mouse monoclonal) | ThermoFisher Scientific | MA1-21315-D680 | In-cell Western (1:1,000) |
| antibody | Anti-6x His (Mouse monoclonal) | abcam | ab18184 | WB (1:1,000) |
| antibody | Anti-ABCG1 (Rabbit monoclonal) | abcam | ab52617 | WB (1:1,000) |
| antibody | Anti-mmCd31-BV605 (Rat monoclonal) | BioLegend | 102427 | FACS (1:200) |
| antibody | Anti-GAPDH (Rabbit monoclonal) | Cell Signalling | 2118 S | WB (1:2,000) |
| antibody | Anti-HSP90 (Mouse monoclonal) | Santa Cruz | sc-13119 | WB (1:2,000) |
| antibody | Anti-ICAM1 (Rabbit monoclonal) | Cell Signaling | 4915 S | WB (1:1,000) |
| antibody | Anti-JNK1 (Mouse monoclonal) | Cell Signaling | 3708 S | WB (1:1,000) |
| antibody | Anti-LC3b (Rabbit monoclonal) | Cell Signaling | 2775 S | WB (1:1,000) |
| antibody | Anti-LDLR (Rabbit monoclonal) | abcam | ab52818 | WB (1:1,000) |
| antibody | Anti-p-JNK1 (Rabbit monoclonal) | Cell Signaling | 9261 S | WB (1:1,000) |
| antibody | Anti-p-p38 (Rabbit monoclonal) | Cell Signaling | 9211 S | WB (1:1,000) |
| antibody | Anti-p38 (Rabbit monoclonal) | Cell Signaling | 9212 S | WB (1:1,000) |
| antibody | Anti-P65/RELA (Rabbit monoclonal) | Cell Signaling | 8242 S | WB (1:1,000) |
| antibody | Anti-SREBP1a (Mouse monoclonal) | Santa Cruz | sc-13551 | WB (1:1,000) |
| antibody | Anti-SREBP2 (Mouse monoclonal) | BD Biosciences | 557037 | WB (1:1,000) |
| antibody | Anti-STARD10 (Rabbit polyclonal) | Thermofisher Scientific | PA5-36947 | WB (1:1,000) |
| antibody | Anti-VCAM1 (Mouse monoclonal) | Santa Cruz | sc-13160 | WB (1:1,000) |
| sequence-based reagent | siRNA: RELA | Thermofisher Scientific | s11914 | Silencer Select |
| sequence-based reagent | siRNA: SREBF2 | Thermofisher Scientific | s27 | Silencer Select |
| sequence-based reagent | siRNA: HMGCR | Thermofisher Scientific | 110740 | Silencer |
| sequence-based reagent | siRNA: SCAP | Thermofisher Scientific | s695 | Silencer Select |
| sequence-based reagent | siRNA: STARD10 #1 | Thermofisher Scientific | s21244 | Silencer Select |
| sequence-based reagent | siRNA: STARD10 #2 | Thermofisher Scientific | s21243 | Silencer Select |
| sequence-based reagent | siRNA: ABCG1 #1 | Thermofisher Scientific | s18482 | Silencer Select |
| sequence-based reagent | siRNA: ABCG1 #2 | Thermofisher Scientific | S18484 | Silencer Select |
| sequence-based reagent | hsACTB_F | This Paper | qRT-PCR Primers | AGCACTGTGTTGGCGTACAG |
| sequence-based reagent | hsACTB_R | This Paper | qRT-PCR Primers | GGACTTCGAGCAAGAGATGG |
| sequence-based reagent | hsLDLR_F | This Paper | qRT-PCR Primers | TCTGCAACATGGCTAGAGACT |
| sequence-based reagent | hsLDLR_R | This Paper | qRT-PCR Primers | TCCAAGCATTCGTTGGTCCC |
| sequence-based reagent | hsHMGCS1_F | This Paper | qRT-PCR Primers | CAAAAAGATCCATGCCCAGT |
| sequence-based reagent | hsHMGCS1_R | This Paper | qRT-PCR Primers | AAAGGCTTCCAGGCCACTAT |
| sequence-based reagent | hsHMGCR_F | This Paper | qRT-PCR Primers | TGATTGACCTTTCCAGAGCAAG |
| sequence-based reagent | hsINSIG1_F | This Paper | qRT-PCR Primers | CTAAAATTGCCATTCCACGAGC |
| sequence-based reagent | hsINSIG1_R | This Paper | qRT-PCR Primers | GCACTGCATTAAACGTGTGG |
| sequence-based reagent | hsSREBF2_F | This Paper | qRT-PCR Primers | TAAAGGAGAGGCACAGGA |
| sequence-based reagent | hsSREBF2_R | This Paper | qRT-PCR Primers | AGGAGAACATGGTGCTGA |
| sequence-based reagent | hsICAM1_F | This Paper | qRT-PCR Primers | GTGGTAGCAGCCGCAGTC |
| sequence-based reagent | hsICAM1_R | This Paper | qRT-PCR Primers | GGCTTGTGTGTTCGGTTTCA |
| sequence-based reagent | hsCXCL1_F | This Paper | qRT-PCR Primers | AGGGAATTCACCCCAAGAAC |
| sequence-based reagent | hsCXCL1_R | This Paper | qRT-PCR Primers | TGGATTTGTCACTGTTCAGCA |
| sequence-based reagent | hsSELE_F | This Paper | qRT-PCR Primers | ACCTCCACGGAAGCTATGACT |
| sequence-based reagent | hsSELE_R | This Paper | qRT-PCR Primers | CAGACCCACACATTGTTGACTT |
| sequence-based reagent | hsSCAP_F | This Paper | qRT-PCR Primers | CGCAAACAAGGAGAGCCTAC |
| sequence-based reagent | hsSCAP_R | This Paper | qRT-PCR Primers | TGTCTCTCAGCACGTGGTTC |
| sequence-based reagent | hsSTARD10_F | This Paper | qRT-PCR Primers | GAAAGACTTGGTCCGAGCTG |
| sequence-based reagent | hsSTARD10_R | This Paper | qRT-PCR Primers | TTCCACTCGGGGTACTTGAG |
| chemical compound, drug | 25-hydroxycholesterol | Sigma Aldrich | H1015 | |
| chemical compound, drug | Actinomycin D | ThermoFisher | 11805017 | |
| chemical compound, drug | BAY 117082 | Sigma Aldrich | B556-10MG | |
| chemical compound, drug | Cholesterol, 1,2-3H(N) | Perkin Elmer | NET139250UC | |
| chemical compound, drug | Choroquine (CQ) | Sigma Aldrich | C6628 | |
| chemical compound, drug | DiI LDL | Kalen Biomedical | 770230 | |
| chemical compound, drug | EGM2 | Lonza | CC-3162 | |
| chemical compound, drug | Fatostatin | Cayman | 13562 | |
| chemical compound, drug | Filipin | Cayman | 70440 | |
| chemical compound, drug | FITC-UEAI | ThermoFisher | L32476 | |
| chemical compound, drug | Lipopolysaccharide from E. coli O111:B4 | Sigma Aldrich | L2630 | |
| chemical compound, drug | Lipoprotein Depleted Serum (LPDS) | Kalen Biomedical | 880100 | |
| chemical compound, drug | MβCD | Sigma Aldrich | C4555 | |
| chemical compound, drug | MβCD-Cholesterol | Sigma Aldrich | C4951 | |
| chemical compound, drug | Native LDL | Kalen Biomedical | 770200 | |
| chemical compound, drug | PF-429242 | Sigma Aldrich | SML0667 | |
| chemical compound, drug | rhIL1β | RD Systems | 201-LB-010/CF | |
| chemical compound, drug | rhTNFα | RD Systems | 210-TA-020/CF | |
| chemical compound, drug | Sandoz 58–035 | Sigma Aldrich | S9318-25mg | |
| chemical compound, drug | Sphingomyelinase | Sigma Aldrich | S8633 | |
| chemical compound, drug | T0901317 | Sigma Aldrich | T2320 | |
| chemical compound, drug | Triacin C | RD Systems | 2472 | |
| chemical compound, drug | U18666A | Sigma Aldrich | U3633 | |
| commercial assay or kit | Cholesterol/Cholesteryl Ester Assay Kit | Abcam | Ab65359 | |
| software, algorithm | Partek Flow | Partek | https://www.partek.com/partek-flow/ | |
| software, algorithm | Ingenuity Pathway Analssis | Qiagen | https://digitalinsights.qiagen.com/products-overview/discovery-insights-portfolio/analysis-and-visualization/qiagen-ipa/ |
Additional files
-
Supplementary file 1
RNA-seq normalized counts and lipidomics.
(RNA-seq) HUVEC were treated with TNFα for 0, 4, and 10 hr and with or without siRNA targeting RELA. (Lipidomics). HUVEC were treated with TNFα for 0, 4, and 10 hr. Data represented as molar percentage of lipid
- https://cdn.elifesciences.org/articles/79529/elife-79529-supp1-v2.xlsx
-
MDAR checklist
- https://cdn.elifesciences.org/articles/79529/elife-79529-mdarchecklist1-v2.pdf
Download links
A two-part list of links to download the article, or parts of the article, in various formats.
Downloads (link to download the article as PDF)
Open citations (links to open the citations from this article in various online reference manager services)
Cite this article (links to download the citations from this article in formats compatible with various reference manager tools)
Inflammatory stress signaling via NF-kB alters accessible cholesterol to upregulate SREBP2 transcriptional activity in endothelial cells
eLife 11:e79529.
https://doi.org/10.7554/eLife.79529


