Rhythmic coordination and ensemble dynamics in the hippocampal-prefrontal network during odor-place associative memory and decision making
- Neuroscience Program, Brandeis University, United States
- Department of Psychology, Brandeis University, United States
- Volen National Center for Complex Systems, Brandeis University, United States
Figures
Figure 1 with 1 supplement
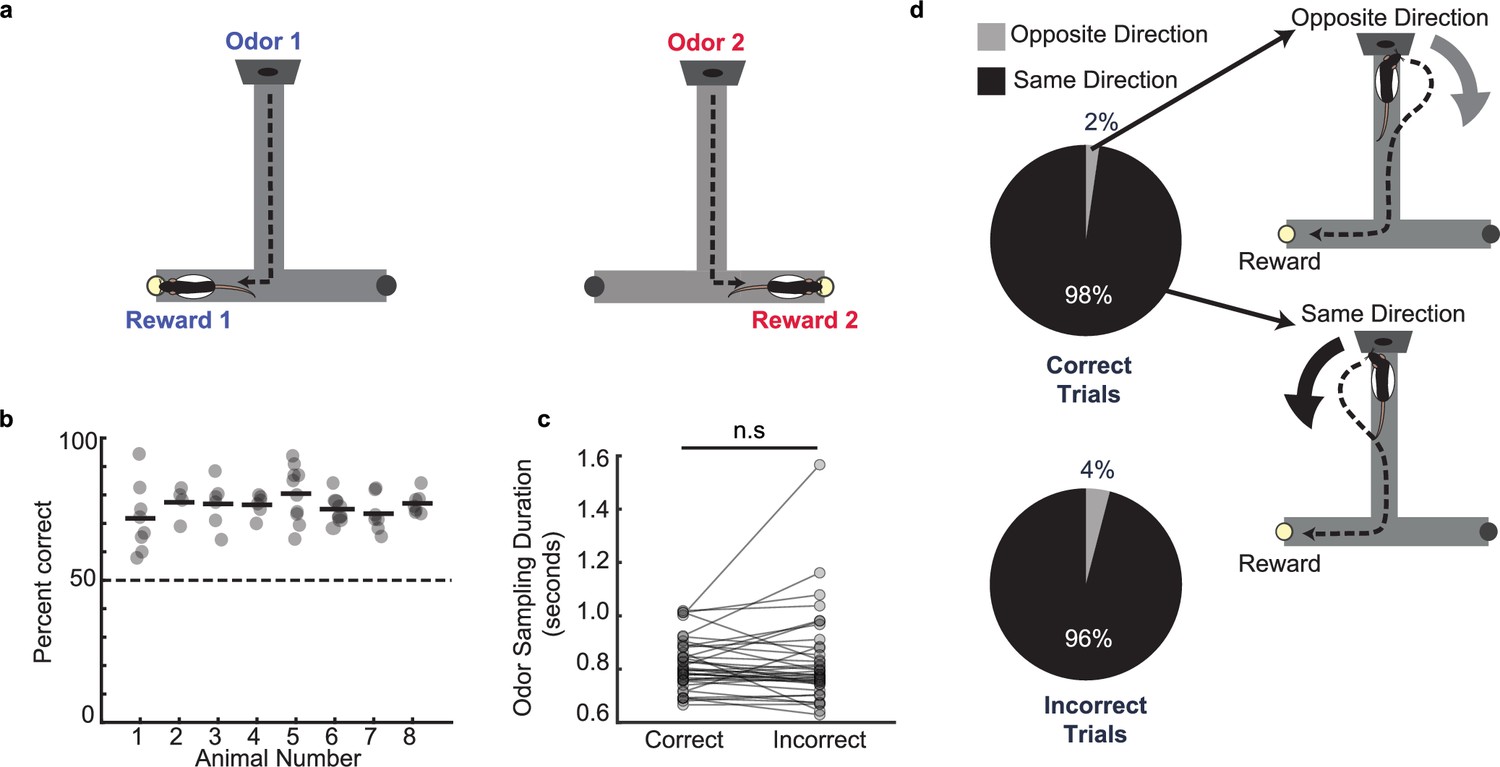
Odor–place associative memory and decision-making task.
(a) Schematic of the odor-cued T-maze task. Odors 1 (heptanol) and 2 (ethyl butyrate) were delivered at the odor port in pseudo-random order. Presentation of Odors 1 and 2 was associated with milk reward at Reward locations 1 and 2, respectively. Animals had to recall odor-space associations on each trial and utilize the association to choose the correct reward location. (b) Performance of each animal (n = 8) on the odor-cued T-maze task (animals 1–5) or truncated odor-cued task (animals 6 - 8; truncated task, without spatial delay period) across multiple sessions (grey dots). Animal average is indicated by black bars. Dashed line indicates chance level. (c) Odor sampling duration across all sessions (n = 38) on correct and incorrect trials (signed-rank test, p = 0.71). (d) Turn direction away from odor port in relation to chosen reward well. Pie charts indicate the fraction of trials in which, at the odor port, animals turned in the same direction versus the opposite direction as the reward well that they would ultimately choose. Sessions in which animals ran the truncated task without spatial delay period were excluded (correct trials: n = 1,624 same direction, 32 opposite direction, binomial test, p = 0; incorrect trials: n = 499 same direction, 21 opposite direction, p = 1.4e-108).
Figure 1—figure supplement 1
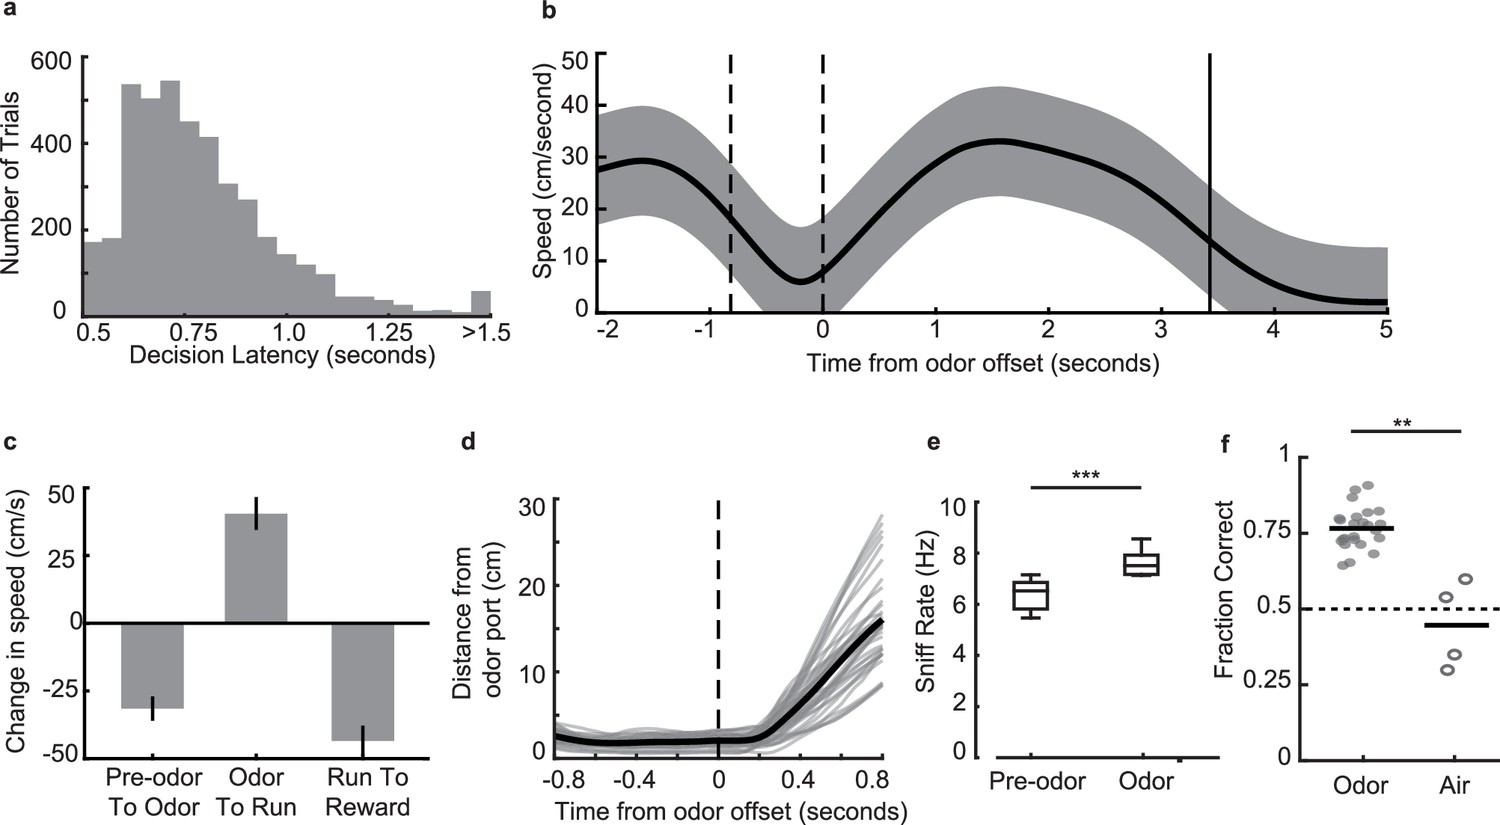
Behavioral parameters on the odor-place associative memory and decision-making task.
(a) Histogram of decision latencies. Mean: 0.82 s ± 0.25 s.d. (b) Mean run velocity across the full task for an example session from one animal, aligned to odor offset. Area between dashed lines indicates average odor-sampling period, solid line indicates average reward onset time. Shaded area indicates s.d. (c) Average change in speed across different task epochs, for all animals that ran on the full maze (and not the truncated maze) (n = 5). Error bars indicate s.d. (d) Distance from odor port over time aligned to odor port offset time. Grey lines are individual sessions, black line is mean across sessions (n = 38 sessions). (e) Sniff rate as measured by the thermocouple signal, during odor (7.1 ± 0.39 Hz, mean ± s.e.m.) and time matched pre-odor periods (6.2 ± 0.29 Hz, mean ± s.e.m.). Box plots indicate interquartile ranges (signed-rank test, n = 11 sessions across 2 animals, p = 9.8e-4***). (f) Performance of three animals on the odor-cued task (n = 24 sessions) versus the air-cued task (n = 4 sessions) in which animals were presented with only air as a neutral stimulus instead of two distinctodors. Black bars indicate mean. Dashed line indicates chance level (Rank-sum test, p = 0.002**).
Figure 2 with 2 supplements
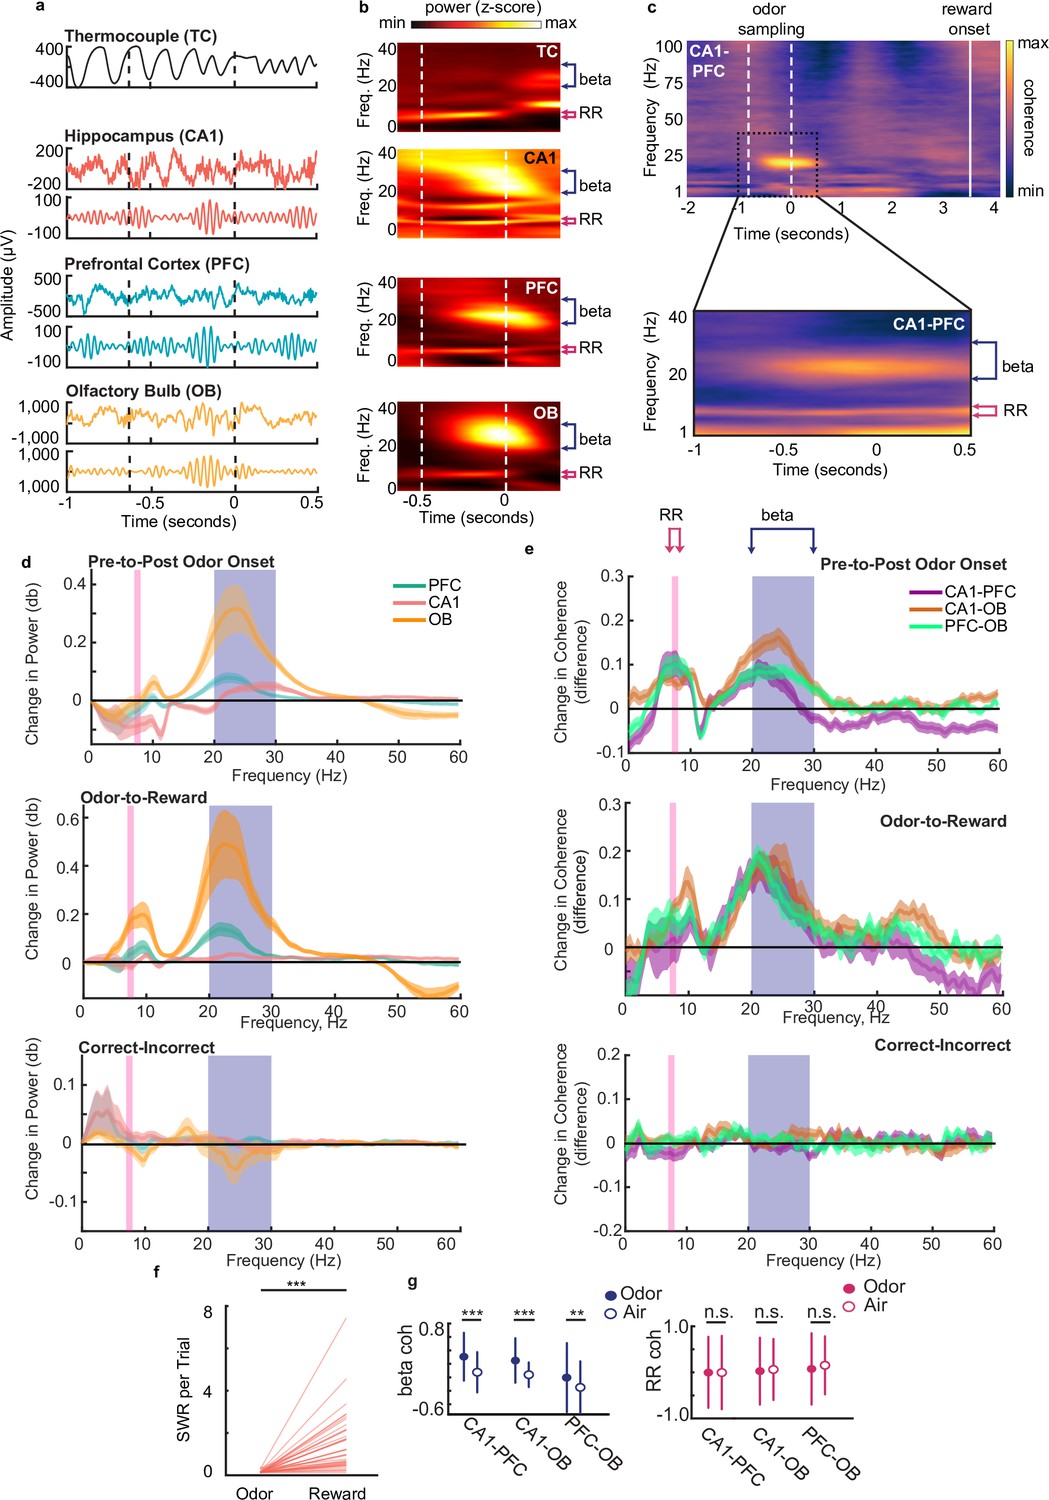
Beta rhythms support decision making based on odor-place associations.
(a) Examples of thermocouple and LFP traces from one tetrode in each region during presentation of odor from one trial, aligned to odor port disengagement. Area between dashed lines indicates odor sampling period. Top to bottom: Respiratory rhythm recorded via thermocouple, CA1 signal, beta band (20–30 Hz) filtered CA1 signal, PFC signal, beta band filtered PFC signal, OB signal, beta band filtered OB signal. (b) Time-frequency plot showing power spectra aligned to odor offset. Color scale represents z-scored power. Area between dashed lines indicates average odor sampling period. Beta band is marked by blue bracket (20–30 Hz). RR band is marked by pink bracket (7–8 Hz). Thermocouple signal (TC), n = 12 sessions, max 0.69, min –0.31; CA1: n = 39 sessions, max 0.26, min –0.35; PFC: n = 38 sessions, max 0.60, min –0.16; and OB: n = 39 sessions, max 2.17, min –0.24. (c) Top: CA1-PFC coherence spectra for one animal during the full task time window from odor sampling (area between white dashed lines, aligned to odor offset) to average reward onset time (solid line) (n = 4 sessions, max 0.84; min –0.41). Bottom: CA1-PFC coherence aligned to odor offset across all animals (n = 38 sessions, max 0.51; min –0.34). Color scale: z-scored coherence. (d) Top: Change in PFC, CA1 and OB LFP power from pre-to-post odor onset (signed-rank tests, n = 38 sessions, Beta band: CA1 p=2.84e-3, PFC p=1.80e-4, OB p=8.3e-6, RR band: CA1 [decrease] p=3.94e-3, PFC p=0.551, OB p=0.949). Middle: Change in LFP Power from odor-to-reward period (signed-rank tests, Beta: sign rank tests, CA1 p=0.0012, PFC p=5.3e-4, OB p=4.4e-4, RR: CA1 p=0.11, PFC p=0.062, OB p=4.4e-4). Bottom: change in LFP power from incorrect-to-correct trials (trial-count matched, ranksum test on session, no difference were found for either band). Shaded regions represent SEM. (e) Top: change in coherence between region-pairs from pre-to-post odor onset (signed-rank test, n=38 sessions, Beta: CA1-PFC p=2.84e-3, CA1-OB p=5.1e-5, PFC-OB p=3.67e-5; RR: CA1-PFC p=3.94e-3, CA1-OB p=6.35e-4, PFC-OB p=2.43e-4). Middle: change in coherence between region-pairs from reward period to odor sampling period (signedrank tests, Beta; CA1-PFC p-0.01, CA1-OB 0=0.0012, PFC-OB p=0.0024, RR: CA1-PFC p=0.57, CA1-OB p=0.0044, PFC-OB p=0.64e-4).Bottom: change in coherence from incorrect-to-correct trials (trial-count matched, ranksum test on sessions, no significant difference were found for either band). Shaded regions represent SEM. (f) Number of SWR events per trial during odor sampling and reward consumption on correct trials (signed-rank test, n = 38 sessions, p = 1.1e-7***). (g) Left: Beta Z-scored coherence between CA1-PFC, CA1-OB and PFC-OB on correct trials with odors (n = 3174) and randomly rewarded trials with only air presented at the odor port (n = 134). Right: same as left, but for RR. Correct trials were randomly subsampled to match the number of incorrect trials 1000 times. Error bars indicate s.d. (Bootstrap tests: beta: CA1-PFC: p < 0.001***, CA1-OB, p < 0.001***, PFC-OB: p = 0.002**; RR: CA1-PFC: p = 0.49, CA1-OB, p = 0.30, PFC-OB, p = 0.12).
Figure 2—figure supplement 1
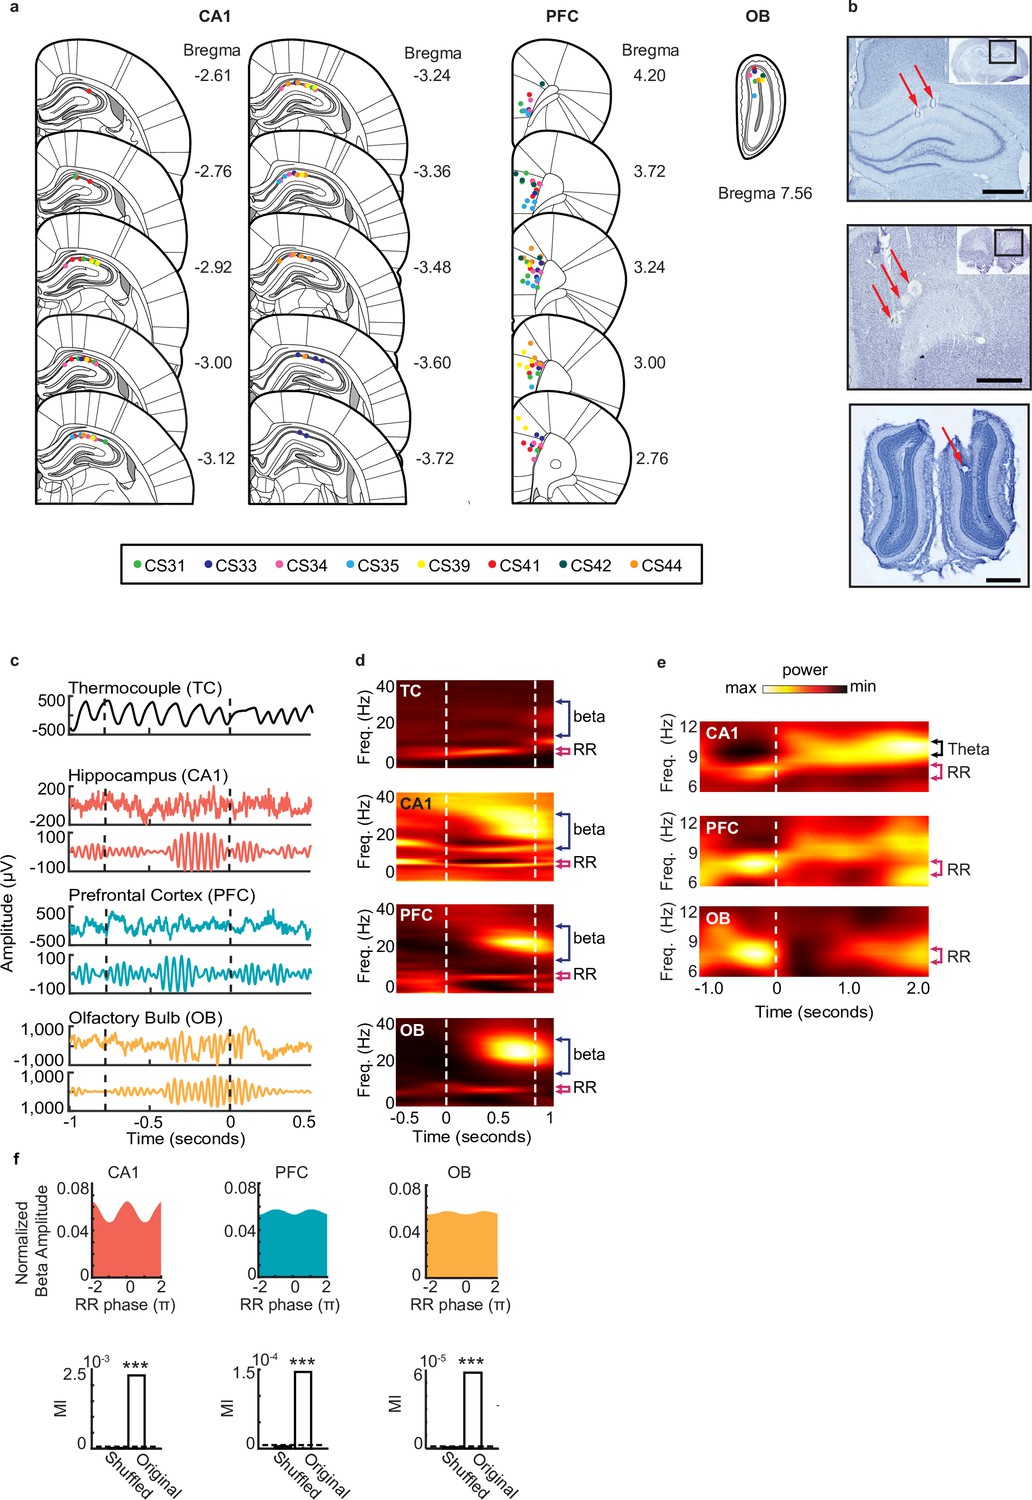
Rhythmic activity in the olfactory-hippocampal- prefrontal network.
(a) Recording locations for 8 rats (color coded) where tetrode locations were recovered. The recording sites were reconstructed from the electrolytic lesions in post hoc Nissl-stained coronal brain sections and mapped onto the stereotaxic atlas1. Electrodes were localized to target areas in dorsal area CA1, medial prefrontal cortex (PFC), and granule cell layer of OB after histology (PFC electrodes localized primarily to prelimbic cortex, with a few electrodes in anterior cingulate cortex (ACC)). (b) Sample Nissl-stained brain sections showing final tetrode placement in hippocampus (top), PFC (middle), and olfactory bulb (bottom). Arrows indicate tetrode lesions. Scale bars each represent 1 mm. (c) Examples of thermocouple and LFP traces from one tetrode in each region during presentation of odor from one trial, aligned to odor port disengagement. Area between dashed lines indicates odor sampling period. Top to bottom: Respiratory rhythm recorded via thermocouple, CA1 signal, beta band (20-30 Hz) filtered CA1 signal, PFC signal, beta band filtered PFC signal, OB signal, beta band filtered OB signal. (d) Time-frequency plots showing power spectra across all animals aligned to odor onset (at time 0). Color scale represents z-scored power. Area between dashed lines indicates average odor sampling period. Beta band is marked by blue bracket, and RR band is marked by pink bracket. Thermocouple signal (TC), n = 12 sessions, max 0.92, min –0.30; CA1: n = 38 sessions, max 0.29, min -0.33; PFC: n = 38 sessions, max 0.58, min –0.15; and OB: n = 38 sessions, max 2.28, min -0.20. (e) Time-frequency spectrograms across animals that ran on the full maze, aligned to odor port disengagement (at time 0) and extending into the run period on the track. Color scale represents z- scored power for each region: CA1: max 0.45; min -0.34, PFC: max 0.21; min –0.14, and OB: max 0.72; min –0.16. Dashed line indicates odor port disengagement time. RR band is marked by pink bracket. (f) Phase-amplitude coupling between RR and beta, in CA1 (left), PFC (middle), and OB (right). Top row: normalized phase-amplitude histograms. Bottom row: modulation index (MI)2 of real data compared to the MI from a trial-shuffled dataset (500 shuffles). Dashed line indicates significance level (alpha = 0.05, p < 0.001***).
Figure 2—figure supplement 2
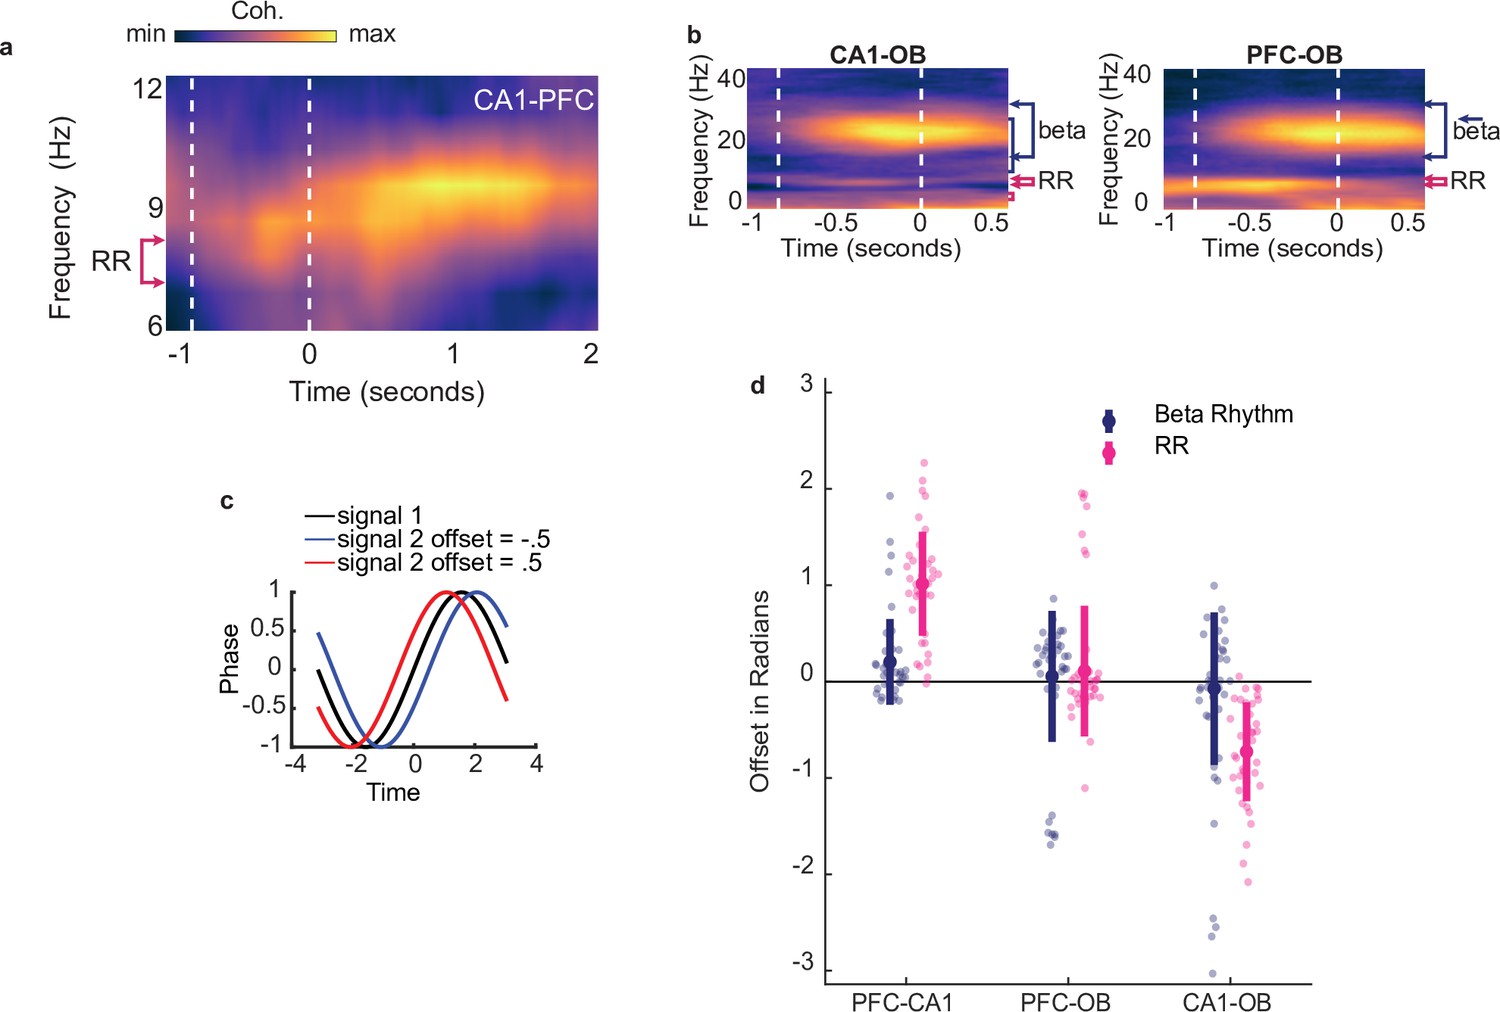
Beta coordination underlies decision making based on odor-place associations.
(a) CA1-PFC coherence across animals that ran on the full maze, aligned to odor port disengagement and extending into the run period on the track (n = 19). Color scale represents z-scored coherence. Min = –0.18, max = 0.50. (b) Left:CA1-OB coherence spectra across all animals and all tetrode pairs (n = 38 sessions). Area between vertical dashed lines indicates mean decision-making period aligned to odor port disengagement. Color scale represents z-scored coherence (max 0.41, min -0.25). Right: As in left, but for PFC-OB coherence (max 0.45, min -0.28). (c) Illustration depicting a positive offset and negative offset resulting from the second signal leading or lagging the first, respectively. Note that offsets are in radians rather than seconds. (d) Phase-offsets in beta(top) or RR(bottom) between each pair of regions. Shaded colors indicate mean and 99% CI, Grey lines illustrate individual sessions. Y axis notes sign of values at which each region would lead the other. During the full odor sampling window, CA1 beta lead PFC (p = 2e-4) and there was no consistent phase difference between OB and PFC or CA1 beta (all p>0.05). Similarly, CA1 RR lead PFC RR (p < 1e-5), as well as OB (p < 1e-5) but no consistent phase difference was found between OB and PFC or CA1 RR (all p >0.05).
Figure 3 with 1 supplement
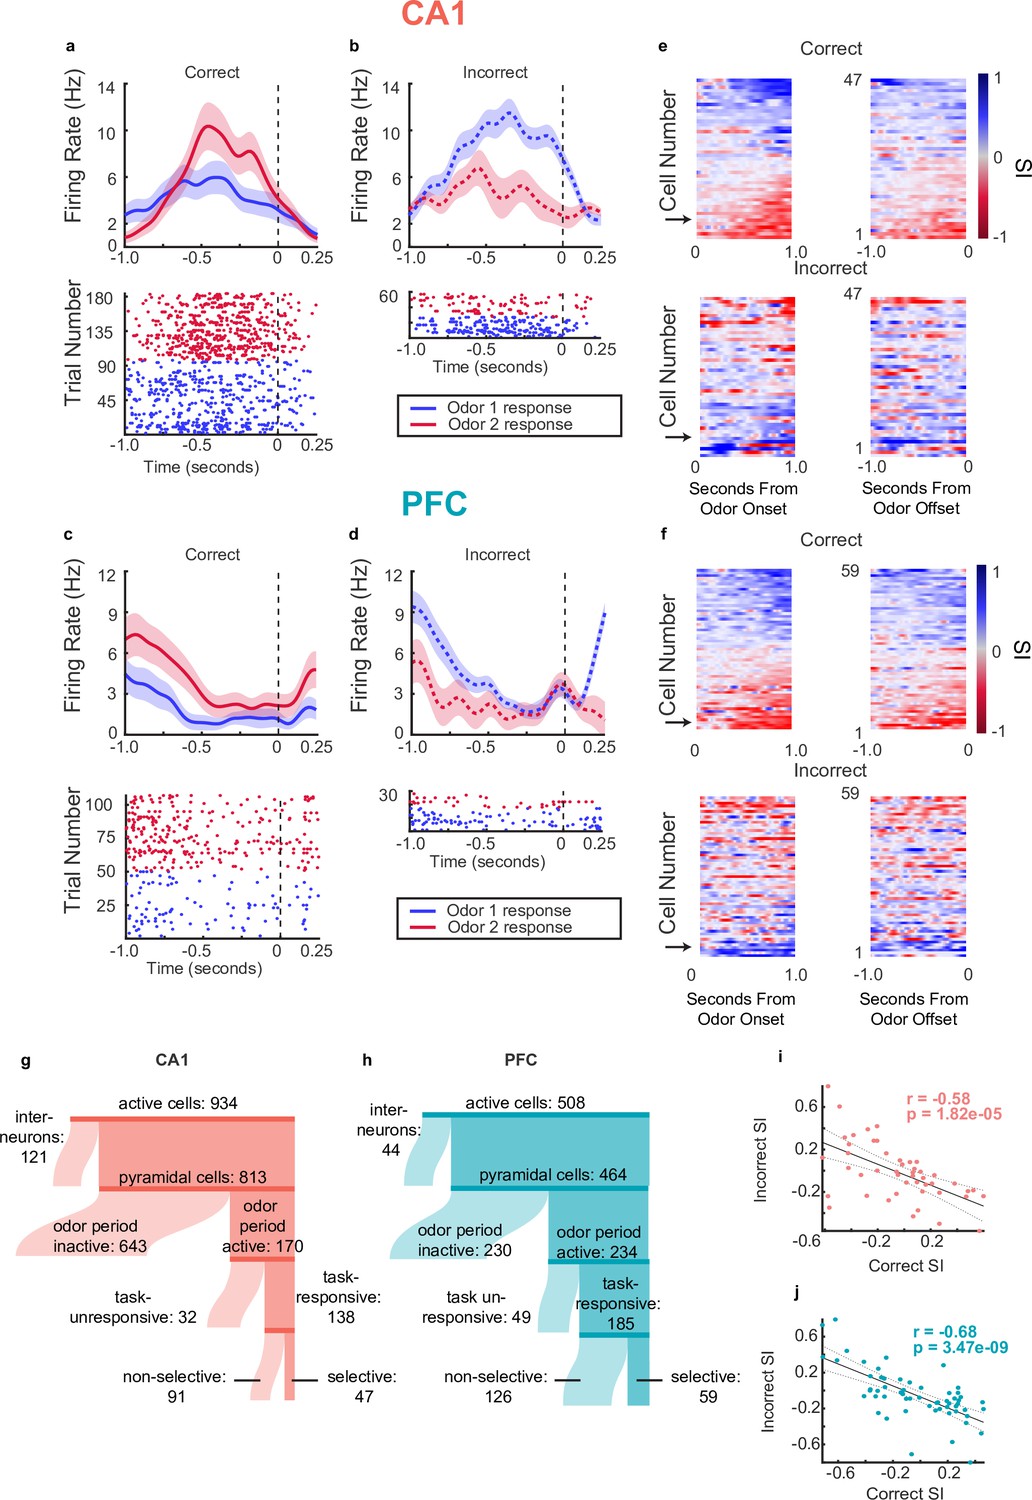
Single neurons in CA1 and PFC exhibit choice-selectivity during decision-making period.
(a) Example PSTH and raster plot for a single choice-selective CA1 neuron on correct trials, aligned to odor-port disengagement. Shaded areas indicate s.e.m. Firing rates are shown in Hz, referring to spikes/second. (b) Same as for a, but for incorrect trials. (c) Same as a but for PFC cell. (d) Same as C but for incorrect trials. (e) Selectivity index (SI) of all choice-selective cells in CA1 on correct trials (top) and incorrect trials (bottom), aligned to odor-port engagement(left) and odor-port disengagement(right). SI is calculated as the difference in firing rate between Odor 1 trials and Odor 2 trials, divided by the sum of these firing rates. SI is color coded, where blue indicates an SI of 1 (absolute Choice 1 preference), red indicates an SI of -1 (absolute Choice 2 preference) and grey indicates an SI of 0 (not selective). Cells are sorted according to peak selectivity on correct trials and sorting order is the same for both plots. (f) Same as E, but for all PFC choice-selective cells. (g) Sankey diagram showing the number of CA1 pyramidal cells that were classified into different categories, sizes of partitions are proportional to raw numbers. (h) Same as g, but for PFC cells. (i) Correlation between Correct trial SI and incorrect trial SI for CA1 selective cells (n=47, p=0.1.82e-5). (j) Same as for I, but for PFC cells (n=59, p=3.47e-9).
Figure 3—figure supplement 1
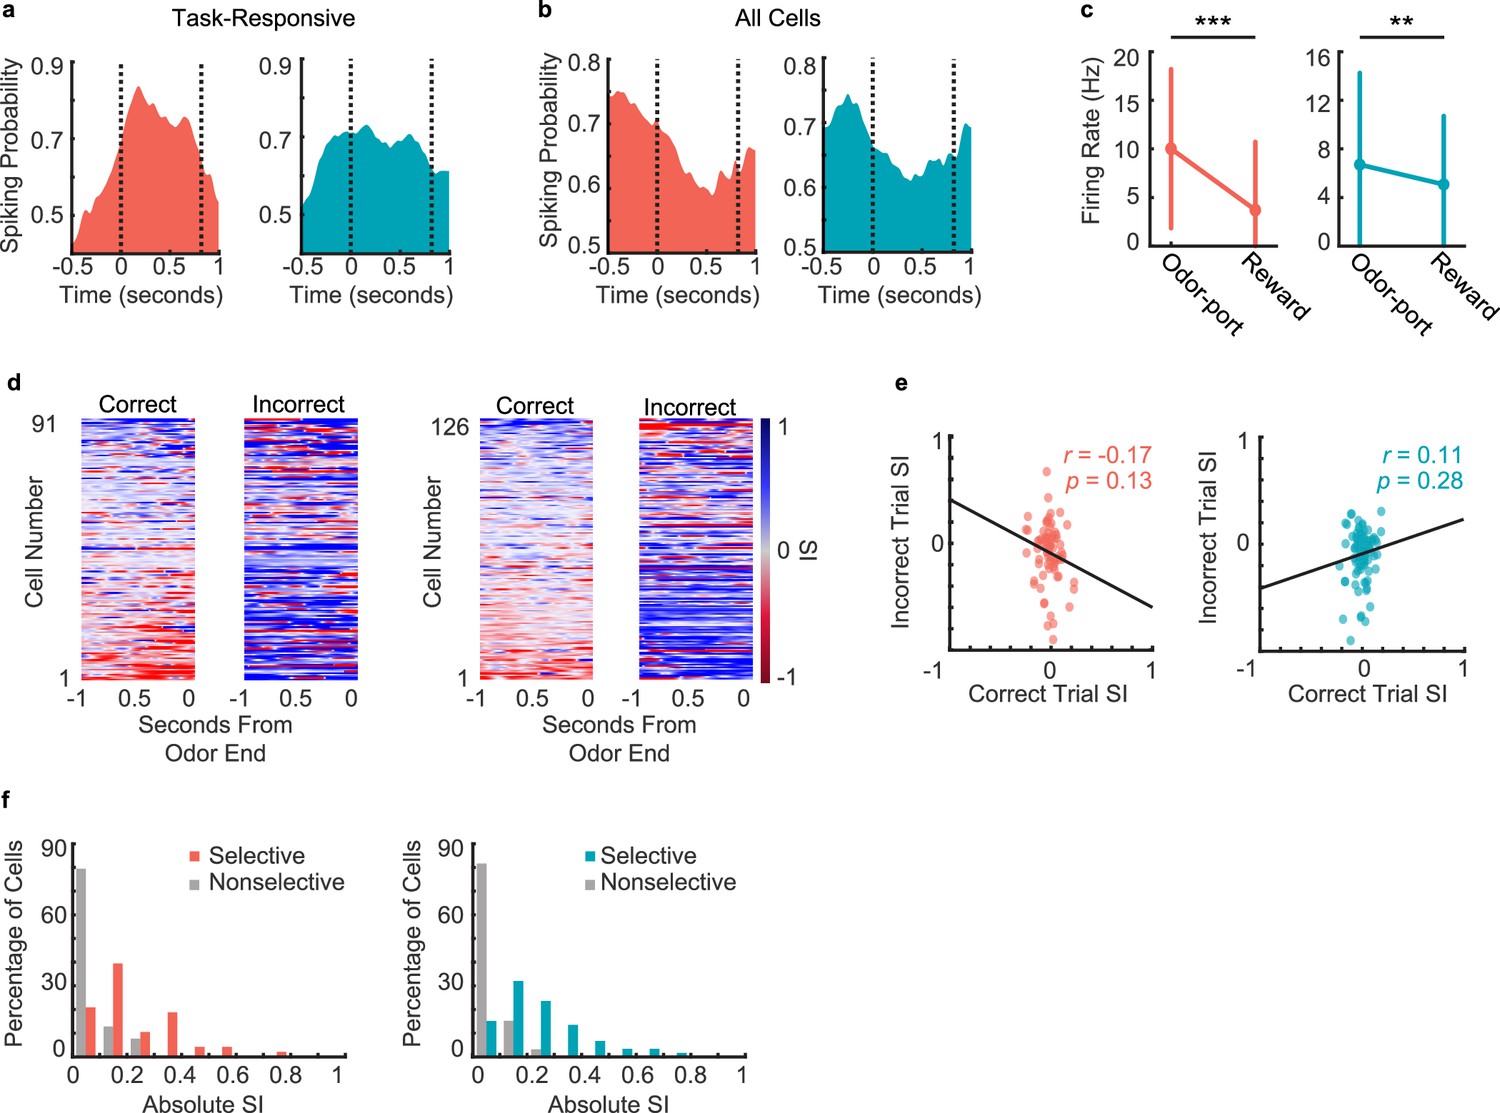
Neural responses during decision-making period.
(a) Spiking probability during decision-making period for all task-responsive cells in CA1 (left, n = 138 cells) and PFC (right, n = 157 cells). Area between the dashed lines represents decision-making period. (b) Spiking probability during decision-making period for all cells (task-responsive and task unresponsive, putative pyramidal cells and interneurons combined) in CA1 (left, n = 917 cells) and PFC (right, n = 507 cells). Area between the dashed lines represents decision-making period. (c) Firing rates of task-responsive pyramidal neurons during odor sampling and reward consumption (Signed-rank tests. CA1 (left): n = 138 cells, p = 5.1e-13; PFC (right): n = 185 cells, p = 0.009). Error bars represent SEM. (d) Selectivity index (SI) of all task-responsive but not choice-selective pyramidal cells in CA1 (left 2 panels) and PFC (right 2 panels) on correct trials and incorrect trials, aligned to odor port disengagement. Cells are sorted according to peak selectivity on correct trials and sorting order is the same for both plots. (e) Correlation between correct trial SI and incorrect trial SI for all task-responsive non-choice-selective pyramidal neurons. (CA1 (left): n = 91 cells, r = -0.34, p = 0.001**; PFC (right): n = 126 cells, r = -0.34, p = 3.0e-4***). (f) Histograms showing absolute selectivity indices for choice selective vs. non-choice-selective pyramidal cell populations in CA1 (left) and PFC (right).
Figure 4
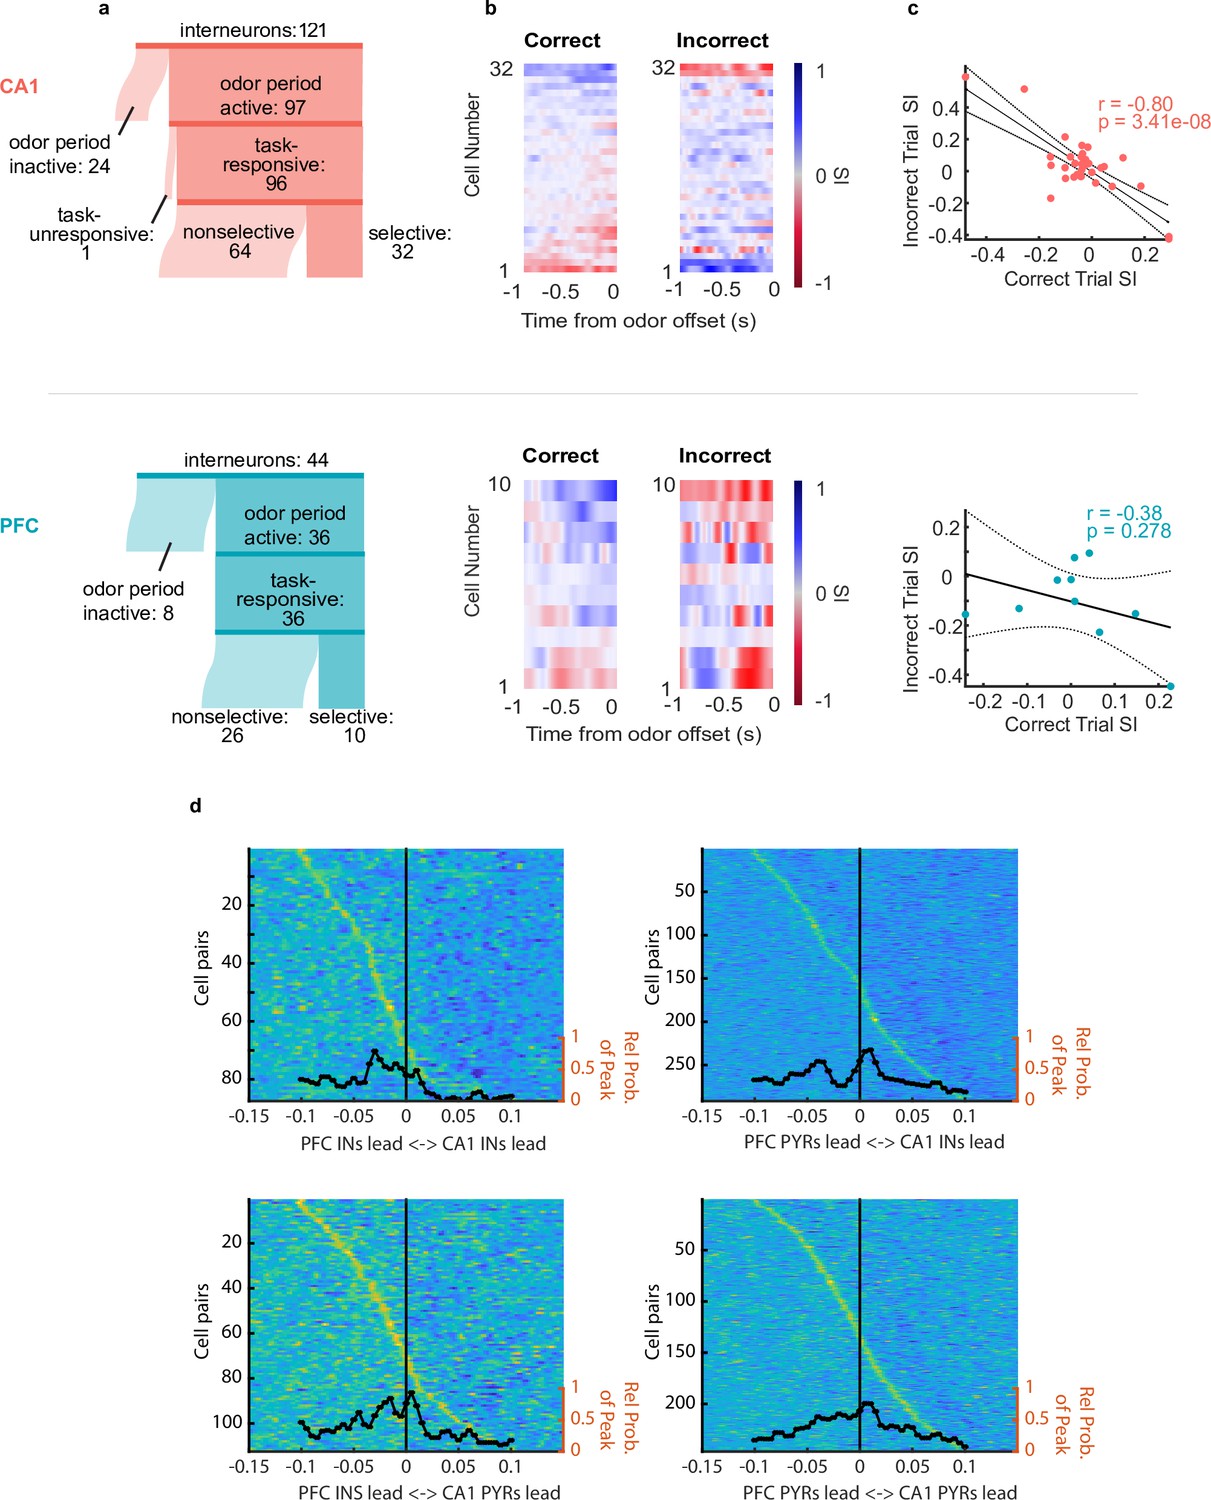
Interneurons exhibit choice-selectivity and temporal coordination during decision- making period.
(a) Sankey diagram showing the number of CA1 interneurons (top) and PFC interneurons (bottom) that were classified into different categories. Sizes of partitions are proportional to raw numbers. (b) Selectivity index (SI) of all choice-selective interneurons in CA1 (top) and PFC (bottom) on correct trials (left) and incorrect trials (right), aligned to odor-port disengagement. (c) Correlation between correct trial SI and incorrect trial SI for CA1 (n = 32, r = –0.80, p = 3.41e-8) and PFC(n = 10, r = -0.38, p = 0.278). (d) Histograms and waterfall plots of significantly connected PFC-CA1 cell pairs. Peaks falling above zero indicate CA1 leading, whereas peaks falling below zero indicate PFC leading. One-sample Wilcoxson signed rank tests (H0: µ = 0 ms). Top-left: CA1-PFC interneuron pairs, n = 87 pairs, p = 3.5e-8; top-right: CA1 interneuron-PFC pyramidal pairs, n = 283 pairs, p = 2.11e-3; bottom-left: CA1 pyramidal-PFC interneuron pairs, n = 111 pairs, p = 3.4e-3, bottom right: CA1-PFC pyramidal pairs, n = 224 pairs, p = 0.14.
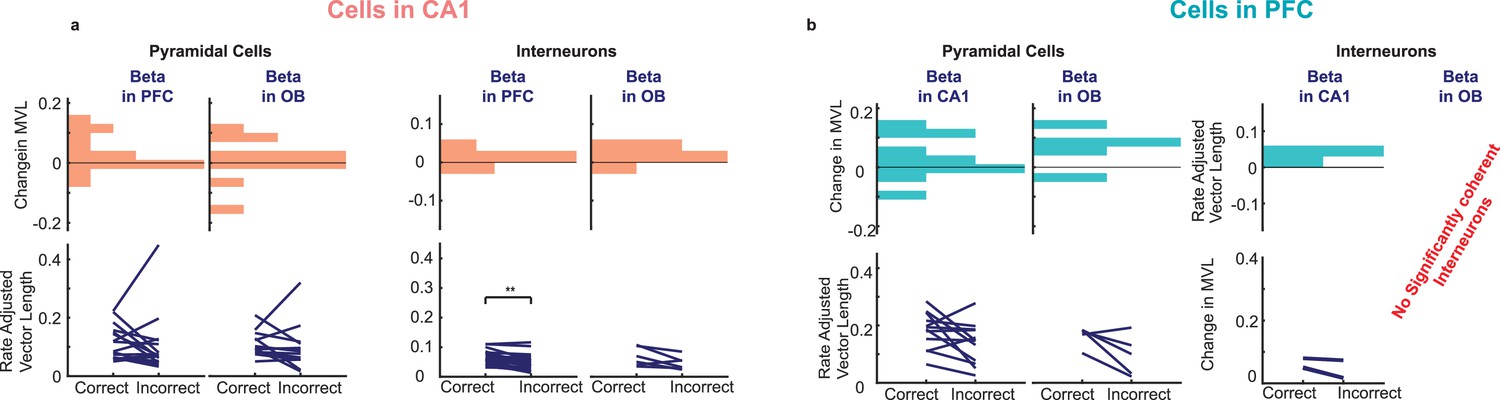
Figure 5 with 2 supplements
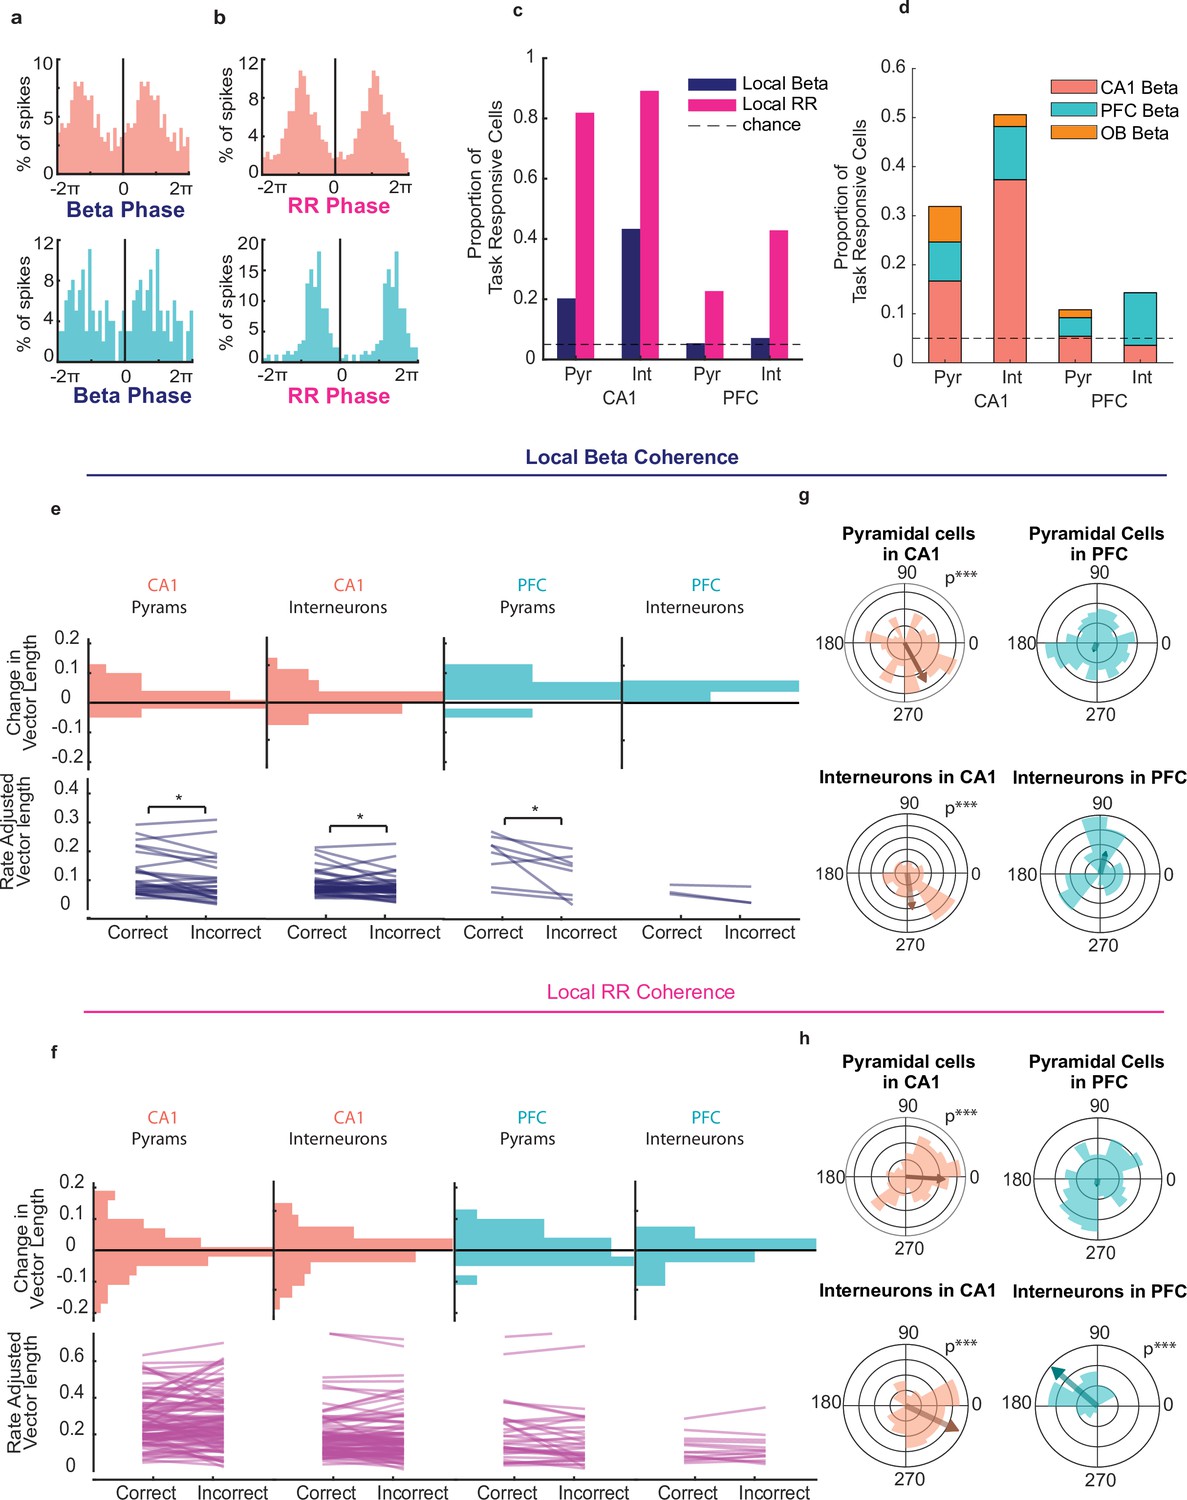
CA1 and PFC cells phase lock to beta and respiratory rhythms during decision making.
(a) Example spike-phase histograms from two example cells that are phase locked to the beta rhythm. Top: CA1 cell (Rayleigh Z test, n = 242 spikes, z = 15.5, p = 1.5e-7); bottom: PFC cell (n = 99 spikes, z = 4.86, p = 0.007). Phase axes are duplicated for visibility. (b) Example spike-phase histograms from two example cells that are phase locked to RR. Top: CA1 cell (Rayleigh Z test, n = 870 spikes, z = 135.3, p = 6.3e-62); bottom: PFC cell (n = 172 spikes, z = 73.9, p = 3.9e-37). (c) Percentage of task responsive cells in PFC and CA1 that were locked to local Beta or RR rhythms (CA1 Pyramidal cells n = 138, INs = 96, PFC Pyramidal cells n = 185, INs n = 36). (d) Percentage of task responsive cells in PFC and CA1 locked primarily to Beta in any region. Cells were counted only once and if locked to multiple regions assigned to that which they were locked most significantly(n = same as above). (e) Rate Adjusted Vector Lengths (top) and histogram of change in vector length from correct to incorrect trials(bottom) for beta locked task responsive cells in PFC and CA1 that were significantly locked to the local beta rhythm (even if better locked to other regions' LFP) (signed-rank tests, signed-rank tests, CA1: pyr n = 28, p = 0.014, IN n=36, p=0.038; PFC: pyr n = 8, p = 0.039, IN n=2, p>.05). (f) Same as e, but for cells that were significantly locked to the Respiratory Rhythm (Signed Rank test CA1 Pyr n=113, n.s, INs n=74, n.s., PFC pyr n=42, n.s. INs n=12, n.s.). (g) Polar histogram of preferred beta phases for all task responsive CA1 pyramidal cells and Interneurons (left)(pyr n=138, p=5.4e-5, IN n=96, p=2.6e-4) and PFC pyramidal cells and interneurons (right) (pyr n=185, p=0.648, IN n=36, p=0.50). (h) As in (f), but for all cells relative to local RR (CA1 pyr n=138, p=5.9e-4, IN n=96, p=5.6e-6. PFC pyr n=185 p=0.79, IN n=36, p=0.3.1e-5). (Asterisks indicate significance; *<0.05, **<0.01, ***<0.001).
Figure 5—figure supplement 1
Phase locking to beta and respiratory rhythms.
(a) Rayleigh Z scores for spike-phases of task-responsive cells for beta and RR (rank-sum test; CA1: n = 138 cells, p = 3.2e-26***; PFC: n = 185 cells, p = 0.002**). (b) Percentage of task responsive cells in PFC and CA1 locked primarily to RR in any region. Cells were counted only once and if locked to multiple regions assigned to that which they were locked most significantly (CA1 Pyramidal cells n=138, INs=96, PFC Pyramidal cells n=185, INs n=36). (c) Percentage of all active units in CA1 and PFC significantly locked to local Beta and RR across time epochs. Dotted line illustrates chance levels. (d) Percentage of task-responsive pyramidal cells in CA1 and PFC that were phase locked to beta, RR, or both beta and RR. Grey bars indicate chance level of cells being phase locked to both rhythms, error bars indicate the range of cell percentages that fall within the 95% bounds of the chance binomial distribution (Binomial tests, CA1: p = 0.08; PFC: p = 0.06). (e) As in (d), but for interneurons (Binomial tests, CA1: p = 0.11; PFC: p = 0.20). (f) Percentage of task-responsive pyramidal cells that were choice-selective (solid bars), phase-locked to the beta rhythm (outlined bars), and both choice-selective and phase-locked (striped bars). Grey bars indicate chance level of cells being both choice-selective and phase-locked, error bars indicate the range of cell percentages that fall within the 95% bounds of the chance binomial distribution (binomial tests, CA1: p = 0.08; PFC: p = 0.16). (g) As in (f), but for interneurons (Binomial tests, CA1: p=.4; PFC p=.7). (h) Percentage of task-responsive pyramidal cells that were choice-selective (solid bars), phase-locked to RR (outlined bars), and both choice-selective and phase-locked (striped bars). Grey bars indicate chance level of cells being both choice-selective and phase-locked, error bars indicate the range of cell percentages that fall within the 95% bounds of the chance binomial distribution (Binomial tests, CA1: p = 0.077; PFC: p = 0.10). (i) Cross-regional Beta and RR phase preference for pyramidal cells in CA1 and PFC (Rayleigh tests, p values less than 0.05 are illustrated with a 'P*' on plots). (j) As in (i), but for interneurons.
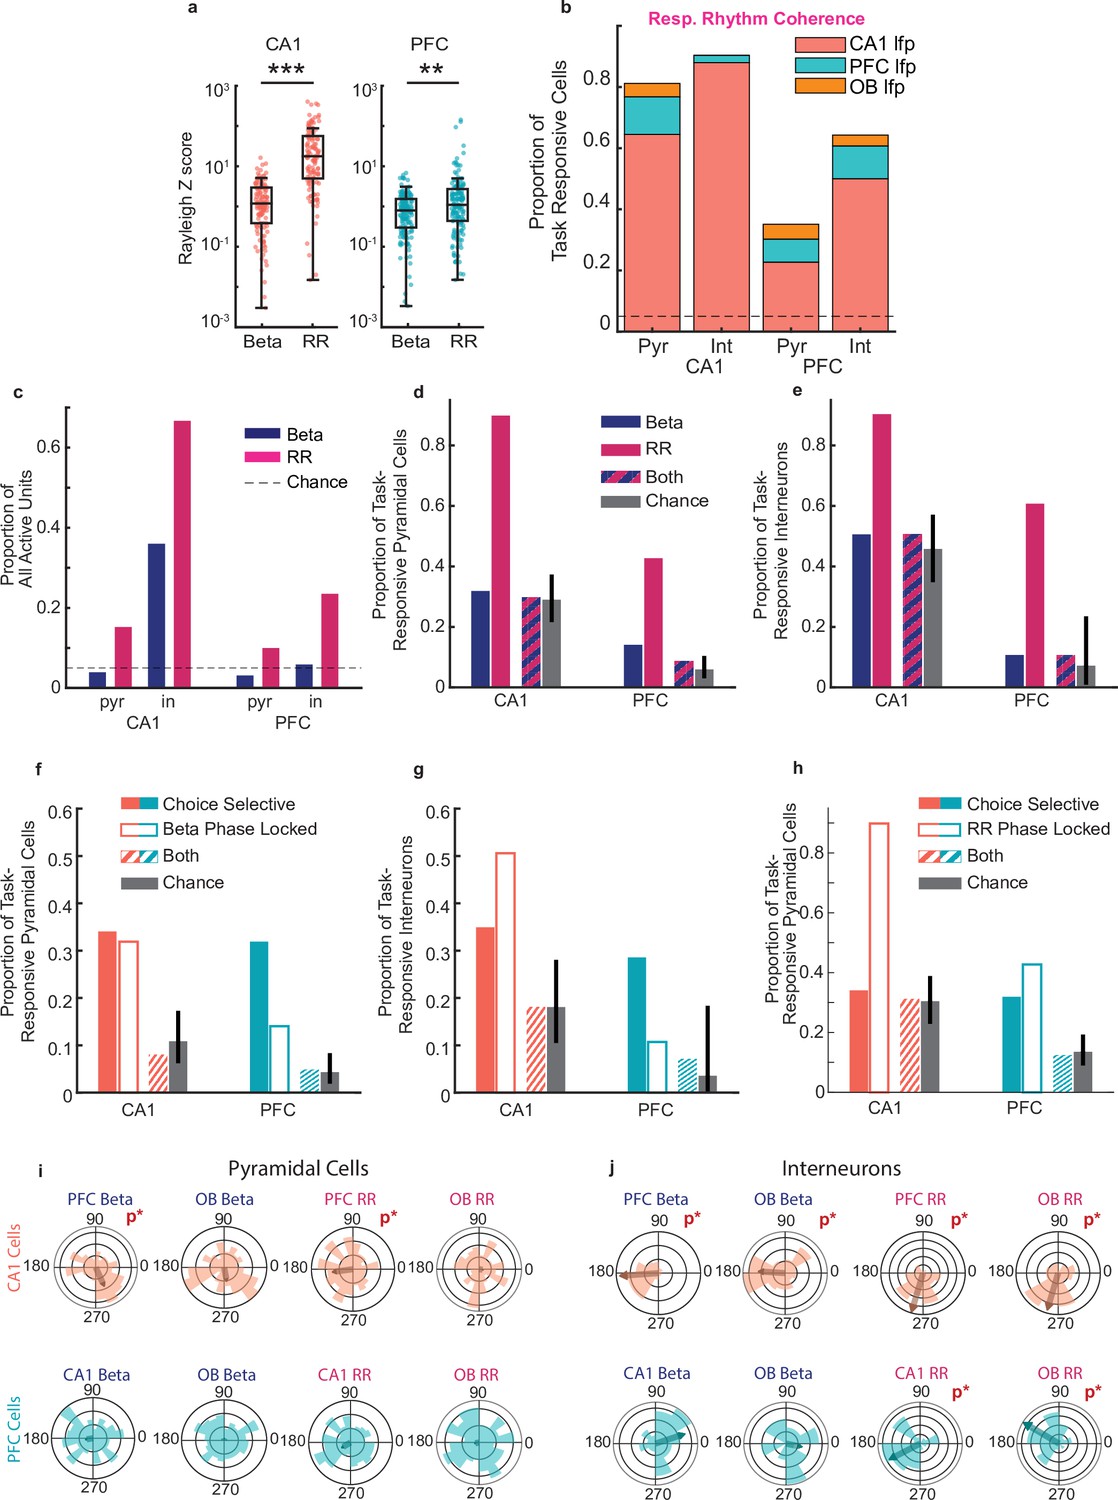
Figure 5—figure supplement 2
Cross-regional beta phase locking for correct vs.incorrect trials.
(a) Cross regional beta coherence of CA1 pyramidal (left) and interneurons (right) for correct and incorrect trials(bottom), and the difference between the two (top) (CA1 Interneurons to PFC beta p=0.0031, all others p>0.05). (b) As in (a) but for PFC cells (all p>0.05).
Figure 6
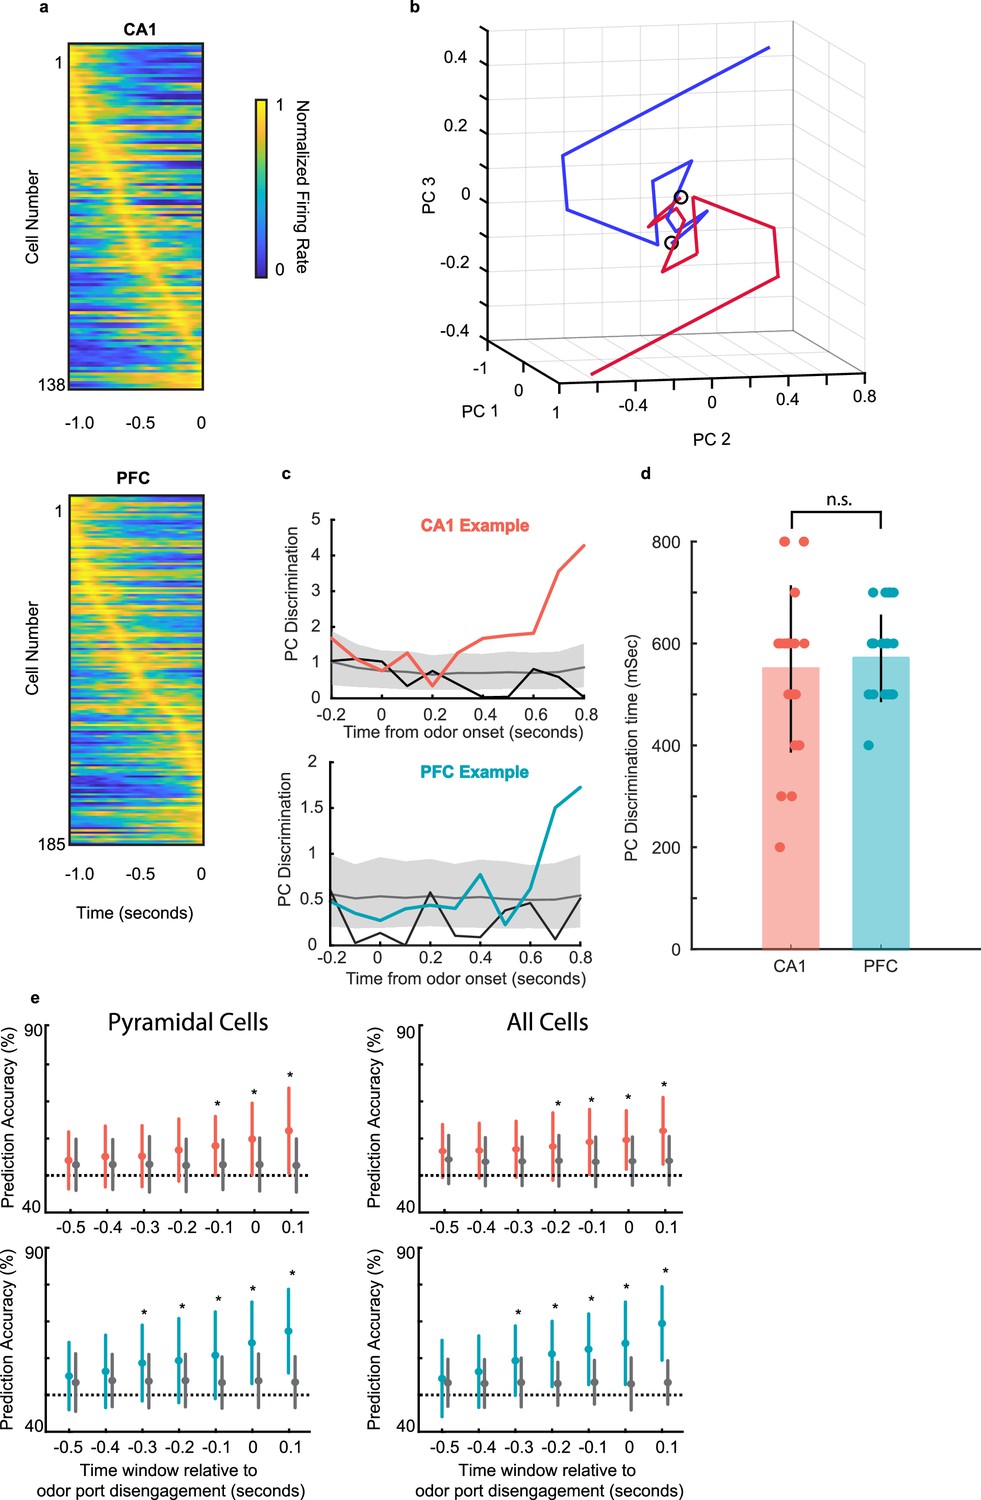
Neural ensemble responses during decision making predict the upcoming choice.
(a) Normalized firing rate of all task-responsive cells in CA1 (top) and PFC (bottom) during a 1 second window before odor port disengagement. (b) Example session with average trajectories of CA1 population activity using the first three PC dimensions for the two choices (n = 43, 45 left-bound (blue) and right-bound (red) trials; n = 12 CA1 neurons in ensemble, 100 ms bins). The two trajectories showing a rapid evolution and separation within a few hundred ms after odor onset. (c) Euclidean distance between left-bound and right-bound average PC trajectories for an example CA1 ensemble (top, n = 12 neurons) and PFC ensemble (bottom, n = 10 neurons) was compared to a chance-level distance distribution computed by shuffling the odor identities across trials and creating a null distribution. Grey line and shading are bootstrap permuted null distribution (mean and 95% CI), and black line is a control distance composed of mean even vs. odd trial PC distance for right and left odors separately. (d) Neural discrimination times for CA1 and PFC locked to odor onset (n = 24 sessions CA1 range: 200–800 ms; PFC range, 400–700 ms) were similar (Figure 7c; sign rank test, p = 0.68). (e) Neural discrimination times during odor sampling aligned to decision time. Colored error bars indicate real data mean ± s.d., whereas gray error bars indicate shuffled data mean ± s.d. Cells used for prediction include all task-responsive putative pyramidal cells in CA1 (top) and PFC (bottom) or all active neurons including interneurons (right). Stars indicate prediction time windows where the fraction of correctly predicted trials was significantly higher than the fraction from the shuffled data (rank-sum tests, * = p < 0.05).
Figure 7 with 1 supplement
Representations of choice and space are maintained independently during delay period.
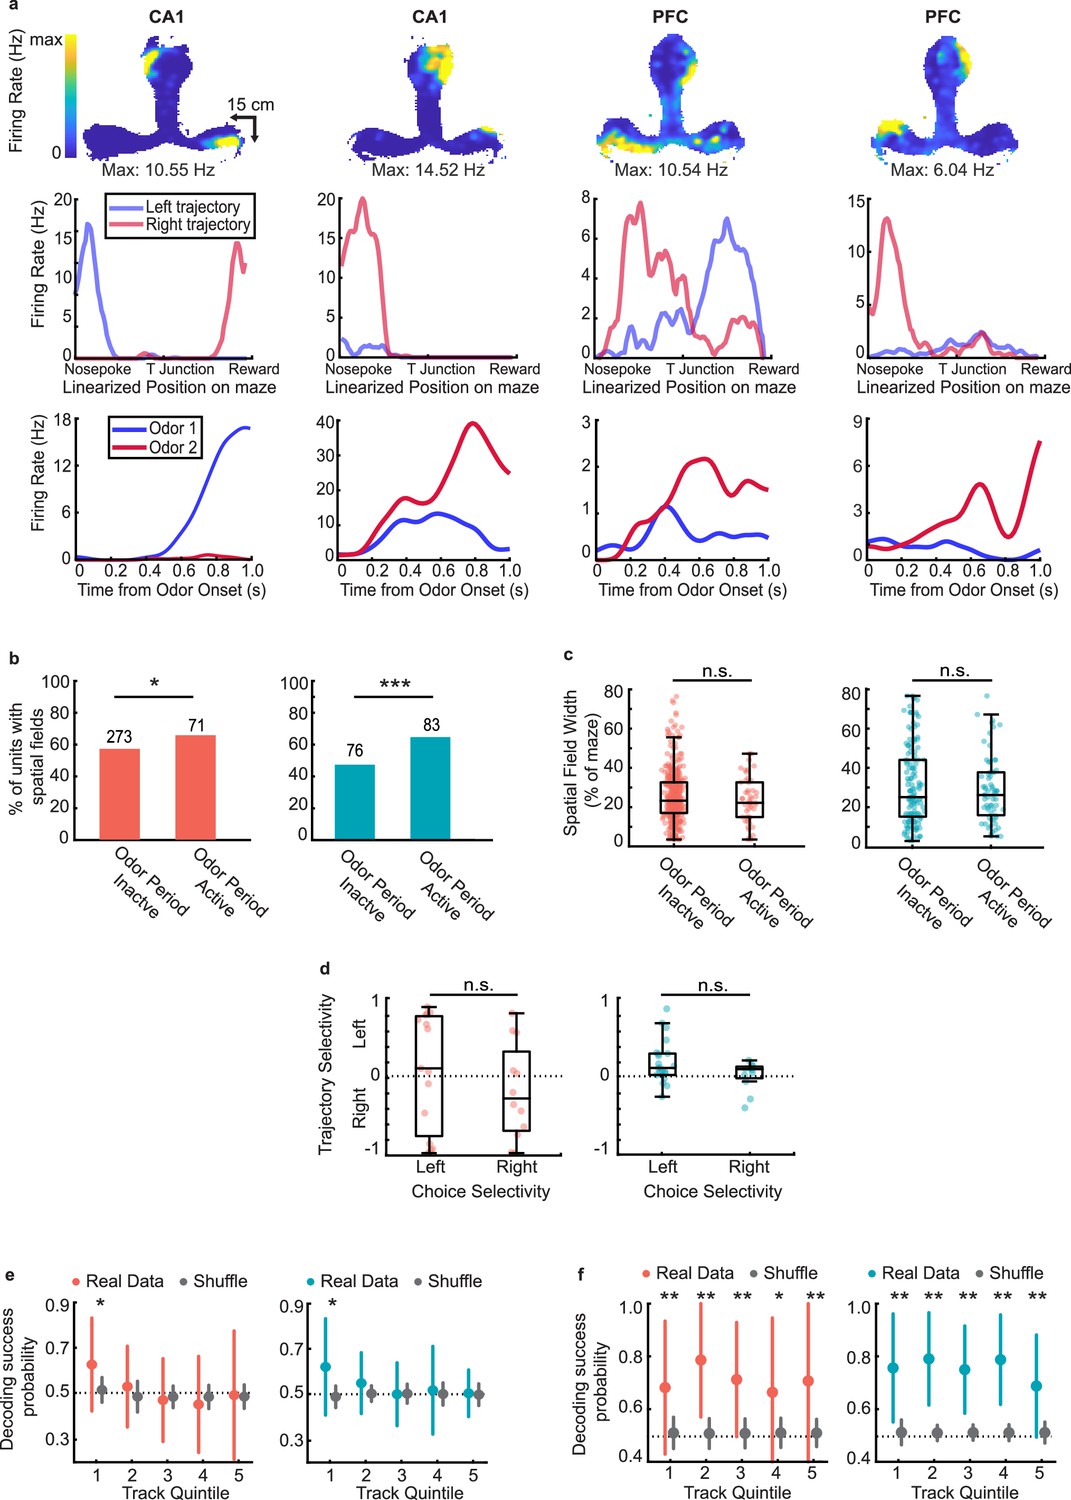
(a) Example choice-selective units (CA1, first two columns, PFC, last two columns) with spatial fields on the track. Top row: Heat map illustrating spatial fields during run bouts. Middle row: Linearized spatial tuning curves for outbound left and right run trajectories. Bottom row: PSTHs showing odor responses during decision-making period (Odor selectivity indices, left to right: 0.92,–0.43, −0.40,–0.57). (b) Spatial field prevalence in odor period inactive and odor period active cells in CA1 (left) and PFC (right). CA1: 273/477 (57%) of inactive cells, and 71/108 (66%) of active cells had spatial fields (binomial test: p = 0.03*); PFC: 76/160 (48%) of inactive cells, and 83/128 (66%) of active cells had spatial fields (binomial test: p = 2.7e-5***). (c) Spatial field width for odor period inactive and odor period active units in CA1 (left) and PFC (right). If a unit had a spatial field on both outbound trajectories, each field was counted separately. (Rank-sum tests; CA1: n = 452 fields, p = 0.15; PFC: n = 207 fields, p = 0.92). (d) Trajectory selectivity scores of choice-selective units according to preferred choice (Rank sum tests, CA1: p = 0.26; PFC: p = 0.20). Boxplots represent interquartile range and stems represent 95% percentile bounds. (e) Decoding of choice identity by naïve Bayesian classifier according to CA1 (left) and PFC (right) task-responsive ensemble activity at five equally sized spatial quintiles along the full run trajectory of the maze. 1 spatial quintile = 24.6 cm (123 cm / 5). Colored error bars indicate real data mean ± s.d. whereas grey error bars indicate shuffled data mean ± s.d. Stars indicate quintiles where the fraction of correctly decoded trials was significantly higher than the fraction from the shuffled data (rank-sum tests, * = p < 0.05). (f) As in (e), but decoding of choice identity according to CA1 (left) and PFC (right) spatially-modulated ensemble activity at each spatial quintile (rank-sum tests, * = p < 0.05, ** = p < 0.01).
Figure 7—figure supplement 1
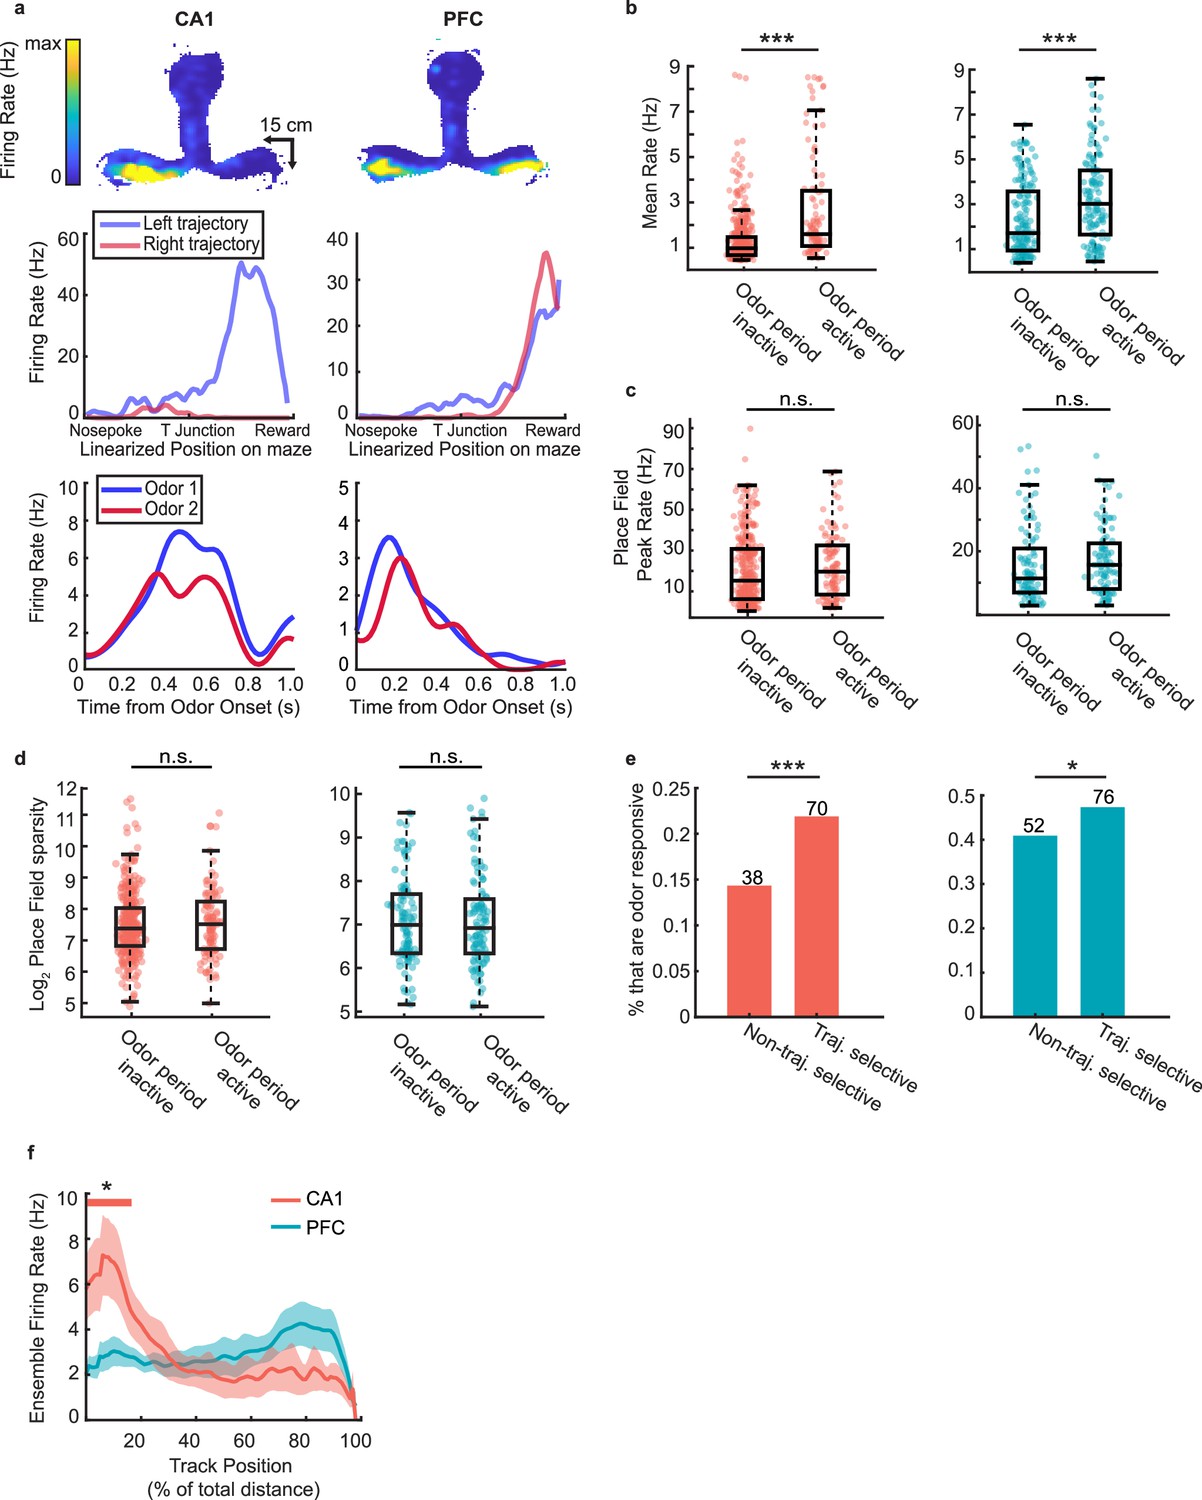
Spatial activity of task-responsive and task-unresponsive neurons.
(a) Example task-responsive (but not choice-selective) units from CA1 (left) and PFC (right) with spatial fields on the track. Top row: Heat map of firing fields during run bouts. Middle row: Linearized spatial tuning curves for outbound left and right run trajectories. Bottom row: PSTHs showing odor responses during decision-making period. (b) Mean firing rate of odor period inactive units during running on the maze, excluding decision-making periods (Rank-sum tests: CA1 (left): n = 585 cells, p = 2.8e-14***; PFC (right): n = 288 cells, p = 1.3e-5***). (c) Place field peak rate for odor period inactive and odor period active cells. (Rank sum tests, CA1 (left): n = 452 fields, p = 0.14; PFC (right): n = 207 fields, p = 0.08). (d) Place field sparsity for odor period inactive and odor period active cells. (Rank sum tests, CA1 (left): p = 0.70; PFC (right): p = 0.88). (e) Percentage of trajectory selective and non-trajectory selective cells that that were also odor period active (Binomial tests: CA1 (left): n = 108 odor active units, p = 3.0e-4***; PFC (right): n = 128 odor active units, p = 0.02*). (f) Mean ensemble firing rate of odor period active units in CA1 and PFC during outbound runs. Solid line indicates mean, shaded area represents s.d. Thick colored bar above marks positions in which the ensemble rate exceeds the 99th percentile of a bootstrap randomized null mean ensemble rate.
Tables
Key resources table
| Reagent type (species) or resource | Designation | Source or reference | Identifiers | Additional information |
|---|---|---|---|---|
| Strain, strain background (Rat) | Long Evans | Charles River | Cat#: Crl:LE 006; RRID: RGD_2308852 | |
| Chemical compound, drug | Ethyl Butyrate | Sigma-Aldrich | Cat#: H2805 | |
| Chemical compound, drug | Heptanol | Sigma-Aldrich | Cat#: E15701 | |
| Chemical compound, drug | Formaldehyde | Thermo Fisher Scientific | Cat#: 50-00-0,67561,7732-18-5 | |
| Software, algorithm | Matlab | Mathworks, MA | RRID: SCR_001622 | |
| Software, algorithm | Mountainsort | Barnett et al., 2016; Chung et al., 2017 | https://github.com/magland/mountainlab; RRID: SCR_017446 | |
| Software, algorithm | Chronux | Partha Mitra | http://www.chronux.org/ | |
| Other | 128-channel data acquisition system | SpikeGadgets | http://www.spikegadgets.com | Electrophysiology data acuisition system |
| Other | Olfactometer | MedAssociates Inc | Cat#: PHM-275 | Two Channel Dilution Olfactometer |
| Other | 12.7 μm NiCr tetrode wire | Sandvik | Cat#: PX000004 | Insulated wire to make electrodes |
Additional files
-
Supplementary file 1
Average CA1 and PFC cell counts per session in each category.
Overall averages are indicated as mean ± s.e.m.
- https://cdn.elifesciences.org/articles/79545/elife-79545-supp1-v2.docx
-
MDAR checklist
- https://cdn.elifesciences.org/articles/79545/elife-79545-mdarchecklist1-v2.pdf
Download links
A two-part list of links to download the article, or parts of the article, in various formats.
Downloads (link to download the article as PDF)
Open citations (links to open the citations from this article in various online reference manager services)
Cite this article (links to download the citations from this article in formats compatible with various reference manager tools)
Rhythmic coordination and ensemble dynamics in the hippocampal-prefrontal network during odor-place associative memory and decision making
eLife 11:e79545.
https://doi.org/10.7554/eLife.79545


