Association between bisphosphonate use and COVID-19 related outcomes
- Cerner Enviza, United States
- Dept. of Immunology, Harvard Medical School, United States
- Institute of General Practice and Family Medicine, University Hospital of Ludwig Maximilians-University Munich, Germany
- Center of Integrated Protein Science Munich and Division of Clinical Pharmacology, University Hospital, LMU Munich, Germany, Germany
Figures
Figure 1
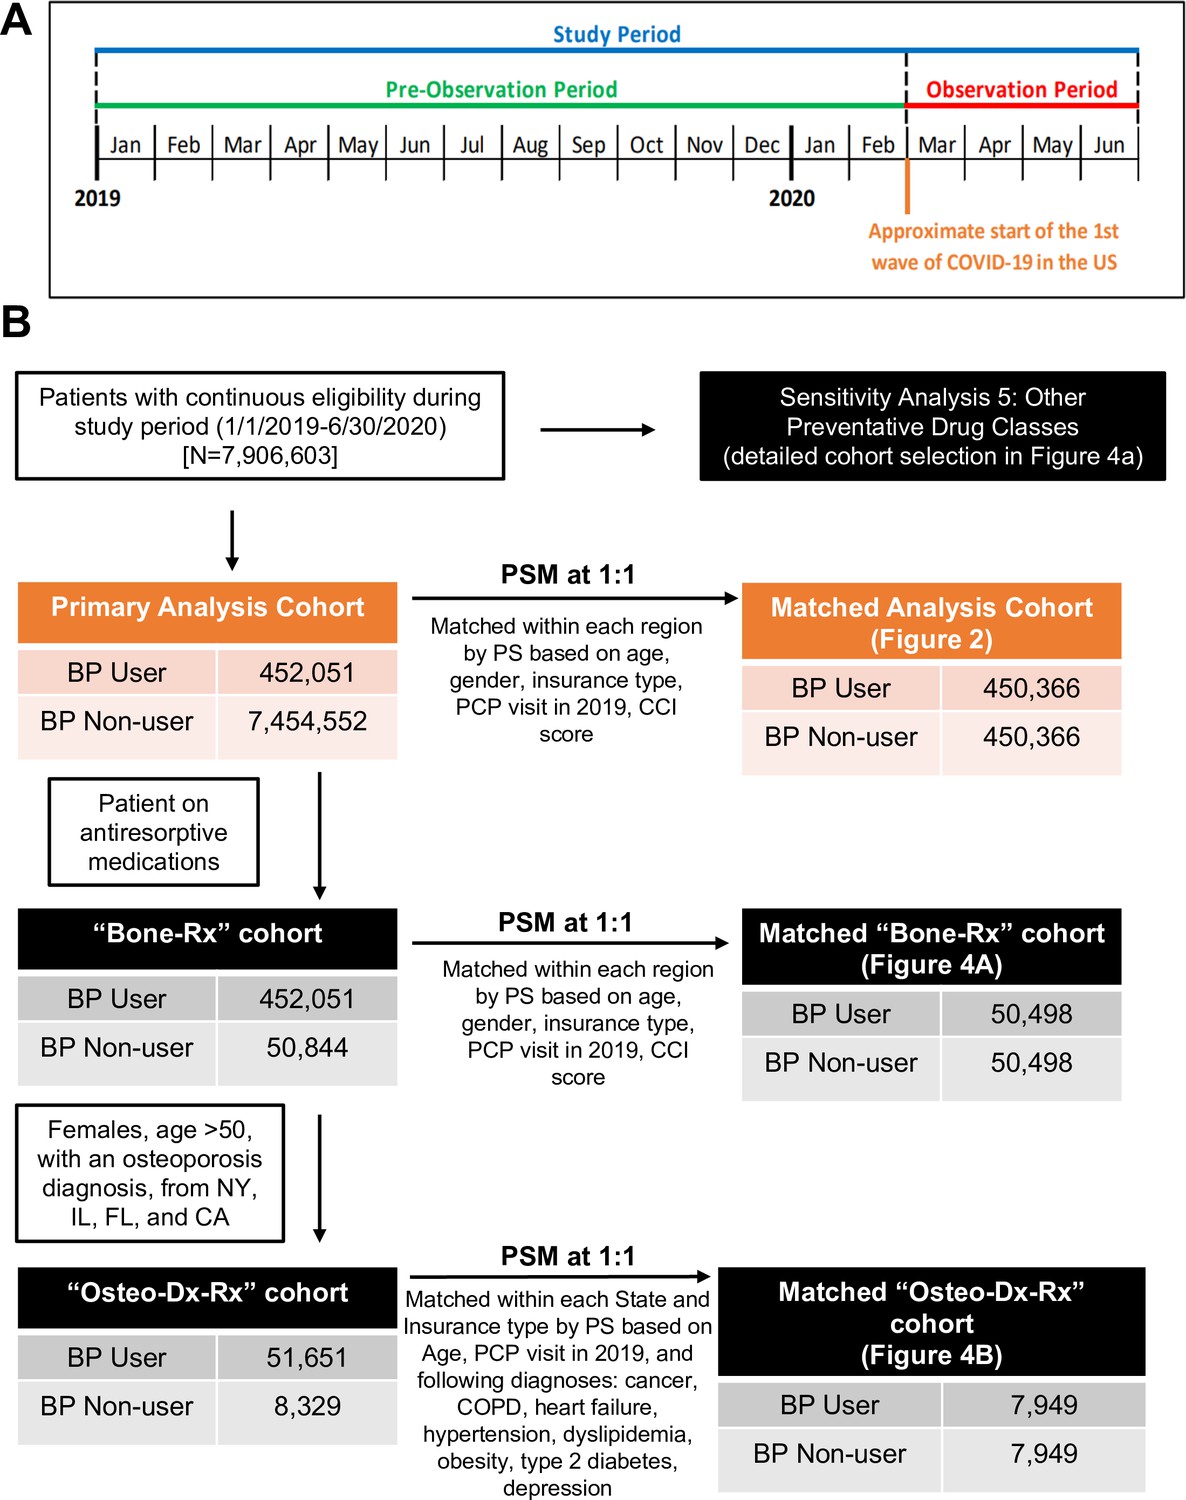
Study periods, cohort selection, and analyses of BP use on COVID-19-related outcomes.
(A) Schematic overview of the study timeline. (B) Schematic flow diagram illustrating the identification of the study population and matched control populations for primary analysis and sensitivity analyses cohorts. BP: bisphosphonate; CA: California; CCI: Charlson comorbidity index; CI: confidence interval; COPD: chronic obstructive pulmonary disease; FL: Florida; IL: Illinois; NY: New York; OR: odds ratio; PCP: primary care physician; PS: propensity score; PSM: propensity score match.
Figure 2
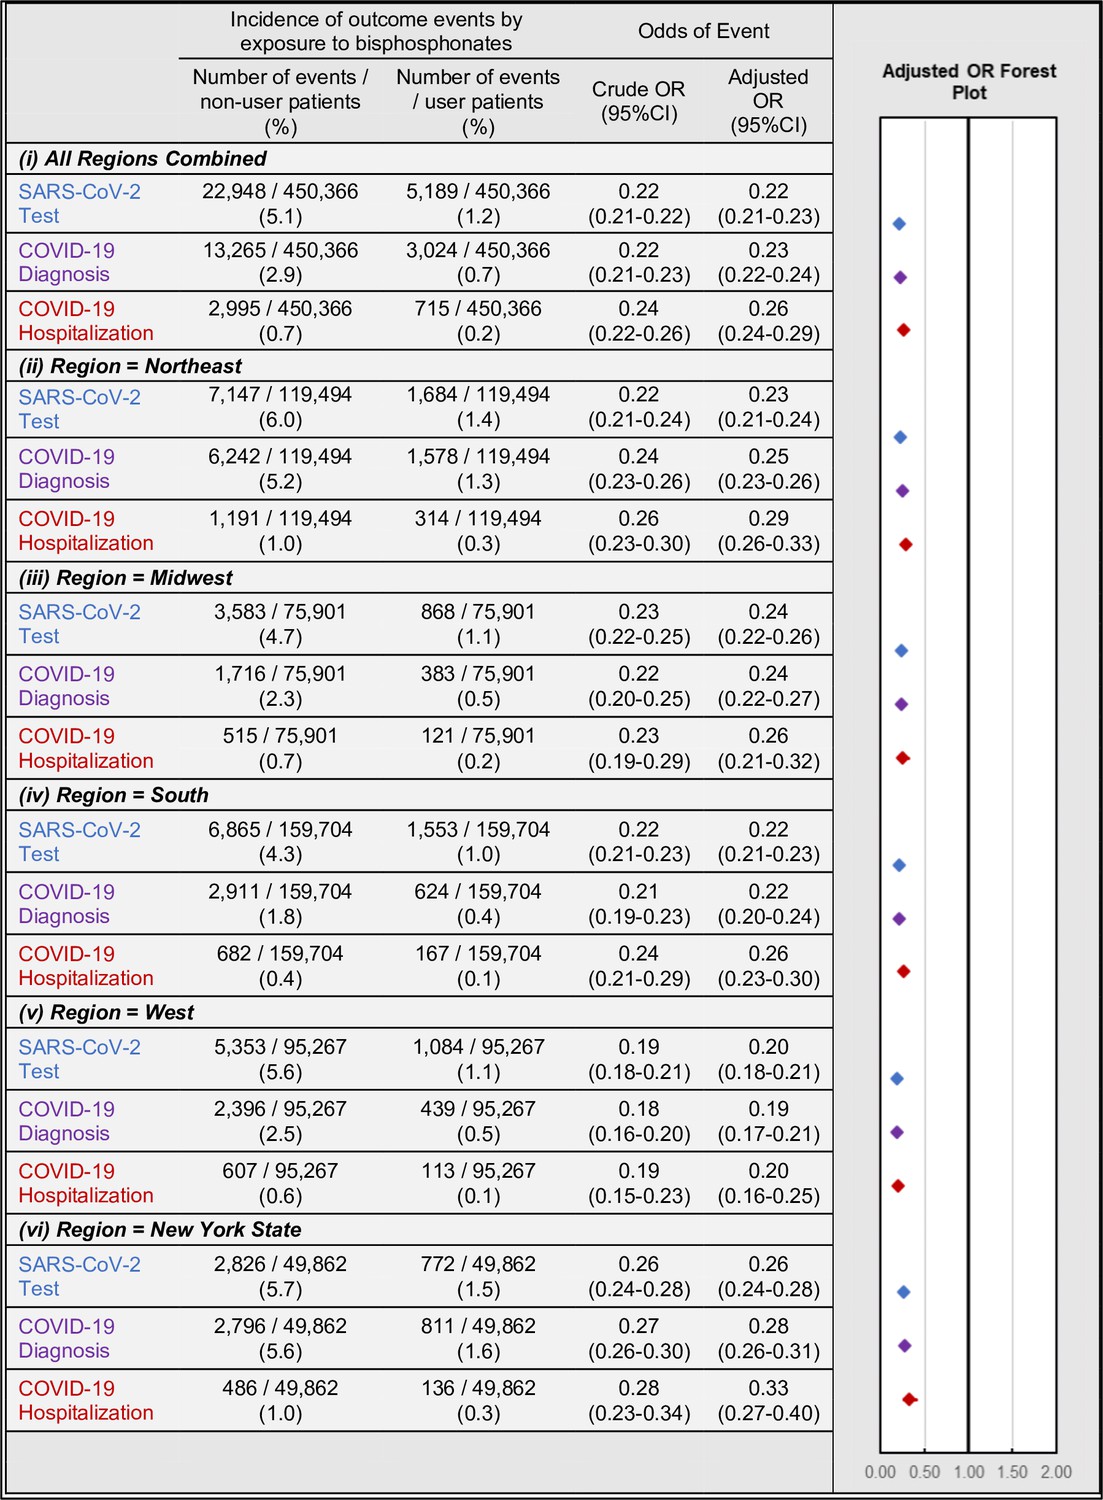
Association of BP use and COVID-19-related outcomes incidence (left) and regression-adjusted results for odds (right) of SARS-CoV-2 testing (blue), COVID-19 diagnosis (purple), and COVID-19-related hospitalizations (red) of BP users compared with BP non-users in the all-regions combined primary analysis cohort (i) and when stratified by region/state into: Northeast (ii), Midwest (iii), South (iv), West (v), and New York state (vi).
For details see Figure 2—source data 1.
-
Figure 2—source data 1
COVID-19-related outcomes in the primary analysis cohort.
- https://cdn.elifesciences.org/articles/79548/elife-79548-fig2-data1-v2.xlsx
Figure 3
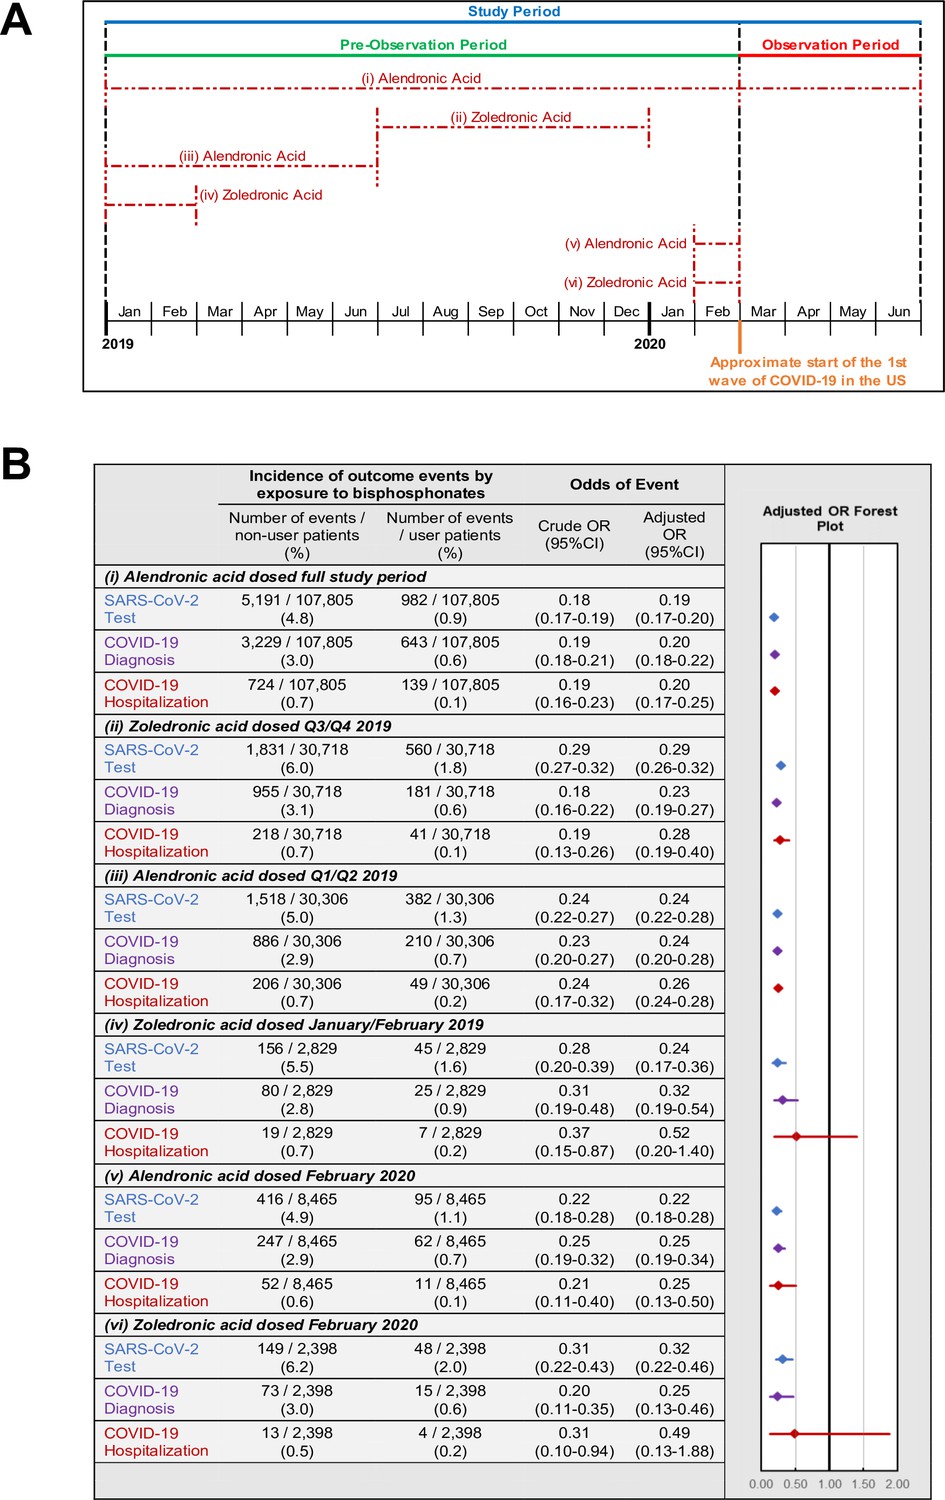
Timing of BP use and COVID-19-related outcomes.
(A) Schematic of BP user sub-stratification by timing of exposure to alendronic acid or zoledronic acid prior to outcome assessment. Broken lines represent periods of active BP dosing. For zoledronic acid users, days covered was considered to extend 1 year past the dosing period based on dosing guidelines. (B) Incidence (left) and regression-adjusted results (right) for odds of SARS-CoV-2 testing, COVID-19 diagnosis, and COVID-19-related hospitalizations of BP users compared with BP non-users in pre-specified subgroups. For further details see Figure 3—source data 1. CI: confidence interval; OR: odds ratio.
-
Figure 3—source data 1
Primary analysis cohort by timing of BP dosing, COVID-19-related outcomes.
- https://cdn.elifesciences.org/articles/79548/elife-79548-fig3-data1-v2.xlsx
Figure 4
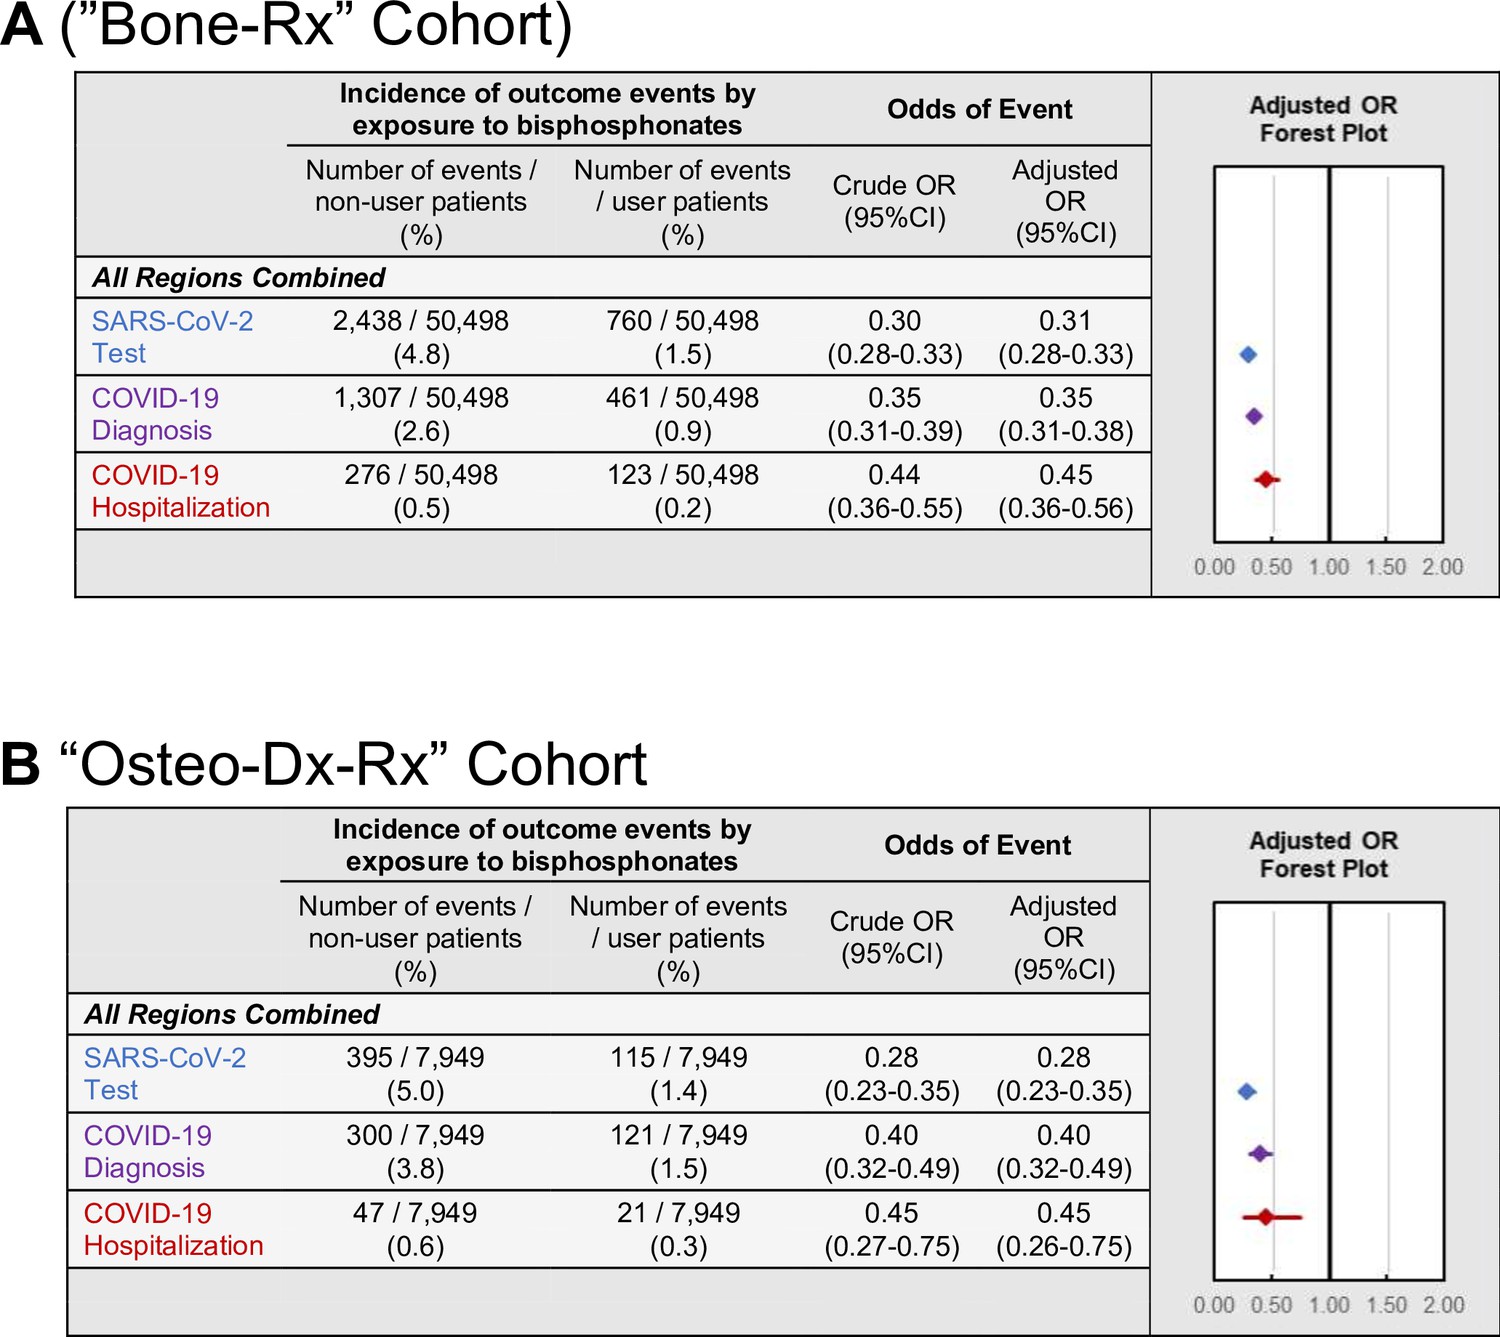
COVID-19-related outcomes among the Bone-RX and Osteo-Dx-Rx restricted cohorts.
Incidence and forest plots summarizing regression-adjusted odds ratios of SARS-CoV-2 testing (blue), COVID-19 diagnosis (purple), and COVID-19-related hospitalizations (red) in the (A) ‘Bone-Rx’ (see also Figure 4—source data 1) and (B) ‘Osteo-Dx-Rx’ sensitivity analysis cohorts (see also Figure 4—source data 2).
-
Figure 4—source data 1
Source data for Figure 4A: Bone-Rx cohort COVID-19-related outcomes.
- https://cdn.elifesciences.org/articles/79548/elife-79548-fig4-data1-v2.xlsx
-
Figure 4—source data 2
Source data for Figure 4B: Osteo-Dx-Rx cohort COVID-19-related outcomes.
- https://cdn.elifesciences.org/articles/79548/elife-79548-fig4-data2-v2.xlsx
Figure 5
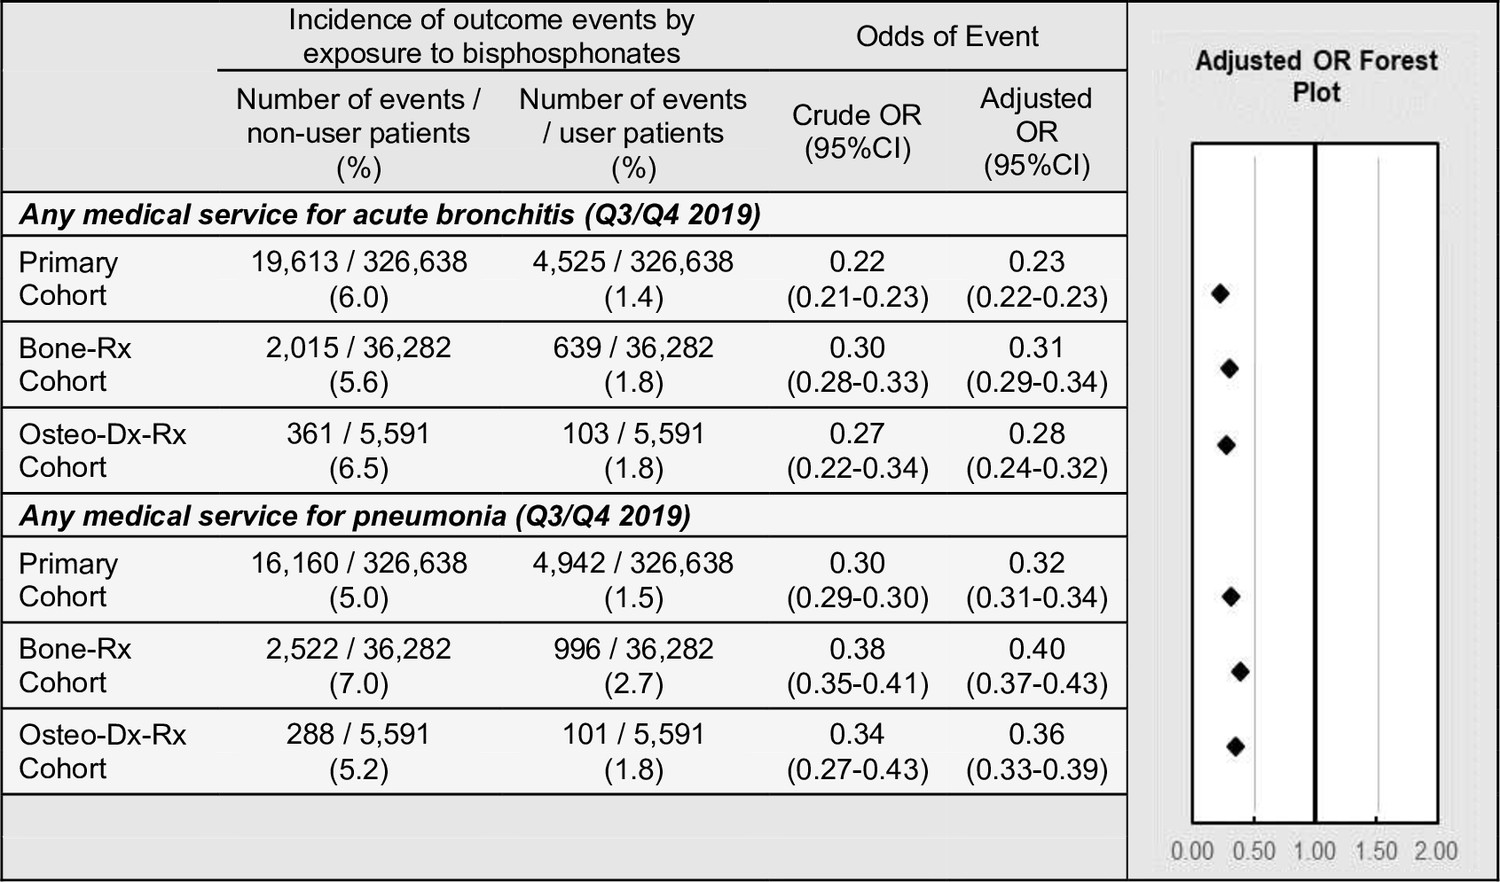
Exploratory outcomes among BP users versus BP non-users.
Incidence and adjusted odds ratios of other respiratory infections, in the primary, ‘Bone-Rx’, and ‘Osteo-Dx-Rx’ cohorts. For details, see Figure 5—source data 1. CI: confidence interval; OR: odds ratio.
-
Figure 5—source data 1
Positive control outcomes by primary, bone-Rx, and osteo-Dx-Rx cohorts.
- https://cdn.elifesciences.org/articles/79548/elife-79548-fig5-data1-v2.xlsx
Figure 6
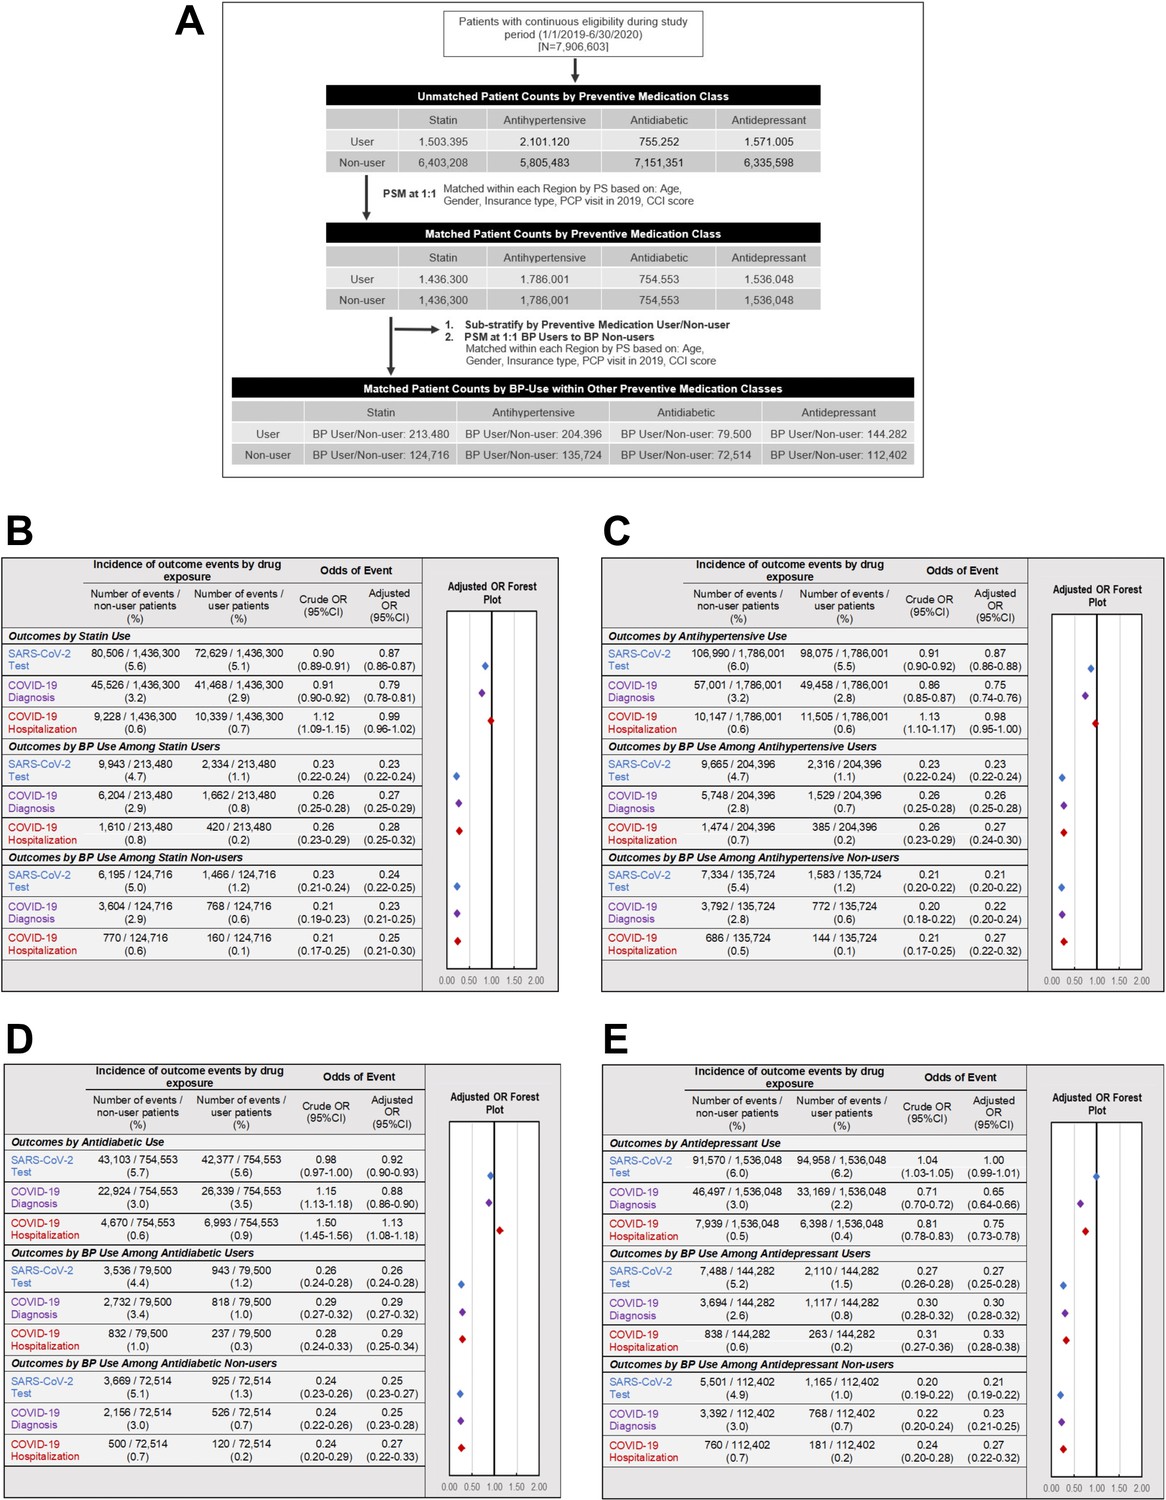
Association of other preventive drugs with COVID-19-related outcomes.
(A). Schematic illustrating the identification of study populations and matched controls for each drug class. (B–E) Incidence and adjusted odds ratios of SARS-CoV-2 testing (blue), COVID-19 diagnosis (purple), and COVID-19-related hospitalizations (red) in users and non-users of (B) statins (see also Figure 6—source data 1), (C) antihypertensive medications (see also Figure 6—source data 2), (D) non-insulin antidiabetic medications (see also Figure 6—source data 3), and (E) antidepressant medications (see also Figure 6—source data 4). For each class of preventive medications, further analysis was performed comparing BP users and BP non-users within matched cohorts of medication users (middle) and medication non-users (bottom). BP: bisphosphonate; CCI: Charlson comorbidity index; CI: confidence interval; COPD: chronic obstructive pulmonary disease; OR: odds ratio; PCP: primary care physician; PS: propensity score; PSM: propensity score match.
-
Figure 6—source data 1
Source data for Figure 6B: COVID-19-related outcomes by statin use overall & sub-stratified by BP use.
- https://cdn.elifesciences.org/articles/79548/elife-79548-fig6-data1-v2.xlsx
-
Figure 6—source data 2
Source data for Figure 6C: COVID-19-related outcomes by antihypertensive use overall & sub-stratified by BP use.
- https://cdn.elifesciences.org/articles/79548/elife-79548-fig6-data2-v2.xlsx
-
Figure 6—source data 3
Source data for Figure 6D: COVID-19-related outcomes by antidiabetic use overall & sub-stratified by BP use.
- https://cdn.elifesciences.org/articles/79548/elife-79548-fig6-data3-v2.xlsx
-
Figure 6—source data 4
Source data for Figure 6E: COVID-19-related outcomes by antidepressant use overall & sub-stratified by BP use.
- https://cdn.elifesciences.org/articles/79548/elife-79548-fig6-data4-v2.xlsx
Appendix 3—figure 1
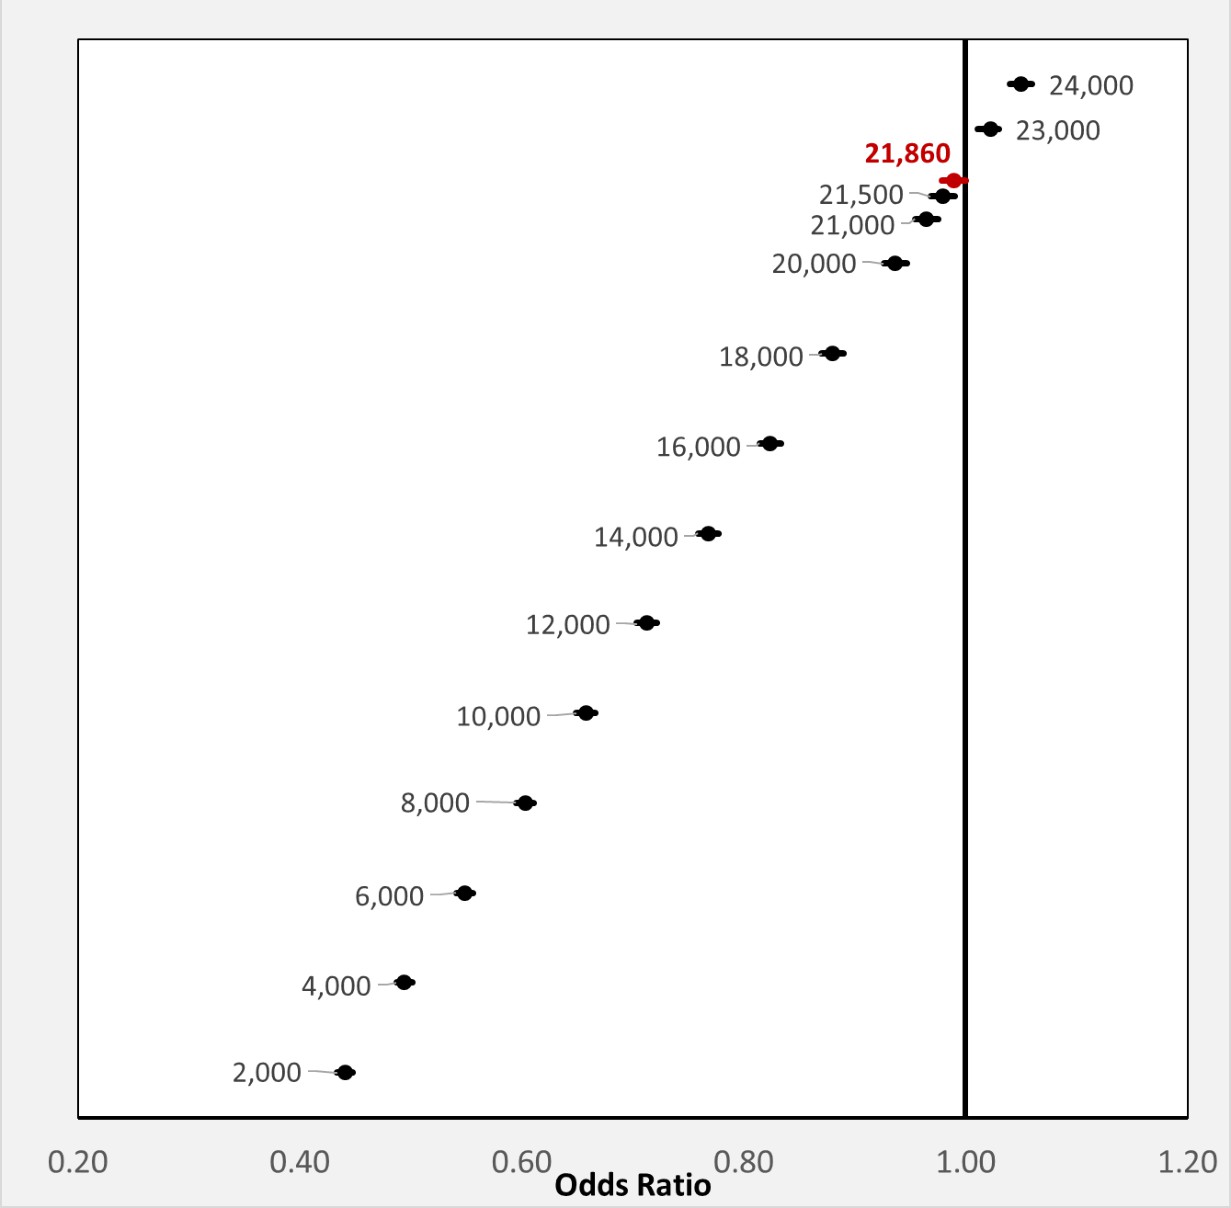
Full cohort: dds ratio by additional number of BP users classified as having COVID-19 diagnosis.Forest plot of the change in the crude odds ratio (OR) of BP users having a COVID-19 diagnosis as a factor of the additional number of BP users needed to be classified as having a COVID-19 diagnosis to reach statistical non-significance for all observations.
Appendix 3—figure 2
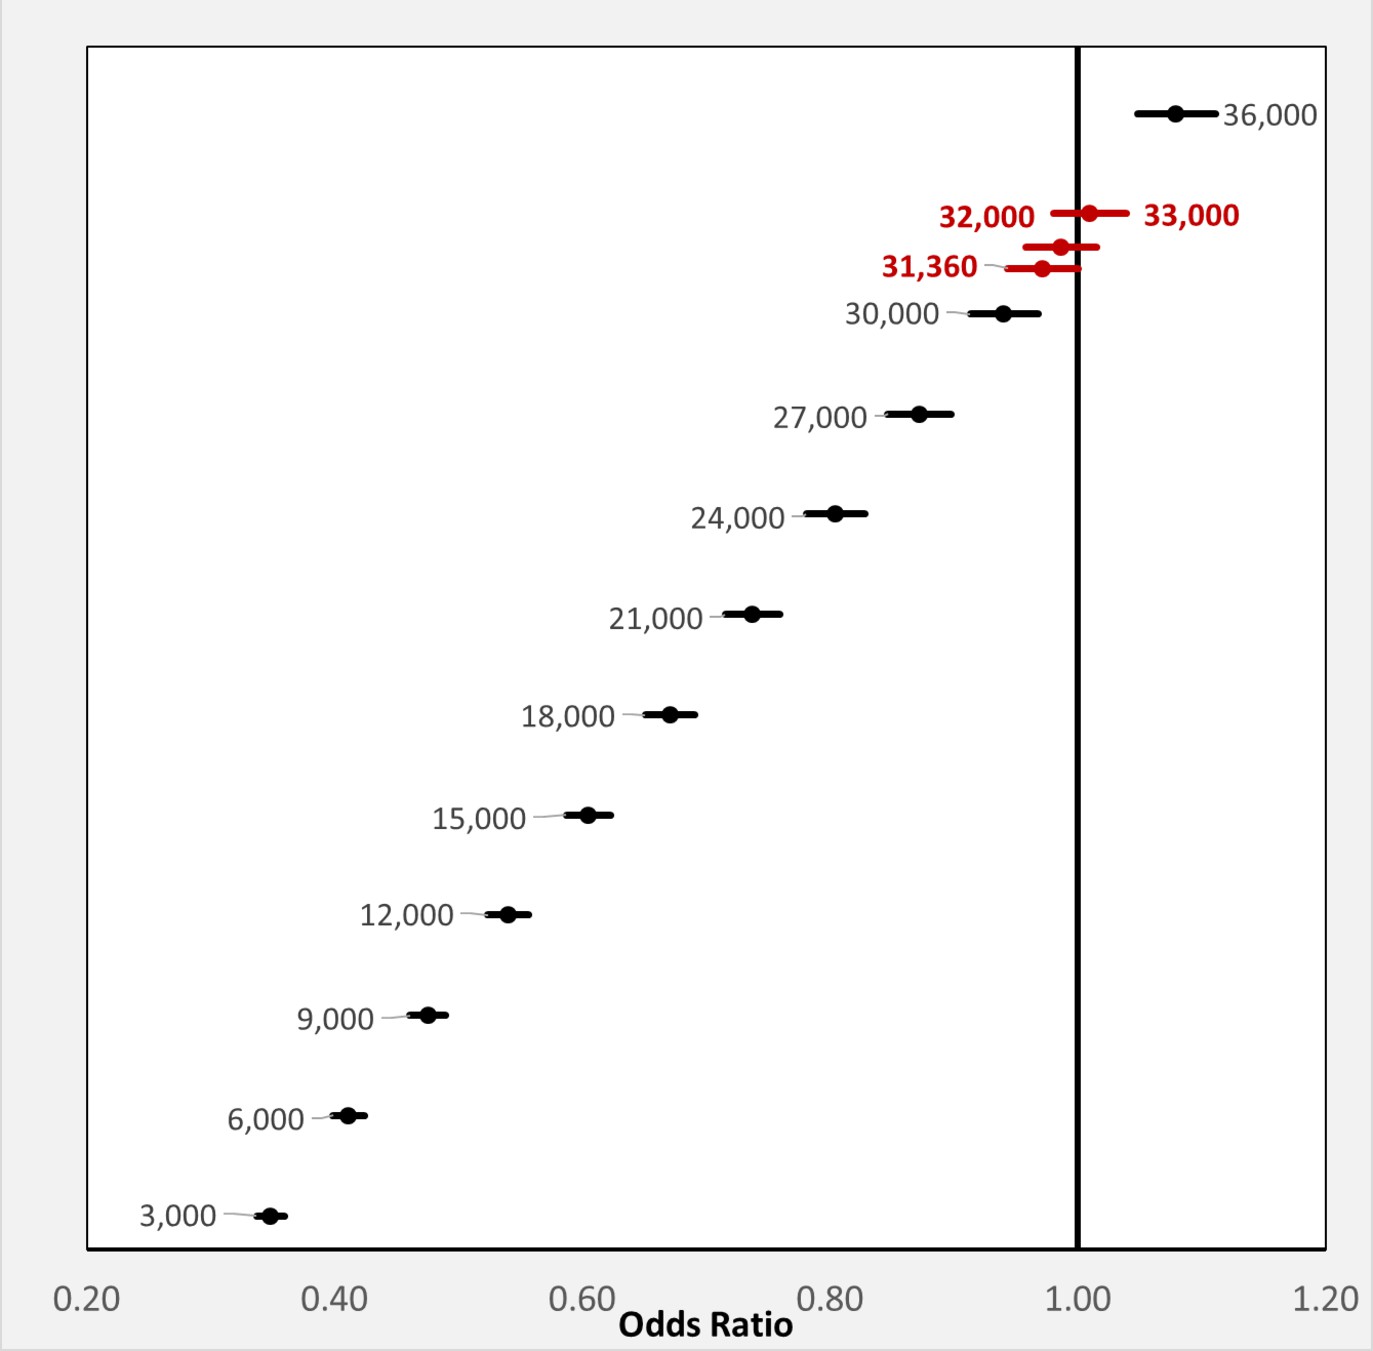
Bone-Rx cohort: odds ratio by additional number of BP users classified as having COVID-19 diagnosis.
Forest plot of the change in the crude odds ratio (OR) of BP users having a COVID-19 diagnosis as a factor of the additional number of BP users needed to be classified as having a COVID-19 diagnosis to reach statistical non-significance when comparing BP users to users of non-BP anti-resorptive bone medication
Tables
Table 1
Most recent bisphosphonate claim among all users.
| Drug (route) | N | % |
|---|---|---|
| Alendronate / alendronic acid (oral) | 340,810 | 75.4% |
| Etidronate (oral) | 14 | 0.0% |
| Ibandronate / ibandronic acid (oral) | 37,988 | 8.4% |
| Ibandronic acid (injection/infusion) | 1169 | 0.3% |
| Pamidronate (injection/infusion) | 1121 | 0.2% |
| Risedronate (oral) | 18,991 | 4.2% |
| Zoledronic acid (injection/infusion) | 51,958 | 11.5% |
Table 2
Primary analysis cohort (all regions), patient characteristics pre/post match.
| All Observations Unmatched | All Observations Matched | |||||||||||||
|---|---|---|---|---|---|---|---|---|---|---|---|---|---|---|
| All | BP Non-users | BP Users | p-value | All | BP Non-users | BP Users | p-value | |||||||
| N | % | N | % | N | % | N | % | N | % | N | % | |||
| All Patients | 7,906,603 | 100.00% | 7,454,552 | 94.30% | 452,051 | 5.70% | 900,732 | 100.00% | 450,366 | 50.00% | 450,366 | 50.00% | ||
| Demographics | ||||||||||||||
| Age | ||||||||||||||
| ≤20 | 1,840,050 | 23.30% | 1,838,922 | 24.70% | 1,128 | 0.20% | <0.001 | 2,253 | 0.30% | 1,125 | 0.20% | 1,128 | 0.30% | 1 |
| 21-40 | 1,446,999 | 18.30% | 1,443,908 | 19.40% | 3,091 | 0.70% | 6,195 | 0.70% | 3,104 | 0.70% | 3,091 | 0.70% | ||
| 41-50 | 925,309 | 11.70% | 916,758 | 12.30% | 8,551 | 1.90% | 17,096 | 1.90% | 8,545 | 1.90% | 8,551 | 1.90% | ||
| 51-60 | 1,250,190 | 15.80% | 1,184,469 | 15.90% | 65,721 | 14.50% | 131,445 | 14.60% | 65,724 | 14.60% | 65,721 | 14.60% | ||
| 61-70 | 1,181,261 | 14.90% | 1,024,383 | 13.70% | 156,878 | 34.70% | 313,822 | 34.80% | 156,944 | 34.80% | 156,878 | 34.80% | ||
| 71-80 | 783,775 | 9.90% | 642,050 | 8.60% | 141,725 | 31.40% | 280,803 | 31.20% | 140,366 | 31.20% | 140,437 | 31.20% | ||
| ≥81 | 479,019 | 6.10% | 404,062 | 5.40% | 74,957 | 16.60% | 149,118 | 16.60% | 74,558 | 16.60% | 74,560 | 16.60% | ||
| Gender | ||||||||||||||
| Female | 4,670,960 | 59.10% | 4,263,524 | 57.20% | 407,436 | 90.10% | <0.001 | 811,497 | 90.10% | 405,746 | 90.10% | 405,751 | 90.10% | 0.99 |
| Male | 3,235,643 | 40.90% | 3,191,028 | 42.80% | 44,615 | 9.90% | 89,235 | 9.90% | 44,620 | 9.90% | 44,615 | 9.90% | ||
| Region | ||||||||||||||
| Midwest | 1,467,802 | 18.60% | 1,391,835 | 18.70% | 75,967 | 16.80% | <0.001 | 151,802 | 16.90% | 75,901 | 16.90% | 75,901 | 16.90% | 1 |
| Northeast | 2,152,560 | 27.20% | 2,032,832 | 27.30% | 119,728 | 26.50% | 238,988 | 26.50% | 119,494 | 26.50% | 119,494 | 26.50% | ||
| South | 3,042,604 | 38.50% | 2,881,718 | 38.70% | 160,886 | 35.60% | 319,408 | 35.50% | 159,704 | 35.50% | 159,704 | 35.50% | ||
| West | 1,243,637 | 15.70% | 1,148,167 | 15.40% | 95,470 | 21.10% | 190,534 | 21.20% | 95,267 | 21.20% | 95,267 | 21.20% | ||
| Insurance | ||||||||||||||
| Commercial | 3,938,603 | 49.80% | 3,791,545 | 50.90% | 147,058 | 32.50% | <0.001 | 294,070 | 32.60% | 147,012 | 32.60% | 147,058 | 32.70% | 1 |
| Dual | 156,497 | 2.00% | 125,090 | 1.70% | 31,407 | 6.90% | 59,936 | 6.70% | 29,980 | 6.70% | 29,956 | 6.70% | ||
| Medicaid | 2,594,500 | 32.80% | 2,517,020 | 33.80% | 77,480 | 17.10% | 154,519 | 17.20% | 77,272 | 17.20% | 77,247 | 17.20% | ||
| Medicare | 1,217,003 | 15.40% | 1,020,897 | 13.70% | 196,106 | 43.40% | 392,207 | 43.50% | 196,102 | 43.50% | 196,105 | 43.50% | ||
| PCP Visit 2019 | ||||||||||||||
| No | 4,283,697 | 54.20% | 4,119,831 | 55.30% | 163,866 | 36.20% | <0.001 | 327,383 | 36.30% | 163,659 | 36.30% | 163,724 | 36.40% | 0.89 |
| Yes | 3,622,906 | 45.80% | 3,334,721 | 44.70% | 288,185 | 63.80% | 573,349 | 63.70% | 286,707 | 63.70% | 286,642 | 63.60% | ||
| Clinical Characteristics | ||||||||||||||
| mean | SD | mean | SD | mean | SD | p-value | mean | SD | mean | SD | mean | SD | p-value | |
| CCI | 0.62 | 1.38 | 0.6 | 1.35 | 0.95 | 1.76 | <0.001 | 0.95 | 1.76 | 0.95 | 1.76 | 0.95 | 1.76 | 0.7 |
| Regression Comorbidity Covariates | ||||||||||||||
| N | % | N | % | N | % | p-value | N | % | N | % | N | % | p-value | |
| Osteoporosis | 267,020 | 3.40% | 135,231 | 1.80% | 131,789 | 29.20% | <0.001 | 163,814 | 18.20% | 32,390 | 7.20% | 131,424 | 29.20% | <0.001 |
| Cancer | 419,083 | 5.30% | 366,786 | 4.90% | 52,297 | 11.60% | <0.001 | 94,148 | 10.50% | 41,861 | 9.30% | 52,287 | 11.60% | <0.001 |
| CKD/ESRD | 361,451 | 4.60% | 328,633 | 4.40% | 32,818 | 7.30% | <0.001 | 68,999 | 7.70% | 36,182 | 8.00% | 32,817 | 7.30% | <0.001 |
| COPD | 466,094 | 5.90% | 427,850 | 5.70% | 38,244 | 8.50% | <0.001 | 84,234 | 9.40% | 45,990 | 10.20% | 38,244 | 8.50% | <0.001 |
| CVD | 1,084,031 | 13.70% | 999,526 | 13.40% | 84,505 | 18.70% | <0.001 | 197,243 | 21.90% | 112,933 | 25.10% | 84,310 | 18.70% | <0.001 |
| Dementia | 125,811 | 1.60% | 113,778 | 1.50% | 12,033 | 2.70% | <0.001 | 24,921 | 2.80% | 12,889 | 2.90% | 12,032 | 2.70% | <0.001 |
| Depression | 571,303 | 7.20% | 531,355 | 7.10% | 39,948 | 8.80% | <0.001 | 86,280 | 9.60% | 46,431 | 10.30% | 39,849 | 8.80% | <0.001 |
| Dyslipidemia | 1,532,254 | 19.40% | 1,375,920 | 18.50% | 156,334 | 34.60% | <0.001 | 322,125 | 35.80% | 166,360 | 36.90% | 155,765 | 34.60% | <0.001 |
| HIV/AIDS | 33,229 | 0.40% | 31,711 | 0.40% | 1518 | 0.30% | <0.001 | 2897 | 0.30% | 1379 | 0.30% | 1,518 | 0.30% | 0.01 |
| Hypertension | 1,899,063 | 24.00% | 1,723,519 | 23.10% | 175,544 | 38.80% | <0.001 | 384,059 | 42.60% | 209,184 | 46.40% | 174,875 | 38.80% | <0.001 |
| Liver Disease | 251,331 | 3.20% | 231,664 | 3.10% | 19,667 | 4.40% | <0.001 | 38,697 | 4.30% | 19,031 | 4.20% | 19,666 | 4.40% | 0.001 |
| Obesity | 638,506 | 8.10% | 608,083 | 8.20% | 30,423 | 6.70% | <0.001 | 76,844 | 8.50% | 46,498 | 10.30% | 30,346 | 6.70% | <0.001 |
| Sickle Cell Anemia | 10,499 | 0.10% | 10,292 | 0.10% | 207 | 0.00% | <0.001 | 422 | 0.00% | 215 | 0.00% | 207 | 0.00% | 0.7 |
| Stroke | 104,859 | 1.30% | 97,001 | 1.30% | 7,858 | 1.70% | <0.001 | 19,395 | 2.20% | 11,569 | 2.60% | 7,826 | 1.70% | <0.001 |
| Type 2 Diabetes | 978,239 | 12.40% | 895,983 | 12.00% | 82,256 | 18.20% | <0.001 | 184,978 | 20.50% | 103,031 | 22.90% | 81,947 | 18.20% | <0.001 |
Appendix 2—table 1
Primary Analysis Cohort (Region=Northeast), Patient Characteristics Pre/Post Match.
| Region=Northeast Unmatched | Region=Northeast Matched | |||||||||||||
|---|---|---|---|---|---|---|---|---|---|---|---|---|---|---|
| All | BP Non-users | BP Users | p-value | All | BP Non-users | BP Users | p-value | |||||||
| N | % | N | % | N | % | N | % | N | % | N | % | |||
| All Patients | 2,152,560 | 100.00% | 2,032,832 | 94.40% | 119,728 | 5.60% | 238,988 | 100.00% | 119,494 | 50.00% | 119,494 | 50.00% | ||
| Age | ||||||||||||||
| ≤20 | 363,637 | 16.90% | 363,401 | 17.90% | 236 | 0.20% | <0.001 | 474 | 0.20% | 238 | 0.20% | 236 | 0.20% | 1 |
| 21-40 | 397,377 | 18.50% | 396,613 | 19.50% | 764 | 0.60% | 1,528 | 0.60% | 764 | 0.60% | 764 | 0.60% | ||
| 41-50 | 261,570 | 12.20% | 259,528 | 12.80% | 2,042 | 1.70% | 4,084 | 1.70% | 2,042 | 1.70% | 2,042 | 1.70% | ||
| 51-60 | 372,238 | 17.30% | 354,228 | 17.40% | 18,010 | 15.00% | 36,020 | 15.10% | 18,010 | 15.10% | 18,010 | 15.10% | ||
| 61-70 | 354,331 | 16.50% | 313,237 | 15.40% | 41,094 | 34.30% | 82,233 | 34.40% | 41,139 | 34.40% | 41,094 | 34.40% | ||
| 71-80 | 252,712 | 11.70% | 215,151 | 10.60% | 37,561 | 31.40% | 74,831 | 31.30% | 37,393 | 31.30% | 37,438 | 31.30% | ||
| ≥81 | 150,695 | 7.00% | 130,674 | 6.40% | 20,021 | 16.70% | 39,818 | 16.70% | 19,908 | 16.70% | 19,910 | 16.70% | ||
| Gender | ||||||||||||||
| Female | 1,275,611 | 59.30% | 1,167,241 | 57.40% | 108,370 | 90.50% | <0.001 | 216,273 | 90.50% | 108,137 | 90.50% | 108,136 | 90.50% | 0.99 |
| Male | 876,949 | 40.70% | 865,591 | 42.60% | 11,358 | 9.50% | 22,715 | 9.50% | 11,357 | 9.50% | 11,358 | 9.50% | ||
| Insurance | ||||||||||||||
| Commercial | 1,050,795 | 48.80% | 1,017,502 | 50.10% | 33,293 | 27.80% | <0.001 | 66,552 | 27.80% | 33,259 | 27.80% | 33,293 | 27.90% | 0.99 |
| Dual | 47,773 | 2.20% | 40,168 | 2.00% | 7,605 | 6.40% | 15,114 | 6.30% | 7,576 | 6.30% | 7,538 | 6.30% | ||
| Medicaid | 631,863 | 29.40% | 608,649 | 29.90% | 23,214 | 19.40% | 46,094 | 19.30% | 23,047 | 19.30% | 23,047 | 19.30% | ||
| Medicare | 422,129 | 19.60% | 366,513 | 18.00% | 55,616 | 46.50% | 111,228 | 46.50% | 55,612 | 46.50% | 55,616 | 46.50% | ||
| PCP Visit 2019 | ||||||||||||||
| No | 1,212,394 | 56.30% | 1,162,527 | 57.20% | 49,867 | 41.70% | <0.001 | 99,741 | 41.70% | 49,874 | 41.70% | 49,867 | 41.70% | 0.98 |
| Yes | 940,166 | 43.70% | 870,305 | 42.80% | 69,861 | 58.30% | 139,247 | 58.30% | 69,620 | 58.30% | 69,627 | 58.30% | ||
| Continuous Outcomes | ||||||||||||||
| mean | SD | mean | SD | mean | SD | p-value | mean | SD | mean | SD | mean | SD | p-value | |
| CCI | 0.67 | 1.42 | 0.65 | 1.4 | 0.93 | 1.71 | <0.001 | 0.93 | 1.71 | 0.93 | 1.71 | 0.93 | 1.71 | 0.96 |
-
BP: bisphosphonate; CCI: Charlson Comorbidity Index; PCP: primary care physician; SD: standard deviation.
Appendix 2—table 2
Primary Analysis Cohort (Region=Midwest), Patient Characteristics Pre/Post Match.
| Region=Midwest Unmatched | Region=Midwest Matched | |||||||||||||
|---|---|---|---|---|---|---|---|---|---|---|---|---|---|---|
| All | BP Non-users | BP Users | p-value | All | BP Non-users | BP Users | p-value | |||||||
| N | % | N | % | N | % | N | % | N | % | N | % | |||
| All Patients | 1,467,802 | 100.0% | 1,391,835 | 94.8% | 75,967 | 5.2% | 151,802 | 100.0% | 75,901 | 50.0% | 75,901 | 50.0% | ||
| Age | ||||||||||||||
| ≤20 | 310,027 | 21.1% | 309,759 | 22.3% | 268 | 0.4% | <0.001 | 537 | 0.4% | 269 | 0.4% | 268 | 0.4% | 1.00 |
| 21-40 | 287,236 | 19.6% | 286,643 | 20.6% | 593 | 0.8% | 1,188 | 0.8% | 595 | 0.8% | 593 | 0.8% | ||
| 41-50 | 185,240 | 12.6% | 183,556 | 13.2% | 1,684 | 2.2% | 3,367 | 2.2% | 1,683 | 2.2% | 1,684 | 2.2% | ||
| 51-60 | 246,230 | 16.8% | 233,992 | 16.8% | 12,238 | 16.1% | 24,478 | 16.1% | 12,240 | 16.1% | 12,238 | 16.1% | ||
| 61-70 | 224,668 | 15.3% | 196,172 | 14.1% | 28,496 | 37.5% | 56,991 | 37.5% | 28,495 | 37.5% | 28,496 | 37.5% | ||
| 71-80 | 130,563 | 8.9% | 109,442 | 7.9% | 21,121 | 27.8% | 42,153 | 27.8% | 21,075 | 27.8% | 21,078 | 27.8% | ||
| ≥81 | 83,838 | 5.7% | 72,271 | 5.2% | 11,567 | 15.2% | 23,088 | 15.2% | 11,544 | 15.2% | 11,544 | 15.2% | ||
| Gender | ||||||||||||||
| Female | 863,156 | 58.8% | 794,578 | 57.1% | 68,578 | 90.3% | <0.001 | 137,028 | 90.3% | 68,516 | 90.3% | 68,512 | 90.3% | 0.97 |
| Male | 604,646 | 41.2% | 597,257 | 42.9% | 7,389 | 9.7% | 14,774 | 9.7% | 7,385 | 9.7% | 7,389 | 9.7% | ||
| Insurance | ||||||||||||||
| Commercial | 885,651 | 60.3% | 854,518 | 61.4% | 31,133 | 41.0% | <0.001 | 62,243 | 41.0% | 31,110 | 41.0% | 31,133 | 41.0% | 1.00 |
| Dual | 28,190 | 1.9% | 24,584 | 1.8% | 3,606 | 4.7% | 7,211 | 4.8% | 3,605 | 4.7% | 3,606 | 4.8% | ||
| Medicaid | 318,596 | 21.7% | 310,473 | 22.3% | 8,123 | 10.7% | 16,136 | 10.6% | 8,079 | 10.6% | 8,057 | 10.6% | ||
| Medicare | 235,365 | 16.0% | 202,260 | 14.5% | 33,105 | 43.6% | 66,212 | 43.6% | 33,107 | 43.6% | 33,105 | 43.6% | ||
| PCP Visit 2019 | ||||||||||||||
| No | 711,308 | 48.5% | 682,601 | 49.0% | 28,707 | 37.8% | <0.001 | 57,398 | 37.8% | 28,691 | 37.8% | 28,707 | 37.8% | 0.93 |
| Yes | 756,494 | 51.5% | 709,234 | 51.0% | 47,260 | 62.2% | 94,404 | 62.2% | 47,210 | 62.2% | 47,194 | 62.2% | ||
| Continuous Outcomes | ||||||||||||||
| mean | SD | mean | SD | mean | SD | p-value | mean | SD | mean | SD | mean | SD | p-value | |
| CCI | 0.59 | 1.37 | 0.56 | 1.34 | 0.99 | 1.86 | <0.001 | 0.99 | 1.86 | 0.99 | 1.85 | 1.00 | 1.86 | 0.77 |
-
BP: bisphosphonate; CCI: Charlson Comorbidity Index; PCP: primary care physician; SD: standard deviation.
Appendix 2—table 3
Primary Analysis Cohort (Region=South), Patient Characteristics Pre/Post Match.
| Region=South Unmatched | Region=South Matched | |||||||||||||
|---|---|---|---|---|---|---|---|---|---|---|---|---|---|---|
| All | BP Non-users | BP Users | p-value | All | BP Non-users | BP Users | p-value | |||||||
| N | % | N | % | N | % | N | % | N | % | N | % | |||
| All Patients | 3,042,604 | 100.0% | 2,881,718 | 94.7% | 160,886 | 5.3% | 319,408 | 100.0% | 159,704 | 50.0% | 159,704 | 50.0% | ||
| Age | ||||||||||||||
| ≤20 | 890,677 | 29.3% | 890,203 | 30.9% | 474 | 0.3% | <0.001 | 943 | 0.3% | 469 | 0.3% | 474 | 0.3% | 1.00 |
| 21-40 | 527,971 | 17.4% | 526,794 | 18.3% | 1,177 | 0.7% | 2,364 | 0.7% | 1,187 | 0.7% | 1,177 | 0.7% | ||
| 41-50 | 338,262 | 11.1% | 334,841 | 11.6% | 3,421 | 2.1% | 6,839 | 2.1% | 3,418 | 2.1% | 3,421 | 2.1% | ||
| 51-60 | 442,757 | 14.6% | 417,664 | 14.5% | 25,093 | 15.6% | 50,186 | 15.7% | 25,093 | 15.7% | 25,093 | 15.7% | ||
| 61-70 | 409,854 | 13.5% | 353,958 | 12.3% | 55,896 | 34.7% | 111,800 | 35.0% | 55,904 | 35.0% | 55,896 | 35.0% | ||
| 71-80 | 272,761 | 9.0% | 222,156 | 7.7% | 50,605 | 31.5% | 99,223 | 31.1% | 49,605 | 31.1% | 49,618 | 31.1% | ||
| ≥81 | 160,322 | 5.3% | 136,102 | 4.7% | 24,220 | 15.1% | 48,053 | 15.0% | 24,028 | 15.0% | 24,025 | 15.0% | ||
| Gender | ||||||||||||||
| Female | 1,800,166 | 59.2% | 1,654,351 | 57.4% | 145,815 | 90.6% | <0.001 | 289,263 | 90.6% | 144,630 | 90.6% | 144,633 | 90.6% | 0.99 |
| Male | 1,242,438 | 40.8% | 1,227,367 | 42.6% | 15,071 | 9.4% | 30,145 | 9.4% | 15,074 | 9.4% | 15,071 | 9.4% | ||
| Insurance | ||||||||||||||
| Commercial | 1,475,456 | 48.5% | 1,416,166 | 49.1% | 59,290 | 36.9% | <0.001 | 118,587 | 37.1% | 59,297 | 37.1% | 59,290 | 37.1% | 1.00 |
| Dual | 53,474 | 1.8% | 39,414 | 1.4% | 14,060 | 8.7% | 25,752 | 8.1% | 12,874 | 8.1% | 12,878 | 8.1% | ||
| Medicaid | 1,121,606 | 36.9% | 1,099,957 | 38.2% | 21,649 | 13.5% | 43,299 | 13.6% | 21,650 | 13.6% | 21,649 | 13.6% | ||
| Medicare | 392,068 | 12.9% | 326,181 | 11.3% | 65,887 | 41.0% | 131,770 | 41.3% | 65,883 | 41.3% | 65,887 | 41.3% | ||
| PCP Visit 2019 | ||||||||||||||
| No | 1,701,040 | 55.9% | 1,646,572 | 57.1% | 54,468 | 33.9% | <0.001 | 108,601 | 34.0% | 54,275 | 34.0% | 54,326 | 34.0% | 0.85 |
| Yes | 1,341,564 | 44.1% | 1,235,146 | 42.9% | 106,418 | 66.1% | 210,807 | 66.0% | 105,429 | 66.0% | 105,378 | 66.0% | ||
| Continuous Outcomes | ||||||||||||||
| mean | SD | mean | SD | mean | SD | p-value | mean | SD | mean | SD | mean | SD | p-value | |
| CCI | 0.57 | 1.31 | 0.55 | 1.28 | 0.86 | 1.70 | <0.001 | 0.86 | 1.70 | 0.86 | 1.70 | 0.86 | 1.71 | 0.84 |
-
BP: bisphosphonate; CCI: Charlson Comorbidity Index; PCP: primary care physician; SD: standard deviation.
Appendix 2—table 4
Primary Analysis Cohort (Region=West), Patient Characteristics Pre/Post Match.
| Region=West Unmatched | Region=West Matched | |||||||||||||
|---|---|---|---|---|---|---|---|---|---|---|---|---|---|---|
| All | BP Non-users | BP Users | p-value | All | BP Non-users | BP Users | p-value | |||||||
| N | % | N | % | N | % | N | % | N | % | N | % | |||
| All Patients | 1,243,637 | 100.0% | 1,148,167 | 92.3% | 95,470 | 7.7% | 190,534 | 100.0% | 95,267 | 50.0% | 95,267 | 50.0% | ||
| Age | ||||||||||||||
| ≤20 | 275,709 | 22.2% | 275,559 | 24.0% | 150 | 0.2% | <0.001 | 299 | 0.2% | 149 | 0.2% | 150 | 0.2% | 1.00 |
| 21-40 | 234,415 | 18.8% | 233,858 | 20.4% | 557 | 0.6% | 1,115 | 0.6% | 558 | 0.6% | 557 | 0.6% | ||
| 41-50 | 140,237 | 11.3% | 138,833 | 12.1% | 1,404 | 1.5% | 2,806 | 1.5% | 1,402 | 1.5% | 1,404 | 1.5% | ||
| 51-60 | 188,965 | 15.2% | 178,585 | 15.6% | 10,380 | 10.9% | 20,761 | 10.9% | 10,381 | 10.9% | 10,380 | 10.9% | ||
| 61-70 | 192,408 | 15.5% | 161,016 | 14.0% | 31,392 | 32.9% | 62,798 | 33.0% | 31,406 | 33.0% | 31,392 | 33.0% | ||
| 71-80 | 127,739 | 10.3% | 95,301 | 8.3% | 32,438 | 34.0% | 64,596 | 33.9% | 32,293 | 33.9% | 32,303 | 33.9% | ||
| ≥81 | 84,164 | 6.8% | 65,015 | 5.7% | 19,149 | 20.1% | 38,159 | 20.0% | 19,078 | 20.0% | 19,081 | 20.0% | ||
| Gender | ||||||||||||||
| Female | 732,027 | 58.9% | 647,354 | 56.4% | 84,673 | 88.7% | <0.001 | 168,933 | 88.7% | 84,463 | 88.7% | 84,470 | 88.7% | 0.96 |
| Male | 511,610 | 41.1% | 500,813 | 43.6% | 10,797 | 11.3% | 21,601 | 11.3% | 10,804 | 11.3% | 10,797 | 11.3% | ||
| Insurance | ||||||||||||||
| Commercial | 526,701 | 42.4% | 503,359 | 43.8% | 23,342 | 24.4% | <0.001 | 46,688 | 24.5% | 23,346 | 24.5% | 23,342 | 24.5% | 1.00 |
| Dual | 27,060 | 2.2% | 20,924 | 1.8% | 6,136 | 6.4% | 11,859 | 6.2% | 5,925 | 6.2% | 5,934 | 6.2% | ||
| Medicaid | 522,435 | 42.0% | 497,941 | 43.4% | 24,494 | 25.7% | 48,990 | 25.7% | 24,496 | 25.7% | 24,494 | 25.7% | ||
| Medicare | 167,441 | 13.5% | 125,943 | 11.0% | 41,498 | 43.5% | 82,997 | 43.6% | 41,500 | 43.6% | 41,497 | 43.6% | ||
| PCP Visit 2019 | ||||||||||||||
| No | 658,955 | 53.0% | 628,131 | 54.7% | 30,824 | 32.3% | <0.001 | 61,643 | 32.4% | 30,819 | 32.4% | 30,824 | 32.4% | 0.98 |
| Yes | 584,682 | 47.0% | 520,036 | 45.3% | 64,646 | 67.7% | 128,891 | 67.6% | 64,448 | 67.6% | 64,443 | 67.6% | ||
| Continuous Outcomes | ||||||||||||||
| mean | SD | mean | SD | mean | SD | p-value | mean | SD | mean | SD | mean | SD | p-value | |
| CCI | 0.69 | 1.46 | 0.66 | 1.42 | 1.08 | 1.84 | <0.001 | 1.09 | 1.83 | 1.08 | 1.83 | 1.09 | 1.84 | 0.73 |
-
BP: bisphosphonate; CCI: Charlson Comorbidity Index; PCP: primary care physician; SD: standard deviation.
Appendix 2—table 5
Primary Analysis Cohort (Region=New York State), Patient Characteristics Pre/Post Match.
| Region=New York State Unmatched | Region=New York State Matched | |||||||||||||
|---|---|---|---|---|---|---|---|---|---|---|---|---|---|---|
| All | BP Non-users | BP Users | p-value | All | BP Non-users | BP Users | p-value | |||||||
| N | % | N | % | N | % | N | % | N | % | N | % | |||
| All Patients | 968,296 | 100.0% | 918,261 | 94.8% | 50,035 | 5.2% | 99,724 | 100.0% | 49,862 | 50.0% | 49,862 | 50.0% | ||
| Age | ||||||||||||||
| ≤20 | 133,178 | 13.8% | 133,128 | 14.5% | 50 | 0.1% | <0.001 | 102 | 0.1% | 52 | 0.1% | 50 | 0.1% | 1.00 |
| 21-40 | 192,959 | 19.9% | 192,731 | 21.0% | 228 | 0.5% | 453 | 0.5% | 225 | 0.5% | 228 | 0.5% | ||
| 41-50 | 127,794 | 13.2% | 127,139 | 13.8% | 655 | 1.3% | 1,311 | 1.3% | 656 | 1.3% | 655 | 1.3% | ||
| 51-60 | 172,444 | 17.8% | 166,080 | 18.1% | 6,364 | 12.7% | 12,732 | 12.8% | 6,368 | 12.8% | 6,364 | 12.8% | ||
| 61-70 | 159,912 | 16.5% | 143,776 | 15.7% | 16,136 | 32.2% | 32,265 | 32.4% | 16,129 | 32.3% | 16,136 | 32.4% | ||
| 71-80 | 120,117 | 12.4% | 102,655 | 11.2% | 17,462 | 34.9% | 34,693 | 34.8% | 17,352 | 34.8% | 17,341 | 34.8% | ||
| ≥81 | 61,892 | 6.4% | 52,752 | 5.7% | 9,140 | 18.3% | 18,168 | 18.2% | 9,080 | 18.2% | 9,088 | 18.2% | ||
| Gender | ||||||||||||||
| Female | 573,610 | 59.2% | 528,152 | 57.5% | 45,458 | 90.9% | <0.001 | 90,567 | 90.8% | 45,282 | 90.8% | 45,285 | 90.8% | 0.97 |
| Male | 394,686 | 40.8% | 390,109 | 42.5% | 4,577 | 9.1% | 9,157 | 9.2% | 4,580 | 9.2% | 4,577 | 9.2% | ||
| Insurance | ||||||||||||||
| Commercial | 500,918 | 51.7% | 490,503 | 53.4% | 10,415 | 20.8% | <0.001 | 20,830 | 20.9% | 10,415 | 20.9% | 10,415 | 20.9% | 1.00 |
| Dual | 6,814 | 0.7% | 5,218 | 0.6% | 1,596 | 3.2% | 3,154 | 3.2% | 1,581 | 3.2% | 1,573 | 3.2% | ||
| Medicaid | 252,366 | 26.1% | 243,191 | 26.5% | 9,175 | 18.3% | 18,044 | 18.1% | 9,019 | 18.1% | 9,025 | 18.1% | ||
| Medicare | 208,198 | 21.5% | 179,349 | 19.5% | 28,849 | 57.7% | 57,696 | 57.9% | 28,847 | 57.9% | 28,849 | 57.9% | ||
| PCP Visit 2019 | ||||||||||||||
| No | 521,282 | 53.8% | 502,609 | 54.7% | 18,673 | 37.3% | <0.001 | 37,253 | 37.4% | 18,616 | 37.3% | 18,637 | 37.4% | 0.89 |
| Yes | 447,014 | 46.2% | 415,652 | 45.3% | 31,362 | 62.7% | 62,471 | 62.6% | 31,246 | 62.7% | 31,225 | 62.6% | ||
| Continuous Outcomes | ||||||||||||||
| mean | SD | mean | SD | mean | SD | p-value | mean | SD | mean | SD | mean | SD | p-value | |
| CCI | 0.65 | 1.39 | 0.63 | 1.37 | 0.95 | 1.68 | <0.001 | 0.95 | 1.68 | 0.95 | 1.67 | 0.95 | 1.68 | 0.93 |
-
BP: bisphosphonate; CCI: Charlson Comorbidity Index; PCP: primary care physician; SD: standard deviation.
Appendix 2—table 6
Unadjusted COVID-19-Related Outcomes Stratified by Age, Sex, & Age by Sex; Matched Primary Analysis Cohort, All-Regions Combined.
| Primary Analysis Cohort, All Regions Matched | |||||||||||||||||
|---|---|---|---|---|---|---|---|---|---|---|---|---|---|---|---|---|---|
| All | SARS-CoV-2 Test | COVID-19 Diagnosis | COVID-19 Hospitalization | ||||||||||||||
| N | % | N | % | OR | p-value | N | % | OR | p-value | N | % | OR | p-value | ||||
| LL | UL | LL | UL | LL | UL | ||||||||||||
| All Patients | 900,732 | 100.0% | 28,137 | 3.1% | 16,289 | 1.8% | 3,710 | 0.4% | |||||||||
| BP User | 450,366 | 50.0% | 5,189 | 1.2% | 0.22 | <0.001 | 3,024 | 0.7% | 0.22 | <0.001 | 715 | 0.2% | 0.24 | <0.001 | |||
| BP Non-user | 450,366 | 50.0% | 22,948 | 5.1% | 0.21 | 0.22 | 13,265 | 2.9% | 0.21 | 0.23 | 2,995 | 0.7% | 0.22 | 0.26 | |||
| By Age | |||||||||||||||||
| Age ≤20 | 2,253 | 100.0% | 67 | 3.0% | 14 | 0.6% | 2 | 0.1% | |||||||||
| BP User | 1,128 | 50.1% | 29 | 2.6% | 0.75 | 0.26 | 2 | 0.2% | 0.16 | 0.007 | 2 | 0.2% | NA | NA | |||
| BP Non-user | 1,125 | 49.9% | 38 | 3.4% | 0.46 | 1.23 | 12 | 1.1% | 0.04 | 0.74 | 0 | 0.0% | NA | NA | |||
| Age 21-40 | 6,195 | 100.0% | 335 | 5.4% | 115 | 1.9% | 13 | 0.2% | |||||||||
| BP User | 3,091 | 49.9% | 58 | 1.9% | 0.20 | <0.001 | 15 | 0.5% | 0.15 | <0.001 | 4 | 0.1% | 0.45 | 0.27 | |||
| BP Non-user | 3,104 | 50.1% | 277 | 8.9% | 0.15 | 0.26 | 100 | 3.2% | 0.08 | 0.25 | 9 | 0.3% | 0.14 | 1.45 | |||
| Age 41-50 | 17,096 | 100.0% | 894 | 5.2% | 270 | 1.6% | 54 | 0.3% | |||||||||
| BP User | 8,551 | 50.0% | 188 | 2.2% | 0.25 | <0.001 | 48 | 0.6% | 0.21 | <0.001 | 14 | 0.2% | 0.35 | <0.001 | |||
| BP Non-user | 8,545 | 50.0% | 706 | 8.3% | 0.21 | 0.29 | 222 | 2.6% | 0.15 | 0.29 | 40 | 0.5% | 0.19 | 0.64 | |||
| Age 51-60 | 131,445 | 100.0% | 5,765 | 4.4% | 2,371 | 1.8% | 397 | 0.3% | |||||||||
| BP User | 65,721 | 50.0% | 1,104 | 1.7% | 0.22 | <0.001 | 456 | 0.7% | 0.23 | <0.001 | 83 | 0.1% | 0.26 | <0.001 | |||
| BP Non-user | 65,724 | 50.0% | 4,661 | 7.1% | 0.21 | 0.24 | 1,915 | 2.9% | 0.21 | 0.26 | 314 | 0.5% | 0.21 | 0.34 | |||
| Age 61-70 | 313,822 | 100.0% | 10,438 | 3.3% | 5,029 | 1.6% | 1,035 | 0.3% | |||||||||
| BP User | 156,878 | 50.0% | 1,843 | 1.2% | 0.21 | <0.001 | 939 | 0.6% | 0.23 | <0.001 | 173 | 0.1% | 0.20 | <0.001 | |||
| BP Non-user | 156,944 | 50.0% | 8,595 | 5.5% | 0.20 | 0.22 | 4,090 | 2.6% | 0.21 | 0.24 | 862 | 0.5% | 0.17 | 0.24 | |||
| Age 71-80 | 280,803 | 100.0% | 7,179 | 2.6% | 4,827 | 1.7% | 1,212 | 0.4% | |||||||||
| BP User | 140,437 | 50.0% | 1,309 | 0.9% | 0.22 | <0.001 | 877 | 0.6% | 0.22 | <0.001 | 234 | 0.2% | 0.24 | <0.001 | |||
| BP Non-user | 140,366 | 50.0% | 5,870 | 4.2% | 0.20 | 0.23 | 3,950 | 2.8% | 0.20 | 0.23 | 978 | 0.7% | 0.21 | 0.27 | |||
| Age ≥81 | 149,118 | 100.0% | 3,459 | 2.3% | 3,663 | 2.5% | 997 | 0.7% | |||||||||
| BP User | 74,560 | 50.0% | 658 | 0.9% | 0.23 | <0.001 | 687 | 0.9% | 0.22 | <0.001 | 205 | 0.3% | 0.26 | <0.001 | |||
| BP Non-user | 74,558 | 50.0% | 2,801 | 3.8% | 0.21 | 0.25 | 2,976 | 4.0% | 0.21 | 0.24 | 792 | 1.1% | 0.22 | 0.30 | |||
| Female Patients | 811,497 | 100.0% | 24,936 | 3.1% | 14,367 | 1.8% | 3,127 | 0.4% | |||||||||
| BP User | 405,751 | 50.0% | 4,519 | 1.1% | 0.21 | <0.001 | 2,667 | 0.7% | 0.22 | <0.001 | 593 | 0.1% | 0.23 | <0.001 | |||
| BP Non-user | 405,746 | 50.0% | 20,417 | 5.0% | 0.21 | 0.22 | 11,700 | 2.9% | 0.21 | 0.23 | 2,534 | 0.6% | 0.21 | 0.25 | |||
| By Age | |||||||||||||||||
| Age ≤20 | 885 | 100.0% | 26 | 2.9% | 7 | 0.8% | 1 | 0.1% | |||||||||
| BP User | 442 | 49.9% | 11 | 2.5% | 0.73 | 0.43 | 1 | 0.2% | 0.17 | 0.12 | 1 | 0.2% | NA | NA | |||
| BP Non-user | 443 | 50.1% | 15 | 3.4% | 0.33 | 1.60 | 6 | 1.4% | 0.02 | 1.38 | 0 | 0.0% | NA | NA | |||
| Age 21-40 | 3,765 | 100.0% | 218 | 5.8% | 64 | 1.7% | 9 | 0.2% | |||||||||
| BP User | 1,879 | 49.9% | 40 | 2.1% | 0.21 | <0.001 | 12 | 0.6% | 0.23 | <0.001 | 3 | 0.2% | 0.50 | 0.51 | |||
| BP Non-user | 1,886 | 50.1% | 178 | 9.4% | 0.15 | 0.30 | 52 | 2.8% | 0.12 | 0.43 | 6 | 0.3% | 0.13 | 2.01 | |||
| Age 41-50 | 13,542 | 100.0% | 730 | 5.4% | 206 | 1.5% | 37 | 0.3% | |||||||||
| BP User | 6,774 | 50.0% | 157 | 2.3% | 0.26 | <0.001 | 43 | 0.6% | 0.26 | <0.001 | 11 | 0.2% | 0.42 | 0.01 | |||
| BP Non-user | 6,768 | 50.0% | 573 | 8.5% | 0.21 | 0.31 | 163 | 2.4% | 0.18 | 0.36 | 26 | 0.4% | 0.21 | 0.85 | |||
| Age 51-60 | 119,205 | 100.0% | 5,200 | 4.4% | 2,093 | 1.8% | 327 | 0.3% | |||||||||
| BP User | 59,602 | 50.0% | 973 | 1.6% | 0.22 | <0.001 | 399 | 0.7% | 0.23 | <0.001 | 64 | 0.1% | 0.24 | <0.001 | |||
| BP Non-user | 59,603 | 50.0% | 4,227 | 7.1% | 0.20 | 0.23 | 1,694 | 2.8% | 0.21 | 0.26 | 263 | 0.4% | 0.18 | 0.32 | |||
| Age 61-70 | 290,276 | 100.0% | 9,474 | 3.3% | 4,506 | 1.6% | 885 | 0.3% | |||||||||
| BP User | 145,131 | 50.0% | 1,639 | 1.1% | 0.20 | <0.001 | 851 | 0.6% | 0.23 | <0.001 | 144 | 0.1% | 0.19 | <0.001 | |||
| BP Non-user | 145,145 | 50.0% | 7,835 | 5.4% | 0.19 | 0.21 | 3,655 | 2.5% | 0.21 | 0.25 | 741 | 0.5% | 0.16 | 0.23 | |||
| Age 71-80 | 253,094 | 100.0% | 6,304 | 2.5% | 4,254 | 1.7% | 1,026 | 0.4% | |||||||||
| BP User | 126,559 | 50.0% | 1,140 | 0.9% | 0.21 | <0.001 | 769 | 0.6% | 0.22 | <0.001 | 193 | 0.2% | 0.23 | <0.001 | |||
| BP Non-user | 126,535 | 50.0% | 5,164 | 4.1% | 0.20 | 0.23 | 3,485 | 2.8% | 0.20 | 0.23 | 833 | 0.7% | 0.20 | 0.27 | |||
| Age ≥81 | 130,730 | 100.0% | 2,984 | 2.3% | 3,237 | 2.5% | 842 | 0.6% | |||||||||
| BP User | 65,364 | 50.0% | 559 | 0.9% | 0.22 | <0.001 | 592 | 0.9% | 0.22 | <0.001 | 177 | 0.3% | 0.26 | <0.001 | |||
| BP Non-user | 65,366 | 50.0% | 2,425 | 3.7% | 0.20 | 0.25 | 2,645 | 4.0% | 0.20 | 0.24 | 665 | 1.0% | 0.22 | 0.31 | |||
| Male Patients | 89,235 | 100.0% | 3,201 | 3.6% | 1,922 | 2.2% | 583 | 0.7% | |||||||||
| BP User | 44,615 | 50.0% | 670 | 1.5% | 0.25 | <0.001 | 357 | 0.8% | 0.22 | <0.001 | 122 | 0.3% | 0.26 | <0.001 | |||
| BP Non-user | 44,620 | 50.0% | 2,531 | 5.7% | 0.23 | 0.28 | 1,565 | 3.5% | 0.20 | 0.25 | 461 | 1.0% | 0.22 | 0.32 | |||
| By Age | |||||||||||||||||
| Age ≤20 | 1,368 | 100.0% | 41 | 3.0% | 7 | 0.5% | 1 | 0.1% | |||||||||
| BP User | 686 | 50.1% | 18 | 2.6% | 0.77 | 0.42 | 1 | 0.1% | 0.16 | 0.07 | 1 | 0.1% | NA | NA | |||
| BP Non-user | 682 | 49.9% | 23 | 3.4% | 0.41 | 1.44 | 6 | 0.9% | 0.02 | 1.37 | 0 | 0.0% | NA | NA | |||
| Age 21-40 | 2,430 | 100.0% | 117 | 4.8% | 51 | 2.1% | 4 | 0.2% | |||||||||
| BP User | 1,212 | 49.9% | 18 | 1.5% | 0.17 | <0.001 | 3 | 0.2% | 0.06 | <0.001 | 1 | 0.1% | 0.33 | 0.63 | |||
| BP Non-user | 1,218 | 50.1% | 99 | 8.1% | 0.10 | 0.28 | 48 | 3.9% | 0.02 | 0.19 | 3 | 0.2% | 0.03 | 3.22 | |||
| Age 41-50 | 3,554 | 100.0% | 164 | 4.6% | 64 | 1.8% | 17 | 0.5% | |||||||||
| BP User | 1,777 | 50.0% | 31 | 1.7% | 0.22 | <0.001 | 5 | 0.3% | 0.08 | <0.001 | 3 | 0.2% | 0.21 | 0.01 | |||
| BP Non-user | 1,777 | 50.0% | 133 | 7.5% | 0.15 | 0.33 | 59 | 3.3% | 0.03 | 0.21 | 14 | 0.8% | 0.06 | 0.74 | |||
| Age 51-60 | 12,240 | 100.0% | 565 | 4.6% | 278 | 2.3% | 70 | 0.6% | |||||||||
| BP User | 6,119 | 50.0% | 131 | 2.1% | 0.29 | <0.001 | 57 | 0.9% | 0.25 | <0.001 | 19 | 0.3% | 0.37 | <0.001 | |||
| BP Non-user | 6,121 | 50.0% | 434 | 7.1% | 0.24 | 0.35 | 221 | 3.6% | 0.19 | 0.34 | 51 | 0.8% | 0.22 | 0.63 | |||
| Age 61-70 | 23,546 | 100.0% | 964 | 4.1% | 523 | 2.2% | 150 | 0.6% | |||||||||
| BP User | 11,747 | 49.9% | 204 | 1.7% | 0.26 | <0.001 | 88 | 0.7% | 0.20 | <0.001 | 29 | 0.2% | 0.24 | <0.001 | |||
| BP Non-user | 11,799 | 50.1% | 760 | 6.4% | 0.22 | 0.30 | 435 | 3.7% | 0.16 | 0.25 | 121 | 1.0% | 0.16 | 0.36 | |||
| Age 71-80 | 27,709 | 100.0% | 875 | 3.2% | 573 | 2.1% | 186 | 0.7% | |||||||||
| BP User | 13,878 | 50.1% | 169 | 1.2% | 0.23 | <0.001 | 108 | 0.8% | 0.23 | <0.001 | 41 | 0.3% | 0.28 | <0.001 | |||
| BP Non-user | 13,831 | 49.9% | 706 | 5.1% | 0.19 | 0.27 | 465 | 3.4% | 0.18 | 0.28 | 145 | 1.0% | 0.20 | 0.40 | |||
| Age ≥81 | 18,388 | 100.0% | 475 | 2.6% | 426 | 2.3% | 155 | 0.8% | |||||||||
| BP User | 9,196 | 50.0% | 99 | 1.1% | 0.26 | <0.001 | 95 | 1.0% | 0.28 | <0.001 | 28 | 0.3% | 0.22 | <0.001 | |||
| BP Non-user | 9,192 | 50.0% | 376 | 4.1% | 0.20 | 0.32 | 331 | 3.6% | 0.22 | 0.35 | 127 | 1.4% | 0.14 | 0.33 | |||
-
BP: bisphosphonate; LL: lower 95% confidence interval level; NA: not applicable; OR: odds ratio; UL: upper 95% confidence interval level.
Appendix 2—table 7
Unadjusted COVID-19-Related Outcomes Stratified by Age, Sex, & Age by Sex; Matched Primary Analysis Cohort, Region=Northeast.
| Region=Northeast Matched | |||||||||||||||||
|---|---|---|---|---|---|---|---|---|---|---|---|---|---|---|---|---|---|
| All | SARS-CoV-2 Test | COVID-19 Diagnosis | COVID-19 Hospitalization | ||||||||||||||
| N | % | N | % | OR | p-value | N | % | OR | p-value | N | % | OR | p-value | ||||
| LL | UL | LL | UL | LL | UL | ||||||||||||
| All Patients | 238,988 | 100.0% | 8,831 | 3.7% | 7,820 | 3.3% | 1,505 | 0.6% | |||||||||
| BP User | 119,494 | 50.0% | 1,684 | 1.4% | 0.22 | <0.001 | 1,578 | 1.3% | 0.24 | <0.001 | 314 | 0.3% | 0.26 | <0.001 | |||
| BP Non-user | 119,494 | 50.0% | 7,147 | 6.0% | 0.21 | 0.24 | 6,242 | 5.2% | 0.23 | 0.26 | 1,191 | 1.0% | 0.23 | 0.30 | |||
| By Age | |||||||||||||||||
| Age ≤20 | 474 | 100.0% | 14 | 3.0% | 7 | 1.5% | 2 | 0.4% | |||||||||
| BP User | 236 | 49.8% | 7 | 3.0% | 1.01 | 0.99 | 2 | 0.8% | 0.40 | 0.45 | 2 | 0.8% | NA | NA | |||
| BP Non-user | 238 | 50.2% | 7 | 2.9% | 0.35 | 2.92 | 5 | 2.1% | 0.08 | 2.07 | 0 | 0.0% | NA | NA | |||
| Age 21-40 | 1,528 | 100.0% | 93 | 6.1% | 55 | 3.6% | 5 | 0.3% | |||||||||
| BP User | 764 | 50.0% | 14 | 1.8% | 0.16 | <0.001 | 7 | 0.9% | 0.14 | <0.001 | 1 | 0.1% | 0.25 | 0.37 | |||
| BP Non-user | 764 | 50.0% | 79 | 10.3% | 0.09 | 0.29 | 48 | 6.3% | 0.06 | 0.31 | 4 | 0.5% | 0.03 | 2.23 | |||
| Age 41-50 | 4,084 | 100.0% | 234 | 5.7% | 118 | 2.9% | 18 | 0.4% | |||||||||
| BP User | 2,042 | 50.0% | 53 | 2.6% | 0.27 | <0.001 | 17 | 0.8% | 0.16 | <0.001 | 6 | 0.3% | 0.50 | 0.16 | |||
| BP Non-user | 2,042 | 50.0% | 181 | 8.9% | 0.20 | 0.37 | 101 | 4.9% | 0.10 | 0.27 | 12 | 0.6% | 0.19 | 1.33 | |||
| Age 51-60 | 36,020 | 100.0% | 1,863 | 5.2% | 1,190 | 3.3% | 160 | 0.4% | |||||||||
| BP User | 18,010 | 50.0% | 353 | 2.0% | 0.22 | <0.001 | 237 | 1.3% | 0.24 | <0.001 | 38 | 0.2% | 0.31 | <0.001 | |||
| BP Non-user | 18,010 | 50.0% | 1,510 | 8.4% | 0.19 | 0.25 | 953 | 5.3% | 0.21 | 0.28 | 122 | 0.7% | 0.22 | 0.45 | |||
| Age 61-70 | 82,233 | 100.0% | 3,200 | 3.9% | 2,424 | 2.9% | 403 | 0.5% | |||||||||
| BP User | 41,094 | 50.0% | 597 | 1.5% | 0.22 | <0.001 | 507 | 1.2% | 0.26 | <0.001 | 79 | 0.2% | 0.24 | <0.001 | |||
| BP Non-user | 41,139 | 50.0% | 2,603 | 6.3% | 0.20 | 0.24 | 1,917 | 4.7% | 0.23 | 0.28 | 324 | 0.8% | 0.19 | 0.31 | |||
| Age 71-80 | 74,831 | 100.0% | 2,266 | 3.0% | 2,306 | 3.1% | 493 | 0.7% | |||||||||
| BP User | 37,438 | 50.0% | 442 | 1.2% | 0.23 | <0.001 | 475 | 1.3% | 0.25 | <0.001 | 99 | 0.3% | 0.25 | <0.001 | |||
| BP Non-user | 37,393 | 50.0% | 1,824 | 4.9% | 0.21 | 0.26 | 1,831 | 4.9% | 0.23 | 0.28 | 394 | 1.1% | 0.20 | 0.31 | |||
| Age ≥81 | 39,818 | 100.0% | 1,161 | 2.9% | 1,720 | 4.3% | 424 | 1.1% | |||||||||
| BP User | 19,910 | 50.0% | 218 | 1.1% | 0.22 | <0.001 | 333 | 1.7% | 0.23 | <0.001 | 89 | 0.4% | 0.26 | <0.001 | |||
| BP Non-user | 19,908 | 50.0% | 943 | 4.7% | 0.19 | 0.26 | 1,387 | 7.0% | 0.20 | 0.26 | 335 | 1.7% | 0.21 | 0.33 | |||
| Female Patients | 216,273 | 100.0% | 7,897 | 3.7% | 6,941 | 3.2% | 1,263 | 0.6% | |||||||||
| BP User | 108,136 | 50.0% | 1,483 | 1.4% | 0.22 | <0.001 | 1,392 | 1.3% | 0.24 | <0.001 | 255 | 0.2% | 0.25 | <0.001 | |||
| BP Non-user | 108,137 | 50.0% | 6,414 | 5.9% | 0.21 | 0.23 | 5,549 | 5.1% | 0.23 | 0.26 | 1,008 | 0.9% | 0.22 | 0.29 | |||
| By Age | |||||||||||||||||
| Age ≤20 | 180 | 100.0% | 4 | 2.2% | 3 | 1.7% | 1 | 0.6% | |||||||||
| BP User | 90 | 50.0% | 2 | 2.2% | 1.00 | 1.00 | 1 | 1.1% | 0.49 | 1.00 | 1 | 1.1% | NA | NA | |||
| BP Non-user | 90 | 50.0% | 2 | 2.2% | 0.14 | 7.26 | 2 | 2.2% | 0.04 | 5.55 | 0 | 0.0% | NA | NA | |||
| Age 21-40 | 864 | 100.0% | 59 | 6.8% | 32 | 3.7% | 4 | 0.5% | |||||||||
| BP User | 431 | 49.9% | 10 | 2.3% | 0.19 | <0.001 | 6 | 1.4% | 0.22 | <0.001 | 1 | 0.2% | 0.33 | 0.62 | |||
| BP Non-user | 433 | 50.1% | 49 | 11.3% | 0.09 | 0.37 | 26 | 6.0% | 0.09 | 0.54 | 3 | 0.7% | 0.03 | 3.22 | |||
| Age 41-50 | 3,176 | 100.0% | 176 | 5.5% | 87 | 2.7% | 13 | 0.4% | |||||||||
| BP User | 1,588 | 50.0% | 40 | 2.5% | 0.28 | <0.001 | 15 | 0.9% | 0.20 | <0.001 | 5 | 0.3% | 0.62 | 0.40 | |||
| BP Non-user | 1,588 | 50.0% | 136 | 8.6% | 0.19 | 0.40 | 72 | 4.5% | 0.11 | 0.35 | 8 | 0.5% | 0.20 | 1.91 | |||
| Age 51-60 | 32,612 | 100.0% | 1,690 | 5.2% | 1,048 | 3.2% | 125 | 0.4% | |||||||||
| BP User | 16,306 | 50.0% | 310 | 1.9% | 0.21 | <0.001 | 206 | 1.3% | 0.24 | <0.001 | 31 | 0.2% | 0.33 | <0.001 | |||
| BP Non-user | 16,306 | 50.0% | 1,380 | 8.5% | 0.18 | 0.24 | 842 | 5.2% | 0.20 | 0.27 | 94 | 0.6% | 0.22 | 0.49 | |||
| Age 61-70 | 76,403 | 100.0% | 2,933 | 3.8% | 2,181 | 2.9% | 343 | 0.4% | |||||||||
| BP User | 38,200 | 50.0% | 536 | 1.4% | 0.21 | <0.001 | 456 | 1.2% | 0.26 | <0.001 | 63 | 0.2% | 0.22 | <0.001 | |||
| BP Non-user | 38,203 | 50.0% | 2,397 | 6.3% | 0.19 | 0.23 | 1,725 | 4.5% | 0.23 | 0.28 | 280 | 0.7% | 0.17 | 0.29 | |||
| Age 71-80 | 67,857 | 100.0% | 2,021 | 3.0% | 2,063 | 3.0% | 416 | 0.6% | |||||||||
| BP User | 33,930 | 50.0% | 393 | 1.2% | 0.23 | <0.001 | 413 | 1.2% | 0.24 | <0.001 | 77 | 0.2% | 0.23 | <0.001 | |||
| BP Non-user | 33,927 | 50.0% | 1,628 | 4.8% | 0.21 | 0.26 | 1,650 | 4.9% | 0.22 | 0.27 | 339 | 1.0% | 0.18 | 0.29 | |||
| Age ≥81 | 35,181 | 100.0% | 1,014 | 2.9% | 1,527 | 4.3% | 361 | 1.0% | |||||||||
| BP User | 17,591 | 50.0% | 192 | 1.1% | 0.23 | <0.001 | 295 | 1.7% | 0.23 | <0.001 | 77 | 0.4% | 0.27 | <0.001 | |||
| BP Non-user | 17,590 | 50.0% | 822 | 4.7% | 0.19 | 0.26 | 1,232 | 7.0% | 0.20 | 0.26 | 284 | 1.6% | 0.21 | 0.34 | |||
| Male Patients | 22,715 | 100.0% | 934 | 4.1% | 879 | 3.9% | 242 | 1.1% | |||||||||
| BP User | 11,358 | 50.0% | 201 | 1.8% | 0.26 | <0.001 | 186 | 1.6% | 0.26 | <0.001 | 59 | 0.5% | 0.32 | <0.001 | |||
| BP Non-user | 11,357 | 50.0% | 733 | 6.5% | 0.22 | 0.31 | 693 | 6.1% | 0.22 | 0.30 | 183 | 1.6% | 0.24 | 0.43 | |||
| By Age | |||||||||||||||||
| Age ≤20 | 294 | 100.0% | 10 | 3.4% | 4 | 1.4% | 1 | 0.3% | |||||||||
| BP User | 146 | 49.7% | 5 | 3.4% | 1.01 | 0.98 | 1 | 0.7% | 0.33 | 0.62 | 1 | 0.7% | NA | NA | |||
| BP Non-user | 148 | 50.3% | 5 | 3.4% | 0.29 | 3.58 | 3 | 2.0% | 0.03 | 3.24 | 0 | 0.0% | NA | NA | |||
| Age 21-40 | 664 | 100.0% | 34 | 5.1% | 23 | 3.5% | 1 | 0.2% | |||||||||
| BP User | 333 | 50.2% | 4 | 1.2% | 0.12 | <0.001 | 1 | 0.3% | 0.04 | <0.001 | 0 | 0.0% | NA | NA | |||
| BP Non-user | 331 | 49.8% | 30 | 9.1% | 0.04 | 0.35 | 22 | 6.6% | 0.01 | 0.32 | 1 | 0.3% | NA | NA | |||
| Age 41-50 | 908 | 100.0% | 58 | 6.4% | 31 | 3.4% | 5 | 0.6% | |||||||||
| BP User | 454 | 50.0% | 13 | 2.9% | 0.27 | <0.001 | 2 | 0.4% | 0.06 | <0.001 | 1 | 0.2% | 0.25 | 0.37 | |||
| BP Non-user | 454 | 50.0% | 45 | 9.9% | 0.14 | 0.50 | 29 | 6.4% | 0.02 | 0.27 | 4 | 0.9% | 0.03 | 2.23 | |||
| Age 51-60 | 3,408 | 100.0% | 173 | 5.1% | 142 | 4.2% | 35 | 1.0% | |||||||||
| BP User | 1,704 | 50.0% | 43 | 2.5% | 0.31 | <0.001 | 31 | 1.8% | 0.27 | <0.001 | 7 | 0.4% | 0.25 | <0.001 | |||
| BP Non-user | 1,704 | 50.0% | 130 | 7.6% | 0.22 | 0.45 | 111 | 6.5% | 0.18 | 0.40 | 28 | 1.6% | 0.11 | 0.57 | |||
| Age 61-70 | 5,830 | 100.0% | 267 | 4.6% | 243 | 4.2% | 60 | 1.0% | |||||||||
| BP User | 2,894 | 49.6% | 61 | 2.1% | 0.29 | <0.001 | 51 | 1.8% | 0.26 | <0.001 | 16 | 0.6% | 0.37 | <0.001 | |||
| BP Non-user | 2,936 | 50.4% | 206 | 7.0% | 0.21 | 0.38 | 192 | 6.5% | 0.19 | 0.35 | 44 | 1.5% | 0.21 | 0.65 | |||
| Age 71-80 | 6,974 | 100.0% | 245 | 3.5% | 243 | 3.5% | 77 | 1.1% | |||||||||
| BP User | 3,508 | 50.3% | 49 | 1.4% | 0.24 | <0.001 | 62 | 1.8% | 0.33 | <0.001 | 22 | 0.6% | 0.39 | <0.001 | |||
| BP Non-user | 3,466 | 49.7% | 196 | 5.7% | 0.17 | 0.32 | 181 | 5.2% | 0.24 | 0.44 | 55 | 1.6% | 0.24 | 0.64 | |||
| Age ≥81 | 4,637 | 100.0% | 147 | 3.2% | 193 | 4.2% | 63 | 1.4% | |||||||||
| BP User | 2,319 | 50.0% | 26 | 1.1% | 0.21 | <0.001 | 38 | 1.6% | 0.23 | <0.001 | 12 | 0.5% | 0.23 | <0.001 | |||
| BP Non-user | 2,318 | 50.0% | 121 | 5.2% | 0.13 | 0.32 | 155 | 6.7% | 0.16 | 0.33 | 51 | 2.2% | 0.12 | 0.43 | |||
-
BP: bisphosphonate; LL: lower 95% confidence interval level; NA: not applicable; OR: odds ratio; UL: upper 95% confidence interval level.
Appendix 2—table 8
Unadjusted COVID-19-Related Outcomes Stratified by Age, Sex, & Age by Sex; Matched Primary Analysis Cohort, Region=Midwest.
| Region=Midwest Matched | |||||||||||||||||
|---|---|---|---|---|---|---|---|---|---|---|---|---|---|---|---|---|---|
| All | SARS-CoV-2 Test | COVID-19 Diagnosis | COVID-19 Hospitalization | ||||||||||||||
| N | % | N | % | OR | p-value | N | % | OR | p-value | N | % | OR | p-value | ||||
| LL | UL | LL | UL | LL | UL | ||||||||||||
| All Patients | 151,802 | 100.0% | 4,451 | 2.9% | 2,099 | 1.4% | 636 | 0.4% | |||||||||
| BP User | 75,901 | 50.0% | 868 | 1.1% | 0.23 | <0.001 | 383 | 0.5% | 0.22 | <0.001 | 121 | 0.2% | 0.23 | <0.001 | |||
| BP Non-user | 75,901 | 50.0% | 3,583 | 4.7% | 0.22 | 0.25 | 1,716 | 2.3% | 0.20 | 0.25 | 515 | 0.7% | 0.19 | 0.29 | |||
| By Age | |||||||||||||||||
| Age ≤20 | 537 | 100.0% | 15 | 2.8% | 2 | 0.4% | 0 | 0.0% | |||||||||
| BP User | 268 | 49.9% | 6 | 2.2% | 0.66 | 0.44 | 0 | 0.0% | NA | NA | 0 | 0.0% | NA | NA | |||
| BP Non-user | 269 | 50.1% | 9 | 3.3% | 0.23 | 1.89 | 2 | 0.7% | NA | NA | 0 | 0.0% | NA | NA | |||
| Age 21-40 | 1,188 | 100.0% | 62 | 5.2% | 17 | 1.4% | 1 | 0.1% | |||||||||
| BP User | 593 | 49.9% | 7 | 1.2% | 0.12 | <0.001 | 2 | 0.3% | 0.13 | 0.002 | 0 | 0.0% | NA | NA | |||
| BP Non-user | 595 | 50.1% | 55 | 9.2% | 0.05 | 0.26 | 15 | 2.5% | 0.03 | 0.57 | 1 | 0.2% | NA | NA | |||
| Age 41-50 | 3,367 | 100.0% | 184 | 5.5% | 46 | 1.4% | 16 | 0.5% | |||||||||
| BP User | 1,684 | 50.0% | 36 | 2.1% | 0.23 | <0.001 | 10 | 0.6% | 0.27 | <0.001 | 2 | 0.1% | 0.14 | 0.002 | |||
| BP Non-user | 1,683 | 50.0% | 148 | 8.8% | 0.16 | 0.33 | 36 | 2.1% | 0.14 | 0.55 | 14 | 0.8% | 0.03 | 0.62 | |||
| Age 51-60 | 24,478 | 100.0% | 951 | 3.9% | 293 | 1.2% | 80 | 0.3% | |||||||||
| BP User | 12,238 | 50.0% | 180 | 1.5% | 0.22 | <0.001 | 52 | 0.4% | 0.21 | <0.001 | 15 | 0.1% | 0.23 | <0.001 | |||
| BP Non-user | 12,240 | 50.0% | 771 | 6.3% | 0.19 | 0.26 | 241 | 2.0% | 0.16 | 0.29 | 65 | 0.5% | 0.13 | 0.40 | |||
| Age 61-70 | 56,991 | 100.0% | 1,764 | 3.1% | 671 | 1.2% | 189 | 0.3% | |||||||||
| BP User | 28,496 | 50.0% | 322 | 1.1% | 0.21 | <0.001 | 123 | 0.4% | 0.22 | <0.001 | 35 | 0.1% | 0.23 | <0.001 | |||
| BP Non-user | 28,495 | 50.0% | 1,442 | 5.1% | 0.19 | 0.24 | 548 | 1.9% | 0.18 | 0.27 | 154 | 0.5% | 0.16 | 0.33 | |||
| Age 71-80 | 42,153 | 100.0% | 1,009 | 2.4% | 577 | 1.4% | 200 | 0.5% | |||||||||
| BP User | 21,078 | 50.0% | 209 | 1.0% | 0.25 | <0.001 | 95 | 0.5% | 0.19 | <0.001 | 37 | 0.2% | 0.23 | <0.001 | |||
| BP Non-user | 21,075 | 50.0% | 800 | 3.8% | 0.22 | 0.30 | 482 | 2.3% | 0.16 | 0.24 | 163 | 0.8% | 0.16 | 0.32 | |||
| Age ≥81 | 23,088 | 100.0% | 466 | 2.0% | 493 | 2.1% | 150 | 0.6% | |||||||||
| BP User | 11,544 | 50.0% | 108 | 0.9% | 0.30 | <0.001 | 101 | 0.9% | 0.25 | <0.001 | 32 | 0.3% | 0.27 | <0.001 | |||
| BP Non-user | 11,544 | 50.0% | 358 | 3.1% | 0.24 | 0.37 | 392 | 3.4% | 0.20 | 0.31 | 118 | 1.0% | 0.18 | 0.40 | |||
| Female Patients | 137,028 | 100.0% | 3,945 | 2.9% | 1,828 | 1.3% | 543 | 0.4% | |||||||||
| BP User | 68,512 | 50.0% | 762 | 1.1% | 0.23 | <0.001 | 333 | 0.5% | 0.22 | <0.001 | 103 | 0.2% | 0.23 | <0.001 | |||
| BP Non-user | 68,516 | 50.0% | 3,183 | 4.6% | 0.21 | 0.25 | 1,495 | 2.2% | 0.19 | 0.25 | 440 | 0.6% | 0.19 | 0.29 | |||
| By Age | |||||||||||||||||
| Age ≤20 | 226 | 100.0% | 7 | 3.1% | 1 | 0.4% | 0 | 0.0% | |||||||||
| BP User | 113 | 50.0% | 3 | 2.7% | 0.74 | 1.00 | 0 | 0.0% | NA | NA | 0 | 0.0% | NA | NA | |||
| BP Non-user | 113 | 50.0% | 4 | 3.5% | 0.16 | 3.40 | 1 | 0.9% | NA | NA | 0 | 0.0% | NA | NA | |||
| Age 21-40 | 700 | 100.0% | 34 | 4.9% | 7 | 1.0% | 0 | 0.0% | |||||||||
| BP User | 349 | 49.9% | 6 | 1.7% | 0.20 | <0.001 | 1 | 0.3% | 0.17 | 0.12 | 0 | 0.0% | NA | NA | |||
| BP Non-user | 351 | 50.1% | 28 | 8.0% | 0.08 | 0.49 | 6 | 1.7% | 0.02 | 1.38 | 0 | 0.0% | NA | NA | |||
| Age 41-50 | 2,639 | 100.0% | 157 | 5.9% | 32 | 1.2% | 10 | 0.4% | |||||||||
| BP User | 1,319 | 50.0% | 31 | 2.4% | 0.23 | <0.001 | 8 | 0.6% | 0.33 | 0.005 | 1 | 0.1% | 0.11 | 0.02 | |||
| BP Non-user | 1,320 | 50.0% | 126 | 9.5% | 0.15 | 0.34 | 24 | 1.8% | 0.15 | 0.74 | 9 | 0.7% | 0.01 | 0.87 | |||
| Age 51-60 | 22,101 | 100.0% | 856 | 3.9% | 260 | 1.2% | 70 | 0.3% | |||||||||
| BP User | 11,050 | 50.0% | 159 | 1.4% | 0.22 | <0.001 | 47 | 0.4% | 0.22 | <0.001 | 13 | 0.1% | 0.23 | <0.001 | |||
| BP Non-user | 11,051 | 50.0% | 697 | 6.3% | 0.18 | 0.26 | 213 | 1.9% | 0.16 | 0.30 | 57 | 0.5% | 0.12 | 0.42 | |||
| Age 61-70 | 52,520 | 100.0% | 1,594 | 3.0% | 591 | 1.1% | 165 | 0.3% | |||||||||
| BP User | 26,260 | 50.0% | 286 | 1.1% | 0.21 | <0.001 | 107 | 0.4% | 0.22 | <0.001 | 29 | 0.1% | 0.21 | <0.001 | |||
| BP Non-user | 26,260 | 50.0% | 1,308 | 5.0% | 0.18 | 0.24 | 484 | 1.8% | 0.18 | 0.27 | 136 | 0.5% | 0.14 | 0.32 | |||
| Age 71-80 | 38,367 | 100.0% | 877 | 2.3% | 501 | 1.3% | 172 | 0.4% | |||||||||
| BP User | 19,184 | 50.0% | 180 | 0.9% | 0.25 | <0.001 | 85 | 0.4% | 0.20 | <0.001 | 33 | 0.2% | 0.24 | <0.001 | |||
| BP Non-user | 19,183 | 50.0% | 697 | 3.6% | 0.21 | 0.30 | 416 | 2.2% | 0.16 | 0.25 | 139 | 0.7% | 0.16 | 0.35 | |||
| Age ≥81 | 20,475 | 100.0% | 420 | 2.1% | 436 | 2.1% | 126 | 0.6% | |||||||||
| BP User | 10,237 | 50.0% | 97 | 0.9% | 0.29 | <0.001 | 85 | 0.8% | 0.24 | <0.001 | 27 | 0.3% | 0.27 | <0.001 | |||
| BP Non-user | 10,238 | 50.0% | 323 | 3.2% | 0.23 | 0.37 | 351 | 3.4% | 0.19 | 0.30 | 99 | 1.0% | 0.18 | 0.41 | |||
| Male Patients | 14,774 | 100.0% | 506 | 3.4% | 271 | 1.8% | 93 | 0.6% | |||||||||
| BP User | 7,389 | 50.0% | 106 | 1.4% | 0.25 | <0.001 | 50 | 0.7% | 0.22 | <0.001 | 18 | 0.2% | 0.24 | <0.001 | |||
| BP Non-user | 7,385 | 50.0% | 400 | 5.4% | 0.20 | 0.32 | 221 | 3.0% | 0.16 | 0.30 | 75 | 1.0% | 0.14 | 0.40 | |||
| By Age | |||||||||||||||||
| Age ≤20 | 311 | 100.0% | 8 | 2.6% | 1 | 0.3% | 0 | 0.0% | |||||||||
| BP User | 155 | 49.8% | 3 | 1.9% | 0.60 | 0.72 | 0 | 0.0% | NA | NA | 0 | 0.0% | NA | NA | |||
| BP Non-user | 156 | 50.2% | 5 | 3.2% | 0.14 | 2.54 | 1 | 0.6% | NA | NA | 0 | 0.0% | NA | NA | |||
| Age 21-40 | 488 | 100.0% | 28 | 5.7% | 10 | 2.0% | 1 | 0.2% | |||||||||
| BP User | 244 | 50.0% | 1 | 0.4% | 0.03 | <0.001 | 1 | 0.4% | 0.11 | 0.02 | 0 | 0.0% | NA | NA | |||
| BP Non-user | 244 | 50.0% | 27 | 11.1% | 0.00 | 0.25 | 9 | 3.7% | 0.01 | 0.85 | 1 | 0.4% | NA | NA | |||
| Age 41-50 | 728 | 100.0% | 27 | 3.7% | 14 | 1.9% | 6 | 0.8% | |||||||||
| BP User | 365 | 50.1% | 5 | 1.4% | 0.22 | <0.001 | 2 | 0.5% | 0.16 | 0.007 | 1 | 0.3% | 0.20 | 0.12 | |||
| BP Non-user | 363 | 49.9% | 22 | 6.1% | 0.08 | 0.57 | 12 | 3.3% | 0.04 | 0.73 | 5 | 1.4% | 0.02 | 1.69 | |||
| Age 51-60 | 2,377 | 100.0% | 95 | 4.0% | 33 | 1.4% | 10 | 0.4% | |||||||||
| BP User | 1,188 | 50.0% | 21 | 1.8% | 0.27 | <0.001 | 5 | 0.4% | 0.18 | <0.001 | 2 | 0.2% | 0.25 | 0.11 | |||
| BP Non-user | 1,189 | 50.0% | 74 | 6.2% | 0.17 | 0.44 | 28 | 2.4% | 0.07 | 0.46 | 8 | 0.7% | 0.05 | 1.17 | |||
| Age 61-70 | 4,471 | 100.0% | 170 | 3.8% | 80 | 1.8% | 24 | 0.5% | |||||||||
| BP User | 2,236 | 50.0% | 36 | 1.6% | 0.26 | <0.001 | 16 | 0.7% | 0.24 | <0.001 | 6 | 0.3% | 0.33 | 0.01 | |||
| BP Non-user | 2,235 | 50.0% | 134 | 6.0% | 0.18 | 0.37 | 64 | 2.9% | 0.14 | 0.42 | 18 | 0.8% | 0.13 | 0.84 | |||
| Age 71-80 | 3,786 | 100.0% | 132 | 3.5% | 76 | 2.0% | 28 | 0.7% | |||||||||
| BP User | 1,894 | 50.0% | 29 | 1.5% | 0.27 | <0.001 | 10 | 0.5% | 0.15 | <0.001 | 4 | 0.2% | 0.16 | <0.001 | |||
| BP Non-user | 1,892 | 50.0% | 103 | 5.4% | 0.18 | 0.41 | 66 | 3.5% | 0.08 | 0.29 | 24 | 1.3% | 0.06 | 0.48 | |||
| Age ≥81 | 2,613 | 100.0% | 46 | 1.8% | 57 | 2.2% | 24 | 0.9% | |||||||||
| BP User | 1,307 | 50.0% | 11 | 0.8% | 0.31 | <0.001 | 16 | 1.2% | 0.38 | <0.001 | 5 | 0.4% | 0.26 | 0.004 | |||
| BP Non-user | 1,306 | 50.0% | 35 | 2.7% | 0.16 | 0.61 | 41 | 3.1% | 0.21 | 0.69 | 19 | 1.5% | 0.10 | 0.70 | |||
-
BP: bisphosphonate; LL: lower 95% confidence interval level; NA: not applicable; OR: odds ratio; UL: upper 95% confidence interval level.
Appendix 2—table 9
Unadjusted COVID-19-Related Outcomes Stratified by Age, Sex, & Age by Sex; Matched Primary Analysis Cohort, Region=South.
| Region=South Matched | |||||||||||||||||
|---|---|---|---|---|---|---|---|---|---|---|---|---|---|---|---|---|---|
| All | SARS-CoV-2 Test | COVID-19 Diagnosis | COVID-19 Hospitalization | ||||||||||||||
| N | % | N | % | OR | p-value | N | % | OR | p-value | N | % | OR | p-value | ||||
| LL | UL | LL | UL | LL | UL | ||||||||||||
| All Patients | 319,408 | 100.0% | 8,418 | 2.6% | 3,535 | 1.1% | 849 | 0.3% | |||||||||
| BP User | 159,704 | 50.0% | 1,553 | 1.0% | 0.22 | <0.001 | 624 | 0.4% | 0.21 | <0.001 | 167 | 0.1% | 0.24 | <0.001 | |||
| BP Non-user | 159,704 | 50.0% | 6,865 | 4.3% | 0.21 | 0.23 | 2,911 | 1.8% | 0.19 | 0.23 | 682 | 0.4% | 0.21 | 0.29 | |||
| By Age | |||||||||||||||||
| Age ≤20 | 943 | 100.0% | 29 | 3.1% | 4 | 0.4% | 0 | 0.0% | |||||||||
| BP User | 474 | 50.3% | 15 | 3.2% | 1.06 | 0.87 | 0 | 0.0% | NA | NA | 0 | 0.0% | NA | NA | |||
| BP Non-user | 469 | 49.7% | 14 | 3.0% | 0.51 | 2.23 | 4 | 0.9% | NA | NA | 0 | 0.0% | NA | NA | |||
| Age 21-40 | 2,364 | 100.0% | 113 | 4.8% | 25 | 1.1% | 4 | 0.2% | |||||||||
| BP User | 1,177 | 49.8% | 20 | 1.7% | 0.20 | <0.001 | 4 | 0.3% | 0.19 | <0.001 | 2 | 0.2% | 1.01 | 1.00 | |||
| BP Non-user | 1,187 | 50.2% | 93 | 7.8% | 0.12 | 0.33 | 21 | 1.8% | 0.06 | 0.55 | 2 | 0.2% | 0.14 | 7.17 | |||
| Age 41-50 | 6,839 | 100.0% | 329 | 4.8% | 73 | 1.1% | 10 | 0.1% | |||||||||
| BP User | 3,421 | 50.0% | 72 | 2.1% | 0.26 | <0.001 | 18 | 0.5% | 0.32 | <0.001 | 5 | 0.1% | 1.00 | 0.99 | |||
| BP Non-user | 3,418 | 50.0% | 257 | 7.5% | 0.20 | 0.34 | 55 | 1.6% | 0.19 | 0.55 | 5 | 0.1% | 0.29 | 3.45 | |||
| Age 51-60 | 50,186 | 100.0% | 1,999 | 4.0% | 584 | 1.2% | 103 | 0.2% | |||||||||
| BP User | 25,093 | 50.0% | 393 | 1.6% | 0.23 | <0.001 | 114 | 0.5% | 0.24 | <0.001 | 23 | 0.1% | 0.29 | <0.001 | |||
| BP Non-user | 25,093 | 50.0% | 1,606 | 6.4% | 0.21 | 0.26 | 470 | 1.9% | 0.19 | 0.29 | 80 | 0.3% | 0.18 | 0.46 | |||
| Age 61-70 | 111,800 | 100.0% | 3,246 | 2.9% | 1,106 | 1.0% | 247 | 0.2% | |||||||||
| BP User | 55,896 | 50.0% | 583 | 1.0% | 0.21 | <0.001 | 191 | 0.3% | 0.21 | <0.001 | 38 | 0.1% | 0.18 | <0.001 | |||
| BP Non-user | 55,904 | 50.0% | 2,663 | 4.8% | 0.19 | 0.23 | 915 | 1.6% | 0.18 | 0.24 | 209 | 0.4% | 0.13 | 0.26 | |||
| Age 71-80 | 99,223 | 100.0% | 1,942 | 2.0% | 1,029 | 1.0% | 260 | 0.3% | |||||||||
| BP User | 49,618 | 50.0% | 322 | 0.6% | 0.19 | <0.001 | 170 | 0.3% | 0.20 | <0.001 | 55 | 0.1% | 0.27 | <0.001 | |||
| BP Non-user | 49,605 | 50.0% | 1,620 | 3.3% | 0.17 | 0.22 | 859 | 1.7% | 0.17 | 0.23 | 205 | 0.4% | 0.20 | 0.36 | |||
| Age ≥81 | 48,053 | 100.0% | 760 | 1.6% | 714 | 1.5% | 225 | 0.5% | |||||||||
| BP User | 24,025 | 50.0% | 148 | 0.6% | 0.24 | <0.001 | 127 | 0.5% | 0.21 | <0.001 | 44 | 0.2% | 0.24 | <0.001 | |||
| BP Non-user | 24,028 | 50.0% | 612 | 2.5% | 0.20 | 0.28 | 587 | 2.4% | 0.18 | 0.26 | 181 | 0.8% | 0.17 | 0.34 | |||
| Female Patients | 289,263 | 100.0% | 7,519 | 2.6% | 3,159 | 1.1% | 745 | 0.3% | |||||||||
| BP User | 144,633 | 50.0% | 1,365 | 0.9% | 0.21 | <0.001 | 562 | 0.4% | 0.21 | <0.001 | 143 | 0.1% | 0.24 | <0.001 | |||
| BP Non-user | 144,630 | 50.0% | 6,154 | 4.3% | 0.20 | 0.23 | 2,597 | 1.8% | 0.19 | 0.23 | 602 | 0.4% | 0.20 | 0.28 | |||
| By Age | |||||||||||||||||
| Age ≤20 | 372 | 100.0% | 11 | 3.0% | 3 | 0.8% | 0 | 0.0% | |||||||||
| BP User | 185 | 49.7% | 6 | 3.2% | 1.22 | 0.75 | 0 | 0.0% | NA | NA | 0 | 0.0% | NA | NA | |||
| BP Non-user | 187 | 50.3% | 5 | 2.7% | 0.37 | 4.07 | 3 | 1.6% | NA | NA | 0 | 0.0% | NA | NA | |||
| Age 21-40 | 1,543 | 100.0% | 81 | 5.2% | 16 | 1.0% | 3 | 0.2% | |||||||||
| BP User | 770 | 49.9% | 14 | 1.8% | 0.20 | <0.001 | 4 | 0.5% | 0.33 | 0.08 | 2 | 0.3% | 2.01 | 0.62 | |||
| BP Non-user | 773 | 50.1% | 67 | 8.7% | 0.11 | 0.35 | 12 | 1.6% | 0.11 | 1.03 | 1 | 0.1% | 0.18 | 22.22 | |||
| Age 41-50 | 5,569 | 100.0% | 273 | 4.9% | 66 | 1.2% | 9 | 0.2% | |||||||||
| BP User | 2,787 | 50.0% | 65 | 2.3% | 0.30 | <0.001 | 18 | 0.6% | 0.37 | <0.001 | 5 | 0.2% | 1.25 | 1.00 | |||
| BP Non-user | 2,782 | 50.0% | 208 | 7.5% | 0.22 | 0.39 | 48 | 1.7% | 0.21 | 0.64 | 4 | 0.1% | 0.33 | 4.65 | |||
| Age 51-60 | 46,012 | 100.0% | 1,819 | 4.0% | 521 | 1.1% | 89 | 0.2% | |||||||||
| BP User | 23,007 | 50.0% | 358 | 1.6% | 0.23 | <0.001 | 100 | 0.4% | 0.23 | <0.001 | 16 | 0.1% | 0.22 | <0.001 | |||
| BP Non-user | 23,005 | 50.0% | 1,461 | 6.4% | 0.21 | 0.26 | 421 | 1.8% | 0.19 | 0.29 | 73 | 0.3% | 0.13 | 0.38 | |||
| Age 61-70 | 103,825 | 100.0% | 2,948 | 2.8% | 1,007 | 1.0% | 218 | 0.2% | |||||||||
| BP User | 51,910 | 50.0% | 517 | 1.0% | 0.20 | <0.001 | 177 | 0.3% | 0.21 | <0.001 | 33 | 0.1% | 0.18 | <0.001 | |||
| BP Non-user | 51,915 | 50.0% | 2,431 | 4.7% | 0.19 | 0.23 | 830 | 1.6% | 0.18 | 0.25 | 185 | 0.4% | 0.12 | 0.26 | |||
| Age 71-80 | 89,474 | 100.0% | 1,729 | 1.9% | 915 | 1.0% | 230 | 0.3% | |||||||||
| BP User | 44,742 | 50.0% | 283 | 0.6% | 0.19 | <0.001 | 153 | 0.3% | 0.20 | <0.001 | 47 | 0.1% | 0.26 | <0.001 | |||
| BP Non-user | 44,732 | 50.0% | 1,446 | 3.2% | 0.17 | 0.22 | 762 | 1.7% | 0.17 | 0.24 | 183 | 0.4% | 0.19 | 0.35 | |||
| Age ≥81 | 42,468 | 100.0% | 658 | 1.5% | 631 | 1.5% | 196 | 0.5% | |||||||||
| BP User | 21,232 | 50.0% | 122 | 0.6% | 0.22 | <0.001 | 110 | 0.5% | 0.21 | <0.001 | 40 | 0.2% | 0.26 | <0.001 | |||
| BP Non-user | 21,236 | 50.0% | 536 | 2.5% | 0.18 | 0.27 | 521 | 2.5% | 0.17 | 0.25 | 156 | 0.7% | 0.18 | 0.36 | |||
| Male Patients | 30,145 | 100.0% | 899 | 3.0% | 376 | 1.2% | 104 | 0.3% | |||||||||
| BP User | 15,071 | 50.0% | 188 | 1.2% | 0.26 | <0.001 | 62 | 0.4% | 0.19 | <0.001 | 24 | 0.2% | 0.30 | <0.001 | |||
| BP Non-user | 15,074 | 50.0% | 711 | 4.7% | 0.22 | 0.30 | 314 | 2.1% | 0.15 | 0.26 | 80 | 0.5% | 0.19 | 0.47 | |||
| By Age | |||||||||||||||||
| Age ≤20 | 571 | 100.0% | 18 | 3.2% | 1 | 0.2% | 0 | 0.0% | |||||||||
| BP User | 289 | 50.6% | 9 | 3.1% | 0.98 | 0.96 | 0 | 0.0% | NA | NA | 0 | 0.0% | NA | NA | |||
| BP Non-user | 282 | 49.4% | 9 | 3.2% | 0.38 | 2.49 | 1 | 0.4% | NA | NA | 0 | 0.0% | NA | NA | |||
| Age 21-40 | 821 | 100.0% | 32 | 3.9% | 9 | 1.1% | 1 | 0.1% | |||||||||
| BP User | 407 | 49.6% | 6 | 1.5% | 0.22 | <0.001 | 0 | 0.0% | NA | NA | 0 | 0.0% | NA | NA | |||
| BP Non-user | 414 | 50.4% | 26 | 6.3% | 0.09 | 0.55 | 9 | 2.2% | NA | NA | 1 | 0.2% | NA | NA | |||
| Age 41-50 | 1,270 | 100.0% | 56 | 4.4% | 7 | 0.6% | 1 | 0.1% | |||||||||
| BP User | 634 | 49.9% | 7 | 1.1% | 0.13 | <0.001 | 0 | 0.0% | NA | NA | 0 | 0.0% | NA | NA | |||
| BP Non-user | 636 | 50.1% | 49 | 7.7% | 0.06 | 0.30 | 7 | 1.1% | NA | NA | 1 | 0.2% | NA | NA | |||
| Age 51-60 | 4,174 | 100.0% | 180 | 4.3% | 63 | 1.5% | 14 | 0.3% | |||||||||
| BP User | 2,086 | 50.0% | 35 | 1.7% | 0.23 | <0.001 | 14 | 0.7% | 0.28 | <0.001 | 7 | 0.3% | 1.00 | 0.99 | |||
| BP Non-user | 2,088 | 50.0% | 145 | 6.9% | 0.16 | 0.33 | 49 | 2.3% | 0.15 | 0.51 | 7 | 0.3% | 0.35 | 2.86 | |||
| Age 61-70 | 7,975 | 100.0% | 298 | 3.7% | 99 | 1.2% | 29 | 0.4% | |||||||||
| BP User | 3,986 | 50.0% | 66 | 1.7% | 0.27 | <0.001 | 14 | 0.4% | 0.16 | <0.001 | 5 | 0.1% | 0.21 | <0.001 | |||
| BP Non-user | 3,989 | 50.0% | 232 | 5.8% | 0.21 | 0.36 | 85 | 2.1% | 0.09 | 0.29 | 24 | 0.6% | 0.08 | 0.54 | |||
| Age 71-80 | 9,749 | 100.0% | 213 | 2.2% | 114 | 1.2% | 30 | 0.3% | |||||||||
| BP User | 4,876 | 50.0% | 39 | 0.8% | 0.22 | <0.001 | 17 | 0.3% | 0.17 | <0.001 | 8 | 0.2% | 0.36 | 0.01 | |||
| BP Non-user | 4,873 | 50.0% | 174 | 3.6% | 0.15 | 0.31 | 97 | 2.0% | 0.10 | 0.29 | 22 | 0.5% | 0.16 | 0.81 | |||
| Age ≥81 | 5,585 | 100.0% | 102 | 1.8% | 83 | 1.5% | 29 | 0.5% | |||||||||
| BP User | 2,793 | 50.0% | 26 | 0.9% | 0.34 | <0.001 | 17 | 0.6% | 0.25 | <0.001 | 4 | 0.1% | 0.16 | <0.001 | |||
| BP Non-user | 2,792 | 50.0% | 76 | 2.7% | 0.21 | 0.53 | 66 | 2.4% | 0.15 | 0.43 | 25 | 0.9% | 0.06 | 0.46 | |||
-
BP: bisphosphonate; LL: lower 95% confidence interval level; NA: not applicable; OR: odds ratio; UL: upper 95% confidence interval level.
Appendix 2—table 10
Unadjusted COVID-19-Related Outcomes Stratified by Age, Sex, & Age by Sex; Matched Primary Analysis Cohort, Region=West.
| Region=West Matched | |||||||||||||||||
|---|---|---|---|---|---|---|---|---|---|---|---|---|---|---|---|---|---|
| All | SARS-CoV-2 Test | COVID-19 Diagnosis | COVID-19 Hospitalization | ||||||||||||||
| N | % | N | % | OR | p-value | N | % | OR | p-value | N | % | OR | p-value | ||||
| LL | UL | LL | UL | LL | UL | ||||||||||||
| All Patients | 190,534 | 100.0% | 6,437 | 3.4% | 2,835 | 1.5% | 720 | 0.4% | |||||||||
| BP User | 95,267 | 50.0% | 1,084 | 1.1% | 0.19 | <0.001 | 439 | 0.5% | 0.18 | <0.001 | 113 | 0.1% | 0.19 | <0.001 | |||
| BP Non-user | 95,267 | 50.0% | 5,353 | 5.6% | 0.18 | 0.21 | 2,396 | 2.5% | 0.16 | 0.20 | 607 | 0.6% | 0.15 | 0.23 | |||
| By Age | |||||||||||||||||
| Age ≤20 | 299 | 100.0% | 9 | 3.0% | 1 | 0.3% | 0 | 0.0% | |||||||||
| BP User | 150 | 50.2% | 1 | 0.7% | 0.12 | 0.02 | 0 | 0.0% | NA | NA | 0 | 0.0% | NA | NA | |||
| BP Non-user | 149 | 49.8% | 8 | 5.4% | 0.01 | 0.96 | 1 | 0.7% | NA | NA | 0 | 0.0% | NA | NA | |||
| Age 21-40 | 1,115 | 100.0% | 67 | 6.0% | 18 | 1.6% | 3 | 0.3% | |||||||||
| BP User | 557 | 50.0% | 17 | 3.1% | 0.32 | <0.001 | 2 | 0.4% | 0.12 | 0.001 | 1 | 0.2% | 0.50 | 1.00 | |||
| BP Non-user | 558 | 50.0% | 50 | 9.0% | 0.18 | 0.56 | 16 | 2.9% | 0.03 | 0.53 | 2 | 0.4% | 0.05 | 5.53 | |||
| Age 41-50 | 2,806 | 100.0% | 147 | 5.2% | 33 | 1.2% | 10 | 0.4% | |||||||||
| BP User | 1,404 | 50.0% | 27 | 1.9% | 0.21 | <0.001 | 3 | 0.2% | 0.10 | <0.001 | 1 | 0.1% | 0.11 | 0.01 | |||
| BP Non-user | 1,402 | 50.0% | 120 | 8.6% | 0.14 | 0.32 | 30 | 2.1% | 0.03 | 0.32 | 9 | 0.6% | 0.01 | 0.87 | |||
| Age 51-60 | 20,761 | 100.0% | 952 | 4.6% | 304 | 1.5% | 54 | 0.3% | |||||||||
| BP User | 10,380 | 50.0% | 178 | 1.7% | 0.22 | <0.001 | 53 | 0.5% | 0.21 | <0.001 | 7 | 0.1% | 0.15 | <0.001 | |||
| BP Non-user | 10,381 | 50.0% | 774 | 7.5% | 0.18 | 0.26 | 251 | 2.4% | 0.15 | 0.28 | 47 | 0.5% | 0.07 | 0.33 | |||
| Age 61-70 | 62,798 | 100.0% | 2,228 | 3.5% | 828 | 1.3% | 196 | 0.3% | |||||||||
| BP User | 31,392 | 50.0% | 341 | 1.1% | 0.17 | <0.001 | 118 | 0.4% | 0.16 | <0.001 | 21 | 0.1% | 0.12 | <0.001 | |||
| BP Non-user | 31,406 | 50.0% | 1,887 | 6.0% | 0.15 | 0.19 | 710 | 2.3% | 0.13 | 0.20 | 175 | 0.6% | 0.08 | 0.19 | |||
| Age 71-80 | 64,596 | 100.0% | 1,962 | 3.0% | 915 | 1.4% | 259 | 0.4% | |||||||||
| BP User | 32,303 | 50.0% | 336 | 1.0% | 0.20 | <0.001 | 137 | 0.4% | 0.17 | <0.001 | 43 | 0.1% | 0.20 | <0.001 | |||
| BP Non-user | 32,293 | 50.0% | 1,626 | 5.0% | 0.18 | 0.22 | 778 | 2.4% | 0.14 | 0.21 | 216 | 0.7% | 0.14 | 0.27 | |||
| Age ≥81 | 38,159 | 100.0% | 1,072 | 2.8% | 736 | 1.9% | 198 | 0.5% | |||||||||
| BP User | 19,081 | 50.0% | 184 | 1.0% | 0.20 | <0.001 | 126 | 0.7% | 0.20 | <0.001 | 40 | 0.2% | 0.25 | <0.001 | |||
| BP Non-user | 19,078 | 50.0% | 888 | 4.7% | 0.17 | 0.23 | 610 | 3.2% | 0.17 | 0.24 | 158 | 0.8% | 0.18 | 0.36 | |||
| Female Patients | 168,933 | 100.0% | 5,575 | 3.3% | 2,439 | 1.4% | 576 | 0.3% | |||||||||
| BP User | 84,470 | 50.0% | 909 | 1.1% | 0.19 | <0.001 | 380 | 0.4% | 0.18 | <0.001 | 92 | 0.1% | 0.19 | <0.001 | |||
| BP Non-user | 84,463 | 50.0% | 4,666 | 5.5% | 0.17 | 0.20 | 2,059 | 2.4% | 0.16 | 0.20 | 484 | 0.6% | 0.15 | 0.24 | |||
| By Age | |||||||||||||||||
| Age ≤20 | 107 | 100.0% | 4 | 3.7% | 0 | 0.0% | 0 | 0.0% | |||||||||
| BP User | 54 | 50.5% | 0 | 0.0% | NA | NA | 0 | 0.0% | NA | NA | 0 | 0.0% | NA | NA | |||
| BP Non-user | 53 | 49.5% | 4 | 7.5% | NA | NA | 0 | 0.0% | NA | NA | 0 | 0.0% | NA | NA | |||
| Age 21-40 | 658 | 100.0% | 44 | 6.7% | 9 | 1.4% | 2 | 0.3% | |||||||||
| BP User | 329 | 50.0% | 10 | 3.0% | 0.27 | <0.001 | 1 | 0.3% | 0.12 | 0.04 | 0 | 0.0% | NA | NA | |||
| BP Non-user | 329 | 50.0% | 34 | 10.3% | 0.13 | 0.56 | 8 | 2.4% | 0.02 | 0.98 | 2 | 0.6% | NA | NA | |||
| Age 41-50 | 2,158 | 100.0% | 124 | 5.7% | 21 | 1.0% | 5 | 0.2% | |||||||||
| BP User | 1,080 | 50.0% | 21 | 1.9% | 0.19 | <0.001 | 2 | 0.2% | 0.10 | <0.001 | 0 | 0.0% | NA | NA | |||
| BP Non-user | 1,078 | 50.0% | 103 | 9.6% | 0.12 | 0.30 | 19 | 1.8% | 0.02 | 0.45 | 5 | 0.5% | NA | NA | |||
| Age 51-60 | 18,480 | 100.0% | 835 | 4.5% | 264 | 1.4% | 43 | 0.2% | |||||||||
| BP User | 9,239 | 50.0% | 146 | 1.6% | 0.20 | <0.001 | 46 | 0.5% | 0.21 | <0.001 | 4 | 0.0% | 0.10 | <0.001 | |||
| BP Non-user | 9,241 | 50.0% | 689 | 7.5% | 0.17 | 0.24 | 218 | 2.4% | 0.15 | 0.29 | 39 | 0.4% | 0.04 | 0.29 | |||
| Age 61-70 | 57,528 | 100.0% | 1,999 | 3.5% | 727 | 1.3% | 159 | 0.3% | |||||||||
| BP User | 28,761 | 50.0% | 300 | 1.0% | 0.17 | <0.001 | 111 | 0.4% | 0.18 | <0.001 | 19 | 0.1% | 0.14 | <0.001 | |||
| BP Non-user | 28,767 | 50.0% | 1,699 | 5.9% | 0.15 | 0.19 | 616 | 2.1% | 0.14 | 0.22 | 140 | 0.5% | 0.08 | 0.22 | |||
| Age 71-80 | 57,396 | 100.0% | 1,677 | 2.9% | 775 | 1.4% | 208 | 0.4% | |||||||||
| BP User | 28,703 | 50.0% | 284 | 1.0% | 0.20 | <0.001 | 118 | 0.4% | 0.18 | <0.001 | 36 | 0.1% | 0.21 | <0.001 | |||
| BP Non-user | 28,693 | 50.0% | 1,393 | 4.9% | 0.17 | 0.22 | 657 | 2.3% | 0.14 | 0.21 | 172 | 0.6% | 0.15 | 0.30 | |||
| Age ≥81 | 32,606 | 100.0% | 892 | 2.7% | 643 | 2.0% | 159 | 0.5% | |||||||||
| BP User | 16,304 | 50.0% | 148 | 0.9% | 0.19 | <0.001 | 102 | 0.6% | 0.18 | <0.001 | 33 | 0.2% | 0.26 | <0.001 | |||
| BP Non-user | 16,302 | 50.0% | 744 | 4.6% | 0.16 | 0.23 | 541 | 3.3% | 0.15 | 0.23 | 126 | 0.8% | 0.18 | 0.38 | |||
| Male Patients | 21,601 | 100.0% | 862 | 4.0% | 396 | 1.8% | 144 | 0.7% | |||||||||
| BP User | 10,797 | 50.0% | 175 | 1.6% | 0.24 | <0.001 | 59 | 0.5% | 0.17 | <0.001 | 21 | 0.2% | 0.17 | <0.001 | |||
| BP Non-user | 10,804 | 50.0% | 687 | 6.4% | 0.21 | 0.29 | 337 | 3.1% | 0.13 | 0.23 | 123 | 1.1% | 0.11 | 0.27 | |||
| By Age | |||||||||||||||||
| Age ≤20 | 192 | 100.0% | 5 | 2.6% | 1 | 0.5% | 0 | 0.0% | |||||||||
| BP User | 96 | 50.0% | 1 | 1.0% | 0.24 | 0.37 | 0 | 0.0% | NA | NA | 0 | 0.0% | NA | NA | |||
| BP Non-user | 96 | 50.0% | 4 | 4.2% | 0.03 | 2.21 | 1 | 1.0% | NA | NA | 0 | 0.0% | NA | NA | |||
| Age 21-40 | 457 | 100.0% | 23 | 5.0% | 9 | 2.0% | 1 | 0.2% | |||||||||
| BP User | 228 | 49.9% | 7 | 3.1% | 0.42 | 0.06 | 1 | 0.4% | 0.12 | 0.04 | 1 | 0.4% | NA | NA | |||
| BP Non-user | 229 | 50.1% | 16 | 7.0% | 0.17 | 1.05 | 8 | 3.5% | 0.02 | 0.98 | 0 | 0.0% | NA | NA | |||
| Age 41-50 | 648 | 100.0% | 23 | 3.5% | 12 | 1.9% | 5 | 0.8% | |||||||||
| BP User | 324 | 50.0% | 6 | 1.9% | 0.34 | 0.02 | 1 | 0.3% | 0.09 | 0.006 | 1 | 0.3% | 0.25 | 0.37 | |||
| BP Non-user | 324 | 50.0% | 17 | 5.2% | 0.13 | 0.88 | 11 | 3.4% | 0.01 | 0.69 | 4 | 1.2% | 0.03 | 2.23 | |||
| Age 51-60 | 2,281 | 100.0% | 117 | 5.1% | 40 | 1.8% | 11 | 0.5% | |||||||||
| BP User | 1,141 | 50.0% | 32 | 2.8% | 0.36 | <0.001 | 7 | 0.6% | 0.21 | <0.001 | 3 | 0.3% | 0.37 | 0.15 | |||
| BP Non-user | 1,140 | 50.0% | 85 | 7.5% | 0.24 | 0.54 | 33 | 2.9% | 0.09 | 0.47 | 8 | 0.7% | 0.10 | 1.41 | |||
| Age 61-70 | 5,270 | 100.0% | 229 | 4.3% | 101 | 1.9% | 37 | 0.7% | |||||||||
| BP User | 2,631 | 49.9% | 41 | 1.6% | 0.21 | <0.001 | 7 | 0.3% | 0.07 | <0.001 | 2 | 0.1% | 0.06 | <0.001 | |||
| BP Non-user | 2,639 | 50.1% | 188 | 7.1% | 0.15 | 0.29 | 94 | 3.6% | 0.03 | 0.16 | 35 | 1.3% | 0.01 | 0.24 | |||
| Age 71-80 | 7,200 | 100.0% | 285 | 4.0% | 140 | 1.9% | 51 | 0.7% | |||||||||
| BP User | 3,600 | 50.0% | 52 | 1.4% | 0.21 | <0.001 | 19 | 0.5% | 0.15 | <0.001 | 7 | 0.2% | 0.16 | <0.001 | |||
| BP Non-user | 3,600 | 50.0% | 233 | 6.5% | 0.16 | 0.29 | 121 | 3.4% | 0.09 | 0.25 | 44 | 1.2% | 0.07 | 0.35 | |||
| Age ≥81 | 5,553 | 100.0% | 180 | 3.2% | 93 | 1.7% | 39 | 0.7% | |||||||||
| BP User | 2,777 | 50.0% | 36 | 1.3% | 0.24 | <0.001 | 24 | 0.9% | 0.34 | <0.001 | 7 | 0.3% | 0.22 | <0.001 | |||
| BP Non-user | 2,776 | 50.0% | 144 | 5.2% | 0.17 | 0.35 | 69 | 2.5% | 0.21 | 0.55 | 32 | 1.2% | 0.10 | 0.49 | |||
-
BP: bisphosphonate; LL: lower 95% confidence interval level; NA: not applicable; OR: odds ratio; UL: upper 95% confidence interval level.
Appendix 2—table 11
Unadjusted COVID-19-Related Outcomes Stratified by Age, Sex, & Age by Sex; Matched Primary Analysis Cohort, Region=New York State.
| Region=New York State Matched | |||||||||||||||||
|---|---|---|---|---|---|---|---|---|---|---|---|---|---|---|---|---|---|
| All | SARS-CoV-2 Test | COVID-19 Diagnosis | COVID-19 Hospitalization | ||||||||||||||
| N | % | N | % | OR | p-value | N | % | OR | p-value | N | % | OR | p-value | ||||
| LL | UL | LL | UL | LL | UL | ||||||||||||
| All Patients | 99,724 | 100.0% | 3,598 | 3.6% | 3,607 | 3.6% | 622 | 0.6% | |||||||||
| BP User | 49,862 | 50.0% | 772 | 1.5% | 0.26 | <0.001 | 811 | 1.6% | 0.28 | <0.001 | 136 | 0.3% | 0.28 | <0.001 | |||
| BP Non-user | 49,862 | 50.0% | 2,826 | 5.7% | 0.24 | 0.28 | 2,796 | 5.6% | 0.26 | 0.30 | 486 | 1.0% | 0.23 | 0.34 | |||
| By Age | |||||||||||||||||
| Age ≤20 | 102 | 100.0% | 4 | 3.9% | 2 | 2.0% | 1 | 1.0% | |||||||||
| BP User | 50 | 49.0% | 2 | 4.0% | 1.04 | 1.00 | 1 | 2.0% | 1.04 | 1.00 | 1 | 2.0% | NA | NA | |||
| BP Non-user | 52 | 51.0% | 2 | 3.8% | 0.14 | 7.69 | 1 | 1.9% | 0.06 | 17.11 | 0 | 0.0% | NA | NA | |||
| Age 21-40 | 453 | 100.0% | 21 | 4.6% | 15 | 3.3% | 1 | 0.2% | |||||||||
| BP User | 228 | 50.3% | 3 | 1.3% | 0.15 | <0.001 | 2 | 0.9% | 0.14 | 0.004 | 1 | 0.4% | NA | NA | |||
| BP Non-user | 225 | 49.7% | 18 | 8.0% | 0.04 | 0.53 | 13 | 5.8% | 0.03 | 0.65 | 0 | 0.0% | NA | NA | |||
| Age 41-50 | 1,311 | 100.0% | 77 | 5.9% | 36 | 2.7% | 4 | 0.3% | |||||||||
| BP User | 655 | 50.0% | 22 | 3.4% | 0.38 | <0.001 | 8 | 1.2% | 0.28 | <0.001 | 1 | 0.2% | 0.33 | 0.62 | |||
| BP Non-user | 656 | 50.0% | 55 | 8.4% | 0.23 | 0.63 | 28 | 4.3% | 0.13 | 0.61 | 3 | 0.5% | 0.03 | 3.21 | |||
| Age 51-60 | 12,732 | 100.0% | 688 | 5.4% | 527 | 4.1% | 58 | 0.5% | |||||||||
| BP User | 6,364 | 50.0% | 155 | 2.4% | 0.27 | <0.001 | 118 | 1.9% | 0.28 | <0.001 | 17 | 0.3% | 0.41 | 0.002 | |||
| BP Non-user | 6,368 | 50.0% | 533 | 8.4% | 0.23 | 0.33 | 409 | 6.4% | 0.22 | 0.34 | 41 | 0.6% | 0.23 | 0.73 | |||
| Age 61-70 | 32,265 | 100.0% | 1,294 | 4.0% | 1,150 | 3.6% | 141 | 0.4% | |||||||||
| BP User | 16,136 | 50.0% | 277 | 1.7% | 0.26 | <0.001 | 267 | 1.7% | 0.29 | <0.001 | 27 | 0.2% | 0.24 | <0.001 | |||
| BP Non-user | 16,129 | 50.0% | 1,017 | 6.3% | 0.23 | 0.30 | 883 | 5.5% | 0.25 | 0.33 | 114 | 0.7% | 0.15 | 0.36 | |||
| Age 71-80 | 34,693 | 100.0% | 957 | 2.8% | 1,196 | 3.4% | 240 | 0.7% | |||||||||
| BP User | 17,341 | 50.0% | 204 | 1.2% | 0.26 | <0.001 | 257 | 1.5% | 0.26 | <0.001 | 45 | 0.3% | 0.23 | <0.001 | |||
| BP Non-user | 17,352 | 50.0% | 753 | 4.3% | 0.22 | 0.31 | 939 | 5.4% | 0.23 | 0.30 | 195 | 1.1% | 0.17 | 0.32 | |||
| Age ≥81 | 18,168 | 100.0% | 557 | 3.1% | 681 | 3.7% | 177 | 1.0% | |||||||||
| BP User | 9,088 | 50.0% | 109 | 1.2% | 0.23 | <0.001 | 158 | 1.7% | 0.29 | <0.001 | 44 | 0.5% | 0.33 | <0.001 | |||
| BP Non-user | 9,080 | 50.0% | 448 | 4.9% | 0.19 | 0.29 | 523 | 5.8% | 0.24 | 0.35 | 133 | 1.5% | 0.23 | 0.46 | |||
| Female Patients | 90,567 | 100.0% | 3,255 | 3.6% | 3,235 | 3.6% | 537 | 0.6% | |||||||||
| BP User | 45,285 | 50.0% | 687 | 1.5% | 0.26 | <0.001 | 726 | 1.6% | 0.28 | <0.001 | 108 | 0.2% | 0.25 | <0.001 | |||
| BP Non-user | 45,282 | 50.0% | 2,568 | 5.7% | 0.24 | 0.28 | 2,509 | 5.5% | 0.26 | 0.30 | 429 | 0.9% | 0.20 | 0.31 | |||
| By Age | |||||||||||||||||
| Age ≤20 | 33 | 100.0% | 0 | 0.0% | 1 | 3.0% | 1 | 3.0% | |||||||||
| BP User | 16 | 48.5% | 0 | 0.0% | NA | NA | 1 | 6.3% | NA | NA | 1 | 6.3% | NA | NA | |||
| BP Non-user | 17 | 51.5% | 0 | 0.0% | NA | NA | 0 | 0.0% | NA | NA | 0 | 0.0% | NA | NA | |||
| Age 21-40 | 261 | 100.0% | 16 | 6.1% | 8 | 3.1% | 1 | 0.4% | |||||||||
| BP User | 132 | 50.6% | 2 | 1.5% | 0.13 | 0.002 | 2 | 1.5% | 0.32 | 0.17 | 1 | 0.8% | NA | NA | |||
| BP Non-user | 129 | 49.4% | 14 | 10.9% | 0.03 | 0.57 | 6 | 4.7% | 0.06 | 1.59 | 0 | 0.0% | NA | NA | |||
| Age 41-50 | 1,032 | 100.0% | 58 | 5.6% | 28 | 2.7% | 3 | 0.3% | |||||||||
| BP User | 516 | 50.0% | 18 | 3.5% | 0.43 | 0.003 | 7 | 1.4% | 0.32 | 0.007 | 0 | 0.0% | NA | NA | |||
| BP Non-user | 516 | 50.0% | 40 | 7.8% | 0.24 | 0.76 | 21 | 4.1% | 0.14 | 0.77 | 3 | 0.6% | NA | NA | |||
| Age 51-60 | 11,699 | 100.0% | 637 | 5.4% | 482 | 4.1% | 47 | 0.4% | |||||||||
| BP User | 5,849 | 50.0% | 138 | 2.4% | 0.26 | <0.001 | 110 | 1.9% | 0.28 | <0.001 | 14 | 0.2% | 0.42 | 0.006 | |||
| BP Non-user | 5,850 | 50.0% | 499 | 8.5% | 0.21 | 0.31 | 372 | 6.4% | 0.23 | 0.35 | 33 | 0.6% | 0.23 | 0.79 | |||
| Age 61-70 | 30,115 | 100.0% | 1,204 | 4.0% | 1,070 | 3.6% | 126 | 0.4% | |||||||||
| BP User | 15,060 | 50.0% | 257 | 1.7% | 0.26 | <0.001 | 248 | 1.6% | 0.29 | <0.001 | 23 | 0.2% | 0.22 | <0.001 | |||
| BP Non-user | 15,055 | 50.0% | 947 | 6.3% | 0.22 | 0.30 | 822 | 5.5% | 0.25 | 0.33 | 103 | 0.7% | 0.14 | 0.35 | |||
| Age 71-80 | 31,385 | 100.0% | 858 | 2.7% | 1,052 | 3.4% | 208 | 0.7% | |||||||||
| BP User | 15,688 | 50.0% | 176 | 1.1% | 0.25 | <0.001 | 221 | 1.4% | 0.26 | <0.001 | 33 | 0.2% | 0.19 | <0.001 | |||
| BP Non-user | 15,697 | 50.0% | 682 | 4.3% | 0.21 | 0.30 | 831 | 5.3% | 0.22 | 0.30 | 175 | 1.1% | 0.13 | 0.27 | |||
| Age ≥81 | 16,042 | 100.0% | 482 | 3.0% | 594 | 3.7% | 151 | 0.9% | |||||||||
| BP User | 8,024 | 50.0% | 96 | 1.2% | 0.24 | <0.001 | 137 | 1.7% | 0.29 | <0.001 | 36 | 0.4% | 0.31 | <0.001 | |||
| BP Non-user | 8,018 | 50.0% | 386 | 4.8% | 0.19 | 0.30 | 457 | 5.7% | 0.24 | 0.35 | 115 | 1.4% | 0.21 | 0.45 | |||
| Male Patients | 9,157 | 100.0% | 343 | 3.7% | 372 | 4.1% | 85 | 0.9% | |||||||||
| BP User | 4,577 | 50.0% | 85 | 1.9% | 0.32 | <0.001 | 85 | 1.9% | 0.28 | <0.001 | 28 | 0.6% | 0.49 | 0.002 | |||
| BP Non-user | 4,580 | 50.0% | 258 | 5.6% | 0.25 | 0.41 | 287 | 6.3% | 0.22 | 0.36 | 57 | 1.2% | 0.31 | 0.77 | |||
| By Age | |||||||||||||||||
| Age ≤20 | 69 | 100.0% | 4 | 5.8% | 1 | 1.4% | 0 | 0.0% | |||||||||
| BP User | 34 | 49.3% | 2 | 5.9% | 1.03 | 1.00 | 0 | 0.0% | NA | NA | 0 | 0.0% | NA | NA | |||
| BP Non-user | 35 | 50.7% | 2 | 5.7% | 0.14 | 7.77 | 1 | 2.9% | NA | NA | 0 | 0.0% | NA | NA | |||
| Age 21-40 | 192 | 100.0% | 5 | 2.6% | 7 | 3.6% | 0 | 0.0% | |||||||||
| BP User | 96 | 50.0% | 1 | 1.0% | 0.24 | 0.37 | 0 | 0.0% | NA | NA | 0 | 0.0% | NA | NA | |||
| BP Non-user | 96 | 50.0% | 4 | 4.2% | 0.03 | 2.21 | 7 | 7.3% | NA | NA | 0 | 0.0% | NA | NA | |||
| Age 41-50 | 279 | 100.0% | 19 | 6.8% | 8 | 2.9% | 1 | 0.4% | |||||||||
| BP User | 139 | 49.8% | 4 | 2.9% | 0.25 | 0.02 | 1 | 0.7% | 0.14 | 0.07 | 1 | 0.7% | NA | NA | |||
| BP Non-user | 140 | 50.2% | 15 | 10.7% | 0.08 | 0.76 | 7 | 5.0% | 0.02 | 1.13 | 0 | 0.0% | NA | NA | |||
| Age 51-60 | 1,033 | 100.0% | 51 | 4.9% | 45 | 4.4% | 11 | 1.1% | |||||||||
| BP User | 515 | 49.9% | 17 | 3.3% | 0.49 | 0.02 | 8 | 1.6% | 0.21 | <0.001 | 3 | 0.6% | 0.37 | 0.22 | |||
| BP Non-user | 518 | 50.1% | 34 | 6.6% | 0.27 | 0.88 | 37 | 7.1% | 0.09 | 0.44 | 8 | 1.5% | 0.10 | 1.42 | |||
| Age 61-70 | 2,150 | 100.0% | 90 | 4.2% | 80 | 3.7% | 15 | 0.7% | |||||||||
| BP User | 1,076 | 50.0% | 20 | 1.9% | 0.27 | <0.001 | 19 | 1.8% | 0.30 | <0.001 | 4 | 0.4% | 0.36 | 0.08 | |||
| BP Non-user | 1,074 | 50.0% | 70 | 6.5% | 0.16 | 0.45 | 61 | 5.7% | 0.18 | 0.50 | 11 | 1.0% | 0.11 | 1.14 | |||
| Age 71-80 | 3,308 | 100.0% | 99 | 3.0% | 144 | 4.4% | 32 | 1.0% | |||||||||
| BP User | 1,653 | 50.0% | 28 | 1.7% | 0.38 | <0.001 | 36 | 2.2% | 0.32 | <0.001 | 12 | 0.7% | 0.60 | 0.16 | |||
| BP Non-user | 1,655 | 50.0% | 71 | 4.3% | 0.25 | 0.60 | 108 | 6.5% | 0.22 | 0.47 | 20 | 1.2% | 0.29 | 1.23 | |||
| Age ≥81 | 2,126 | 100.0% | 75 | 3.5% | 87 | 4.1% | 26 | 1.2% | |||||||||
| BP User | 1,064 | 50.0% | 13 | 1.2% | 0.20 | <0.001 | 21 | 2.0% | 0.30 | <0.001 | 8 | 0.8% | 0.44 | 0.05 | |||
| BP Non-user | 1,062 | 50.0% | 62 | 5.8% | 0.11 | 0.37 | 66 | 6.2% | 0.18 | 0.50 | 18 | 1.7% | 0.19 | 1.02 | |||
-
BP: bisphosphonate; LL: lower 95% confidence interval level; NA: not applicable; OR: odds ratio; UL: upper 95% confidence interval level.
Appendix 2—table 12
Unadjusted COVID-19-Related Outcomes Stratified by Age, Sex, & Age by Sex; Matched Primary Analysis Cohort, Region=New York State.
| SARS-CoV-2 Test | COVID-19 Diagnosis | COVID-19 Hospitalization | |||||||||||
|---|---|---|---|---|---|---|---|---|---|---|---|---|---|
| OR | LL | UL | p value | OR | LL | UL | p value | OR | LL | UL | p value | ||
| All | Unadjusted | 0.22 | 0.21 | 0.22 | <0.001 | 0.22 | 0.21 | 0.23 | <0.001 | 0.24 | 0.22 | 0.26 | <0.001 |
| Adjusted | 0.22 | 0.21 | 0.23 | <0.001 | 0.23 | 0.22 | 0.24 | <0.001 | 0.26 | 0.24 | 0.29 | <0.001 | |
| Northeast | Unadjusted | 0.22 | 0.21 | 0.24 | <0.001 | 0.24 | 0.23 | 0.26 | <0.001 | 0.26 | 0.23 | 0.30 | <0.001 |
| Adjusted | 0.23 | 0.21 | 0.24 | <0.001 | 0.25 | 0.23 | 0.26 | <0.001 | 0.29 | 0.26 | 0.33 | <0.001 | |
| Midwest | Unadjusted | 0.23 | 0.22 | 0.25 | <0.001 | 0.22 | 0.20 | 0.25 | <0.001 | 0.23 | 0.19 | 0.29 | <0.001 |
| Adjusted | 0.24 | 0.22 | 0.26 | <0.001 | 0.24 | 0.22 | 0.27 | <0.001 | 0.26 | 0.21 | 0.32 | <0.001 | |
| South | Unadjusted | 0.22 | 0.21 | 0.23 | <0.001 | 0.21 | 0.19 | 0.23 | <0.001 | 0.24 | 0.21 | 0.29 | <0.001 |
| Adjusted | 0.22 | 0.21 | 0.23 | <0.001 | 0.22 | 0.20 | 0.24 | <0.001 | 0.26 | 0.23 | 0.30 | <0.001 | |
| West | Unadjusted | 0.19 | 0.18 | 0.21 | <0.001 | 0.18 | 0.16 | 0.20 | <0.001 | 0.19 | 0.15 | 0.23 | <0.001 |
| Adjusted | 0.20 | 0.18 | 0.21 | <0.001 | 0.19 | 0.17 | 0.21 | <0.001 | 0.20 | 0.16 | 0.25 | <0.001 | |
| New York | Unadjusted | 0.26 | 0.24 | 0.28 | <0.001 | 0.28 | 0.26 | 0.30 | <0.001 | 0.28 | 0.23 | 0.34 | <0.001 |
| Adjusted | 0.26 | 0.24 | 0.28 | <0.001 | 0.28 | 0.26 | 0.31 | <0.001 | 0.33 | 0.27 | 0.40 | <0.001 | |
-
LL: lower 95% confidence interval level; OR: odds ratio; UL: upper 95% confidence interval level.
Appendix 2—table 13
Statin Use Sensitivity Analysis, Unadjusted/Adjusted Odds Ratio for COVID-19-Related Outcomes, Stratified by Region and New York State.
| SARS-CoV-2 Test | COVID-19 Diagnosis | COVID-19 Hospitalization | |||||||||||
|---|---|---|---|---|---|---|---|---|---|---|---|---|---|
| Statin Uses versus Non-users | |||||||||||||
| OR | LL | UL | p value | OR | LL | UL | p value | OR | LL | UL | p value | ||
| All | Unadjusted | 0.90 | 0.89 | 0.91 | <0.001 | 0.91 | 0.90 | 0.92 | <0.001 | 1.12 | 1.09 | 1.15 | <0.001 |
| Adjusted | 0.87 | 0.86 | 0.87 | <0.001 | 0.79 | 0.78 | 0.81 | <0.001 | 0.99 | 0.96 | 1.02 | 0.48 | |
| Northeast | Unadjusted | 0.87 | 0.85 | 0.88 | <0.001 | 0.88 | 0.86 | 0.90 | <0.001 | 1.16 | 1.11 | 1.21 | <0.001 |
| Adjusted | 0.85 | 0.84 | 0.87 | <0.001 | 0.77 | 0.75 | 0.78 | <0.001 | 1.03 | 0.98 | 1.07 | 0.22 | |
| Midwest | Unadjusted | 0.97 | 0.95 | 0.99 | 0.02 | 1.10 | 1.07 | 1.14 | <0.001 | 1.27 | 1.19 | 1.36 | <0.001 |
| Adjusted | 0.92 | 0.90 | 0.94 | <0.001 | 0.99 | 0.96 | 1.03 | 0.75 | 1.15 | 1.08 | 1.23 | <0.001 | |
| South | Unadjusted | 0.90 | 0.88 | 0.91 | <0.001 | 0.90 | 0.88 | 0.93 | <0.001 | 1.00 | 0.95 | 1.06 | 0.90 |
| Adjusted | 0.85 | 0.84 | 0.87 | <0.001 | 0.80 | 0.78 | 0.83 | <0.001 | 0.88 | 0.83 | 0.94 | <0.001 | |
| West | Unadjusted | 0.88 | 0.86 | 0.90 | <0.001 | 0.83 | 0.80 | 0.86 | <0.001 | 1.02 | 0.95 | 1.10 | 0.58 |
| Adjusted | 0.86 | 0.83 | 0.88 | <0.001 | 0.71 | 0.68 | 0.74 | <0.001 | 0.87 | 0.80 | 0.94 | <0.001 | |
| New York | Unadjusted | 0.91 | 0.89 | 0.93 | <0.001 | 0.93 | 0.91 | 0.96 | <0.001 | 1.21 | 1.14 | 1.29 | <0.001 |
| Adjusted | 0.92 | 0.90 | 0.95 | <0.001 | 0.79 | 0.77 | 0.82 | <0.001 | 1.05 | 0.98 | 1.13 | 0.15 | |
| BP Users versus BP Non-users among Statin Users | |||||||||||||
| OR | LL | UL | p value | OR | LL | UL | p value | OR | LL | UL | p value | ||
| All | Unadjusted | 0.23 | 0.22 | 0.24 | <0.001 | 0.26 | 0.25 | 0.28 | <0.001 | 0.26 | 0.23 | 0.29 | <0.001 |
| Adjusted | 0.23 | 0.22 | 0.24 | <0.001 | 0.27 | 0.25 | 0.29 | <0.001 | 0.28 | 0.25 | 0.32 | <0.001 | |
| Northeast | Unadjusted | 0.25 | 0.23 | 0.27 | <0.001 | 0.29 | 0.27 | 0.31 | <0.001 | 0.28 | 0.24 | 0.34 | <0.001 |
| Adjusted | 0.25 | 0.23 | 0.27 | <0.001 | 0.29 | 0.27 | 0.32 | <0.001 | 0.32 | 0.26 | 0.38 | <0.001 | |
| Midwest | Unadjusted | 0.24 | 0.22 | 0.27 | <0.001 | 0.22 | 0.19 | 0.25 | <0.001 | 0.21 | 0.16 | 0.27 | <0.001 |
| Adjusted | 0.25 | 0.23 | 0.29 | <0.001 | 0.23 | 0.22 | 0.25 | <0.001 | 0.22 | 0.17 | 0.30 | <0.001 | |
| South | Unadjusted | 0.22 | 0.21 | 0.24 | <0.001 | 0.26 | 0.23 | 0.29 | <0.001 | 0.26 | 0.21 | 0.33 | <0.001 |
| Adjusted | 0.22 | 0.20 | 0.24 | <0.001 | 0.27 | 0.24 | 0.31 | <0.001 | 0.28 | 0.22 | 0.36 | <0.001 | |
| West | Unadjusted | 0.20 | 0.18 | 0.22 | <0.001 | 0.22 | 0.19 | 0.25 | <0.001 | 0.25 | 0.20 | 0.33 | <0.001 |
| Adjusted | 0.20 | 0.18 | 0.22 | <0.001 | 0.23 | 0.20 | 0.27 | <0.001 | 0.28 | 0.21 | 0.36 | <0.001 | |
| New York | Unadjusted | 0.27 | 0.24 | 0.30 | <0.001 | 0.31 | 0.28 | 0.35 | <0.001 | 0.30 | 0.23 | 0.39 | <0.001 |
| Adjusted | 0.28 | 0.25 | 0.32 | <0.001 | 0.31 | 0.28 | 0.35 | <0.001 | 0.33 | 0.25 | 0.44 | <0.001 | |
| BP Users versus BP Non-users among Statin Non-users | |||||||||||||
| OR | LL | UL | p value | OR | LL | UL | p value | OR | LL | UL | p value | ||
| All | Unadjusted | 0.23 | 0.21 | 0.24 | <0.001 | 0.21 | 0.19 | 0.23 | <0.001 | 0.21 | 0.17 | 0.25 | <0.001 |
| Adjusted | 0.24 | 0.22 | 0.25 | <0.001 | 0.23 | 0.21 | 0.25 | <0.001 | 0.25 | 0.21 | 0.30 | <0.001 | |
| Northeast | Unadjusted | 0.25 | 0.22 | 0.27 | <0.001 | 0.22 | 0.20 | 0.25 | <0.001 | 0.24 | 0.19 | 0.31 | <0.001 |
| Adjusted | 0.26 | 0.23 | 0.29 | <0.001 | 0.25 | 0.22 | 0.28 | <0.001 | 0.29 | 0.22 | 0.37 | <0.001 | |
| Midwest | Unadjusted | 0.24 | 0.21 | 0.28 | <0.001 | 0.22 | 0.18 | 0.27 | <0.001 | 0.21 | 0.14 | 0.31 | <0.001 |
| Adjusted | 0.24 | 0.20 | 0.28 | <0.001 | 0.25 | 0.20 | 0.32 | <0.001 | 0.26 | 0.17 | 0.39 | <0.001 | |
| South | Unadjusted | 0.23 | 0.21 | 0.25 | <0.001 | 0.19 | 0.15 | 0.22 | <0.001 | 0.18 | 0.12 | 0.27 | <0.001 |
| Adjusted | 0.24 | 0.21 | 0.27 | <0.001 | 0.21 | 0.17 | 0.25 | <0.001 | 0.22 | 0.15 | 0.33 | <0.001 | |
| West | Unadjusted | 0.19 | 0.17 | 0.22 | <0.001 | 0.18 | 0.15 | 0.22 | <0.001 | 0.16 | 0.11 | 0.25 | <0.001 |
| Adjusted | 0.20 | 0.17 | 0.23 | <0.001 | 0.19 | 0.18 | 0.21 | <0.001 | 0.18 | 0.11 | 0.29 | <0.001 | |
| New York | Unadjusted | 0.26 | 0.23 | 0.30 | <0.001 | 0.26 | 0.22 | 0.30 | <0.001 | 0.27 | 0.19 | 0.39 | <0.001 |
| Adjusted | 0.26 | 0.22 | 0.31 | <0.001 | 0.25 | 0.21 | 0.30 | <0.001 | 0.35 | 0.23 | 0.52 | <0.001 | |
-
LL: lower 95% confidence interval level; OR: odds ratio; UL: upper 95% confidence interval level.
Appendix 2—table 14
Antihypertensive Use Sensitivity Analysis, Unadjusted/Adjusted Odds Ratio for COVID-19-Related Outcomes, Stratified by Region and New York State.
| Odds of SARS-CoV-2 Test | Odds of COVID-19 Diagnosis | Odds of COVID-19 Hospitalization | |||||||||||
|---|---|---|---|---|---|---|---|---|---|---|---|---|---|
| Antihypertensive Users versus Non-users | |||||||||||||
| OR | LL | UL | p value | OR | LL | UL | p value | OR | LL | UL | p value | ||
| All | Unadjusted | 0.91 | 0.90 | 0.92 | <0.001 | 0.86 | 0.85 | 0.87 | <0.001 | 1.13 | 1.10 | 1.17 | <0.001 |
| Adjusted | 0.87 | 0.86 | 0.88 | <0.001 | 0.75 | 0.74 | 0.76 | <0.001 | 0.98 | 0.95 | 1.00 | 0.10 | |
| Northeast | Unadjusted | 0.86 | 0.84 | 0.87 | <0.001 | 0.83 | 0.82 | 0.85 | <0.001 | 1.20 | 1.15 | 1.25 | <0.001 |
| Adjusted | 0.82 | 0.81 | 0.83 | <0.001 | 0.72 | 0.71 | 0.73 | <0.001 | 1.04 | 0.99 | 1.08 | 0.10 | |
| Midwest | Unadjusted | 1.00 | 0.98 | 1.02 | 0.98 | 1.06 | 1.03 | 1.10 | <0.001 | 1.28 | 1.20 | 1.36 | <0.001 |
| Adjusted | 0.94 | 0.91 | 0.96 | <0.001 | 0.94 | 0.90 | 0.97 | <0.001 | 1.11 | 1.04 | 1.19 | 0.002 | |
| South | Unadjusted | 0.93 | 0.92 | 0.94 | <0.001 | 0.88 | 0.86 | 0.90 | <0.001 | 1.02 | 0.96 | 1.07 | 0.58 |
| Adjusted | 0.88 | 0.87 | 0.89 | <0.001 | 0.78 | 0.76 | 0.80 | <0.001 | 0.89 | 0.84 | 0.94 | <0.001 | |
| West | Unadjusted | 0.90 | 0.88 | 0.92 | <0.001 | 0.75 | 0.73 | 0.78 | <0.001 | 0.99 | 0.92 | 1.06 | 0.83 |
| Adjusted | 0.87 | 0.85 | 0.89 | <0.001 | 0.65 | 0.62 | 0.67 | <0.001 | 0.84 | 0.78 | 0.90 | <0.001 | |
| New York | Unadjusted | 0.92 | 0.90 | 0.94 | <0.001 | 0.90 | 0.87 | 0.92 | <0.001 | 1.23 | 1.15 | 1.31 | <0.001 |
| Adjusted | 0.90 | 0.87 | 0.92 | <0.001 | 0.75 | 0.73 | 0.77 | <0.001 | 1.01 | 0.95 | 1.09 | 0.70 | |
| BP Users versus BP Non-users among Antihypertensive Users | |||||||||||||
| OR | LL | UL | p value | OR | LL | UL | p value | OR | LL | UL | p value | ||
| All | Unadjusted | 0.23 | 0.22 | 0.24 | <0.001 | 0.26 | 0.25 | 0.28 | <0.001 | 0.26 | 0.23 | 0.29 | <0.001 |
| Adjusted | 0.23 | 0.22 | 0.24 | <0.001 | 0.26 | 0.25 | 0.28 | <0.001 | 0.27 | 0.24 | 0.30 | <0.001 | |
| Northeast | Unadjusted | 0.24 | 0.22 | 0.26 | <0.001 | 0.28 | 0.26 | 0.31 | <0.001 | 0.27 | 0.22 | 0.32 | <0.001 |
| Adjusted | 0.23 | 0.21 | 0.26 | <0.001 | 0.28 | 0.26 | 0.31 | <0.001 | 0.29 | 0.24 | 0.34 | <0.001 | |
| Midwest | Unadjusted | 0.26 | 0.23 | 0.29 | <0.001 | 0.27 | 0.23 | 0.31 | <0.001 | 0.27 | 0.21 | 0.35 | <0.001 |
| Adjusted | 0.27 | 0.24 | 0.30 | <0.001 | 0.28 | 0.26 | 0.30 | <0.001 | 0.27 | 0.20 | 0.35 | <0.001 | |
| South | Unadjusted | 0.23 | 0.21 | 0.25 | <0.001 | 0.24 | 0.22 | 0.28 | <0.001 | 0.26 | 0.20 | 0.32 | <0.001 |
| Adjusted | 0.23 | 0.21 | 0.25 | <0.001 | 0.24 | 0.21 | 0.28 | <0.001 | 0.25 | 0.20 | 0.32 | <0.001 | |
| West | Unadjusted | 0.20 | 0.18 | 0.22 | <0.001 | 0.21 | 0.18 | 0.25 | <0.001 | 0.24 | 0.18 | 0.31 | <0.001 |
| Adjusted | 0.20 | 0.18 | 0.22 | <0.001 | 0.22 | 0.18 | 0.25 | <0.001 | 0.24 | 0.18 | 0.33 | <0.001 | |
| New York | Unadjusted | 0.26 | 0.23 | 0.29 | <0.001 | 0.30 | 0.26 | 0.33 | <0.001 | 0.29 | 0.22 | 0.38 | <0.001 |
| Adjusted | 0.25 | 0.22 | 0.29 | <0.001 | 0.30 | 0.26 | 0.34 | <0.001 | 0.33 | 0.24 | 0.44 | <0.001 | |
| BP Users versus BP Non-users among Antihypertensive Non-users | |||||||||||||
| OR | LL | UL | p value | OR | LL | UL | p value | OR | LL | UL | p value | ||
| All | Unadjusted | 0.21 | 0.20 | 0.22 | <0.001 | 0.20 | 0.18 | 0.22 | <0.001 | 0.21 | 0.17 | 0.25 | <0.001 |
| Adjusted | 0.21 | 0.20 | 0.22 | <0.001 | 0.22 | 0.20 | 0.24 | <0.001 | 0.27 | 0.22 | 0.32 | <0.001 | |
| Northeast | Unadjusted | 0.21 | 0.19 | 0.23 | <0.001 | 0.22 | 0.19 | 0.24 | <0.001 | 0.23 | 0.18 | 0.31 | <0.001 |
| Adjusted | 0.22 | 0.20 | 0.25 | <0.001 | 0.25 | 0.22 | 0.28 | <0.001 | 0.30 | 0.22 | 0.40 | <0.001 | |
| Midwest | Unadjusted | 0.22 | 0.19 | 0.25 | <0.001 | 0.16 | 0.12 | 0.20 | <0.001 | 0.20 | 0.13 | 0.31 | <0.001 |
| Adjusted | 0.21 | 0.18 | 0.25 | <0.001 | 0.18 | 0.14 | 0.23 | <0.001 | 0.26 | 0.16 | 0.42 | <0.001 | |
| South | Unadjusted | 0.20 | 0.18 | 0.22 | <0.001 | 0.19 | 0.16 | 0.22 | <0.001 | 0.22 | 0.15 | 0.32 | <0.001 |
| Adjusted | 0.20 | 0.18 | 0.22 | <0.001 | 0.21 | 0.17 | 0.25 | <0.001 | 0.28 | 0.19 | 0.41 | <0.001 | |
| West | Unadjusted | 0.19 | 0.17 | 0.22 | <0.001 | 0.18 | 0.15 | 0.22 | <0.001 | 0.15 | 0.09 | 0.24 | <0.001 |
| Adjusted | 0.20 | 0.17 | 0.22 | <0.001 | 0.20 | 0.16 | 0.25 | <0.001 | 0.19 | 0.11 | 0.32 | <0.001 | |
| New York | Unadjusted | 0.26 | 0.23 | 0.31 | <0.001 | 0.25 | 0.21 | 0.29 | <0.001 | 0.23 | 0.15 | 0.36 | <0.001 |
| Adjusted | 0.27 | 0.23 | 0.32 | <0.001 | 0.26 | 0.22 | 0.31 | <0.001 | 0.26 | 0.16 | 0.43 | <0.001 | |
-
LL: lower 95% confidence interval level; OR: odds ratio; UL: upper 95% confidence interval level.
Appendix 2—table 15
Antidiabetic Use Sensitivity Analysis, Unadjusted/Adjusted Odds Ratio for COVID-19-Related Outcomes, Stratified by Region and New York State.
| Odds of SARS-CoV-2 Test | Odds of COVID-19 Diagnosis | Odds of COVID-19 Hospitalization | |||||||||||
|---|---|---|---|---|---|---|---|---|---|---|---|---|---|
| Antidiabetic Users versus Non-users | |||||||||||||
| OR | LL | UL | p value | OR | LL | UL | p value | OR | LL | UL | p value | ||
| All | Unadjusted | 0.98 | 0.97 | 0.99 | 0.01 | 1.15 | 1.13 | 1.18 | <0.001 | 1.50 | 1.45 | 1.56 | <0.001 |
| Adjusted | 0.92 | 0.90 | 0.93 | <0.001 | 0.88 | 0.86 | 0.90 | <0.001 | 1.13 | 1.08 | 1.18 | <0.001 | |
| Northeast | Unadjusted | 1.00 | 0.98 | 1.02 | 0.92 | 1.11 | 1.09 | 1.14 | <0.001 | 1.55 | 1.47 | 1.64 | <0.001 |
| Adjusted | 0.94 | 0.92 | 0.97 | <0.001 | 0.84 | 0.81 | 0.86 | <0.001 | 1.18 | 1.11 | 1.27 | <0.001 | |
| Midwest | Unadjusted | 1.04 | 1.01 | 1.08 | 0.01 | 1.39 | 1.33 | 1.46 | <0.001 | 1.61 | 1.47 | 1.76 | <0.001 |
| Adjusted | 0.95 | 0.91 | 0.99 | 0.01 | 1.11 | 1.04 | 1.17 | <0.001 | 1.30 | 1.17 | 1.44 | <0.001 | |
| South | Unadjusted | 0.97 | 0.95 | 0.99 | 0.01 | 1.16 | 1.12 | 1.21 | <0.001 | 1.39 | 1.29 | 1.50 | <0.001 |
| Adjusted | 0.90 | 0.88 | 0.93 | <0.001 | 0.91 | 0.87 | 0.95 | <0.001 | 1.04 | 0.95 | 1.14 | 0.40 | |
| West | Unadjusted | 0.91 | 0.88 | 0.94 | <0.001 | 1.07 | 1.01 | 1.12 | 0.01 | 1.43 | 1.30 | 1.58 | <0.001 |
| Adjusted | 0.86 | 0.82 | 0.89 | <0.001 | 0.80 | 0.75 | 0.85 | <0.001 | 0.97 | 0.86 | 1.09 | 0.60 | |
| New York | Unadjusted | 1.06 | 1.03 | 1.10 | <0.001 | 1.15 | 1.11 | 1.19 | <0.001 | 1.59 | 1.46 | 1.72 | <0.001 |
| Adjusted | 1.06 | 1.02 | 1.10 | 0.007 | 0.87 | 0.83 | 0.90 | <0.001 | 1.18 | 1.07 | 1.30 | 0.001 | |
| BP Users versus BP Non-users among Antidiabetic Users | |||||||||||||
| OR | LL | UL | p value | OR | LL | UL | p value | OR | LL | UL | p value | ||
| All | Unadjusted | 0.26 | 0.24 | 0.28 | <0.001 | 0.29 | 0.27 | 0.32 | <0.001 | 0.28 | 0.24 | 0.33 | <0.001 |
| Adjusted | 0.26 | 0.24 | 0.28 | <0.001 | 0.29 | 0.27 | 0.32 | <0.001 | 0.29 | 0.25 | 0.34 | <0.001 | |
| Northeast | Unadjusted | 0.28 | 0.24 | 0.32 | <0.001 | 0.32 | 0.28 | 0.35 | <0.001 | 0.29 | 0.23 | 0.36 | <0.001 |
| Adjusted | 0.28 | 0.24 | 0.32 | <0.001 | 0.31 | 0.27 | 0.35 | <0.001 | 0.30 | 0.24 | 0.39 | <0.001 | |
| Midwest | Unadjusted | 0.27 | 0.22 | 0.33 | <0.001 | 0.30 | 0.24 | 0.38 | <0.001 | 0.28 | 0.19 | 0.41 | <0.001 |
| Adjusted | 0.27 | 0.22 | 0.34 | <0.001 | 0.32 | 0.26 | 0.41 | <0.001 | 0.29 | 0.19 | 0.42 | <0.001 | |
| South | Unadjusted | 0.29 | 0.26 | 0.33 | <0.001 | 0.31 | 0.26 | 0.36 | <0.001 | 0.35 | 0.26 | 0.47 | <0.001 |
| Adjusted | 0.30 | 0.26 | 0.34 | <0.001 | 0.30 | 0.25 | 0.36 | <0.001 | 0.36 | 0.26 | 0.48 | <0.001 | |
| West | Unadjusted | 0.19 | 0.16 | 0.22 | <0.001 | 0.20 | 0.17 | 0.25 | <0.001 | 0.21 | 0.15 | 0.30 | <0.001 |
| Adjusted | 0.19 | 0.16 | 0.23 | <0.001 | 0.21 | 0.17 | 0.26 | <0.001 | 0.22 | 0.15 | 0.31 | <0.001 | |
| New York | Unadjusted | 0.33 | 0.27 | 0.40 | <0.001 | 0.34 | 0.29 | 0.39 | <0.001 | 0.35 | 0.26 | 0.49 | <0.001 |
| Adjusted | 0.32 | 0.26 | 0.40 | <0.001 | 0.32 | 0.28 | 0.36 | <0.001 | 0.40 | 0.28 | 0.56 | <0.001 | |
| BP Users versus BP Non-users among Antidiabetic Non-users | |||||||||||||
| OR | LL | UL | p value | OR | LL | UL | p value | OR | LL | UL | p value | ||
| All | Unadjusted | 0.24 | 0.23 | 0.26 | <0.001 | 0.24 | 0.22 | 0.26 | <0.001 | 0.24 | 0.20 | 0.29 | <0.001 |
| Adjusted | 0.25 | 0.23 | 0.27 | <0.001 | 0.25 | 0.23 | 0.28 | <0.001 | 0.27 | 0.22 | 0.33 | <0.001 | |
| Northeast | Unadjusted | 0.24 | 0.22 | 0.28 | <0.001 | 0.26 | 0.22 | 0.29 | <0.001 | 0.25 | 0.19 | 0.34 | <0.001 |
| Adjusted | 0.25 | 0.22 | 0.29 | <0.001 | 0.27 | 0.24 | 0.32 | <0.001 | 0.28 | 0.20 | 0.39 | <0.001 | |
| Midwest | Unadjusted | 0.27 | 0.22 | 0.32 | <0.001 | 0.22 | 0.17 | 0.30 | <0.001 | 0.26 | 0.16 | 0.42 | <0.001 |
| Adjusted | 0.28 | 0.24 | 0.31 | <0.001 | 0.23 | 0.17 | 0.31 | <0.001 | 0.26 | 0.16 | 0.45 | <0.001 | |
| South | Unadjusted | 0.24 | 0.21 | 0.27 | <0.001 | 0.25 | 0.20 | 0.30 | <0.001 | 0.29 | 0.20 | 0.43 | <0.001 |
| Adjusted | 0.24 | 0.21 | 0.27 | <0.001 | 0.24 | 0.21 | 0.28 | <0.001 | 0.33 | 0.22 | 0.49 | <0.001 | |
| West | Unadjusted | 0.23 | 0.20 | 0.27 | <0.001 | 0.18 | 0.14 | 0.24 | <0.001 | 0.13 | 0.07 | 0.23 | <0.001 |
| Adjusted | 0.23 | 0.20 | 0.28 | <0.001 | 0.20 | 0.15 | 0.26 | <0.001 | 0.15 | 0.08 | 0.28 | <0.001 | |
| New York | Unadjusted | 0.30 | 0.25 | 0.37 | <0.001 | 0.30 | 0.25 | 0.36 | <0.001 | 0.22 | 0.14 | 0.36 | <0.001 |
| Adjusted | 0.30 | 0.25 | 0.37 | <0.001 | 0.31 | 0.25 | 0.37 | <0.001 | 0.24 | 0.14 | 0.41 | <0.001 | |
-
LL: lower 95% confidence interval level; OR: odds ratio; UL: upper 95% confidence interval level.
Appendix 2—table 16
Antidepressant Use Sensitivity Analysis, Unadjusted/Adjusted Odds Ratio for COVID-19-Related Outcomes, Stratified by Region and New York State.
| Odds of SARS-CoV-2 Test | Odds of COVID-19 Diagnosis | Odds of COVID-19 Hospitalization | |||||||||||
|---|---|---|---|---|---|---|---|---|---|---|---|---|---|
| Antidepressant Users versus Non-users | |||||||||||||
| OR | LL | UL | p value | OR | LL | UL | p value | OR | LL | UL | p value | ||
| All | Unadjusted | 1.04 | 1.03 | 1.05 | <0.001 | 0.71 | 0.70 | 0.72 | <0.001 | 0.81 | 0.78 | 0.83 | <0.001 |
| Adjusted | 1.00 | 0.99 | 1.01 | 0.61 | 0.65 | 0.64 | 0.66 | <0.001 | 0.75 | 0.73 | 0.78 | <0.001 | |
| Northeast | Unadjusted | 1.01 | 0.99 | 1.02 | 0.54 | 0.71 | 0.69 | 0.72 | <0.001 | 0.84 | 0.80 | 0.88 | <0.001 |
| Adjusted | 0.97 | 0.95 | 0.99 | 0.001 | 0.65 | 0.63 | 0.66 | <0.001 | 0.77 | 0.73 | 0.82 | <0.001 | |
| Midwest | Unadjusted | 1.10 | 1.08 | 1.12 | <0.001 | 0.75 | 0.72 | 0.78 | <0.001 | 0.84 | 0.78 | 0.90 | <0.001 |
| Adjusted | 1.05 | 1.03 | 1.07 | <0.001 | 0.69 | 0.66 | 0.71 | <0.001 | 0.78 | 0.73 | 0.84 | <0.001 | |
| South | Unadjusted | 1.04 | 1.02 | 1.05 | <0.001 | 0.68 | 0.66 | 0.70 | <0.001 | 0.74 | 0.70 | 0.79 | <0.001 |
| Adjusted | 0.99 | 0.98 | 1.01 | 0.49 | 0.64 | 0.62 | 0.66 | <0.001 | 0.72 | 0.68 | 0.77 | <0.001 | |
| West | Unadjusted | 1.04 | 1.02 | 1.06 | 0.00 | 0.70 | 0.67 | 0.73 | <0.001 | 0.77 | 0.70 | 0.84 | <0.001 |
| Adjusted | 0.99 | 0.97 | 1.02 | 0.46 | 0.64 | 0.61 | 0.66 | <0.001 | 0.70 | 0.64 | 0.77 | <0.001 | |
| New York | Unadjusted | 1.00 | 0.97 | 1.03 | 0.86 | 0.77 | 0.74 | 0.80 | <0.001 | 0.83 | 0.76 | 0.91 | <0.001 |
| Adjusted | 0.98 | 0.95 | 1.01 | 0.27 | 0.72 | 0.70 | 0.75 | <0.001 | 0.77 | 0.70 | 0.85 | <0.001 | |
| BP Users versus BP Non-users among Antidepressant Users | |||||||||||||
| OR | LL | UL | p value | OR | LL | UL | p value | OR | LL | UL | p value | ||
| All | Unadjusted | 0.27 | 0.26 | 0.28 | <0.001 | 0.30 | 0.28 | 0.32 | <0.001 | 0.31 | 0.27 | 0.36 | <0.001 |
| Adjusted | 0.27 | 0.25 | 0.28 | <0.001 | 0.30 | 0.28 | 0.32 | <0.001 | 0.33 | 0.28 | 0.38 | <0.001 | |
| Northeast | Unadjusted | 0.28 | 0.26 | 0.31 | <0.001 | 0.33 | 0.30 | 0.37 | <0.001 | 0.36 | 0.29 | 0.45 | <0.001 |
| Adjusted | 0.28 | 0.25 | 0.30 | <0.001 | 0.32 | 0.29 | 0.36 | <0.001 | 0.37 | 0.29 | 0.47 | <0.001 | |
| Midwest | Unadjusted | 0.30 | 0.27 | 0.34 | <0.001 | 0.26 | 0.22 | 0.31 | <0.001 | 0.25 | 0.18 | 0.34 | <0.001 |
| Adjusted | 0.30 | 0.26 | 0.34 | <0.001 | 0.27 | 0.22 | 0.33 | <0.001 | 0.26 | 0.18 | 0.36 | <0.001 | |
| South | Unadjusted | 0.26 | 0.24 | 0.29 | <0.001 | 0.27 | 0.23 | 0.31 | <0.001 | 0.32 | 0.24 | 0.41 | <0.001 |
| Adjusted | 0.26 | 0.24 | 0.28 | <0.001 | 0.27 | 0.23 | 0.32 | <0.001 | 0.32 | 0.24 | 0.43 | <0.001 | |
| West | Unadjusted | 0.25 | 0.22 | 0.28 | <0.001 | 0.27 | 0.22 | 0.32 | <0.001 | 0.29 | 0.20 | 0.41 | <0.001 |
| Adjusted | 0.24 | 0.21 | 0.27 | <0.001 | 0.29 | 0.28 | 0.30 | <0.001 | 0.33 | 0.23 | 0.48 | <0.001 | |
| New York | Unadjusted | 0.30 | 0.26 | 0.34 | <0.001 | 0.33 | 0.28 | 0.38 | <0.001 | 0.24 | 0.16 | 0.36 | <0.001 |
| Adjusted | 0.30 | 0.25 | 0.34 | <0.001 | 0.31 | 0.27 | 0.37 | <0.001 | 0.25 | 0.16 | 0.39 | <0.001 | |
| BP Users versus BP Non-users among Antidepressant Non-users | |||||||||||||
| OR | LL | UL | p value | OR | LL | UL | p value | OR | LL | UL | p value | ||
| All | Unadjusted | 0.20 | 0.19 | 0.22 | <0.001 | 0.22 | 0.20 | 0.24 | <0.001 | 0.24 | 0.20 | 0.28 | <0.001 |
| Adjusted | 0.21 | 0.19 | 0.22 | <0.001 | 0.23 | 0.21 | 0.25 | <0.001 | 0.27 | 0.22 | 0.32 | <0.001 | |
| Northeast | Unadjusted | 0.21 | 0.19 | 0.24 | <0.001 | 0.23 | 0.20 | 0.26 | <0.001 | 0.25 | 0.19 | 0.32 | <0.001 |
| Adjusted | 0.22 | 0.19 | 0.25 | <0.001 | 0.24 | 0.22 | 0.25 | <0.001 | 0.29 | 0.22 | 0.39 | <0.001 | |
| Midwest | Unadjusted | 0.22 | 0.19 | 0.26 | <0.001 | 0.23 | 0.18 | 0.28 | <0.001 | 0.28 | 0.19 | 0.39 | <0.001 |
| Adjusted | 0.21 | 0.18 | 0.25 | <0.001 | 0.26 | 0.24 | 0.27 | <0.001 | 0.32 | 0.22 | 0.47 | <0.001 | |
| South | Unadjusted | 0.20 | 0.18 | 0.22 | <0.001 | 0.21 | 0.18 | 0.25 | <0.001 | 0.21 | 0.15 | 0.30 | <0.001 |
| Adjusted | 0.20 | 0.18 | 0.23 | <0.001 | 0.23 | 0.19 | 0.27 | <0.001 | 0.22 | 0.16 | 0.32 | <0.001 | |
| West | Unadjusted | 0.18 | 0.16 | 0.21 | <0.001 | 0.20 | 0.16 | 0.25 | <0.001 | 0.20 | 0.13 | 0.30 | <0.001 |
| Adjusted | 0.19 | 0.16 | 0.22 | <0.001 | 0.20 | 0.20 | 0.21 | <0.001 | 0.22 | 0.14 | 0.35 | <0.001 | |
| New York | Unadjusted | 0.26 | 0.22 | 0.32 | <0.001 | 0.27 | 0.23 | 0.32 | <0.001 | 0.29 | 0.19 | 0.43 | <0.001 |
| Adjusted | 0.26 | 0.23 | 0.30 | <0.001 | 0.26 | 0.22 | 0.32 | <0.001 | 0.35 | 0.22 | 0.54 | <0.001 | |
-
LL: lower 95% confidence interval level; OR: odds ratio; UL: upper 95% confidence interval level.
Appendix 2—table 17
“Bone-Rx” Cohort (All Regions), Patient Characteristics Pre/Post Match.
| "Bone-Rx" Cohort / All Observations Unmatched | "Bone-Rx" Cohort / All Observations Matched | |||||||||||||
|---|---|---|---|---|---|---|---|---|---|---|---|---|---|---|
| All | BP Non-user | BP User | p-value | All | BP Non-user | BP User | p-value | |||||||
| N | % | N | % | N | % | N | % | N | % | N | % | |||
| All Patients | 502,895 | 100.0% | 50,844 | 10.1% | 452,051 | 89.9% | 100,996 | 100.0% | 50,498 | 50.0% | 50,498 | 50.0% | ||
| Age | ||||||||||||||
| ≤20 | 1,164 | 0.2% | 36 | 0.1% | 1,128 | 0.2% | <0.001 | 67 | 0.1% | 36 | 0.1% | 31 | 0.1% | 0.97 |
| 21-40 | 3,501 | 0.7% | 410 | 0.8% | 3,091 | 0.7% | 790 | 0.8% | 403 | 0.8% | 387 | 0.8% | ||
| 41-50 | 9,631 | 1.9% | 1,080 | 2.1% | 8,551 | 1.9% | 2,107 | 2.1% | 1,069 | 2.1% | 1,038 | 2.1% | ||
| 51-60 | 72,139 | 14.3% | 6,418 | 12.6% | 65,721 | 14.5% | 12,777 | 12.7% | 6,395 | 12.7% | 6,382 | 12.6% | ||
| 61-70 | 171,687 | 34.1% | 14,809 | 29.1% | 156,878 | 34.7% | 29,509 | 29.2% | 14,751 | 29.2% | 14,758 | 29.2% | ||
| 71-80 | 157,877 | 31.4% | 16,152 | 31.8% | 141,725 | 31.4% | 32,129 | 31.8% | 16,055 | 31.8% | 16,074 | 31.8% | ||
| ≥81 | 86,896 | 17.3% | 11,939 | 23.5% | 74,957 | 16.6% | 23,617 | 23.4% | 11,789 | 23.3% | 11,828 | 23.4% | ||
| Gender | ||||||||||||||
| Female | 451,790 | 89.8% | 44,354 | 87.2% | 407,436 | 90.1% | <0.001 | 88,552 | 87.7% | 44,235 | 87.6% | 44,317 | 87.8% | 0.43 |
| Male | 51,105 | 10.2% | 6,490 | 12.8% | 44,615 | 9.9% | 12,444 | 12.3% | 6,263 | 12.4% | 6,181 | 12.2% | ||
| Region | ||||||||||||||
| Midwest | 85,391 | 17.0% | 9,424 | 18.5% | 75,967 | 16.8% | <0.001 | 18,720 | 18.5% | 9,360 | 18.5% | 9,360 | 18.5% | 1.00 |
| Northeast | 135,867 | 27.0% | 16,139 | 31.7% | 119,728 | 26.5% | 31,986 | 31.7% | 15,993 | 31.7% | 15,993 | 31.7% | ||
| South | 178,118 | 35.4% | 17,232 | 33.9% | 160,886 | 35.6% | 34,280 | 33.9% | 17,140 | 33.9% | 17,140 | 33.9% | ||
| West | 103,519 | 20.6% | 8,049 | 15.8% | 95,470 | 21.1% | 16,010 | 15.9% | 8,005 | 15.9% | 8,005 | 15.9% | ||
| Insurance | ||||||||||||||
| Commercial | 164,150 | 32.6% | 17,092 | 33.6% | 147,058 | 32.5% | <0.001 | 33,977 | 33.6% | 16,963 | 33.6% | 17,014 | 33.7% | 0.91 |
| Dual | 33,969 | 6.8% | 2,562 | 5.0% | 31,407 | 6.9% | 5,056 | 5.0% | 2,547 | 5.0% | 2,509 | 5.0% | ||
| Medicaid | 84,514 | 16.8% | 7,034 | 13.8% | 77,480 | 17.1% | 13,925 | 13.8% | 6,986 | 13.8% | 6,939 | 13.7% | ||
| Medicare | 220,262 | 43.8% | 24,156 | 47.5% | 196,106 | 43.4% | 48,038 | 47.6% | 24,002 | 47.5% | 24,036 | 47.6% | ||
| PCP Visit 2019 | ||||||||||||||
| No | 181,996 | 36.2% | 18,130 | 35.7% | 163,866 | 36.2% | 0.009 | 35,943 | 35.6% | 17,979 | 35.6% | 17,964 | 35.6% | 0.92 |
| Yes | 320,899 | 63.8% | 32,714 | 64.3% | 288,185 | 63.8% | 65,053 | 64.4% | 32,519 | 64.4% | 32,534 | 64.4% | ||
| Continuous Outcomes | ||||||||||||||
| mean | SD | mean | SD | mean | SD | p-value | mean | SD | mean | SD | mean | SD | p-value | |
| CCI | 1.05 | 1.91 | 1.99 | 2.71 | 0.95 | 1.76 | <0.001 | 1.93 | 2.59 | 1.93 | 2.60 | 1.92 | 2.59 | 0.76 |
-
BP: bisphosphonate; CCI: Charlson Comorbidity Index; PCP: primary care physician; SD: standard deviation.
Appendix 2—table 18
“Bone-Rx” Cohort (Region=Northeast), Patient Characteristics Pre/Post Match.
| "Bone-Rx" Cohort / Region=Northeast Unmatched | "Bone-Rx" Cohort / Region=Northeast Matched | |||||||||||||
|---|---|---|---|---|---|---|---|---|---|---|---|---|---|---|
| All | BP Non-user | BP User | p-value | All | BP Non-user | BP User | p-value | |||||||
| N | % | N | % | N | % | N | % | N | % | N | % | |||
| All Patients | 135,867 | 100.0% | 16,139 | 11.9% | 119,728 | 88.1% | 31,986 | 100.0% | 15,993 | 50.0% | 15,993 | 50.0% | ||
| Age | ||||||||||||||
| ≤20 | 245 | 0.2% | ≤10 | 0.1% | 236 | 0.2% | <0.001 | 15 | 0.0% | ≤10 | 0.1% | ≤10 | 0.0% | 0.99 |
| 21-40 | 891 | 0.7% | 127 | 0.8% | 764 | 0.6% | 250 | 0.8% | 124 | 0.8% | 126 | 0.8% | ||
| 41-50 | 2,340 | 1.7% | 298 | 1.8% | 2,042 | 1.7% | 570 | 1.8% | 290 | 1.8% | 280 | 1.8% | ||
| 51-60 | 20,069 | 14.8% | 2,059 | 12.8% | 18,010 | 15.0% | 4,088 | 12.8% | 2,049 | 12.8% | 2,039 | 12.7% | ||
| 61-70 | 45,896 | 33.8% | 4,802 | 29.8% | 41,094 | 34.3% | 9,526 | 29.8% | 4,767 | 29.8% | 4,759 | 29.8% | ||
| 71-80 | 42,828 | 31.5% | 5,267 | 32.6% | 37,561 | 31.4% | 10,465 | 32.7% | 5,226 | 32.7% | 5,239 | 32.8% | ||
| ≥81 | 23,598 | 17.4% | 3,577 | 22.2% | 20,021 | 16.7% | 7,072 | 22.1% | 3,528 | 22.1% | 3,544 | 22.2% | ||
| Gender | ||||||||||||||
| Female | 122,485 | 90.2% | 14,115 | 87.5% | 108,370 | 90.5% | <0.001 | 28,157 | 88.0% | 14,062 | 87.9% | 14,095 | 88.1% | 0.57 |
| Male | 13,382 | 9.8% | 2,024 | 12.5% | 11,358 | 9.5% | 3,829 | 12.0% | 1,931 | 12.1% | 1,898 | 11.9% | ||
| Insurance | ||||||||||||||
| Commercial | 37,810 | 27.8% | 4,517 | 28.0% | 33,293 | 27.8% | <0.001 | 8,927 | 27.9% | 4,459 | 27.9% | 4,468 | 27.9% | 0.99 |
| Dual | 8,434 | 6.2% | 829 | 5.1% | 7,605 | 6.4% | 1,637 | 5.1% | 824 | 5.2% | 813 | 5.1% | ||
| Medicaid | 25,296 | 18.6% | 2,082 | 12.9% | 23,214 | 19.4% | 4,122 | 12.9% | 2,067 | 12.9% | 2,055 | 12.8% | ||
| Medicare | 64,327 | 47.3% | 8,711 | 54.0% | 55,616 | 46.5% | 17,300 | 54.1% | 8,643 | 54.0% | 8,657 | 54.1% | ||
| PCP Visit 2019 | ||||||||||||||
| No | 56,593 | 41.7% | 6,726 | 41.7% | 49,867 | 41.7% | 0.95 | 13,307 | 41.6% | 6,654 | 41.6% | 6,653 | 41.6% | 0.99 |
| Yes | 79,274 | 58.3% | 9,413 | 58.3% | 69,861 | 58.3% | 18,679 | 58.4% | 9,339 | 58.4% | 9,340 | 58.4% | ||
| Continuous Outcomes | ||||||||||||||
| mean | SD | mean | SD | mean | SD | p-value | mean | SD | mean | SD | mean | SD | p-value | |
| CCI | 1.06 | 1.89 | 1.97 | 2.70 | 0.93 | 1.71 | <0.001 | 1.89 | 2.57 | 1.89 | 2.58 | 1.89 | 2.57 | 0.91 |
-
BP: bisphosphonate; CCI: Charlson Comorbidity Index; PCP: primary care physician; SD: standard deviation.
Appendix 2—table 19
“Bone-Rx” Cohort (Region=Midwest), Patient Characteristics Pre/Post Match.
| "Bone-Rx" Cohort / Region=Midwest Unmatched | "Bone-Rx" Cohort / Region=Midwest Matched | |||||||||||||
|---|---|---|---|---|---|---|---|---|---|---|---|---|---|---|
| All | BP Non-user | BP User | p-value | All | BP Non-user | BP User | p-value | |||||||
| N | % | N | % | N | % | N | % | N | % | N | % | |||
| All Patients | 85,391 | 100.0% | 9,424 | 11.0% | 75,967 | 89.0% | 18,720 | 100.0% | 9,360 | 50.0% | 9,360 | 50.0% | ||
| Age | ||||||||||||||
| ≤20 | 274 | 0.3% | ≤10 | 0.1% | 268 | 0.4% | <0.001 | 13 | 0.1% | ≤10 | 0.1% | ≤10 | 0.1% | 1.00 |
| 21-40 | 672 | 0.8% | 79 | 0.8% | 593 | 0.8% | 154 | 0.8% | 78 | 0.8% | 76 | 0.8% | ||
| 41-50 | 1,886 | 2.2% | 202 | 2.1% | 1,684 | 2.2% | 389 | 2.1% | 200 | 2.1% | 189 | 2.0% | ||
| 51-60 | 13,522 | 15.8% | 1,284 | 13.6% | 12,238 | 16.1% | 2,559 | 13.7% | 1,280 | 13.7% | 1,279 | 13.7% | ||
| 61-70 | 31,256 | 36.6% | 2,760 | 29.3% | 28,496 | 37.5% | 5,512 | 29.4% | 2,754 | 29.4% | 2,758 | 29.5% | ||
| 71-80 | 23,887 | 28.0% | 2,766 | 29.4% | 21,121 | 27.8% | 5,492 | 29.3% | 2,748 | 29.4% | 2,744 | 29.3% | ||
| ≥81 | 13,894 | 16.3% | 2,327 | 24.7% | 11,567 | 15.2% | 4,601 | 24.6% | 2,294 | 24.5% | 2,307 | 24.6% | ||
| Gender | ||||||||||||||
| Female | 76,696 | 89.8% | 8,118 | 86.1% | 68,578 | 90.3% | <0.001 | 16,223 | 86.7% | 8,102 | 86.6% | 8,121 | 86.8% | 0.68 |
| Male | 8,695 | 10.2% | 1,306 | 13.9% | 7,389 | 9.7% | 2,497 | 13.3% | 1,258 | 13.4% | 1,239 | 13.2% | ||
| Insurance | ||||||||||||||
| Commercial | 34,494 | 40.4% | 3,361 | 35.7% | 31,133 | 41.0% | <0.001 | 6,699 | 35.8% | 3,345 | 35.7% | 3,354 | 35.8% | 0.96 |
| Dual | 4,042 | 4.7% | 436 | 4.6% | 3,606 | 4.7% | 852 | 4.6% | 429 | 4.6% | 423 | 4.5% | ||
| Medicaid | 8,856 | 10.4% | 733 | 7.8% | 8,123 | 10.7% | 1,441 | 7.7% | 729 | 7.8% | 712 | 7.6% | ||
| Medicare | 37,999 | 44.5% | 4,894 | 51.9% | 33,105 | 43.6% | 9,728 | 52.0% | 4,857 | 51.9% | 4,871 | 52.0% | ||
| PCP Visit 2019 | ||||||||||||||
| No | 32,037 | 37.5% | 3,330 | 35.3% | 28,707 | 37.8% | <0.001 | 6,628 | 35.4% | 3,312 | 35.4% | 3,316 | 35.4% | 0.95 |
| Yes | 53,354 | 62.5% | 6,094 | 64.7% | 47,260 | 62.2% | 12,092 | 64.6% | 6,048 | 64.6% | 6,044 | 64.6% | ||
| Continuous Outcomes | ||||||||||||||
| mean | SD | mean | SD | mean | SD | p-value | mean | SD | mean | SD | mean | SD | p-value | |
| CCI | 1.12 | 2.02 | 2.12 | 2.83 | 0.99 | 1.86 | <0.001 | 2.05 | 2.72 | 2.06 | 2.72 | 2.05 | 2.72 | 0.91 |
-
BP: bisphosphonate; CCI: Charlson Comorbidity Index; PCP: primary care physician; SD: standard deviation.
Appendix 2—table 20
“Bone-Rx” Cohort (Region=South), Patient Characteristics Pre/Post Match.
| "Bone-Rx" Cohort / Region=South Unmatched | "Bone-Rx" Cohort / Region=South Matched | |||||||||||||
|---|---|---|---|---|---|---|---|---|---|---|---|---|---|---|
| All | BP Non-user | BP User | p-value | All | BP Non-user | BP User | p-value | |||||||
| N | % | N | % | N | % | N | % | N | % | N | % | |||
| All Patients | 178,118 | 100.0% | 17,232 | 9.7% | 160,886 | 90.3% | 34,280 | 100.0% | 17,140 | 50.0% | 17,140 | 50.0% | ||
| Age | ||||||||||||||
| ≤20 | 490 | 0.3% | 16 | 0.1% | 474 | 0.3% | <0.001 | 31 | 0.1% | 16 | 0.1% | 15 | 0.1% | 1.00 |
| 21-40 | 1,313 | 0.7% | 136 | 0.8% | 1,177 | 0.7% | 262 | 0.8% | 134 | 0.8% | 128 | 0.7% | ||
| 41-50 | 3,866 | 2.2% | 445 | 2.6% | 3,421 | 2.1% | 884 | 2.6% | 444 | 2.6% | 440 | 2.6% | ||
| 51-60 | 27,389 | 15.4% | 2,296 | 13.3% | 25,093 | 15.6% | 4,574 | 13.3% | 2,290 | 13.4% | 2,284 | 13.3% | ||
| 61-70 | 61,038 | 34.3% | 5,142 | 29.8% | 55,896 | 34.7% | 10,271 | 30.0% | 5,129 | 29.9% | 5,142 | 30.0% | ||
| 71-80 | 56,126 | 31.5% | 5,521 | 32.0% | 50,605 | 31.5% | 10,990 | 32.1% | 5,493 | 32.0% | 5,497 | 32.1% | ||
| ≥81 | 27,896 | 15.7% | 3,676 | 21.3% | 24,220 | 15.1% | 7,268 | 21.2% | 3,634 | 21.2% | 3,634 | 21.2% | ||
| Gender | ||||||||||||||
| Female | 160,994 | 90.4% | 15,179 | 88.1% | 145,815 | 90.6% | <0.001 | 30,322 | 88.5% | 15,149 | 88.4% | 15,173 | 88.5% | 0.69 |
| Male | 17,124 | 9.6% | 2,053 | 11.9% | 15,071 | 9.4% | 3,958 | 11.5% | 1,991 | 11.6% | 1,967 | 11.5% | ||
| Insurance | ||||||||||||||
| Commercial | 66,332 | 37.2% | 7,042 | 40.9% | 59,290 | 36.9% | <0.001 | 14,052 | 41.0% | 7,007 | 40.9% | 7,045 | 41.1% | 0.95 |
| Dual | 14,829 | 8.3% | 769 | 4.5% | 14,060 | 8.7% | 1,523 | 4.4% | 769 | 4.5% | 754 | 4.4% | ||
| Medicaid | 23,492 | 13.2% | 1,843 | 10.7% | 21,649 | 13.5% | 3,639 | 10.6% | 1,829 | 10.7% | 1,810 | 10.6% | ||
| Medicare | 73,465 | 41.2% | 7,578 | 44.0% | 65,887 | 41.0% | 15,066 | 43.9% | 7,535 | 44.0% | 7,531 | 43.9% | ||
| PCP Visit 2019 | ||||||||||||||
| No | 60,253 | 33.8% | 5,785 | 33.6% | 54,468 | 33.9% | 0.454 | 11,462 | 33.4% | 5,736 | 33.5% | 5,726 | 33.4% | 0.91 |
| Yes | 117,865 | 66.2% | 11,447 | 66.4% | 106,418 | 66.1% | 22,818 | 66.6% | 11,404 | 66.5% | 11,414 | 66.6% | ||
| Continuous Outcomes | ||||||||||||||
| mean | SD | mean | SD | mean | SD | p-value | mean | SD | mean | SD | mean | SD | p-value | |
| CCI | 0.95 | 1.84 | 1.86 | 2.65 | 0.86 | 1.70 | <0.001 | 1.80 | 2.54 | 1.80 | 2.54 | 1.79 | 2.53 | 0.78 |
-
BP: bisphosphonate; CCI: Charlson Comorbidity Index; PCP: primary care physician; SD: standard deviation.
Appendix 2—table 21
“Bone-Rx” Cohort (Region=West), Patient Characteristics Pre/Post Match.
| "Bone-Rx" Cohort / Region=West Unmatched | "Bone-Rx" Cohort / Region=West Matched | |||||||||||||
|---|---|---|---|---|---|---|---|---|---|---|---|---|---|---|
| All | BP Non-user | BP User | p-value | All | BP Non-user | BP User | p-value | |||||||
| N | % | N | % | N | % | N | % | N | % | N | % | |||
| All Patients | 103,519 | 100.0% | 8,049 | 7.8% | 95,470 | 92.2% | 16,010 | 100.0% | 8,005 | 50.0% | 8,005 | 50.0% | ||
| Age | ||||||||||||||
| ≤20 | 155 | 0.1% | ≤10 | 0.1% | 150 | 0.2% | <0.001 | ≤10 | 0.0% | ≤10 | 0.1% | ≤10 | 0.0% | 0.96 |
| 21-40 | 625 | 0.6% | 68 | 0.8% | 557 | 0.6% | 124 | 0.8% | 67 | 0.8% | 57 | 0.7% | ||
| 41-50 | 1,539 | 1.5% | 135 | 1.7% | 1,404 | 1.5% | 264 | 1.6% | 135 | 1.7% | 129 | 1.6% | ||
| 51-60 | 11,159 | 10.8% | 779 | 9.7% | 10,380 | 10.9% | 1,556 | 9.7% | 776 | 9.7% | 780 | 9.7% | ||
| 61-70 | 33,497 | 32.4% | 2,105 | 26.2% | 31,392 | 32.9% | 4,200 | 26.2% | 2,101 | 26.2% | 2,099 | 26.2% | ||
| 71-80 | 35,036 | 33.8% | 2,598 | 32.3% | 32,438 | 34.0% | 5,182 | 32.4% | 2,588 | 32.3% | 2,594 | 32.4% | ||
| ≥81 | 21,508 | 20.8% | 2,359 | 29.3% | 19,149 | 20.1% | 4,676 | 29.2% | 2,333 | 29.1% | 2,343 | 29.3% | ||
| Gender | ||||||||||||||
| Female | 91,615 | 88.5% | 6,942 | 86.2% | 84,673 | 88.7% | <0.001 | 13,850 | 86.5% | 6,922 | 86.5% | 6,928 | 86.5% | 0.89 |
| Male | 11,904 | 11.5% | 1,107 | 13.8% | 10,797 | 11.3% | 2,160 | 13.5% | 1,083 | 13.5% | 1,077 | 13.5% | ||
| Insurance | ||||||||||||||
| Commercial | 25,514 | 24.6% | 2,172 | 27.0% | 23,342 | 24.4% | <0.001 | 4,299 | 26.9% | 2,152 | 26.9% | 2,147 | 26.8% | 1.00 |
| Dual | 6,664 | 6.4% | 528 | 6.6% | 6,136 | 6.4% | 1,044 | 6.5% | 525 | 6.6% | 519 | 6.5% | ||
| Medicaid | 26,870 | 26.0% | 2,376 | 29.5% | 24,494 | 25.7% | 4,723 | 29.5% | 2,361 | 29.5% | 2,362 | 29.5% | ||
| Medicare | 44,471 | 43.0% | 2,973 | 36.9% | 41,498 | 43.5% | 5,944 | 37.1% | 2,967 | 37.1% | 2,977 | 37.2% | ||
| PCP Visit 2019 | ||||||||||||||
| No | 33,113 | 32.0% | 2,289 | 28.4% | 30,824 | 32.3% | <0.001 | 4,546 | 28.4% | 2,277 | 28.4% | 2,269 | 28.3% | 0.89 |
| Yes | 70,406 | 68.0% | 5,760 | 71.6% | 64,646 | 67.7% | 11,464 | 71.6% | 5,728 | 71.6% | 5,736 | 71.7% | ||
| Continuous Outcomes | ||||||||||||||
| mean | SD | mean | SD | mean | SD | p-value | mean | SD | mean | SD | mean | SD | p-value | |
| CCI | 1.17 | 1.94 | 2.17 | 2.67 | 1.08 | 1.84 | <0.001 | 2.12 | 2.59 | 2.12 | 2.59 | 2.12 | 2.59 | 0.93 |
-
BP: bisphosphonate; CCI: Charlson Comorbidity Index; PCP: primary care physician; SD: standard deviation.
Appendix 2—table 22
“Bone-Rx” Cohort (Region=New York State), Patient Characteristics Pre/Post Match.
| "Bone-Rx" Cohort / Region=New York State Unmatched | "Bone-Rx" Cohort / Region=New York State Matched | |||||||||||||
|---|---|---|---|---|---|---|---|---|---|---|---|---|---|---|
| All | BP Non-user | BP User | p-value | All | BP Non-user | BP User | p-value | |||||||
| N | % | N | % | N | % | N | % | N | % | N | % | |||
| All Patients | 57,397 | 100.0% | 7,362 | 12.8% | 50,035 | 87.2% | 14,508 | 100.0% | 7,254 | 50.0% | 7,254 | 50.0% | ||
| Age | ||||||||||||||
| ≤20 | 56 | 0.1% | ≤10 | 0.1% | 50 | 0.1% | <0.001 | 11 | 0.1% | ≤10 | 0.1% | ≤10 | 0.1% | 0.96 |
| 21-40 | 272 | 0.5% | 44 | 0.6% | 228 | 0.5% | 76 | 0.5% | 42 | 0.6% | 34 | 0.5% | ||
| 41-50 | 775 | 1.4% | 120 | 1.6% | 655 | 1.3% | 207 | 1.4% | 107 | 1.5% | 100 | 1.4% | ||
| 51-60 | 7,249 | 12.6% | 885 | 12.0% | 6,364 | 12.7% | 1,744 | 12.0% | 871 | 12.0% | 873 | 12.0% | ||
| 61-70 | 18,433 | 32.1% | 2,297 | 31.2% | 16,136 | 32.2% | 4,540 | 31.3% | 2,264 | 31.2% | 2,276 | 31.4% | ||
| 71-80 | 19,944 | 34.7% | 2,482 | 33.7% | 17,462 | 34.9% | 4,934 | 34.0% | 2,455 | 33.8% | 2,479 | 34.2% | ||
| ≥81 | 10,668 | 18.6% | 1,528 | 20.8% | 9,140 | 18.3% | 2,996 | 20.7% | 1,509 | 20.8% | 1,487 | 20.5% | ||
| Gender | ||||||||||||||
| Female | 52,047 | 90.7% | 6,589 | 89.5% | 45,458 | 90.9% | <.001 | 13,106 | 90.3% | 6,526 | 90.0% | 6,580 | 90.7% | 0.13 |
| Male | 5,350 | 9.3% | 773 | 10.5% | 4,577 | 9.1% | 1,402 | 9.7% | 728 | 10.0% | 674 | 9.3% | ||
| Insurance | ||||||||||||||
| Commercial | 12,309 | 21.4% | 1,894 | 25.7% | 10,415 | 20.8% | <0.001 | 3,706 | 25.5% | 1,850 | 25.5% | 1,856 | 25.6% | 1.00 |
| Dual | 1,750 | 3.0% | 154 | 2.1% | 1,596 | 3.2% | 307 | 2.1% | 153 | 2.1% | 154 | 2.1% | ||
| Medicaid | 10,191 | 17.8% | 1,016 | 13.8% | 9,175 | 18.3% | 1,968 | 13.6% | 987 | 13.6% | 981 | 13.5% | ||
| Medicare | 33,147 | 57.8% | 4,298 | 58.4% | 28,849 | 57.7% | 8,527 | 58.8% | 4,264 | 58.8% | 4,263 | 58.8% | ||
| PCP Visit 2019 | ||||||||||||||
| No | 21,462 | 37.4% | 2,789 | 37.9% | 18,673 | 37.3% | 0.35 | 5,468 | 37.7% | 2,744 | 37.8% | 2,724 | 37.6% | 0.73 |
| Yes | 35,935 | 62.6% | 4,573 | 62.1% | 31,362 | 62.7% | 9,040 | 62.3% | 4,510 | 62.2% | 4,530 | 62.4% | ||
| Continuous Outcomes | ||||||||||||||
| mean | SD | mean | SD | mean | SD | p-value | mean | SD | mean | SD | mean | SD | p-value | |
| CCI | 1.06 | 1.84 | 1.81 | 2.56 | 0.95 | 1.68 | <0.001 | 1.69 | 2.35 | 1.69 | 2.36 | 1.69 | 2.35 | 0.98 |
-
BP: bisphosphonate; CCI: Charlson Comorbidity Index; PCP: primary care physician; SD: standard deviation.
Appendix 2—table 23
“Osteo-Dx-Rx” Cohort, Patient Characteristics Pre/Post Match.
| "Osteo-Dx-Rx" Cohort / All Observations Unmatched | "Osteo-Dx-Rx" Cohort / All Observations Matched | |||||||||||||
|---|---|---|---|---|---|---|---|---|---|---|---|---|---|---|
| All | BP Non-user | BP User | p-value | All | BP Non-user | BP User | p-value | |||||||
| N | % | N | % | N | % | N | % | N | % | N | % | |||
| All Patients | 60,043 | 100.0% | 8,392 | 14.0% | 51,651 | 86.0% | 15,898 | 100.0% | 7,949 | 50.0% | 7,949 | 50.0% | ||
| Age | ||||||||||||||
| 51-60 | 6,443 | 10.7% | 753 | 9.0% | 5,690 | 11.0% | <0.001 | 1,430 | 9.0% | 723 | 9.1% | 707 | 8.9% | 0.95 |
| 61-70 | 20,187 | 33.6% | 2,492 | 29.7% | 17,695 | 34.3% | 4,821 | 30.3% | 2,397 | 30.2% | 2,424 | 30.5% | ||
| 71-80 | 21,545 | 35.9% | 2,964 | 35.3% | 18,581 | 36.0% | 5,677 | 35.7% | 2,841 | 35.7% | 2,836 | 35.7% | ||
| ≥81 | 11,868 | 19.8% | 2,183 | 26.0% | 9,685 | 18.8% | 3,970 | 25.0% | 1,988 | 25.0% | 1,982 | 24.9% | ||
| State | ||||||||||||||
| CA | 24,489 | 40.8% | 2,558 | 30.5% | 21,931 | 42.5% | <0.001 | 4,886 | 30.7% | 2,443 | 30.7% | 2,443 | 30.7% | 1.00 |
| FL | 11,904 | 19.8% | 1,767 | 21.1% | 10,137 | 19.6% | 3,256 | 20.5% | 1,628 | 20.5% | 1,628 | 20.5% | ||
| IL | 4,447 | 7.4% | 678 | 8.1% | 3,769 | 7.3% | 1,168 | 7.3% | 584 | 7.3% | 584 | 7.3% | ||
| NY | 19,203 | 32.0% | 3,389 | 40.4% | 15,814 | 30.6% | 6,588 | 41.4% | 3,294 | 41.4% | 3,294 | 41.4% | ||
| Insurance | ||||||||||||||
| Commercial | 12,990 | 21.6% | 2,048 | 24.4% | 10,942 | 21.2% | <0.001 | 3,736 | 23.5% | 1,868 | 23.5% | 1,868 | 23.5% | 1.00 |
| Dual | 3,652 | 6.1% | 313 | 3.7% | 3,339 | 6.5% | 554 | 3.5% | 277 | 3.5% | 277 | 3.5% | ||
| Medicaid | 13,698 | 22.8% | 1,785 | 21.3% | 11,913 | 23.1% | 3,392 | 21.3% | 1,696 | 21.3% | 1,696 | 21.3% | ||
| Medicare | 29,703 | 49.5% | 4,246 | 50.6% | 25,457 | 49.3% | 8,216 | 51.7% | 4,108 | 51.7% | 4,108 | 51.7% | ||
| PCP Visit 2019 | ||||||||||||||
| No | 14,089 | 23.5% | 2,427 | 28.9% | 11,662 | 22.6% | <0.001 | 4,487 | 28.2% | 2,243 | 28.2% | 2,244 | 28.2% | 0.99 |
| Yes | 45,954 | 76.5% | 5,965 | 71.1% | 39,989 | 77.4% | 11,411 | 71.8% | 5,706 | 71.8% | 5,705 | 71.8% | ||
| Cancer Dx | ||||||||||||||
| No | 52,301 | 87.1% | 6,765 | 80.6% | 45,536 | 88.2% | <0.001 | 13,116 | 82.5% | 6,548 | 82.4% | 6,568 | 82.6% | 0.68 |
| Yes | 7,742 | 12.9% | 1,627 | 19.4% | 6,115 | 11.8% | 2,782 | 17.5% | 1,401 | 17.6% | 1,381 | 17.4% | ||
| COPD Dx | ||||||||||||||
| No | 53,446 | 89.0% | 7,035 | 83.8% | 46,411 | 89.9% | <0.001 | 13,705 | 86.2% | 6,834 | 86.0% | 6,871 | 86.4% | 0.39 |
| Yes | 6,597 | 11.0% | 1,357 | 16.2% | 5,240 | 10.1% | 2,193 | 13.8% | 1,115 | 14.0% | 1,078 | 13.6% | ||
| Heart Failure Dx | ||||||||||||||
| No | 56,005 | 93.3% | 7,492 | 89.3% | 48,513 | 93.9% | <0.001 | 14,475 | 91.0% | 7,218 | 90.8% | 7,257 | 91.3% | 0.28 |
| Yes | 4,038 | 6.7% | 900 | 10.7% | 3,138 | 6.1% | 1,423 | 9.0% | 731 | 9.2% | 692 | 8.7% | ||
| Hypertension Dx | ||||||||||||||
| No | 24,966 | 41.6% | 3,281 | 39.1% | 21,685 | 42.0% | <0.001 | 6,268 | 39.4% | 3,137 | 39.5% | 3,131 | 39.4% | 0.92 |
| Yes | 35,077 | 58.4% | 5,111 | 60.9% | 29,966 | 58.0% | 9,630 | 60.6% | 4,812 | 60.5% | 4,818 | 60.6% | ||
| Dyslipidemia Dx | ||||||||||||||
| No | 24,095 | 40.1% | 3,295 | 39.3% | 20,800 | 40.3% | 0.08 | 6,187 | 38.9% | 3,101 | 39.0% | 3,086 | 38.8% | 0.81 |
| Yes | 35,948 | 59.9% | 5,097 | 60.7% | 30,851 | 59.7% | 9,711 | 61.1% | 4,848 | 61.0% | 4,863 | 61.2% | ||
| Obesity Dx | ||||||||||||||
| No | 53,453 | 89.0% | 7,583 | 90.4% | 45,870 | 88.8% | <0.001 | 14,468 | 91.0% | 7,217 | 90.8% | 7,251 | 91.2% | 0.35 |
| Yes | 6,590 | 11.0% | 809 | 9.6% | 5,781 | 11.2% | 1,430 | 9.0% | 732 | 9.2% | 698 | 8.8% | ||
| Type 2 Diabetes Dx | ||||||||||||||
| No | 44,565 | 74.2% | 6,132 | 73.1% | 38,433 | 74.4% | 0.009 | 11,759 | 74.0% | 5,859 | 73.7% | 5,900 | 74.2% | 0.46 |
| Yes | 15,478 | 25.8% | 2,260 | 26.9% | 13,218 | 25.6% | 4,139 | 26.0% | 2,090 | 26.3% | 2,049 | 25.8% | ||
| Depression Dx | ||||||||||||||
| No | 51,609 | 86.0% | 7,114 | 84.8% | 44,495 | 86.1% | 0.001 | 13,697 | 86.2% | 6,844 | 86.1% | 6,853 | 86.2% | 0.84 |
| Yes | 8,434 | 14.0% | 1,278 | 15.2% | 7,156 | 13.9% | 2,201 | 13.8% | 1,105 | 13.9% | 1,096 | 13.8% | ||
-
BP: bisphosphonate; CCI: Charlson Comorbidity Index; CA: California; Dx: diagnosis; FL: Florida; IL: Illinois; NY: New York; PCP: primary care physician.
Appendix 2—table 24
Statin Cohort (All Regions), Patient Characteristics Pre/Post Match.
| All Observations by Statin Use: Unmatched | All Observations by Statin Use: Matched | |||||||||||||
|---|---|---|---|---|---|---|---|---|---|---|---|---|---|---|
| All | Statin Non-users | Statin Users | p-value | All | Statin Non-users | Statin Users | p-value | |||||||
| N | % | N | % | N | % | N | % | N | % | N | % | |||
| All Patients | 7,906,603 | 100.00% | 6,403,208 | 81.00% | 1,503,395 | 19.00% | 2,872,600 | 100.00% | 1,436,300 | 50.00% | 1,436,300 | 50.00% | ||
| Age | ||||||||||||||
| ≤20 | 1,840,050 | 23.30% | 1,838,665 | 28.70% | 1,385 | 0.10% | <0.001 | 2,772 | 0.10% | 1,387 | 0.10% | 1,385 | 0.10% | 0.11 |
| 21-40 | 1,446,999 | 18.30% | 1,402,606 | 21.90% | 44,393 | 3.00% | 88,760 | 3.10% | 44,371 | 3.10% | 44,389 | 3.10% | ||
| 41-50 | 925,309 | 11.70% | 789,385 | 12.30% | 135,924 | 9.00% | 271,615 | 9.50% | 135,748 | 9.50% | 135,867 | 9.50% | ||
| 51-60 | 1,250,190 | 15.80% | 888,510 | 13.90% | 361,680 | 24.10% | 710,481 | 24.70% | 354,449 | 24.70% | 356,032 | 24.80% | ||
| 61-70 | 1,181,261 | 14.90% | 728,702 | 11.40% | 452,559 | 30.10% | 857,269 | 29.80% | 428,326 | 29.80% | 428,943 | 29.90% | ||
| 71-80 | 783,775 | 9.90% | 452,267 | 7.10% | 331,508 | 22.10% | 605,360 | 21.10% | 303,279 | 21.10% | 302,081 | 21.00% | ||
| ≥81 | 479,019 | 6.10% | 303,073 | 4.70% | 175,946 | 11.70% | 336,343 | 11.70% | 168,740 | 11.70% | 167,603 | 11.70% | ||
| Gender | ||||||||||||||
| Female | 4,670,960 | 59.10% | 3,785,061 | 59.10% | 885,899 | 58.90% | <0.001 | 1,682,354 | 58.60% | 839,207 | 58.40% | 843,147 | 58.70% | <0.001 |
| Male | 3,235,643 | 40.90% | 2,618,147 | 40.90% | 617,496 | 41.10% | 1,190,246 | 41.40% | 597,093 | 41.60% | 593,153 | 41.30% | ||
| Region | ||||||||||||||
| Midwest | 1,467,802 | 18.60% | 1,188,569 | 18.60% | 279,233 | 18.60% | <0.001 | 542,638 | 18.90% | 271,319 | 18.90% | 271,319 | 18.90% | 1 |
| Northeast | 2,152,560 | 27.20% | 1,706,021 | 26.60% | 446,539 | 29.70% | 847,868 | 29.50% | 423,934 | 29.50% | 423,934 | 29.50% | ||
| South | 3,042,604 | 38.50% | 2,490,630 | 38.90% | 551,974 | 36.70% | 1,046,224 | 36.40% | 523,112 | 36.40% | 523,112 | 36.40% | ||
| West | 1,243,637 | 15.70% | 1,017,988 | 15.90% | 225,649 | 15.00% | 435,870 | 15.20% | 217,935 | 15.20% | 217,935 | 15.20% | ||
| Insurance | ||||||||||||||
| Commercial | 3,938,603 | 49.80% | 3,350,332 | 52.30% | 588,271 | 39.10% | <0.001 | 1,175,472 | 40.90% | 587,847 | 40.90% | 587,625 | 40.90% | 0.34 |
| Dual | 156,497 | 2.00% | 73,532 | 1.10% | 82,965 | 5.50% | 110,207 | 3.80% | 54,851 | 3.80% | 55,356 | 3.90% | ||
| Medicaid | 2,594,500 | 32.80% | 2,254,531 | 35.20% | 339,969 | 22.60% | 641,345 | 22.30% | 320,434 | 22.30% | 320,911 | 22.30% | ||
| Medicare | 1,217,003 | 15.40% | 724,813 | 11.30% | 492,190 | 32.70% | 945,576 | 32.90% | 473,168 | 32.90% | 472,408 | 32.90% | ||
| PCP Visit 2019 | ||||||||||||||
| No | 4,283,697 | 54.20% | 3,773,784 | 58.90% | 509,913 | 33.90% | <0.001 | 1,016,313 | 35.40% | 508,587 | 35.40% | 507,726 | 35.30% | 0.29 |
| Yes | 3,622,906 | 45.80% | 2,629,424 | 41.10% | 993,482 | 66.10% | 1,856,287 | 64.60% | 927,713 | 64.60% | 928,574 | 64.70% | ||
| Continuous Outcomes | ||||||||||||||
| mean | SD | mean | SD | mean | SD | p-value | mean | SD | mean | SD | mean | SD | p-value | |
| CCI | 0.62 | 1.38 | 0.49 | 1.23 | 1.15 | 1.79 | <0.001 | 1.11 | 1.77 | 1.12 | 1.79 | 1.11 | 1.75 | <0.001 |
-
CCI: Charlson Comorbidity Index; PCP: primary care physician; SD: standard deviation.
Appendix 2—table 25
Statin Cohort (Region=New York State), Patient Characteristics Pre/Post Match.
| Region=NY by Statin Use: Unmatched | Region=NY by Statin Use: Matched | |||||||||||||
|---|---|---|---|---|---|---|---|---|---|---|---|---|---|---|
| All | Statin Non-users | Statin Users | p-value | All | Statin Non-users | Statin Users | p-value | |||||||
| N | % | N | % | N | % | N | % | N | % | N | % | |||
| All Patients | 968,296 | 100.0% | 761,995 | 78.7% | 206,301 | 21.3% | 371,072 | 100.0% | 185,536 | 50.0% | 185,536 | 50.0% | ||
| Age | ||||||||||||||
| ≤20 | 133,178 | 13.8% | 133,111 | 17.5% | 67 | 0.0% | <0.001 | 134 | 0.0% | 67 | 0.0% | 67 | 0.0% | 1.00 |
| 21-40 | 192,959 | 19.9% | 188,446 | 24.7% | 4,513 | 2.2% | 9,019 | 2.4% | 4,508 | 2.4% | 4,511 | 2.4% | ||
| 41-50 | 127,794 | 13.2% | 112,342 | 14.7% | 15,452 | 7.5% | 30,860 | 8.3% | 15,420 | 8.3% | 15,440 | 8.3% | ||
| 51-60 | 172,444 | 17.8% | 128,472 | 16.9% | 43,972 | 21.3% | 86,136 | 23.2% | 43,068 | 23.2% | 43,068 | 23.2% | ||
| 61-70 | 159,912 | 16.5% | 100,884 | 13.2% | 59,028 | 28.6% | 106,460 | 28.7% | 53,233 | 28.7% | 53,227 | 28.7% | ||
| 71-80 | 120,117 | 12.4% | 64,549 | 8.5% | 55,568 | 26.9% | 91,337 | 24.6% | 45,675 | 24.6% | 45,662 | 24.6% | ||
| ≥81 | 61,892 | 6.4% | 34,191 | 4.5% | 27,701 | 13.4% | 47,126 | 12.7% | 23,565 | 12.7% | 23,561 | 12.7% | ||
| Gender | ||||||||||||||
| Female | 573,610 | 59.2% | 454,050 | 59.6% | 119,560 | 58.0% | <0.001 | 215,375 | 58.0% | 107,420 | 57.9% | 107,955 | 58.2% | 0.08 |
| Male | 394,686 | 40.8% | 307,945 | 40.4% | 86,741 | 42.0% | 155,697 | 42.0% | 78,116 | 42.1% | 77,581 | 41.8% | ||
| Insurance | ||||||||||||||
| Commercial | 500,918 | 51.7% | 442,990 | 58.1% | 57,928 | 28.1% | <0.001 | 116,123 | 31.3% | 58,206 | 31.4% | 57,917 | 31.2% | 0.57 |
| Dual | 6,814 | 0.7% | 2,410 | 0.3% | 4,404 | 2.1% | 4,447 | 1.2% | 2,190 | 1.2% | 2,257 | 1.2% | ||
| Medicaid | 252,366 | 26.1% | 206,109 | 27.0% | 46,257 | 22.4% | 83,550 | 22.5% | 41,703 | 22.5% | 41,847 | 22.6% | ||
| Medicare | 208,198 | 21.5% | 110,486 | 14.5% | 97,712 | 47.4% | 166,952 | 45.0% | 83,437 | 45.0% | 83,515 | 45.0% | ||
| PCP Visit 2019 | ||||||||||||||
| No | 521,282 | 53.8% | 446,929 | 58.7% | 74,353 | 36.0% | <0.001 | 146,967 | 39.6% | 73,675 | 39.7% | 73,292 | 39.5% | 0.20 |
| Yes | 447,014 | 46.2% | 315,066 | 41.3% | 131,948 | 64.0% | 224,105 | 60.4% | 111,861 | 60.3% | 112,244 | 60.5% | ||
| Continuous Outcomes | ||||||||||||||
| mean | SD | mean | SD | mean | SD | p-value | mean | SD | mean | SD | mean | SD | p-value | |
| CCI | 0.65 | 1.39 | 0.51 | 1.24 | 1.17 | 1.77 | <0.001 | 1.07 | 1.73 | 1.08 | 1.76 | 1.06 | 1.70 | <0.001 |
-
CCI: Charlson Comorbidity Index; PCP: primary care physician; SD: standard deviation.
Appendix 2—table 26
Statin User Cohort (All Regions) by BP Use, Patient Characteristics Pre/Post Match of BP Users/Non-users.
| All Statin Users by BP: Unmatched | All Statin Users by BP: Matched | |||||||||||||
|---|---|---|---|---|---|---|---|---|---|---|---|---|---|---|
| All | BP Non-user | BP User | p-value | All | BP Non-user | BP User | p-value | |||||||
| N | % | N | % | N | % | N | % | N | % | N | % | |||
| All Patients | 1,436,300 | 100.0% | 1,218,319 | 84.8% | 217,981 | 15.2% | 426,960 | 100.0% | 213,480 | 50.0% | 213,480 | 50.0% | ||
| Age | ||||||||||||||
| ≤20 | 1,385 | 0.1% | 1,365 | 0.1% | 20 | 0.0% | <0.001 | 42 | 0.0% | 22 | 0.0% | 20 | 0.0% | 1.00 |
| 21-40 | 44,389 | 3.1% | 44,042 | 3.6% | 347 | 0.2% | 704 | 0.2% | 357 | 0.2% | 347 | 0.2% | ||
| 41-50 | 135,867 | 9.5% | 133,850 | 11.0% | 2,017 | 0.9% | 4,033 | 0.9% | 2,016 | 0.9% | 2,017 | 0.9% | ||
| 51-60 | 356,032 | 24.8% | 333,325 | 27.4% | 22,707 | 10.4% | 45,439 | 10.6% | 22,732 | 10.6% | 22,707 | 10.6% | ||
| 61-70 | 428,943 | 29.9% | 356,208 | 29.2% | 72,735 | 33.4% | 144,861 | 33.9% | 72,341 | 33.9% | 72,520 | 34.0% | ||
| 71-80 | 302,081 | 21.0% | 223,651 | 18.4% | 78,430 | 36.0% | 150,527 | 35.3% | 75,316 | 35.3% | 75,211 | 35.2% | ||
| ≥81 | 167,603 | 11.7% | 125,878 | 10.3% | 41,725 | 19.1% | 81,354 | 19.1% | 40,696 | 19.1% | 40,658 | 19.0% | ||
| Gender | ||||||||||||||
| Female | 843,147 | 58.7% | 646,846 | 53.1% | 196,301 | 90.1% | <0.001 | 383,586 | 89.8% | 191,786 | 89.8% | 191,800 | 89.8% | 0.94 |
| Male | 593,153 | 41.3% | 571,473 | 46.9% | 21,680 | 9.9% | 43,374 | 10.2% | 21,694 | 10.2% | 21,680 | 10.2% | ||
| Region | ||||||||||||||
| Midwest | 271,319 | 18.9% | 237,718 | 19.5% | 33,601 | 15.4% | <0.001 | 67,050 | 15.7% | 33,525 | 15.7% | 33,525 | 15.7% | 1.00 |
| Northeast | 423,934 | 29.5% | 366,936 | 30.1% | 56,998 | 26.1% | 113,308 | 26.5% | 56,654 | 26.5% | 56,654 | 26.5% | ||
| South | 523,112 | 36.4% | 442,996 | 36.4% | 80,116 | 36.8% | 157,838 | 37.0% | 78,919 | 37.0% | 78,919 | 37.0% | ||
| West | 217,935 | 15.2% | 170,669 | 14.0% | 47,266 | 21.7% | 88,764 | 20.8% | 44,382 | 20.8% | 44,382 | 20.8% | ||
| Insurance | ||||||||||||||
| Commercial | 587,625 | 40.9% | 533,843 | 43.8% | 53,782 | 24.7% | <0.001 | 107,552 | 25.2% | 53,774 | 25.2% | 53,778 | 25.2% | 1.00 |
| Dual | 55,356 | 3.9% | 42,041 | 3.5% | 13,315 | 6.1% | 24,380 | 5.7% | 12,183 | 5.7% | 12,197 | 5.7% | ||
| Medicaid | 320,911 | 22.3% | 280,799 | 23.0% | 40,112 | 18.4% | 76,121 | 17.8% | 38,050 | 17.8% | 38,071 | 17.8% | ||
| Medicare | 472,408 | 32.9% | 361,636 | 29.7% | 110,772 | 50.8% | 218,907 | 51.3% | 109,473 | 51.3% | 109,434 | 51.3% | ||
| PCP Visit 2019 | ||||||||||||||
| No | 507,726 | 35.3% | 430,446 | 35.3% | 77,280 | 35.5% | 0.27 | 151,395 | 35.5% | 75,614 | 35.4% | 75,781 | 35.5% | 0.59 |
| Yes | 928,574 | 64.7% | 787,873 | 64.7% | 140,701 | 64.5% | 275,565 | 64.5% | 137,866 | 64.6% | 137,699 | 64.5% | ||
| Continuous Outcomes | ||||||||||||||
| mean | SD | mean | SD | mean | SD | p-value | mean | SD | mean | SD | mean | SD | p-value | |
| CCI | 1.11 | 1.75 | 1.13 | 1.77 | 0.95 | 1.66 | <0.001 | 0.97 | 1.66 | 0.97 | 1.66 | 0.97 | 1.67 | 0.79 |
-
BP: bisphosphonate; CCI: Charlson Comorbidity Index; PCP: primary care physician; SD: standard deviation.
Appendix 2—table 27
Statin User Cohort (Region=New York State) by BP Use, Patient Characteristics Pre/Post Match of BP Users/Non-users.
| Region=NY Statin Users by BP: Unmatched | Region=NY Statin Users by BP: Matched | |||||||||||||
|---|---|---|---|---|---|---|---|---|---|---|---|---|---|---|
| All | BP Non-user | BP User | p-value | All | BP Non-user | BP User | p-value | |||||||
| N | % | N | % | N | % | N | % | N | % | N | % | |||
| All Patients | 185,536 | 100.0% | 161,673 | 87.1% | 23,863 | 12.9% | 47,472 | 100.0% | 23,736 | 50.0% | 23,736 | 50.0% | ||
| Age | ||||||||||||||
| ≤20 | 67 | 0.0% | 67 | 0.0% | 0 | 0.0% | <0.001 | 52 | 0.1% | 26 | 0.1% | 26 | 0.1% | 1.00 |
| 21-40 | 4,511 | 2.4% | 4,485 | 2.8% | 26 | 0.1% | 304 | 0.6% | 152 | 0.6% | 152 | 0.6% | ||
| 41-50 | 15,440 | 8.3% | 15,288 | 9.5% | 152 | 0.6% | 4,381 | 9.2% | 2,192 | 9.2% | 2,189 | 9.2% | ||
| 51-60 | 43,068 | 23.2% | 40,879 | 25.3% | 2,189 | 9.2% | 14,717 | 31.0% | 7,358 | 31.0% | 7,359 | 31.0% | ||
| 61-70 | 53,227 | 28.7% | 45,861 | 28.4% | 7,366 | 30.9% | 18,189 | 38.3% | 9,092 | 38.3% | 9,097 | 38.3% | ||
| 71-80 | 45,662 | 24.6% | 36,474 | 22.6% | 9,188 | 38.5% | 9,829 | 20.7% | 4,916 | 20.7% | 4,913 | 20.7% | ||
| ≥81 | 23,561 | 12.7% | 18,619 | 11.5% | 4,942 | 20.7% | 0 | 0.0% | 0.0% | 0.0% | ||||
| Gender | ||||||||||||||
| Female | 107,955 | 58.2% | 86,194 | 53.3% | 21,761 | 91.2% | <0.001 | 43,265 | 91.1% | 21,631 | 91.1% | 21,634 | 91.1% | 0.96 |
| Male | 77,581 | 41.8% | 75,479 | 46.7% | 2,102 | 8.8% | 4,207 | 8.9% | 2,105 | 8.9% | 2,102 | 8.9% | ||
| Insurance | ||||||||||||||
| Commercial | 57,917 | 31.2% | 54,411 | 33.7% | 3,506 | 14.7% | <0.001 | 7,008 | 14.8% | 3,502 | 14.8% | 3,506 | 14.8% | 1.00 |
| Dual | 2,257 | 1.2% | 1,664 | 1.0% | 593 | 2.5% | 1,128 | 2.4% | 564 | 2.4% | 564 | 2.4% | ||
| Medicaid | 41,847 | 22.6% | 37,926 | 23.5% | 3,921 | 16.4% | 7,644 | 16.1% | 3,821 | 16.1% | 3,823 | 16.1% | ||
| Medicare | 83,515 | 45.0% | 67,672 | 41.9% | 15,843 | 66.4% | 31,692 | 66.8% | 15,849 | 66.8% | 15,843 | 66.7% | ||
| PCP Visit 2019 | ||||||||||||||
| No | 73,292 | 39.5% | 63,797 | 39.5% | 9,495 | 39.8% | 0.33 | 18,870 | 39.7% | 9,434 | 39.7% | 9,436 | 39.8% | 0.99 |
| Yes | 112,244 | 60.5% | 97,876 | 60.5% | 14,368 | 60.2% | 28,602 | 60.3% | 14,302 | 60.3% | 14,300 | 60.2% | ||
| Continuous Outcomes | ||||||||||||||
| mean | SD | mean | SD | mean | SD | p-value | mean | SD | mean | SD | mean | SD | p-value | |
| CCI | 1.06 | 1.70 | 1.08 | 1.71 | 0.92 | 1.59 | <0.001 | 0.92 | 1.58 | 0.92 | 1.57 | 0.93 | 1.59 | 0.64 |
-
BP: bisphosphonate; CCI: Charlson Comorbidity Index; PCP: primary care physician; SD: standard deviation.
Appendix 2—table 28
Statin Non-user Cohort (All Regions) by BP Use, Patient Characteristics Pre/Post Match of BP Users/Non-users.
| All Statin Non-users by BP Use: Unmatched | All Statin Non-users by BP: Matched | |||||||||||||
|---|---|---|---|---|---|---|---|---|---|---|---|---|---|---|
| All | BP Non-users | BP Users | p-value | All | BP Non-users | BP Users | p-value | |||||||
| N | % | N | % | N | % | N | % | N | % | N | % | |||
| All Patients | 1,436,300 | 100.0% | 1,311,457 | 91.3% | 124,843 | 8.7% | 249,432 | 100.0% | 124,716 | 50.0% | 124,716 | 50.0% | ||
| Age | ||||||||||||||
| ≤20 | 1,387 | 0.1% | 1,383 | 0.1% | 4 | 0.0% | <0.001 | 6 | 0.0% | 2 | 0.0% | 4 | 0.0% | 0.99 |
| 21-40 | 44,371 | 3.1% | 44,170 | 3.4% | 201 | 0.2% | 413 | 0.2% | 212 | 0.2% | 201 | 0.2% | ||
| 41-50 | 135,748 | 9.5% | 134,305 | 10.2% | 1,443 | 1.2% | 2,880 | 1.2% | 1,437 | 1.2% | 1,443 | 1.2% | ||
| 51-60 | 354,449 | 24.7% | 336,779 | 25.7% | 17,670 | 14.2% | 35,335 | 14.2% | 17,665 | 14.2% | 17,670 | 14.2% | ||
| 61-70 | 428,326 | 29.8% | 381,936 | 29.1% | 46,390 | 37.2% | 92,791 | 37.2% | 46,401 | 37.2% | 46,390 | 37.2% | ||
| 71-80 | 303,279 | 21.1% | 264,157 | 20.1% | 39,122 | 31.3% | 78,077 | 31.3% | 39,037 | 31.3% | 39,040 | 31.3% | ||
| ≥81 | 168,740 | 11.7% | 148,727 | 11.3% | 20,013 | 16.0% | 39,930 | 16.0% | 19,962 | 16.0% | 19,968 | 16.0% | ||
| Gender | ||||||||||||||
| Female | 839,207 | 58.4% | 727,324 | 55.5% | 111,883 | 89.6% | <0.001 | 223,501 | 89.6% | 111,745 | 89.6% | 111,756 | 89.6% | 0.94 |
| Male | 597,093 | 41.6% | 584,133 | 44.5% | 12,960 | 10.4% | 25,931 | 10.4% | 12,971 | 10.4% | 12,960 | 10.4% | ||
| Region | ||||||||||||||
| Midwest | 271,319 | 18.9% | 249,383 | 19.0% | 21,936 | 17.6% | <0.001 | 43,870 | 17.6% | 21,935 | 17.6% | 21,935 | 17.6% | 1.00 |
| Northeast | 423,934 | 29.5% | 390,134 | 29.7% | 33,800 | 27.1% | 67,594 | 27.1% | 33,797 | 27.1% | 33,797 | 27.1% | ||
| South | 523,112 | 36.4% | 480,680 | 36.7% | 42,432 | 34.0% | 84,618 | 33.9% | 42,309 | 33.9% | 42,309 | 33.9% | ||
| West | 217,935 | 15.2% | 191,260 | 14.6% | 26,675 | 21.4% | 53,350 | 21.4% | 26,675 | 21.4% | 26,675 | 21.4% | ||
| Insurance | ||||||||||||||
| Commercial | 587,847 | 40.9% | 552,487 | 42.1% | 35,360 | 28.3% | <0.001 | 70,725 | 28.4% | 35,365 | 28.4% | 35,360 | 28.4% | 1.00 |
| Dual | 54,851 | 3.8% | 46,371 | 3.5% | 8,480 | 6.8% | 16,696 | 6.7% | 8,342 | 6.7% | 8,354 | 6.7% | ||
| Medicaid | 320,434 | 22.3% | 296,591 | 22.6% | 23,843 | 19.1% | 47,674 | 19.1% | 23,832 | 19.1% | 23,842 | 19.1% | ||
| Medicare | 473,168 | 32.9% | 416,008 | 31.7% | 57,160 | 45.8% | 114,337 | 45.8% | 57,177 | 45.8% | 57,160 | 45.8% | ||
| PCP Visit 2019 | ||||||||||||||
| No | 508,587 | 35.4% | 473,241 | 36.1% | 35,346 | 28.3% | <0.001 | 70,689 | 28.3% | 35,343 | 28.3% | 35,346 | 28.3% | 0.99 |
| Yes | 927,713 | 64.6% | 838,216 | 63.9% | 89,497 | 71.7% | 178,743 | 71.7% | 89,373 | 71.7% | 89,370 | 71.7% | ||
| Continuous Outcomes | ||||||||||||||
| mean | SD | mean | SD | mean | SD | p-value | mean | SD | mean | SD | mean | SD | p-value | |
| CCI | 1.12 | 1.79 | 1.13 | 1.79 | 1.02 | 1.86 | <0.001 | 1.02 | 1.85 | 1.02 | 1.84 | 1.02 | 1.86 | 0.49 |
-
BP: bisphosphonate; CCI: Charlson Comorbidity Index; PCP: primary care physician; SD: standard deviation.
Appendix 2—table 29
Statin Non-user Cohort (Region=New York State) by BP Use, Patient Characteristics Pre/Post Match of BP Users/Non-users.
| Region=NY Statin Non-users by BP: Unmatched | Region=NY Statin Non-users by BP: Matched | |||||||||||||
|---|---|---|---|---|---|---|---|---|---|---|---|---|---|---|
| All | BP Non-users | BP Users | p-value | All | BP Non-users | BP Users | p-value | |||||||
| N | % | N | % | N | % | N | % | N | % | N | % | |||
| All Patients | 185,536 | 100.0% | 170,990 | 92.2% | 14,546 | 7.8% | 29,042 | 100.0% | 14,521 | 50.0% | 14,521 | 50.0% | ||
| Age | ||||||||||||||
| ≤20 | 67 | 0.0% | 67 | 0.0% | 0 | 0.0% | <0.001 | 0 | 0.0% | 0 | 0.0% | 0 | 0.0% | 1.00 |
| 21-40 | 4,508 | 2.4% | 4,498 | 2.6% | 10 | 0.1% | 23 | 0.1% | 13 | 0.1% | 10 | 0.1% | ||
| 41-50 | 15,420 | 8.3% | 15,314 | 9.0% | 106 | 0.7% | 211 | 0.7% | 105 | 0.7% | 106 | 0.7% | ||
| 51-60 | 43,068 | 23.2% | 41,317 | 24.2% | 1,751 | 12.0% | 3,502 | 12.1% | 1,751 | 12.1% | 1,751 | 12.1% | ||
| 61-70 | 53,233 | 28.7% | 48,148 | 28.2% | 5,085 | 35.0% | 10,174 | 35.0% | 5,089 | 35.0% | 5,085 | 35.0% | ||
| 71-80 | 45,675 | 24.6% | 40,731 | 23.8% | 4,944 | 34.0% | 9,877 | 34.0% | 4,937 | 34.0% | 4,940 | 34.0% | ||
| ≥81 | 23,565 | 12.7% | 20,915 | 12.2% | 2,650 | 18.2% | 5,255 | 18.1% | 2,626 | 18.1% | 2,629 | 18.1% | ||
| Gender | ||||||||||||||
| Female | 107,420 | 57.9% | 94,242 | 55.1% | 13,178 | 90.6% | <0.001 | 26,304 | 90.6% | 13,151 | 90.6% | 13,153 | 90.6% | 0.97 |
| Male | 78,116 | 42.1% | 76,748 | 44.9% | 1,368 | 9.4% | 2,738 | 9.4% | 1,370 | 9.4% | 1,368 | 9.4% | ||
| Insurance | ||||||||||||||
| Commercial | 58,206 | 31.4% | 56,313 | 32.9% | 1,893 | 13.0% | <0.001 | 3,785 | 13.0% | 1,892 | 13.0% | 1,893 | 13.0% | 0.96 |
| Dual | 2,190 | 1.2% | 1,754 | 1.0% | 436 | 3.0% | 883 | 3.0% | 449 | 3.1% | 434 | 3.0% | ||
| Medicaid | 41,703 | 22.5% | 38,177 | 22.3% | 3,526 | 24.2% | 6,994 | 24.1% | 3,491 | 24.0% | 3,503 | 24.1% | ||
| Medicare | 83,437 | 45.0% | 74,746 | 43.7% | 8,691 | 59.7% | 17,380 | 59.8% | 8,689 | 59.8% | 8,691 | 59.9% | ||
| PCP Visit 2019 | ||||||||||||||
| No | 73,675 | 39.7% | 69,382 | 40.6% | 4,293 | 29.5% | <0.001 | 8,564 | 29.5% | 4,280 | 29.5% | 4,284 | 29.5% | 0.96 |
| Yes | 111,861 | 60.3% | 101,608 | 59.4% | 10,253 | 70.5% | 20,478 | 70.5% | 10,241 | 70.5% | 10,237 | 70.5% | ||
| Continuous Outcomes | ||||||||||||||
| mean | SD | mean | SD | mean | SD | p-value | mean | SD | mean | SD | mean | SD | p-value | |
| CCI | 1.08 | 1.76 | 1.09 | 1.76 | 0.95 | 1.75 | <0.001 | 0.95 | 1.74 | 0.95 | 1.73 | 0.95 | 1.75 | 0.82 |
-
BP: bisphosphonate; CCI: Charlson Comorbidity Index; PCP: primary care physician; SD: standard deviation.
Appendix 2—table 30
Antihypertensive Cohort (All Regions), Patient Characteristics Pre/Post Match.
| All Observations by Antihypertensive Use: Unmatched | All Observations by Antihypertensive Use: Matched | |||||||||||||
|---|---|---|---|---|---|---|---|---|---|---|---|---|---|---|
| All | HTN Non-users | HTN Users | p-value | All | HTN Non-users | HTN Users | p-value | |||||||
| N | % | N | % | N | % | N | % | N | % | N | % | |||
| All Patients | 7,906,603 | 100.0% | 5,805,483 | 73.4% | 2,101,120 | 26.6% | 3,572,002 | 100.0% | 1,786,001 | 50.0% | 1,786,001 | 50.0% | ||
| Age | ||||||||||||||
| ≤20 | 1,840,050 | 23.3% | 1,823,229 | 31.4% | 16,821 | 0.8% | <0.001 | 33,574 | 0.9% | 16,785 | 0.9% | 16,789 | 0.9% | 0.44 |
| 21-40 | 1,446,999 | 18.3% | 1,299,520 | 22.4% | 147,479 | 7.0% | 293,445 | 8.2% | 146,712 | 8.2% | 146,733 | 8.2% | ||
| 41-50 | 925,309 | 11.7% | 685,931 | 11.8% | 239,378 | 11.4% | 463,130 | 13.0% | 231,312 | 13.0% | 231,818 | 13.0% | ||
| 51-60 | 1,250,190 | 15.8% | 759,987 | 13.1% | 490,203 | 23.3% | 870,549 | 24.4% | 434,995 | 24.4% | 435,554 | 24.4% | ||
| 61-70 | 1,181,261 | 14.9% | 626,235 | 10.8% | 555,026 | 26.4% | 918,823 | 25.7% | 459,192 | 25.7% | 459,631 | 25.7% | ||
| 71-80 | 783,775 | 9.9% | 381,957 | 6.6% | 401,818 | 19.1% | 619,578 | 17.3% | 309,898 | 17.4% | 309,680 | 17.3% | ||
| ≥81 | 479,019 | 6.1% | 228,624 | 3.9% | 250,395 | 11.9% | 372,903 | 10.4% | 187,107 | 10.5% | 185,796 | 10.4% | ||
| Gender | ||||||||||||||
| Female | 4,670,960 | 59.1% | 3,402,357 | 58.6% | 1,268,603 | 60.4% | <0.001 | 2,159,365 | 60.5% | 1,079,468 | 60.4% | 1,079,897 | 60.5% | 0.64 |
| Male | 3,235,643 | 40.9% | 2,403,126 | 41.4% | 832,517 | 39.6% | 1,412,637 | 39.5% | 706,533 | 39.6% | 706,104 | 39.5% | ||
| Region | ||||||||||||||
| Midwest | 1,467,802 | 18.6% | 1,065,772 | 18.4% | 402,030 | 19.1% | <0.001 | 694,206 | 19.4% | 347,103 | 19.4% | 347,103 | 19.4% | 1.00 |
| Northeast | 2,152,560 | 27.2% | 1,568,239 | 27.0% | 584,321 | 27.8% | 997,132 | 27.9% | 498,566 | 27.9% | 498,566 | 27.9% | ||
| South | 3,042,604 | 38.5% | 2,240,163 | 38.6% | 802,441 | 38.2% | 1,338,570 | 37.5% | 669,285 | 37.5% | 669,285 | 37.5% | ||
| West | 1,243,637 | 15.7% | 931,309 | 16.0% | 312,328 | 14.9% | 542,094 | 15.2% | 271,047 | 15.2% | 271,047 | 15.2% | ||
| Insurance | ||||||||||||||
| Commercial | 3,938,603 | 49.8% | 3,060,354 | 52.7% | 878,249 | 41.8% | <0.001 | 1,695,516 | 47.5% | 848,106 | 47.5% | 847,410 | 47.4% | 0.80 |
| Dual | 156,497 | 2.0% | 55,827 | 1.0% | 100,670 | 4.8% | 93,467 | 2.6% | 46,774 | 2.6% | 46,693 | 2.6% | ||
| Medicaid | 2,594,500 | 32.8% | 2,091,349 | 36.0% | 503,151 | 23.9% | 812,737 | 22.8% | 406,012 | 22.7% | 406,725 | 22.8% | ||
| Medicare | 1,217,003 | 15.4% | 597,953 | 10.3% | 619,050 | 29.5% | 970,282 | 27.2% | 485,109 | 27.2% | 485,173 | 27.2% | ||
| PCP Visit 2019 | ||||||||||||||
| No | 4,283,697 | 54.2% | 3,531,914 | 60.8% | 751,783 | 35.8% | <0.001 | 1,438,005 | 40.3% | 719,756 | 40.3% | 718,249 | 40.2% | 0.10 |
| Yes | 3,622,906 | 45.8% | 2,273,569 | 39.2% | 1,349,337 | 64.2% | 2,133,997 | 59.7% | 1,066,245 | 59.7% | 1,067,752 | 59.8% | ||
| Continuous Outcomes | ||||||||||||||
| mean | SD | mean | SD | mean | SD | p-value | mean | SD | mean | SD | mean | SD | p-value | |
| CCI | 0.62 | 1.38 | 0.43 | 1.14 | 1.13 | 1.80 | <0.001 | 0.95 | 1.65 | 0.96 | 1.66 | 0.95 | 1.64 | <0.05 |
-
CCI: Charlson Comorbidity Index; HTN: antihypertensive; PCP: primary care physician; SD: standard deviation.
Appendix 2—table 31
Antihypertensive Cohort (Region=New York State), Patient Characteristics Pre/Post Match.
| Region=NY by Antihypertensive Use: Unmatched | Region=NY by Antihypertensive Use: Matched | |||||||||||||
|---|---|---|---|---|---|---|---|---|---|---|---|---|---|---|
| All | HTN Non-users | HTN Users | p-value | All | HTN Non-users | HTN Users | p-value | |||||||
| N | % | N | % | N | % | N | % | N | % | N | % | |||
| All Patients | 968,296 | 100.0% | 709,644 | 73.3% | 258,652 | 26.7% | 407,248 | 100.0% | 203,624 | 50.0% | 203,624 | 50.0% | ||
| Age | ||||||||||||||
| ≤20 | 133,178 | 13.8% | 132,352 | 18.7% | 826 | 0.3% | <0.001 | 1,622 | 0.4% | 811 | 0.4% | 811 | 0.4% | 1.00 |
| 21-40 | 192,959 | 19.9% | 181,447 | 25.6% | 11,512 | 4.5% | 22,930 | 5.6% | 11,465 | 5.6% | 11,465 | 5.6% | ||
| 41-50 | 127,794 | 13.2% | 105,490 | 14.9% | 22,304 | 8.6% | 43,846 | 10.8% | 21,923 | 10.8% | 21,923 | 10.8% | ||
| 51-60 | 172,444 | 17.8% | 119,643 | 16.9% | 52,801 | 20.4% | 96,318 | 23.7% | 48,159 | 23.7% | 48,159 | 23.7% | ||
| 61-70 | 159,912 | 16.5% | 92,103 | 13.0% | 67,809 | 26.2% | 109,858 | 27.0% | 54,929 | 27.0% | 54,929 | 27.0% | ||
| 71-80 | 120,117 | 12.4% | 54,076 | 7.6% | 66,041 | 25.5% | 88,734 | 21.8% | 44,367 | 21.8% | 44,367 | 21.8% | ||
| ≥81 | 61,892 | 6.4% | 24,533 | 3.5% | 37,359 | 14.4% | 43,940 | 10.8% | 21,970 | 10.8% | 21,970 | 10.8% | ||
| Gender | ||||||||||||||
| Female | 573,610 | 59.2% | 419,901 | 59.2% | 153,709 | 59.4% | 0.02 | 240,930 | 59.2% | 120,465 | 59.2% | 120,465 | 59.2% | 1.00 |
| Male | 394,686 | 40.8% | 289,743 | 40.8% | 104,943 | 40.6% | 166,318 | 40.8% | 83,159 | 40.8% | 83,159 | 40.8% | ||
| Insurance | ||||||||||||||
| Commercial | 500,918 | 51.7% | 425,181 | 59.9% | 75,737 | 29.3% | <0.001 | 150,918 | 37.1% | 75,459 | 37.1% | 75,459 | 37.1% | 1.00 |
| Dual | 6,814 | 0.7% | 1,659 | 0.2% | 5,155 | 2.0% | 2,986 | 0.7% | 1,493 | 0.7% | 1,493 | 0.7% | ||
| Medicaid | 252,366 | 26.1% | 193,207 | 27.2% | 59,159 | 22.9% | 95,032 | 23.3% | 47,516 | 23.3% | 47,516 | 23.3% | ||
| Medicare | 208,198 | 21.5% | 89,597 | 12.6% | 118,601 | 45.9% | 158,312 | 38.9% | 79,156 | 38.9% | 79,156 | 38.9% | ||
| PCP Visit 2019 | ||||||||||||||
| No | 521,282 | 53.8% | 423,952 | 59.7% | 97,330 | 37.6% | <0.001 | 181,234 | 44.5% | 90,617 | 44.5% | 90,617 | 44.5% | 1.00 |
| Yes | 447,014 | 46.2% | 285,692 | 40.3% | 161,322 | 62.4% | 226,014 | 55.5% | 113,007 | 55.5% | 113,007 | 55.5% | ||
| Continuous Outcomes | ||||||||||||||
| mean | SD | mean | SD | mean | SD | p-value | mean | SD | mean | SD | mean | SD | p-value | |
| CCI | 0.65 | 1.39 | 0.46 | 1.16 | 1.17 | 1.80 | <0.001 | 0.95 | 1.60 | 0.95 | 1.60 | 0.95 | 1.60 | 1.00 |
-
CCI: Charlson Comorbidity Index; HTN: antihypertensive; PCP: primary care physician; SD: standard deviation.
Appendix 2—table 32
Antihypertensive User Cohort (All Regions) by BP Use, Patient Characteristics Pre/Post Match of BP Users/Non-users.
| All Antihypertensive Users by BP: Unmatched | All Antihypertensive Users by BP: Matched | |||||||||||||
|---|---|---|---|---|---|---|---|---|---|---|---|---|---|---|
| All | BP Non-user | BP User | p-value | All | BP Non-user | BP User | p-value | |||||||
| N | % | N | % | N | % | N | % | N | % | N | % | |||
| All Patients | 1,786,001 | 100.0% | 1,579,388 | 88.4% | 206,613 | 11.6% | 408,792 | 100.0% | 204,396 | 50.0% | 204,396 | 50.0% | ||
| Age | ||||||||||||||
| ≤20 | 16,789 | 0.9% | 16,586 | 1.1% | 203 | 0.1% | <0.001 | 411 | 0.1% | 208 | 0.1% | 203 | 0.1% | 1.00 |
| 21-40 | 146,733 | 8.2% | 145,872 | 9.2% | 861 | 0.4% | 1,728 | 0.4% | 868 | 0.4% | 860 | 0.4% | ||
| 41-50 | 231,818 | 13.0% | 229,150 | 14.5% | 2,668 | 1.3% | 5,333 | 1.3% | 2,667 | 1.3% | 2,666 | 1.3% | ||
| 51-60 | 435,554 | 24.4% | 413,155 | 26.2% | 22,399 | 10.8% | 44,796 | 11.0% | 22,399 | 11.0% | 22,397 | 11.0% | ||
| 61-70 | 459,631 | 25.7% | 390,664 | 24.7% | 68,967 | 33.4% | 137,730 | 33.7% | 68,862 | 33.7% | 68,868 | 33.7% | ||
| 71-80 | 309,680 | 17.3% | 237,749 | 15.1% | 71,931 | 34.8% | 140,882 | 34.5% | 70,439 | 34.5% | 70,443 | 34.5% | ||
| ≥81 | 185,796 | 10.4% | 146,212 | 9.3% | 39,584 | 19.2% | 77,912 | 19.1% | 38,953 | 19.1% | 38,959 | 19.1% | ||
| Gender | ||||||||||||||
| Female | 1,079,897 | 60.5% | 894,472 | 56.6% | 185,425 | 89.7% | <0.001 | 366,424 | 89.6% | 183,212 | 89.6% | 183,212 | 89.6% | 1.00 |
| Male | 706,104 | 39.5% | 684,916 | 43.4% | 21,188 | 10.3% | 42,368 | 10.4% | 21,184 | 10.4% | 21,184 | 10.4% | ||
| Region | ||||||||||||||
| Midwest | 347,103 | 19.4% | 313,523 | 19.9% | 33,580 | 16.3% | <0.001 | 67,058 | 16.4% | 33,529 | 16.4% | 33,529 | 16.4% | 1.00 |
| Northeast | 498,566 | 27.9% | 444,828 | 28.2% | 53,738 | 26.0% | 107,150 | 26.2% | 53,575 | 26.2% | 53,575 | 26.2% | ||
| South | 669,285 | 37.5% | 595,410 | 37.7% | 73,875 | 35.8% | 146,890 | 35.9% | 73,445 | 35.9% | 73,445 | 35.9% | ||
| West | 271,047 | 15.2% | 225,627 | 14.3% | 45,420 | 22.0% | 87,694 | 21.5% | 43,847 | 21.5% | 43,847 | 21.5% | ||
| Insurance | ||||||||||||||
| Commercial | 847,410 | 47.4% | 787,519 | 49.9% | 59,891 | 29.0% | <0.001 | 119,737 | 29.3% | 59,863 | 29.3% | 59,874 | 29.3% | 1.00 |
| Dual | 46,693 | 2.6% | 37,153 | 2.4% | 9,540 | 4.6% | 17,884 | 4.4% | 8,945 | 4.4% | 8,939 | 4.4% | ||
| Medicaid | 406,725 | 22.8% | 369,893 | 23.4% | 36,832 | 17.8% | 70,769 | 17.3% | 35,387 | 17.3% | 35,382 | 17.3% | ||
| Medicare | 485,173 | 27.2% | 384,823 | 24.4% | 100,350 | 48.6% | 200,402 | 49.0% | 100,201 | 49.0% | 100,201 | 49.0% | ||
| PCP Visit 2019 | ||||||||||||||
| No | 718,249 | 40.2% | 633,042 | 40.1% | 85,207 | 41.2% | <0.001 | 168,255 | 41.2% | 84,128 | 41.2% | 84,127 | 41.2% | 1.00 |
| Yes | 1,067,752 | 59.8% | 946,346 | 59.9% | 121,406 | 58.8% | 240,537 | 58.8% | 120,268 | 58.8% | 120,269 | 58.8% | ||
| Continuous Outcomes | ||||||||||||||
| mean | SD | mean | SD | mean | SD | p-value | mean | SD | mean | SD | mean | SD | p-value | |
| CCI | 0.95 | 1.64 | 0.95 | 1.64 | 0.94 | 1.68 | 0.02 | 0.95 | 1.67 | 0.95 | 1.67 | 0.95 | 1.68 | 0.68 |
-
BP: bisphosphonate; CCI: Charlson Comorbidity Index; PCP: primary care physician; SD: standard deviation.
Appendix 2—table 33
Antihypertensive User Cohort (Region=New York State) by BP Use, Patient Characteristics Pre/Post Match of BP Users/Non-users.
| Region=NY Antihypertensive Users by BP: Unmatched | Region=NY Antihypertensive Users by BP: Matched | |||||||||||||
|---|---|---|---|---|---|---|---|---|---|---|---|---|---|---|
| All | BP Non-user | BP User | p-value | All | BP Non-user | BP User | p-value | |||||||
| N | % | N | % | N | % | N | % | N | % | N | % | |||
| All Patients | 203,624 | 100.0% | 182,411 | 89.6% | 21,213 | 10.4% | 42,252 | 100.0% | 21,126 | 50.0% | 21,126 | 50.0% | ||
| Age | ||||||||||||||
| ≤20 | 811 | 0.4% | 798 | 0.4% | 13 | 0.1% | <0.001 | 27 | 0.1% | 14 | 0.1% | 13 | 0.1% | 1.00 |
| 21-40 | 11,465 | 5.6% | 11,396 | 6.2% | 69 | 0.3% | 137 | 0.3% | 68 | 0.3% | 69 | 0.3% | ||
| 41-50 | 21,923 | 10.8% | 21,747 | 11.9% | 176 | 0.8% | 354 | 0.8% | 178 | 0.8% | 176 | 0.8% | ||
| 51-60 | 48,159 | 23.7% | 46,047 | 25.2% | 2,112 | 10.0% | 4,218 | 10.0% | 2,108 | 10.0% | 2,110 | 10.0% | ||
| 61-70 | 54,929 | 27.0% | 48,022 | 26.3% | 6,907 | 32.6% | 13,804 | 32.7% | 6,902 | 32.7% | 6,902 | 32.7% | ||
| 71-80 | 44,367 | 21.8% | 36,409 | 20.0% | 7,958 | 37.5% | 15,777 | 37.3% | 7,886 | 37.3% | 7,891 | 37.4% | ||
| ≥81 | 21,970 | 10.8% | 17,992 | 9.9% | 3,978 | 18.8% | 7,935 | 18.8% | 3,970 | 18.8% | 3,965 | 18.8% | ||
| Gender | ||||||||||||||
| Female | 120,465 | 59.2% | 101,190 | 55.5% | 19,275 | 90.9% | <0.001 | 38,380 | 90.8% | 19,190 | 90.8% | 19,190 | 90.8% | 1.00 |
| Male | 83,159 | 40.8% | 81,221 | 44.5% | 1,938 | 9.1% | 3,872 | 9.2% | 1,936 | 9.2% | 1,936 | 9.2% | ||
| Insurance | ||||||||||||||
| Commercial | 75,459 | 37.1% | 71,460 | 39.2% | 3,999 | 18.9% | <0.001 | 7,993 | 18.9% | 3,997 | 18.9% | 3,996 | 18.9% | 1.00 |
| Dual | 1,493 | 0.7% | 1,151 | 0.6% | 342 | 1.6% | 643 | 1.5% | 322 | 1.5% | 321 | 1.5% | ||
| Medicaid | 47,516 | 23.3% | 44,248 | 24.3% | 3,268 | 15.4% | 6,414 | 15.2% | 3,207 | 15.2% | 3,207 | 15.2% | ||
| Medicare | 79,156 | 38.9% | 65,552 | 35.9% | 13,604 | 64.1% | 27,202 | 64.4% | 13,600 | 64.4% | 13,602 | 64.4% | ||
| PCP Visit 2019 | ||||||||||||||
| No | 90,617 | 44.5% | 80,739 | 44.3% | 9,878 | 46.6% | <0.001 | 19,672 | 46.6% | 9,837 | 46.6% | 9,835 | 46.6% | 0.98 |
| Yes | 113,007 | 55.5% | 101,672 | 55.7% | 11,335 | 53.4% | 22,580 | 53.4% | 11,289 | 53.4% | 11,291 | 53.4% | ||
| Continuous Outcomes | ||||||||||||||
| mean | SD | mean | SD | mean | SD | p-value | mean | SD | mean | SD | mean | SD | p-value | |
| CCI | 0.95 | 1.60 | 0.95 | 1.61 | 0.88 | 1.54 | <0.001 | 0.87 | 1.53 | 0.87 | 1.52 | 0.87 | 1.53 | 0.87 |
-
BP: bisphosphonate; CCI: Charlson Comorbidity Index; PCP: primary care physician; SD: standard deviation.
Appendix 2—table 34
Antihypertensive Non-user Cohort (All Regions) by BP Use, Patient Characteristics Pre/Post Match of BP Users/Non-users.
| All Antihypertensive Non-users by BP: Unmatched | All Antihypertensive Non-users by BP: Matched | |||||||||||||
|---|---|---|---|---|---|---|---|---|---|---|---|---|---|---|
| All | BP Non-user | BP User | p-value | All | BP Non-user | BP User | p-value | |||||||
| N | % | N | % | N | % | N | % | N | % | N | % | |||
| All Patients | 1,786,001 | 100.0% | 1,649,985 | 92.4% | 136,016 | 7.6% | 271,448 | 100.0% | 135,724 | 50.0% | 135,724 | 50.0% | ||
| Age | ||||||||||||||
| ≤20 | 16,785 | 0.9% | 16,767 | 1.0% | 18 | 0.0% | <0.001 | 34 | 0.0% | 16 | 0.0% | 18 | 0.0% | 1.00 |
| 21-40 | 146,712 | 8.2% | 146,210 | 8.9% | 502 | 0.4% | 1,009 | 0.4% | 507 | 0.4% | 502 | 0.4% | ||
| 41-50 | 231,312 | 13.0% | 228,725 | 13.9% | 2,587 | 1.9% | 5,163 | 1.9% | 2,577 | 1.9% | 2,586 | 1.9% | ||
| 51-60 | 434,995 | 24.4% | 410,636 | 24.9% | 24,359 | 17.9% | 48,700 | 17.9% | 24,349 | 17.9% | 24,351 | 17.9% | ||
| 61-70 | 459,192 | 25.7% | 404,445 | 24.5% | 54,747 | 40.3% | 109,415 | 40.3% | 54,711 | 40.3% | 54,704 | 40.3% | ||
| 71-80 | 309,898 | 17.4% | 271,617 | 16.5% | 38,281 | 28.1% | 76,139 | 28.0% | 38,070 | 28.0% | 38,069 | 28.0% | ||
| ≥81 | 187,107 | 10.5% | 171,585 | 10.4% | 15,522 | 11.4% | 30,988 | 11.4% | 15,494 | 11.4% | 15,494 | 11.4% | ||
| Gender | ||||||||||||||
| Female | 1,079,468 | 60.4% | 956,403 | 58.0% | 123,065 | 90.5% | <0.001 | 245,537 | 90.5% | 122,762 | 90.4% | 122,775 | 90.5% | 0.93 |
| Male | 706,533 | 39.6% | 693,582 | 42.0% | 12,951 | 9.5% | 25,911 | 9.5% | 12,962 | 9.6% | 12,949 | 9.5% | ||
| Region | ||||||||||||||
| Midwest | 347,103 | 19.4% | 321,267 | 19.5% | 25,836 | 19.0% | <0.001 | 51,638 | 19.0% | 25,819 | 19.0% | 25,819 | 19.0% | 1.00 |
| Northeast | 498,566 | 27.9% | 463,273 | 28.1% | 35,293 | 25.9% | 70,544 | 26.0% | 35,272 | 26.0% | 35,272 | 26.0% | ||
| South | 669,285 | 37.5% | 622,064 | 37.7% | 47,221 | 34.7% | 93,980 | 34.6% | 46,990 | 34.6% | 46,990 | 34.6% | ||
| West | 271,047 | 15.2% | 243,381 | 14.8% | 27,666 | 20.3% | 55,286 | 20.4% | 27,643 | 20.4% | 27,643 | 20.4% | ||
| Insurance | ||||||||||||||
| Commercial | 848,106 | 47.5% | 798,579 | 48.4% | 49,527 | 36.4% | <0.001 | 99,039 | 36.5% | 49,523 | 36.5% | 49,516 | 36.5% | 1.00 |
| Dual | 46,774 | 2.6% | 40,212 | 2.4% | 6,562 | 4.8% | 12,645 | 4.7% | 6,319 | 4.7% | 6,326 | 4.7% | ||
| Medicaid | 406,012 | 22.7% | 381,472 | 23.1% | 24,540 | 18.0% | 49,025 | 18.1% | 24,516 | 18.1% | 24,509 | 18.1% | ||
| Medicare | 485,109 | 27.2% | 429,722 | 26.0% | 55,387 | 40.7% | 110,739 | 40.8% | 55,366 | 40.8% | 55,373 | 40.8% | ||
| PCP Visit 2019 | ||||||||||||||
| No | 719,756 | 40.3% | 676,255 | 41.0% | 43,501 | 32.0% | <0.001 | 86,956 | 32.0% | 43,478 | 32.0% | 43,478 | 32.0% | 1.00 |
| Yes | 1,066,245 | 59.7% | 973,730 | 59.0% | 92,515 | 68.0% | 184,492 | 68.0% | 92,246 | 68.0% | 92,246 | 68.0% | ||
| Continuous Outcomes | ||||||||||||||
| mean | SD | mean | SD | mean | SD | p-value | mean | SD | mean | SD | mean | SD | p-value | |
| CCI | 0.96 | 1.66 | 0.96 | 1.65 | 0.88 | 1.76 | <0.001 | 0.88 | 1.75 | 0.88 | 1.74 | 0.88 | 1.75 | 0.76 |
-
BP: bisphosphonate; CCI: Charlson Comorbidity Index; PCP: primary care physician; SD: standard deviation.
Appendix 2—table 35
Antihypertensive Non-user Cohort (Region=New York State) by BP Use, Patient Characteristics Pre/Post Match of BP Users/Non-users.
| Region=NY Antihypertensive Non-Users by BP: Unmatched | Region=NY Antihypertensive Non-users by BP: Matched | |||||||||||||
|---|---|---|---|---|---|---|---|---|---|---|---|---|---|---|
| All | BP Non-user | BP User | p-value | All | BP Non-user | BP User | p-value | |||||||
| N | % | N | % | N | % | N | % | N | % | N | % | |||
| All Patients | 203,624 | 100.0% | 189,573 | 93.1% | 14,051 | 6.9% | 27,966 | 100.0% | 13,983 | 50.0% | 13,983 | 50.0% | ||
| Age | ||||||||||||||
| ≤20 | 811 | 0.4% | 810 | 0.4% | 1 | 0.0% | <0.001 | 2 | 0.0% | 1 | 0.0% | 1 | 0.0% | 1.00 |
| 21-40 | 11,465 | 5.6% | 11,451 | 6.0% | 14 | 0.1% | 28 | 0.1% | 14 | 0.1% | 14 | 0.1% | ||
| 41-50 | 21,923 | 10.8% | 21,762 | 11.5% | 161 | 1.1% | 324 | 1.2% | 163 | 1.2% | 161 | 1.2% | ||
| 51-60 | 48,159 | 23.7% | 46,035 | 24.3% | 2,124 | 15.1% | 4,245 | 15.2% | 2,121 | 15.2% | 2,124 | 15.2% | ||
| 61-70 | 54,929 | 27.0% | 49,409 | 26.1% | 5,520 | 39.3% | 11,027 | 39.4% | 5,512 | 39.4% | 5,515 | 39.4% | ||
| 71-80 | 44,367 | 21.8% | 39,789 | 21.0% | 4,578 | 32.6% | 9,054 | 32.4% | 4,528 | 32.4% | 4,526 | 32.4% | ||
| ≥81 | 21,970 | 10.8% | 20,317 | 10.7% | 1,653 | 11.8% | 3,286 | 11.7% | 1,644 | 11.8% | 1,642 | 11.7% | ||
| Gender | ||||||||||||||
| Female | 120,465 | 59.2% | 107,632 | 56.8% | 12,833 | 91.3% | <0.001 | 25,530 | 91.3% | 12,764 | 91.3% | 12,766 | 91.3% | 0.97 |
| Male | 83,159 | 40.8% | 81,941 | 43.2% | 1,218 | 8.7% | 2,436 | 8.7% | 1,219 | 8.7% | 1,217 | 8.7% | ||
| Insurance | ||||||||||||||
| Commercial | 75,459 | 37.1% | 73,115 | 38.6% | 2,344 | 16.7% | <0.001 | 4,683 | 16.7% | 2,342 | 16.7% | 2,341 | 16.7% | 1.00 |
| Dual | 1,493 | 0.7% | 1,211 | 0.6% | 282 | 2.0% | 554 | 2.0% | 277 | 2.0% | 277 | 2.0% | ||
| Medicaid | 47,516 | 23.3% | 43,809 | 23.1% | 3,707 | 26.4% | 7,295 | 26.1% | 3,648 | 26.1% | 3,647 | 26.1% | ||
| Medicare | 79,156 | 38.9% | 71,438 | 37.7% | 7,718 | 54.9% | 15,434 | 55.2% | 7,716 | 55.2% | 7,718 | 55.2% | ||
| PCP Visit 2019 | ||||||||||||||
| No | 90,617 | 44.5% | 85,875 | 45.3% | 4,742 | 33.7% | <0.001 | 9,461 | 33.8% | 4,728 | 33.8% | 4,733 | 33.8% | 0.95 |
| Yes | 113,007 | 55.5% | 103,698 | 54.7% | 9,309 | 66.3% | 18,505 | 66.2% | 9,255 | 66.2% | 9,250 | 66.2% | ||
| Continuous Outcomes | ||||||||||||||
| mean | SD | mean | SD | mean | SD | p-value | mean | SD | mean | SD | mean | SD | p-value | |
| CCI | 0.95 | 1.60 | 0.96 | 1.60 | 0.81 | 1.60 | <0.001 | 0.81 | 1.59 | 0.81 | 1.58 | 0.81 | 1.59 | 0.92 |
-
BP: bisphosphonate; CCI: Charlson Comorbidity Index; PCP: primary care physician; SD: standard deviation.
Appendix 2—table 36
Antidiabetic Cohort (All Regions), Patient Characteristics Pre/Post Match.
| All Observations by Antidiabetic Use: Unmatched | All Observations by Antidiabetic Use: Matched | |||||||||||||
|---|---|---|---|---|---|---|---|---|---|---|---|---|---|---|
| All | DIAB Non-users | DIAB Users | p-value | All | DIAB Non-users | DIAB Users | p-value | |||||||
| N | % | N | % | N | % | N | % | N | % | N | % | |||
| All Patients | 7,906,603 | 100.0% | 7,151,351 | 90.4% | 755,252 | 9.6% | 1,509,106 | 100.0% | 754,553 | 50.0% | 754,553 | 50.0% | ||
| Age | ||||||||||||||
| ≤20 | 1,840,050 | 23.3% | 1,833,838 | 25.6% | 6,212 | 0.8% | <0.001 | 12,422 | 0.8% | 6,211 | 0.8% | 6,211 | 0.8% | 1.00 |
| 21-40 | 1,446,999 | 18.3% | 1,389,243 | 19.4% | 57,756 | 7.6% | 115,448 | 7.7% | 57,723 | 7.6% | 57,725 | 7.7% | ||
| 41-50 | 925,309 | 11.7% | 833,333 | 11.7% | 91,976 | 12.2% | 183,810 | 12.2% | 91,905 | 12.2% | 91,905 | 12.2% | ||
| 51-60 | 1,250,190 | 15.8% | 1,058,878 | 14.8% | 191,312 | 25.3% | 382,390 | 25.3% | 191,196 | 25.3% | 191,194 | 25.3% | ||
| 61-70 | 1,181,261 | 14.9% | 973,670 | 13.6% | 207,591 | 27.5% | 414,869 | 27.5% | 207,435 | 27.5% | 207,434 | 27.5% | ||
| 71-80 | 783,775 | 9.9% | 645,256 | 9.0% | 138,519 | 18.3% | 276,619 | 18.3% | 138,310 | 18.3% | 138,309 | 18.3% | ||
| ≥81 | 479,019 | 6.1% | 417,133 | 5.8% | 61,886 | 8.2% | 123,548 | 8.2% | 61,773 | 8.2% | 61,775 | 8.2% | ||
| Gender | ||||||||||||||
| Female | 4,670,960 | 59.1% | 4,212,086 | 58.9% | 458,874 | 60.8% | <0.001 | 916,914 | 60.8% | 458,455 | 60.8% | 458,459 | 60.8% | 0.99 |
| Male | 3,235,643 | 40.9% | 2,939,265 | 41.1% | 296,378 | 39.2% | 592,192 | 39.2% | 296,098 | 39.2% | 296,094 | 39.2% | ||
| Region | ||||||||||||||
| Midwest | 1,467,802 | 18.6% | 1,333,631 | 18.6% | 134,171 | 17.8% | <0.001 | 268,044 | 17.8% | 134,022 | 17.8% | 134,022 | 17.8% | 1.00 |
| Northeast | 2,152,560 | 27.2% | 1,935,311 | 27.1% | 217,249 | 28.8% | 434,080 | 28.8% | 217,040 | 28.8% | 217,040 | 28.8% | ||
| South | 3,042,604 | 38.5% | 2,752,618 | 38.5% | 289,986 | 38.4% | 579,562 | 38.4% | 289,781 | 38.4% | 289,781 | 38.4% | ||
| West | 1,243,637 | 15.7% | 1,129,791 | 15.8% | 113,846 | 15.1% | 227,420 | 15.1% | 113,710 | 15.1% | 113,710 | 15.1% | ||
| Insurance | ||||||||||||||
| Commercial | 3,938,603 | 49.8% | 3,631,514 | 50.8% | 307,089 | 40.7% | <0.001 | 614,045 | 40.7% | 307,022 | 40.7% | 307,023 | 40.7% | 1.00 |
| Dual | 156,497 | 2.0% | 113,496 | 1.6% | 43,001 | 5.7% | 85,209 | 5.6% | 42,603 | 5.6% | 42,606 | 5.6% | ||
| Medicaid | 2,594,500 | 32.8% | 2,387,519 | 33.4% | 206,981 | 27.4% | 413,743 | 27.4% | 206,875 | 27.4% | 206,868 | 27.4% | ||
| Medicare | 1,217,003 | 15.4% | 1,018,822 | 14.2% | 198,181 | 26.2% | 396,109 | 26.2% | 198,053 | 26.2% | 198,056 | 26.2% | ||
| PCP Visit 2019 | ||||||||||||||
| No | 4,283,697 | 54.2% | 4,030,804 | 56.4% | 252,893 | 33.5% | <0.001 | 505,500 | 33.5% | 252,752 | 33.5% | 252,748 | 33.5% | 0.99 |
| Yes | 3,622,906 | 45.8% | 3,120,547 | 43.6% | 502,359 | 66.5% | 1,003,606 | 66.5% | 501,801 | 66.5% | 501,805 | 66.5% | ||
| Continuous Outcomes | ||||||||||||||
| mean | SD | mean | SD | mean | SD | p-value | mean | SD | mean | SD | mean | SD | p-value | |
| CCI | 0.62 | 1.38 | 0.55 | 1.30 | 1.25 | 1.84 | <0.001 | 1.24 | 1.82 | 1.24 | 1.82 | 1.24 | 1.82 | 0.99 |
-
CCI: Charlson Comorbidity Index; DIAB: antidiabetic; PCP: primary care physician; SD: standard deviation.
Appendix 2—table 37
Antidiabetic Cohort (Region=New York State), Patient Characteristics Pre/Post Match.
| Region=NY by Antidiabetic Use: Unmatched | Region=NY by Antidiabetic Use: Matched | |||||||||||||
|---|---|---|---|---|---|---|---|---|---|---|---|---|---|---|
| All | DIAB Non-users | DIAB Users | p-value | All | DIAB Non-users | DIAB Users | p-value | |||||||
| N | % | N | % | N | % | N | % | N | % | N | % | |||
| All Patients | 968,296 | 100.0% | 863,179 | 89.1% | 105,117 | 10.9% | 209,382 | 100.0% | 104,691 | 50.0% | 104,691 | 50.0% | ||
| Age | ||||||||||||||
| ≤20 | 133,178 | 13.8% | 132,723 | 15.4% | 455 | 0.4% | <0.001 | 910 | 0.4% | 455 | 0.4% | 455 | 0.4% | 1.00 |
| 21-40 | 192,959 | 19.9% | 186,785 | 21.6% | 6,174 | 5.9% | 12,328 | 5.9% | 6,164 | 5.9% | 6,164 | 5.9% | ||
| 41-50 | 127,794 | 13.2% | 117,342 | 13.6% | 10,452 | 9.9% | 20,880 | 10.0% | 10,440 | 10.0% | 10,440 | 10.0% | ||
| 51-60 | 172,444 | 17.8% | 148,040 | 17.2% | 24,404 | 23.2% | 48,735 | 23.3% | 24,369 | 23.3% | 24,366 | 23.3% | ||
| 61-70 | 159,912 | 16.5% | 130,968 | 15.2% | 28,944 | 27.5% | 57,638 | 27.5% | 28,819 | 27.5% | 28,819 | 27.5% | ||
| 71-80 | 120,117 | 12.4% | 95,621 | 11.1% | 24,496 | 23.3% | 48,625 | 23.2% | 24,311 | 23.2% | 24,314 | 23.2% | ||
| ≥81 | 61,892 | 6.4% | 51,700 | 6.0% | 10,192 | 9.7% | 20,266 | 9.7% | 10,133 | 9.7% | 10,133 | 9.7% | ||
| Gender | ||||||||||||||
| Female | 573,610 | 59.2% | 512,889 | 59.4% | 60,721 | 57.8% | <0.001 | 120,937 | 57.8% | 60,467 | 57.8% | 60,470 | 57.8% | 0.99 |
| Male | 394,686 | 40.8% | 350,290 | 40.6% | 44,396 | 42.2% | 88,445 | 42.2% | 44,224 | 42.2% | 44,221 | 42.2% | ||
| Insurance | ||||||||||||||
| Commercial | 500,918 | 51.7% | 468,804 | 54.3% | 32,114 | 30.6% | <0.001 | 64,200 | 30.7% | 32,100 | 30.7% | 32,100 | 30.7% | 1.00 |
| Dual | 6,814 | 0.7% | 4,408 | 0.5% | 2,406 | 2.3% | 4,389 | 2.1% | 2,196 | 2.1% | 2,193 | 2.1% | ||
| Medicaid | 252,366 | 26.1% | 224,334 | 26.0% | 28,032 | 26.7% | 55,853 | 26.7% | 27,925 | 26.7% | 27,928 | 26.7% | ||
| Medicare | 208,198 | 21.5% | 165,633 | 19.2% | 42,565 | 40.5% | 84,940 | 40.6% | 42,470 | 40.6% | 42,470 | 40.6% | ||
| PCP Visit 2019 | ||||||||||||||
| No | 521,282 | 53.8% | 484,071 | 56.1% | 37,211 | 35.4% | <0.001 | 74,215 | 35.4% | 37,106 | 35.4% | 37,109 | 35.4% | 0.99 |
| Yes | 447,014 | 46.2% | 379,108 | 43.9% | 67,906 | 64.6% | 135,167 | 64.6% | 67,585 | 64.6% | 67,582 | 64.6% | ||
| Continuous Outcomes | ||||||||||||||
| mean | SD | mean | SD | mean | SD | p-value | mean | SD | mean | SD | mean | SD | p-value | |
| CCI | 0.65 | 1.39 | 0.56 | 1.30 | 1.34 | 1.84 | <0.001 | 1.32 | 1.79 | 1.32 | 1.79 | 1.32 | 1.79 | 0.98 |
-
CCI: Charlson Comorbidity Index; DIAB: antidiabetic; PCP: primary care physician; SD: standard deviation.
Appendix 2—table 38
Antidiabetic User Cohort (All Regions) by BP Use, Patient Characteristics Pre/Post Match of BP Users/Non users.
| All Antidiabetic Users by BP: Unmatched | All Antidiabetic Users by BP: Matched | |||||||||||||
|---|---|---|---|---|---|---|---|---|---|---|---|---|---|---|
| All | BP Non-user | BP User | p-value | All | BP Non-user | BP User | p-value | |||||||
| N | % | N | % | N | % | N | % | N | % | N | % | |||
| All Patients | 754,553 | 100.0% | 674,024 | 89.3% | 80,529 | 10.7% | 159,000 | 100.0% | 79,500 | 50.0% | 79,500 | 50.0% | ||
| Age | ||||||||||||||
| ≤20 | 6,211 | 0.8% | 6,169 | 0.9% | 42 | 0.1% | <0.001 | 83 | 0.1% | 41 | 0.1% | 42 | 0.1% | 1.00 |
| 21-40 | 57,725 | 7.7% | 57,535 | 8.5% | 190 | 0.2% | 380 | 0.2% | 190 | 0.2% | 190 | 0.2% | ||
| 41-50 | 91,905 | 12.2% | 90,952 | 13.5% | 953 | 1.2% | 1,905 | 1.2% | 952 | 1.2% | 953 | 1.2% | ||
| 51-60 | 191,194 | 25.3% | 182,922 | 27.1% | 8,272 | 10.3% | 16,536 | 10.4% | 8,268 | 10.4% | 8,268 | 10.4% | ||
| 61-70 | 207,434 | 27.5% | 180,895 | 26.8% | 26,539 | 33.0% | 53,028 | 33.4% | 26,512 | 33.3% | 26,516 | 33.4% | ||
| 71-80 | 138,309 | 18.3% | 107,467 | 15.9% | 30,842 | 38.3% | 60,240 | 37.9% | 30,121 | 37.9% | 30,119 | 37.9% | ||
| ≥81 | 61,775 | 8.2% | 48,084 | 7.1% | 13,691 | 17.0% | 26,828 | 16.9% | 13,416 | 16.9% | 13,412 | 16.9% | ||
| Gender | ||||||||||||||
| Female | 458,459 | 60.8% | 386,400 | 57.3% | 72,059 | 89.5% | <0.001 | 142,068 | 89.4% | 71,027 | 89.3% | 71,041 | 89.4% | 0.91 |
| Male | 296,094 | 39.2% | 287,624 | 42.7% | 8,470 | 10.5% | 16,932 | 10.6% | 8,473 | 10.7% | 8,459 | 10.6% | ||
| Region | ||||||||||||||
| Midwest | 134,022 | 17.8% | 123,909 | 18.4% | 10,113 | 12.6% | <0.001 | 20,168 | 12.7% | 10,084 | 12.7% | 10,084 | 12.7% | 1.00 |
| Northeast | 217,040 | 28.8% | 196,723 | 29.2% | 20,317 | 25.2% | 40,446 | 25.4% | 20,223 | 25.4% | 20,223 | 25.4% | ||
| South | 289,781 | 38.4% | 257,599 | 38.2% | 32,182 | 40.0% | 63,740 | 40.1% | 31,870 | 40.1% | 31,870 | 40.1% | ||
| West | 113,710 | 15.1% | 95,793 | 14.2% | 17,917 | 22.2% | 34,646 | 21.8% | 17,323 | 21.8% | 17,323 | 21.8% | ||
| Insurance | ||||||||||||||
| Commercial | 307,023 | 40.7% | 290,957 | 43.2% | 16,066 | 20.0% | <0.001 | 32,086 | 20.2% | 16,043 | 20.2% | 16,043 | 20.2% | 1.00 |
| Dual | 42,606 | 5.6% | 32,797 | 4.9% | 9,809 | 12.2% | 18,653 | 11.7% | 9,321 | 11.7% | 9,332 | 11.7% | ||
| Medicaid | 206,868 | 27.4% | 188,638 | 28.0% | 18,230 | 22.6% | 35,513 | 22.3% | 17,759 | 22.3% | 17,754 | 22.3% | ||
| Medicare | 198,056 | 26.2% | 161,632 | 24.0% | 36,424 | 45.2% | 72,748 | 45.8% | 36,377 | 45.8% | 36,371 | 45.7% | ||
| PCP Visit 2019 | ||||||||||||||
| No | 252,748 | 33.5% | 228,203 | 33.9% | 24,545 | 30.5% | <0.001 | 48,374 | 30.4% | 24,184 | 30.4% | 24,190 | 30.4% | 0.97 |
| Yes | 501,805 | 66.5% | 445,821 | 66.1% | 55,984 | 69.5% | 110,626 | 69.6% | 55,316 | 69.6% | 55,310 | 69.6% | ||
| Continuous Outcomes | ||||||||||||||
| mean | SD | mean | SD | mean | SD | p-value | mean | SD | mean | SD | mean | SD | p-value | |
| CCI | 1.24 | 1.82 | 1.23 | 1.81 | 1.32 | 1.90 | <0.001 | 1.31 | 1.88 | 1.31 | 1.87 | 1.32 | 1.88 | 0.75 |
-
BP: bisphosphonate; CCI: Charlson Comorbidity Index; PCP: primary care physician; SD: standard deviation.
Appendix 2—table 39
Influences on exploratory choice including WASI scores.
| Region=NY Antidiabetic Users by BP: Unmatched | Region=NY Antidiabetic Users by BP: Matched | |||||||||||||
|---|---|---|---|---|---|---|---|---|---|---|---|---|---|---|
| All | BP Non-user | BP User | p-value | All | BP Non-user | BP User | p-value | |||||||
| N | % | N | % | N | % | N | % | N | % | N | % | |||
| All Patients | 104,691 | 100.0% | 95,162 | 90.9% | 9,529 | 9.1% | 18,912 | 100.0% | 9,456 | 50.0% | 9,456 | 50.0% | ||
| Age | ||||||||||||||
| ≤20 | 455 | 0.4% | 454 | 0.5% | 1 | 0.0% | <0.001 | 2 | 0.0% | 1 | 0.0% | 1 | 0.0% | 1.00 |
| 21-40 | 6,164 | 5.9% | 6,152 | 6.5% | 12 | 0.1% | 25 | 0.1% | 13 | 0.1% | 12 | 0.1% | ||
| 41-50 | 10,440 | 10.0% | 10,363 | 10.9% | 77 | 0.8% | 151 | 0.8% | 75 | 0.8% | 76 | 0.8% | ||
| 51-60 | 24,366 | 23.3% | 23,532 | 24.7% | 834 | 8.8% | 1,665 | 8.8% | 831 | 8.8% | 834 | 8.8% | ||
| 61-70 | 28,819 | 27.5% | 25,939 | 27.3% | 2,880 | 30.2% | 5,741 | 30.4% | 2,870 | 30.4% | 2,871 | 30.4% | ||
| 71-80 | 24,314 | 23.2% | 20,338 | 21.4% | 3,976 | 41.7% | 7,880 | 41.7% | 3,941 | 41.7% | 3,939 | 41.7% | ||
| ≥81 | 10,133 | 9.7% | 8,384 | 8.8% | 1,749 | 18.4% | 3,448 | 18.2% | 1,725 | 18.2% | 1,723 | 18.2% | ||
| Gender | ||||||||||||||
| Female | 60,470 | 57.8% | 51,884 | 54.5% | 8,586 | 90.1% | <0.001 | 17,022 | 90.0% | 8,509 | 90.0% | 8,513 | 90.0% | 0.92 |
| Male | 44,221 | 42.2% | 43,278 | 45.5% | 943 | 9.9% | 1,890 | 10.0% | 947 | 10.0% | 943 | 10.0% | ||
| Insurance | ||||||||||||||
| Commercial | 32,100 | 30.7% | 31,172 | 32.8% | 928 | 9.7% | <0.001 | 1,849 | 9.8% | 924 | 9.8% | 925 | 9.8% | 1.00 |
| Dual | 2,193 | 2.1% | 1,693 | 1.8% | 500 | 5.2% | 978 | 5.2% | 490 | 5.2% | 488 | 5.2% | ||
| Medicaid | 27,928 | 26.7% | 25,978 | 27.3% | 1,950 | 20.5% | 3,793 | 20.1% | 1,897 | 20.1% | 1,896 | 20.1% | ||
| Medicare | 42,470 | 40.6% | 36,319 | 38.2% | 6,151 | 64.6% | 12,292 | 65.0% | 6,145 | 65.0% | 6,147 | 65.0% | ||
| PCP Visit 2019 | ||||||||||||||
| No | 37,109 | 35.4% | 33,894 | 35.6% | 3,215 | 33.7% | <.001 | 6,363 | 33.6% | 3,182 | 33.7% | 3,181 | 33.6% | 0.99 |
| Yes | 67,582 | 64.6% | 61,268 | 64.4% | 6,314 | 66.3% | 12,549 | 66.4% | 6,274 | 66.3% | 6,275 | 66.4% | ||
| Continuous Outcomes | ||||||||||||||
| mean | SD | mean | SD | mean | SD | p-value | mean | SD | mean | SD | mean | SD | p-value | |
| CCI | 1.32 | 1.79 | 1.31 | 1.79 | 1.46 | 1.87 | <0.001 | 1.44 | 1.83 | 1.44 | 1.82 | 1.45 | 1.84 | 0.75 |
-
BP: bisphosphonate; CCI: Charlson Comorbidity Index; PCP: primary care physician; SD: standard deviation.
Appendix 2—table 40
Antidiabetic Non-user Cohort (All Regions) by BP Use, Patient Characteristics Pre/Post Match of BP Users/Non-users.
| All Antidiabetic Non-users by BP: Unmatched | All Antidiabetic Non-users by BP: Matched | |||||||||||||
|---|---|---|---|---|---|---|---|---|---|---|---|---|---|---|
| All | BP Non-user | BP User | p-value | All | BP Non-user | BP User | p-value | |||||||
| N | % | N | % | N | % | N | % | N | % | N | % | |||
| All Patients | 754,553 | 100.0% | 681,380 | 90.3% | 73,173 | 9.7% | 145,028 | 100.0% | 72,514 | 50.0% | 72,514 | 50.0% | ||
| Age | ||||||||||||||
| ≤20 | 6,211 | 0.8% | 6,199 | 0.9% | 12 | 0.0% | <0.001 | 24 | 0.0% | 12 | 0.0% | 12 | 0.0% | 1.00 |
| 21-40 | 57,723 | 7.6% | 57,497 | 8.4% | 226 | 0.3% | 455 | 0.3% | 229 | 0.3% | 226 | 0.3% | ||
| 41-50 | 91,905 | 12.2% | 90,693 | 13.3% | 1,212 | 1.7% | 2,421 | 1.7% | 1,209 | 1.7% | 1,212 | 1.7% | ||
| 51-60 | 191,196 | 25.3% | 180,332 | 26.5% | 10,864 | 14.8% | 21,721 | 15.0% | 10,860 | 15.0% | 10,861 | 15.0% | ||
| 61-70 | 207,435 | 27.5% | 180,825 | 26.5% | 26,610 | 36.4% | 53,115 | 36.6% | 26,558 | 36.6% | 26,557 | 36.6% | ||
| 71-80 | 138,310 | 18.3% | 114,018 | 16.7% | 24,292 | 33.2% | 47,723 | 32.9% | 23,861 | 32.9% | 23,862 | 32.9% | ||
| ≥81 | 61,773 | 8.2% | 51,816 | 7.6% | 9,957 | 13.6% | 19,569 | 13.5% | 9,785 | 13.5% | 9,784 | 13.5% | ||
| Gender | ||||||||||||||
| Female | 458,455 | 60.8% | 393,376 | 57.7% | 65,079 | 88.9% | <0.001 | 128,836 | 88.8% | 64,411 | 88.8% | 64,425 | 88.8% | 0.91 |
| Male | 296,098 | 39.2% | 288,004 | 42.3% | 8,094 | 11.1% | 16,192 | 11.2% | 8,103 | 11.2% | 8,089 | 11.2% | ||
| Region | ||||||||||||||
| Midwest | 134,022 | 17.8% | 123,283 | 18.1% | 10,739 | 14.7% | <0.001 | 21,390 | 14.7% | 10,695 | 14.7% | 10,695 | 14.7% | 1.00 |
| Northeast | 217,040 | 28.8% | 197,710 | 29.0% | 19,330 | 26.4% | 38,510 | 26.6% | 19,255 | 26.6% | 19,255 | 26.6% | ||
| South | 289,781 | 38.4% | 261,382 | 38.4% | 28,399 | 38.8% | 55,812 | 38.5% | 27,906 | 38.5% | 27,906 | 38.5% | ||
| West | 113,710 | 15.1% | 99,005 | 14.5% | 14,705 | 20.1% | 29,316 | 20.2% | 14,658 | 20.2% | 14,658 | 20.2% | ||
| Insurance | ||||||||||||||
| Commercial | 307,022 | 40.7% | 289,018 | 42.4% | 18,004 | 24.6% | <0.001 | 35,983 | 24.8% | 17,988 | 24.8% | 17,995 | 24.8% | 1.00 |
| Dual | 42,603 | 5.6% | 33,444 | 4.9% | 9,159 | 12.5% | 17,221 | 11.9% | 8,611 | 11.9% | 8,610 | 11.9% | ||
| Medicaid | 206,875 | 27.4% | 190,166 | 27.9% | 16,709 | 22.8% | 33,264 | 22.9% | 16,636 | 22.9% | 16,628 | 22.9% | ||
| Medicare | 198,053 | 26.2% | 168,752 | 24.8% | 29,301 | 40.0% | 58,560 | 40.4% | 29,279 | 40.4% | 29,281 | 40.4% | ||
| PCP Visit 2019 | ||||||||||||||
| No | 252,752 | 33.5% | 233,775 | 34.3% | 18,977 | 25.9% | <0.001 | 37,812 | 26.1% | 18,903 | 26.1% | 18,909 | 26.1% | 0.97 |
| Yes | 501,801 | 66.5% | 447,605 | 65.7% | 54,196 | 74.1% | 107,216 | 73.9% | 53,611 | 73.9% | 53,605 | 73.9% | ||
| Continuous Outcomes | ||||||||||||||
| mean | SD | mean | SD | mean | SD | p-value | mean | SD | mean | SD | mean | SD | p-value | |
| CCI | 1.24 | 1.82 | 1.24 | 1.81 | 1.24 | 1.89 | 0.92 | 1.24 | 1.87 | 1.24 | 1.87 | 1.25 | 1.88 | 0.63 |
-
BP: bisphosphonate; CCI: Charlson Comorbidity Index; PCP: primary care physician; SD: standard deviation.
Appendix 2—table 41
Antidiabetic Non-user Cohort (Region=New York State) by BP Use, Patient Characteristics Pre/Post Match of BP Users/Non-users.
| Region=NY Antidiabetic Non-users by BP: Unmatched | Region=NY Antidiabetic Non-users by BP: Matched | |||||||||||||
|---|---|---|---|---|---|---|---|---|---|---|---|---|---|---|
| All | BP Non-user | BP User | p-value | All | BP Non-user | BP User | p-value | |||||||
| N | % | N | % | N | % | N | % | N | % | N | % | |||
| All Patients | 104,691 | 100.0% | 95,416 | 91.1% | 9,275 | 8.9% | 18,288 | 100.0% | 9,144 | 50.0% | 9,144 | 50.0% | ||
| Age | ||||||||||||||
| ≤20 | 455 | 0.4% | 455 | 0.5% | 0 | 0.0% | <0.001 | 0 | 0.0% | 0 | 0.0% | 0 | 0.0% | 1.00 |
| 21-40 | 6,164 | 5.9% | 6,146 | 6.4% | 18 | 0.2% | 36 | 0.2% | 18 | 0.2% | 18 | 0.2% | ||
| 41-50 | 10,440 | 10.0% | 10,367 | 10.9% | 73 | 0.8% | 147 | 0.8% | 74 | 0.8% | 73 | 0.8% | ||
| 51-60 | 24,369 | 23.3% | 23,304 | 24.4% | 1,065 | 11.5% | 2,128 | 11.6% | 1,064 | 11.6% | 1,064 | 11.6% | ||
| 61-70 | 28,819 | 27.5% | 25,720 | 27.0% | 3,099 | 33.4% | 6,190 | 33.8% | 3,097 | 33.9% | 3,093 | 33.8% | ||
| 71-80 | 24,311 | 23.2% | 20,826 | 21.8% | 3,485 | 37.6% | 6,839 | 37.4% | 3,419 | 37.4% | 3,420 | 37.4% | ||
| ≥81 | 10,133 | 9.7% | 8,598 | 9.0% | 1,535 | 16.5% | 2,948 | 16.1% | 1,472 | 16.1% | 1,476 | 16.1% | ||
| Gender | ||||||||||||||
| Female | 60,467 | 57.8% | 52,194 | 54.7% | 8,273 | 89.2% | <0.001 | 16,291 | 89.1% | 8,146 | 89.1% | 8,145 | 89.1% | 0.98 |
| Male | 44,224 | 42.2% | 43,222 | 45.3% | 1,002 | 10.8% | 1,997 | 10.9% | 998 | 10.9% | 999 | 10.9% | ||
| Insurance | ||||||||||||||
| Commercial | 32,100 | 30.7% | 31,095 | 32.6% | 1,005 | 10.8% | <0.001 | 2,002 | 10.9% | 1,000 | 10.9% | 1,002 | 11.0% | 1.00 |
| Dual | 2,196 | 2.1% | 1,675 | 1.8% | 521 | 5.6% | 1,006 | 5.5% | 502 | 5.5% | 504 | 5.5% | ||
| Medicaid | 27,925 | 26.7% | 25,530 | 26.8% | 2,395 | 25.8% | 4,575 | 25.0% | 2,289 | 25.0% | 2,286 | 25.0% | ||
| Medicare | 42,470 | 40.6% | 37,116 | 38.9% | 5,354 | 57.7% | 10,705 | 58.5% | 5,353 | 58.5% | 5,352 | 58.5% | ||
| PCP Visit 2019 | ||||||||||||||
| No | 37,106 | 35.4% | 34,553 | 36.2% | 2,553 | 27.5% | <0.001 | 5,039 | 27.6% | 2,518 | 27.5% | 2,521 | 27.6% | 0.96 |
| Yes | 67,585 | 64.6% | 60,863 | 63.8% | 6,722 | 72.5% | 13,249 | 72.4% | 6,626 | 72.5% | 6,623 | 72.4% | ||
| Continuous Outcomes | ||||||||||||||
| mean | SD | mean | SD | mean | SD | p-value | mean | SD | mean | SD | mean | SD | p-value | |
| CCI | 1.32 | 1.79 | 1.32 | 1.79 | 1.37 | 1.81 | 0.007 | 1.37 | 1.78 | 1.36 | 1.78 | 1.37 | 1.79 | 0.92 |
-
BP: bisphosphonate; CCI: Charlson Comorbidity Index; PCP: primary care physician; SD: standard deviation.
Appendix 2—table 42
Antidepressant Cohort (All Regions), Patient Characteristics Pre/Post Match.
| All Observations by Antidepressant Use: Unmatched | All Observations by Antidepressant Use: Matched | |||||||||||||
|---|---|---|---|---|---|---|---|---|---|---|---|---|---|---|
| All | DEPR Non-users | DEPR Users | p-value | All | DEPR Non-users | DEPR Users | p-value | |||||||
| N | % | N | % | N | % | N | % | N | % | N | % | |||
| All Patients | 7,906,603 | 100.0% | 6,335,598 | 80.1% | 1,571,005 | 19.9% | 3,072,096 | 100.0% | 1,536,048 | 50.0% | 1,536,048 | 50.0% | ||
| Age | ||||||||||||||
| ≤20 | 1,840,050 | 23.3% | 1,750,435 | 27.6% | 89,615 | 5.7% | <0.001 | 179,136 | 5.8% | 89,565 | 5.8% | 89,571 | 5.8% | 1.00 |
| 21-40 | 1,446,999 | 18.3% | 1,128,316 | 17.8% | 318,683 | 20.3% | 631,186 | 20.5% | 315,593 | 20.5% | 315,593 | 20.5% | ||
| 41-50 | 925,309 | 11.7% | 683,455 | 10.8% | 241,854 | 15.4% | 466,681 | 15.2% | 233,336 | 15.2% | 233,345 | 15.2% | ||
| 51-60 | 1,250,190 | 15.8% | 899,512 | 14.2% | 350,678 | 22.3% | 667,305 | 21.7% | 333,650 | 21.7% | 333,655 | 21.7% | ||
| 61-70 | 1,181,261 | 14.9% | 879,560 | 13.9% | 301,701 | 19.2% | 592,345 | 19.3% | 296,182 | 19.3% | 296,163 | 19.3% | ||
| 71-80 | 783,775 | 9.9% | 613,922 | 9.7% | 169,853 | 10.8% | 338,594 | 11.0% | 169,295 | 11.0% | 169,299 | 11.0% | ||
| ≥81 | 479,019 | 6.1% | 380,398 | 6.0% | 98,621 | 6.3% | 196,849 | 6.4% | 98,427 | 6.4% | 98,422 | 6.4% | ||
| Gender | ||||||||||||||
| Female | 4,670,960 | 59.1% | 3,527,859 | 55.7% | 1,143,101 | 72.8% | <0.001 | 2,219,179 | 72.2% | 1,109,580 | 72.2% | 1,109,599 | 72.2% | 0.98 |
| Male | 3,235,643 | 40.9% | 2,807,739 | 44.3% | 427,904 | 27.2% | 852,917 | 27.8% | 426,468 | 27.8% | 426,449 | 27.8% | ||
| Region | ||||||||||||||
| Midwest | 1,467,802 | 18.6% | 1,120,969 | 17.7% | 346,833 | 22.1% | <0.001 | 671,016 | 21.8% | 335,508 | 21.8% | 335,508 | 21.8% | 1.00 |
| Northeast | 2,152,560 | 27.2% | 1,765,134 | 27.9% | 387,426 | 24.7% | 766,046 | 24.9% | 383,023 | 24.9% | 383,023 | 24.9% | ||
| South | 3,042,604 | 38.5% | 2,428,383 | 38.3% | 614,221 | 39.1% | 1,192,058 | 38.8% | 596,029 | 38.8% | 596,029 | 38.8% | ||
| West | 1,243,637 | 15.7% | 1,021,112 | 16.1% | 222,525 | 14.2% | 442,976 | 14.4% | 221,488 | 14.4% | 221,488 | 14.4% | ||
| Insurance | ||||||||||||||
| Commercial | 3,938,603 | 49.8% | 3,230,475 | 51.0% | 708,128 | 45.1% | <0.001 | 1,415,351 | 46.1% | 707,675 | 46.1% | 707,676 | 46.1% | 1.00 |
| Dual | 156,497 | 2.0% | 94,682 | 1.5% | 61,815 | 3.9% | 109,676 | 3.6% | 54,836 | 3.6% | 54,840 | 3.6% | ||
| Medicaid | 2,594,500 | 32.8% | 2,083,688 | 32.9% | 510,812 | 32.5% | 972,897 | 31.7% | 486,446 | 31.7% | 486,451 | 31.7% | ||
| Medicare | 1,217,003 | 15.4% | 926,753 | 14.6% | 290,250 | 18.5% | 574,172 | 18.7% | 287,091 | 18.7% | 287,081 | 18.7% | ||
| PCP Visit 2019 | ||||||||||||||
| No | 4,283,697 | 54.2% | 3,672,879 | 58.0% | 610,818 | 38.9% | <0.001 | 1,210,520 | 39.4% | 605,256 | 39.4% | 605,264 | 39.4% | 0.99 |
| Yes | 3,622,906 | 45.8% | 2,662,719 | 42.0% | 960,187 | 61.1% | 1,861,576 | 60.6% | 930,792 | 60.6% | 930,784 | 60.6% | ||
| Continuous Outcomes | ||||||||||||||
| mean | SD | mean | SD | mean | SD | p-value | mean | SD | mean | SD | mean | SD | p-value | |
| CCI | 0.62 | 1.38 | 0.55 | 1.29 | 0.90 | 1.65 | <0.001 | 0.87 | 1.60 | 0.87 | 1.60 | 0.87 | 1.60 | 0.98 |
-
CCI: Charlson Comorbidity Index; DEPR: antidepressant; PCP: primary care physician; SD: standard deviation.
Appendix 2—table 43
Antidepressant Cohort (Region=New York State), Patient Characteristics Pre/Post Match.
| Region=NY by Antidepressant Use: Unmatched | Region=NY by Antidepressant Use: Matched | |||||||||||||
|---|---|---|---|---|---|---|---|---|---|---|---|---|---|---|
| All | DEPR Non-users | DEPR Users | p-value | All | DEPR Non-users | DEPR Users | p-value | |||||||
| N | % | N | % | N | % | N | % | N | % | N | % | |||
| All Patients | 968,296 | 100.0% | 832,215 | 85.9% | 136,081 | 14.1% | 271,032 | 100.0% | 135,516 | 50.0% | 135,516 | 50.0% | ||
| Age | ||||||||||||||
| ≤20 | 133,178 | 13.8% | 128,810 | 15.5% | 4,368 | 3.2% | <0.001 | 8,728 | 3.2% | 4,365 | 3.2% | 4,363 | 3.2% | 1.00 |
| 21-40 | 192,959 | 19.9% | 170,076 | 20.4% | 22,883 | 16.8% | 45,666 | 16.8% | 22,832 | 16.8% | 22,834 | 16.8% | ||
| 41-50 | 127,794 | 13.2% | 109,184 | 13.1% | 18,610 | 13.7% | 36,965 | 13.6% | 18,483 | 13.6% | 18,482 | 13.6% | ||
| 51-60 | 172,444 | 17.8% | 142,702 | 17.1% | 29,742 | 21.9% | 58,966 | 21.8% | 29,481 | 21.8% | 29,485 | 21.8% | ||
| 61-70 | 159,912 | 16.5% | 132,317 | 15.9% | 27,595 | 20.3% | 55,083 | 20.3% | 27,543 | 20.3% | 27,540 | 20.3% | ||
| 71-80 | 120,117 | 12.4% | 99,040 | 11.9% | 21,077 | 15.5% | 42,076 | 15.5% | 21,038 | 15.5% | 21,038 | 15.5% | ||
| ≥81 | 61,892 | 6.4% | 50,086 | 6.0% | 11,806 | 8.7% | 23,548 | 8.7% | 11,774 | 8.7% | 11,774 | 8.7% | ||
| Gender | ||||||||||||||
| Female | 573,610 | 59.2% | 476,684 | 57.3% | 96,926 | 71.2% | <0.001 | 192,930 | 71.2% | 96,468 | 71.2% | 96,462 | 71.2% | 0.98 |
| Male | 394,686 | 40.8% | 355,531 | 42.7% | 39,155 | 28.8% | 78,102 | 28.8% | 39,048 | 28.8% | 39,054 | 28.8% | ||
| Insurance | ||||||||||||||
| Commercial | 500,918 | 51.7% | 449,071 | 54.0% | 51,847 | 38.1% | <0.001 | 103,658 | 38.2% | 51,829 | 38.2% | 51,829 | 38.2% | 1.00 |
| Dual | 6,814 | 0.7% | 5,072 | 0.6% | 1,742 | 1.3% | 3,191 | 1.2% | 1,591 | 1.2% | 1,600 | 1.2% | ||
| Medicaid | 252,366 | 26.1% | 213,705 | 25.7% | 38,661 | 28.4% | 77,136 | 28.5% | 38,569 | 28.5% | 38,567 | 28.5% | ||
| Medicare | 208,198 | 21.5% | 164,367 | 19.8% | 43,831 | 32.2% | 87,047 | 32.1% | 43,527 | 32.1% | 43,520 | 32.1% | ||
| PCP Visit 2019 | ||||||||||||||
| No | 521,282 | 53.8% | 467,739 | 56.2% | 53,543 | 39.3% | <0.001 | 106,797 | 39.4% | 53,397 | 39.4% | 53,400 | 39.4% | 0.99 |
| Yes | 447,014 | 46.2% | 364,476 | 43.8% | 82,538 | 60.7% | 164,235 | 60.6% | 82,119 | 60.6% | 82,116 | 60.6% | ||
| Continuous Outcomes | ||||||||||||||
| mean | SD | mean | SD | mean | SD | p-value | mean | SD | mean | SD | mean | SD | p-value | |
| CCI | 0.65 | 1.39 | 0.59 | 1.32 | 0.98 | 1.71 | <0.001 | 0.96 | 1.68 | 0.96 | 1.68 | 0.96 | 1.68 | 0.99 |
-
CCI: Charlson Comorbidity Index; DEPR: antidepressant; PCP: primary care physician; SD: standard deviation.
Appendix 2—table 44
Antidepressant User Cohort (All Regions) by BP Use, Patient Characteristics Pre/Post Match of BP Users/Non-users.
| All Antidepressant Users by BP: Unmatched | All Antidepressant Users by BP: Matched | |||||||||||||
|---|---|---|---|---|---|---|---|---|---|---|---|---|---|---|
| All | BP Non-user | BP User | p-value | All | BP Non-user | BP User | p-value | |||||||
| N | % | N | % | N | % | N | % | N | % | N | % | |||
| All Patients | 1,536,048 | 100.0% | 1,390,939 | 90.6% | 145,109 | 9.4% | 288,564 | 100.0% | 144,282 | 50.0% | 144,282 | 50.0% | ||
| Age | ||||||||||||||
| ≤20 | 89,571 | 5.8% | 89,415 | 6.4% | 156 | 0.1% | <0.001 | 313 | 0.1% | 157 | 0.1% | 156 | 0.1% | 1.00 |
| 21-40 | 315,593 | 20.5% | 314,429 | 22.6% | 1,164 | 0.8% | 2,326 | 0.8% | 1,162 | 0.8% | 1,164 | 0.8% | ||
| 41-50 | 233,345 | 15.2% | 229,878 | 16.5% | 3,467 | 2.4% | 6,933 | 2.4% | 3,467 | 2.4% | 3,466 | 2.4% | ||
| 51-60 | 333,655 | 21.7% | 310,316 | 22.3% | 23,339 | 16.1% | 46,674 | 16.2% | 23,339 | 16.2% | 23,335 | 16.2% | ||
| 61-70 | 296,163 | 19.3% | 244,247 | 17.6% | 51,916 | 35.8% | 103,798 | 36.0% | 51,905 | 36.0% | 51,893 | 36.0% | ||
| 71-80 | 169,299 | 11.0% | 126,089 | 9.1% | 43,210 | 29.8% | 85,292 | 29.6% | 42,643 | 29.6% | 42,649 | 29.6% | ||
| ≥81 | 98,422 | 6.4% | 76,565 | 5.5% | 21,857 | 15.1% | 43,228 | 15.0% | 21,609 | 15.0% | 21,619 | 15.0% | ||
| Gender | ||||||||||||||
| Female | 1,109,599 | 72.2% | 976,214 | 70.2% | 133,385 | 91.9% | <0.001 | 265,123 | 91.9% | 132,553 | 91.9% | 132,570 | 91.9% | 0.91 |
| Male | 426,449 | 27.8% | 414,725 | 29.8% | 11,724 | 8.1% | 23,441 | 8.1% | 11,729 | 8.1% | 11,712 | 8.1% | ||
| Region | ||||||||||||||
| Midwest | 335,508 | 21.8% | 309,597 | 22.3% | 25,911 | 17.9% | <0.001 | 51,754 | 17.9% | 25,877 | 17.9% | 25,877 | 17.9% | 1.00 |
| Northeast | 383,023 | 24.9% | 347,944 | 25.0% | 35,079 | 24.2% | 70,010 | 24.3% | 35,005 | 24.3% | 35,005 | 24.3% | ||
| South | 596,029 | 38.8% | 540,382 | 38.9% | 55,647 | 38.3% | 110,518 | 38.3% | 55,259 | 38.3% | 55,259 | 38.3% | ||
| West | 221,488 | 14.4% | 193,016 | 13.9% | 28,472 | 19.6% | 56,282 | 19.5% | 28,141 | 19.5% | 28,141 | 19.5% | ||
| Insurance | ||||||||||||||
| Commercial | 707,676 | 46.1% | 664,625 | 47.8% | 43,051 | 29.7% | <0.001 | 86,053 | 29.8% | 43,023 | 29.8% | 43,030 | 29.8% | 1.00 |
| Dual | 54,840 | 3.6% | 43,171 | 3.1% | 11,669 | 8.0% | 22,384 | 7.8% | 11,193 | 7.8% | 11,191 | 7.8% | ||
| Medicaid | 486,451 | 31.7% | 457,656 | 32.9% | 28,795 | 19.8% | 56,959 | 19.7% | 28,479 | 19.7% | 28,480 | 19.7% | ||
| Medicare | 287,081 | 18.7% | 225,487 | 16.2% | 61,594 | 42.4% | 123,168 | 42.7% | 61,587 | 42.7% | 61,581 | 42.7% | ||
| PCP Visit 2019 | ||||||||||||||
| No | 605,264 | 39.4% | 553,886 | 39.8% | 51,378 | 35.4% | <0.001 | 102,148 | 35.4% | 51,064 | 35.4% | 51,084 | 35.4% | 0.94 |
| Yes | 930,784 | 60.6% | 837,053 | 60.2% | 93,731 | 64.6% | 186,416 | 64.6% | 93,218 | 64.6% | 93,198 | 64.6% | ||
| Continuous Outcomes | ||||||||||||||
| mean | SD | mean | SD | mean | SD | p-value | mean | SD | mean | SD | mean | SD | p-value | |
| CCI | 0.87 | 1.60 | 0.84 | 1.58 | 1.09 | 1.81 | <0.001 | 1.09 | 1.79 | 1.08 | 1.78 | 1.09 | 1.79 | 0.56 |
-
BP: bisphosphonate; CCI: Charlson Comorbidity Index; PCP: primary care physician; SD: standard deviation.
Appendix 2—table 45
Antidepressant User Cohort (Region=New York State) by BP Use, Patient Characteristics Pre/Post Match of BP Users/Non-users.
| Region=NY Antidepressant Users by BP: Unmatched | Region=NY Antidepressant Users by BP: Matched | |||||||||||||
|---|---|---|---|---|---|---|---|---|---|---|---|---|---|---|
| All | BP Non-user | BP User | p-value | All | BP Non-user | BP User | p-value | |||||||
| N | % | N | % | N | % | N | % | N | % | N | % | |||
| All Patients | 135,516 | 100.0% | 122,566 | 90.4% | 12,950 | 9.6% | 25,718 | 100.0% | 12,859 | 50.0% | 12,859 | 50.0% | ||
| Age | ||||||||||||||
| ≤20 | 4,363 | 3.2% | 4,357 | 3.6% | 6 | 0.0% | <0.001 | 12 | 0.0% | 6 | 0.0% | 6 | 0.0% | 1.00 |
| 21-40 | 22,834 | 16.8% | 22,770 | 18.6% | 64 | 0.5% | 126 | 0.5% | 62 | 0.5% | 64 | 0.5% | ||
| 41-50 | 18,482 | 13.6% | 18,263 | 14.9% | 219 | 1.7% | 440 | 1.7% | 221 | 1.7% | 219 | 1.7% | ||
| 51-60 | 29,485 | 21.8% | 27,702 | 22.6% | 1,783 | 13.8% | 3,570 | 13.9% | 1,788 | 13.9% | 1,782 | 13.9% | ||
| 61-70 | 27,540 | 20.3% | 23,385 | 19.1% | 4,155 | 32.1% | 8,292 | 32.2% | 4,146 | 32.2% | 4,146 | 32.2% | ||
| 71-80 | 21,038 | 15.5% | 16,548 | 13.5% | 4,490 | 34.7% | 8,863 | 34.5% | 4,430 | 34.5% | 4,433 | 34.5% | ||
| ≥81 | 11,774 | 8.7% | 9,541 | 7.8% | 2,233 | 17.2% | 4,415 | 17.2% | 2,206 | 17.2% | 2,209 | 17.2% | ||
| Gender | ||||||||||||||
| Female | 96,462 | 71.2% | 84,469 | 68.9% | 11,993 | 92.6% | <0.001 | 23,810 | 92.6% | 11,906 | 92.6% | 11,904 | 92.6% | 0.96 |
| Male | 39,054 | 28.8% | 38,097 | 31.1% | 957 | 7.4% | 1,908 | 7.4% | 953 | 7.4% | 955 | 7.4% | ||
| Insurance | ||||||||||||||
| Commercial | 51,829 | 38.2% | 49,332 | 40.2% | 2,497 | 19.3% | <0.001 | 4,991 | 19.4% | 2,495 | 19.4% | 2,496 | 19.4% | 1.00 |
| Dual | 1,600 | 1.2% | 1,221 | 1.0% | 379 | 2.9% | 710 | 2.8% | 356 | 2.8% | 354 | 2.8% | ||
| Medicaid | 38,567 | 28.5% | 36,366 | 29.7% | 2,201 | 17.0% | 4,269 | 16.6% | 2,131 | 16.6% | 2,138 | 16.6% | ||
| Medicare | 43,520 | 32.1% | 35,647 | 29.1% | 7,873 | 60.8% | 15,748 | 61.2% | 7,877 | 61.3% | 7,871 | 61.2% | ||
| PCP Visit 2019 | ||||||||||||||
| No | 53,400 | 39.4% | 48,911 | 39.9% | 4,489 | 34.7% | <0.001 | 8,901 | 34.6% | 4,449 | 34.6% | 4,452 | 34.6% | 0.97 |
| Yes | 82,116 | 60.6% | 73,655 | 60.1% | 8,461 | 65.3% | 16,817 | 65.4% | 8,410 | 65.4% | 8,407 | 65.4% | ||
| Continuous Outcomes | ||||||||||||||
| mean | SD | mean | SD | mean | SD | p-value | mean | SD | mean | SD | mean | SD | p-value | |
| CCI | 0.96 | 1.68 | 0.95 | 1.66 | 1.13 | 1.78 | <0.001 | 1.12 | 1.76 | 1.12 | 1.75 | 1.12 | 1.77 | 0.86 |
-
BP: bisphosphonate; CCI: Charlson Comorbidity Index; PCP: primary care physician; SD: standard deviation.
Appendix 2—table 46
Antidepressant Non-user Cohort (All Regions) by BP Use, Patient Characteristics Pre/Post Match of BP Users/Non-users.
| All Antidepressant Non-users by BP: Unmatched | All Antidepressant Non-users by BP: Matched | |||||||||||||
|---|---|---|---|---|---|---|---|---|---|---|---|---|---|---|
| All | BP Non-user | BP User | p-value | All | BP Non-user | BP User | p-value | |||||||
| N | % | N | % | N | % | N | % | N | % | N | % | |||
| All Patients | 1,536,048 | 100.0% | 1,422,938 | 92.6% | 113,110 | 7.4% | 224,804 | 100.0% | 112,402 | 50.0% | 112,402 | 50.0% | ||
| Age | ||||||||||||||
| ≤20 | 89,565 | 5.8% | 89,486 | 6.3% | 79 | 0.1% | <0.001 | 155 | 0.1% | 76 | 0.1% | 79 | 0.1% | 1.00 |
| 21-40 | 315,593 | 20.5% | 314,815 | 22.1% | 778 | 0.7% | 1,562 | 0.7% | 784 | 0.7% | 778 | 0.7% | ||
| 41-50 | 233,336 | 15.2% | 230,961 | 16.2% | 2,375 | 2.1% | 4,746 | 2.1% | 2,371 | 2.1% | 2,375 | 2.1% | ||
| 51-60 | 333,650 | 21.7% | 314,109 | 22.1% | 19,541 | 17.3% | 39,072 | 17.4% | 19,536 | 17.4% | 19,536 | 17.4% | ||
| 61-70 | 296,182 | 19.3% | 254,286 | 17.9% | 41,896 | 37.0% | 83,664 | 37.2% | 41,834 | 37.2% | 41,830 | 37.2% | ||
| 71-80 | 169,295 | 11.0% | 136,746 | 9.6% | 32,549 | 28.8% | 64,163 | 28.5% | 32,073 | 28.5% | 32,090 | 28.5% | ||
| ≥81 | 98,427 | 6.4% | 82,535 | 5.8% | 15,892 | 14.1% | 31,442 | 14.0% | 15,728 | 14.0% | 15,714 | 14.0% | ||
| Gender | ||||||||||||||
| Female | 1,109,580 | 72.2% | 1,004,112 | 70.6% | 105,468 | 93.2% | <0.001 | 209,510 | 93.2% | 104,743 | 93.2% | 104,767 | 93.2% | 0.84 |
| Male | 426,468 | 27.8% | 418,826 | 29.4% | 7,642 | 6.8% | 15,294 | 6.8% | 7,659 | 6.8% | 7,635 | 6.8% | ||
| Region | ||||||||||||||
| Midwest | 335,508 | 21.8% | 315,179 | 22.1% | 20,329 | 18.0% | <0.001 | 40,548 | 18.0% | 20,274 | 18.0% | 20,274 | 18.0% | 1.00 |
| Northeast | 383,023 | 24.9% | 356,184 | 25.0% | 26,839 | 23.7% | 53,590 | 23.8% | 26,795 | 23.8% | 26,795 | 23.8% | ||
| South | 596,029 | 38.8% | 552,754 | 38.8% | 43,275 | 38.3% | 85,440 | 38.0% | 42,720 | 38.0% | 42,720 | 38.0% | ||
| West | 221,488 | 14.4% | 198,821 | 14.0% | 22,667 | 20.0% | 45,226 | 20.1% | 22,613 | 20.1% | 22,613 | 20.1% | ||
| Insurance | ||||||||||||||
| Commercial | 707,675 | 46.1% | 672,990 | 47.3% | 34,685 | 30.7% | <0.001 | 69,354 | 30.9% | 34,675 | 30.8% | 34,679 | 30.9% | 1.00 |
| Dual | 54,836 | 3.6% | 44,281 | 3.1% | 10,555 | 9.3% | 19,871 | 8.8% | 9,927 | 8.8% | 9,944 | 8.8% | ||
| Medicaid | 486,446 | 31.7% | 463,857 | 32.6% | 22,589 | 20.0% | 45,057 | 20.0% | 22,537 | 20.1% | 22,520 | 20.0% | ||
| Medicare | 287,091 | 18.7% | 241,810 | 17.0% | 45,281 | 40.0% | 90,522 | 40.3% | 45,263 | 40.3% | 45,259 | 40.3% | ||
| PCP Visit 2019 | ||||||||||||||
| No | 605,256 | 39.4% | 572,701 | 40.2% | 32,555 | 28.8% | <0.001 | 64,959 | 28.9% | 32,483 | 28.9% | 32,476 | 28.9% | 0.97 |
| Yes | 930,792 | 60.6% | 850,237 | 59.8% | 80,555 | 71.2% | 159,845 | 71.1% | 79,919 | 71.1% | 79,926 | 71.1% | ||
| Continuous Outcomes | ||||||||||||||
| mean | SD | mean | SD | mean | SD | p-value | mean | SD | mean | SD | mean | SD | p-value | |
| CCI | 0.87 | 1.60 | 0.85 | 1.58 | 1.06 | 1.84 | <0.001 | 1.06 | 1.82 | 1.05 | 1.81 | 1.06 | 1.83 | 0.57 |
-
BP: bisphosphonate; CCI: Charlson Comorbidity Index; PCP: primary care physician; SD: standard deviation.
Appendix 2—table 47
Antidepressant Non-user Cohort (Region=New York State) by BP Use, Patient Characteristics Pre/Post Match of BP Users/Non-users.
| Region=NY Antidepressant Non-users by BP: Unadjusted | Region=NY Antidepressant Non-users by BP: Matched | |||||||||||||
|---|---|---|---|---|---|---|---|---|---|---|---|---|---|---|
| All | BP Non-user | BP User | p-value | All | BP Non-user | BP User | p-value | |||||||
| N | % | N | % | N | % | N | % | N | % | N | % | |||
| All Patients | 135,516 | 100.0% | 125,342 | 92.5% | 10,174 | 7.5% | 20,182 | 100.0% | 10,091 | 50.0% | 10,091 | 50.0% | ||
| Age | ||||||||||||||
| ≤20 | 4,365 | 3.2% | 4,364 | 3.5% | 1 | 0.0% | <0.001 | 2 | 0.0% | 1 | 0.0% | 1 | 0.0% | 1.00 |
| 21-40 | 22,832 | 16.8% | 22,799 | 18.2% | 33 | 0.3% | 66 | 0.3% | 33 | 0.3% | 33 | 0.3% | ||
| 41-50 | 18,483 | 13.6% | 18,350 | 14.6% | 133 | 1.3% | 267 | 1.3% | 134 | 1.3% | 133 | 1.3% | ||
| 51-60 | 29,481 | 21.8% | 28,038 | 22.4% | 1,443 | 14.2% | 2,879 | 14.3% | 1,440 | 14.3% | 1,439 | 14.3% | ||
| 61-70 | 27,543 | 20.3% | 24,197 | 19.3% | 3,346 | 32.9% | 6,686 | 33.1% | 3,345 | 33.1% | 3,341 | 33.1% | ||
| 71-80 | 21,038 | 15.5% | 17,695 | 14.1% | 3,343 | 32.9% | 6,589 | 32.6% | 3,294 | 32.6% | 3,295 | 32.7% | ||
| ≥81 | 11,774 | 8.7% | 9,899 | 7.9% | 1,875 | 18.4% | 3,693 | 18.3% | 1,844 | 18.3% | 1,849 | 18.3% | ||
| Gender | ||||||||||||||
| Female | 96,468 | 71.2% | 86,945 | 69.4% | 9,523 | 93.6% | <0.001 | 18,892 | 93.6% | 9,446 | 93.6% | 9,446 | 93.6% | 1.00 |
| Male | 39,048 | 28.8% | 38,397 | 30.6% | 651 | 6.4% | 1,290 | 6.4% | 645 | 6.4% | 645 | 6.4% | ||
| Insurance | ||||||||||||||
| Commercial | 51,829 | 38.2% | 50,405 | 40.2% | 1,424 | 14.0% | <0.001 | 2,848 | 14.1% | 1,425 | 14.1% | 1,423 | 14.1% | 1.00 |
| Dual | 1,591 | 1.2% | 1,210 | 1.0% | 381 | 3.7% | 690 | 3.4% | 345 | 3.4% | 345 | 3.4% | ||
| Medicaid | 38,569 | 28.5% | 36,303 | 29.0% | 2,266 | 22.3% | 4,449 | 22.0% | 2,226 | 22.1% | 2,223 | 22.0% | ||
| Medicare | 43,527 | 32.1% | 37,424 | 29.9% | 6,103 | 60.0% | 12,195 | 60.4% | 6,095 | 60.4% | 6,100 | 60.4% | ||
| PCP Visit 2019 | ||||||||||||||
| No | 53,397 | 39.4% | 50,515 | 40.3% | 2,882 | 28.3% | <0.001 | 5,723 | 28.4% | 2,863 | 28.4% | 2,860 | 28.3% | 0.96 |
| Yes | 82,119 | 60.6% | 74,827 | 59.7% | 7,292 | 71.7% | 14,459 | 71.6% | 7,228 | 71.6% | 7,231 | 71.7% | ||
| Continuous Outcomes | ||||||||||||||
| mean | SD | mean | SD | mean | SD | p-value | mean | SD | mean | SD | mean | SD | p-value | |
| CCI | 0.96 | 1.68 | 0.95 | 1.66 | 1.13 | 1.81 | <0.001 | 1.11 | 1.77 | 1.11 | 1.76 | 1.12 | 1.78 | 0.78 |
-
BP: bisphosphonate; CCI: Charlson Comorbidity Index; PCP: primary care physician; SD: standard deviation.
Appendix 3—table 1
Patient Count Distribution Inclusive of Deceased Enrolees.
| All Observations | All Bone Health Rx Users(“Bone-Rx”) | |||
|---|---|---|---|---|
| BP Users | BP Non-users | BP Users | BP Non-users | |
| Total (N) | 672,913 | 10,978,373 | 645,118 | 75,195 |
| Deceased (N) [any reason] | 7,364 | 101,282 | 6,922 | 2,450 |
| COVID-19 Dx (N) | 7,927 | 519,387 | 7,527 | 3,201 |
| COVID-19 Dx (%) | 1.2% | 4.7% | 1.2% | 4.3% |
| COVID-19 Dx & Deceased (N) | 431 | 15,470 | 410 | 215 |
| COVID-19 Dx & Deceased (%) | 5.4% | 3.0% | 5.4% | 6.7% |
-
Dx: diagnosis.
Appendix 3—table 2
Unadjusted Chi-Square Comparison Inclusive of Deceased Patients.
| All Observations (with deceased) | “Bone-Rx” Observations (with deceased) | |||
|---|---|---|---|---|
| COVID-19 Dx | No COVID-19 Dx | COVID-19 Dx | No COVID-19 Dx | |
| BP users | 7,927 | 664,986 | 7,527 | 637,591 |
| BP Non-users | 519,387 | 10,458,986 | 2,450 | 71,994 |
| Odds Ratio | 0.24 | Odds Ratio | 0.35 | |
| 95 % CI: | 0.2347 to 0.2455 | 95 % CI: | 0.3312 to 0.3633 | |
| p-value | P < 0.0001 | p-value | P < 0.0001 | |
-
BP: bisphosphonate; CI: confidence interval; Dx: diagnosis.
Appendix 3—table 3
Unadjusted Chi-Square Comparison with Deceased Patients Removed.
| All Observations (without deceased) | “Bone-Rx” Observations (without deceased) | |||
|---|---|---|---|---|
| COVID-19 Dx | No COVID-19 Dx | COVID-19 Dx | No COVID-19 Dx | |
| BP users | 7,496 | 657,622 | 7,117 | 630,669 |
| BP Non-users | 503,917 | 10,357,704 | 2,986 | 69,544 |
| Odds Ratio | 0.23 | Odds Ratio | 0.26 | |
| 95 % CI: | 0.2290–0.2397 | 95 % CI: | 0.2516–0.2745 | |
| p-value | P<0.0001 | p-value | P<0.0001 | |
-
BP: bisphosphonate; CI: confidence interval; Dx: diagnosis.
Appendix 3—table 4
Unadjusted Chi-Square Comparison Assuming all Deceased Patients had COVID-19.
| All Observations (assume deceased = COVID-19) | “Bone-Rx” Observations (assume deceased = COVID-19) | |||
|---|---|---|---|---|
| COVID-19 Dx | No COVID-19 Dx | COVID-19 Dx | No COVID-19 Dx | |
| BP users | 14,860 | 658,053 | 14,039 | 631,079 |
| BP Non-users | 605,199 | 10,373,174 | 5,436 | 69,759 |
| Odds Ratio | 0.39 | Odds Ratio | 0.29 | |
| 95 % CI: | 0.3807–0.3935 | 95 % CI: | 0.2764–0.2948 | |
| p-value | P<0.0001 | p-value | P<0.0001 | |
-
BP: bisphosphonate; CI: confidence interval; Dx: diagnosis.
Appendix 3—table 5
Unadjusted Chi-Square Comparison to Yield Odds Ratio = 1.00 (no difference).
| All Observations (assume deceased = COVID-19) | “Bone-Rx” Observations (assume deceased = COVID-19) | |||
|---|---|---|---|---|
| COVID-19 Dx | No COVID-19 Dx | COVID-19 Dx | No COVID-19 Dx | |
| BP users | 37,095 | 635,818 | 46,637 | 598,481 |
| BP Non-users | 605,199 | 10,373,174 | 5,436 | 69,759 |
| Odds Ratio | 1.00 | Odds Ratio | 1.00 | |
| 95 % CI: | 0.9893–1.0108 | 95 % CI: | 0.9713–1.0296 | |
| p-value | P=0.9987 | p-value | P=0.9999 | |
-
BP: bisphosphonate; CI: confidence interval; Dx: diagnosis.
Download links
A two-part list of links to download the article, or parts of the article, in various formats.
Downloads (link to download the article as PDF)
Open citations (links to open the citations from this article in various online reference manager services)
Cite this article (links to download the citations from this article in formats compatible with various reference manager tools)
Association between bisphosphonate use and COVID-19 related outcomes
eLife 12:e79548.
https://doi.org/10.7554/eLife.79548


