Cellular features of localized microenvironments in human meniscal degeneration: a single-cell transcriptomic study
- Department of Orthopedics, Orthopedic Research Institute, West China Hospital, Sichuan University, China
- MOE Key Lab of Bioinformatics, Bioinformatics Division, BNRIST and Department of Automation, Tsinghua University, China
- School of Life Sciences and School of Medicine, Center for Synthetic and Systems Biology, Tsinghua University, China
Figures
Figure 1 with 2 supplements

Single-cell RNA-seq reveals major cell classes in human menisci.
(A) Photographs of typical normal and degenerative meniscus specimens. (B) The overall workflow of the single-cell sequencing. Inner and outer meniscal parts are collected separately from patients with normal/degenerated menisci. (C, D) Distributions of cells in the inner meniscus samples. Cells of the degeneration batches and the normal batches are integrated together. (C) Uniform manifold approximation and projection (UMAP) visualization of donor origins (inner parts). (D) UMAP visualization of the cell identity compartments (inner parts). (E) The percentages of the identified cell classes in six samples of the inner meniscus. (F, G) Distributions of cells in the outer meniscus samples. Cells of the degeneration batches and the normal batches were integrated together. UMAP visualization of the donor origins and cell identity compartments (outer parts). (H) The percentages of the classes in six samples of the outer meniscus. (I, J) The expression levels of the major class markers of the inner cells (upper) and the outer cells (lower). Darker colors indicate higher expression levels.
Figure 1—figure supplement 1
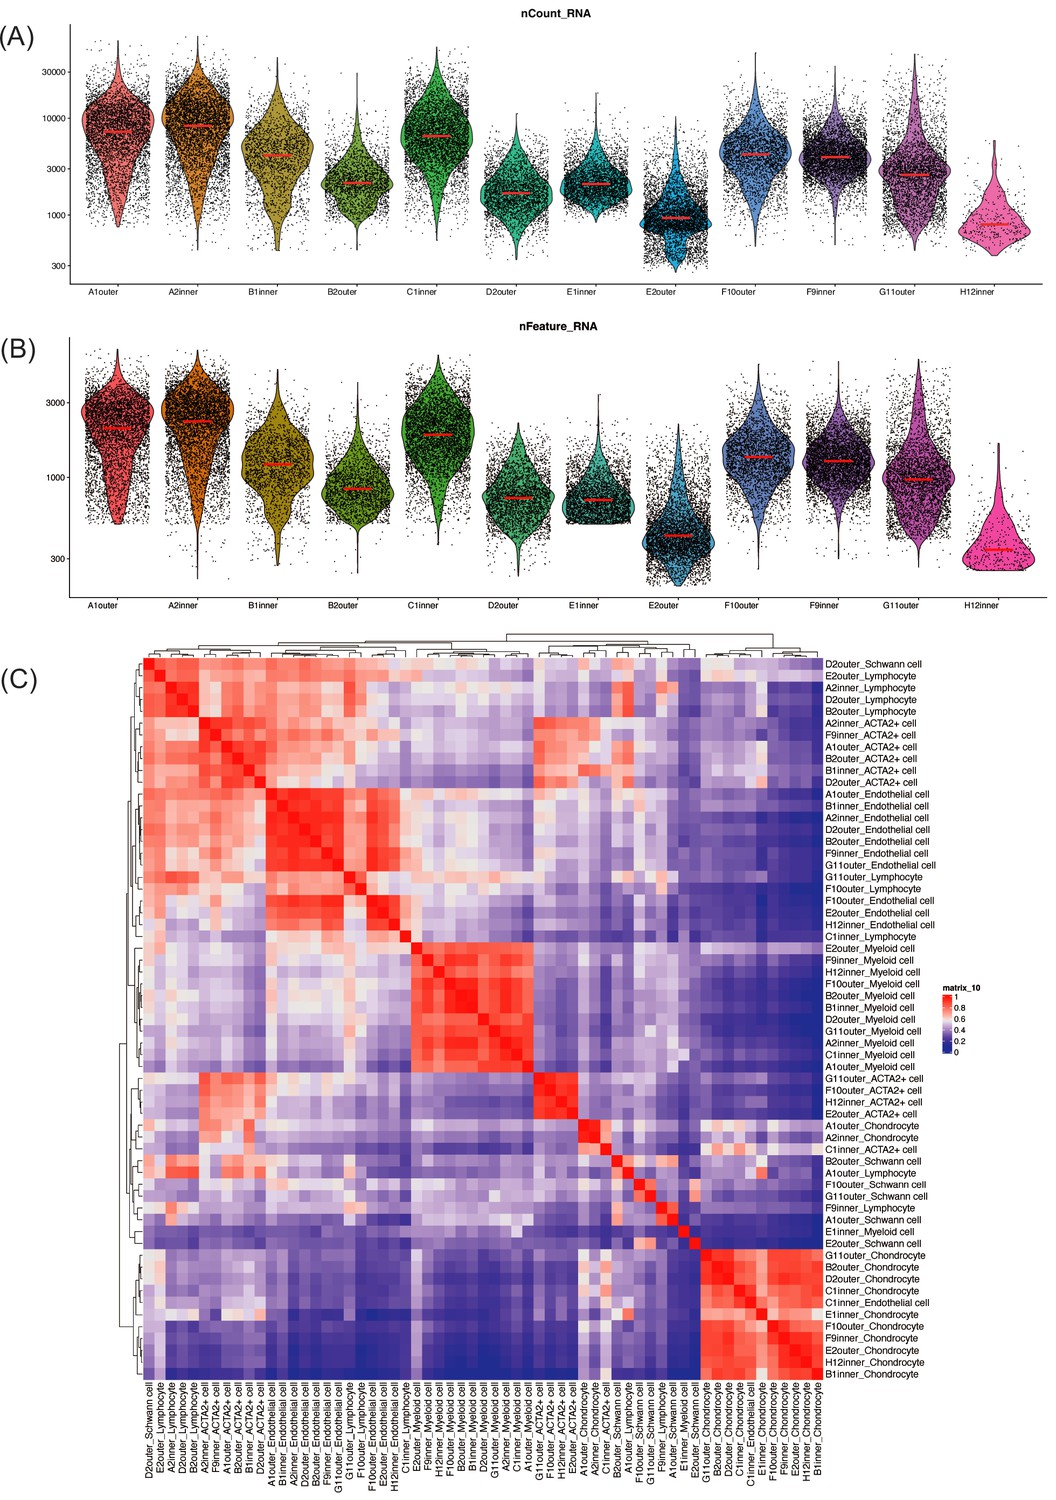
Quality control metrics for single-cell RNA sequencing.
(A) Jittered violin plots show the number of UMI counts observed per cell grouped by the sample. (B) Jittered violin plots show the number of features observed per cell grouped by the sample. (A) and (B) show that most samples have good sequencing qualities. (C) Cluster expression Pearson correlations. Similar cell types were mostly grouped together, indicating that the cell identities were properly assigned and the batch effects were not significant.
Figure 1—figure supplement 2
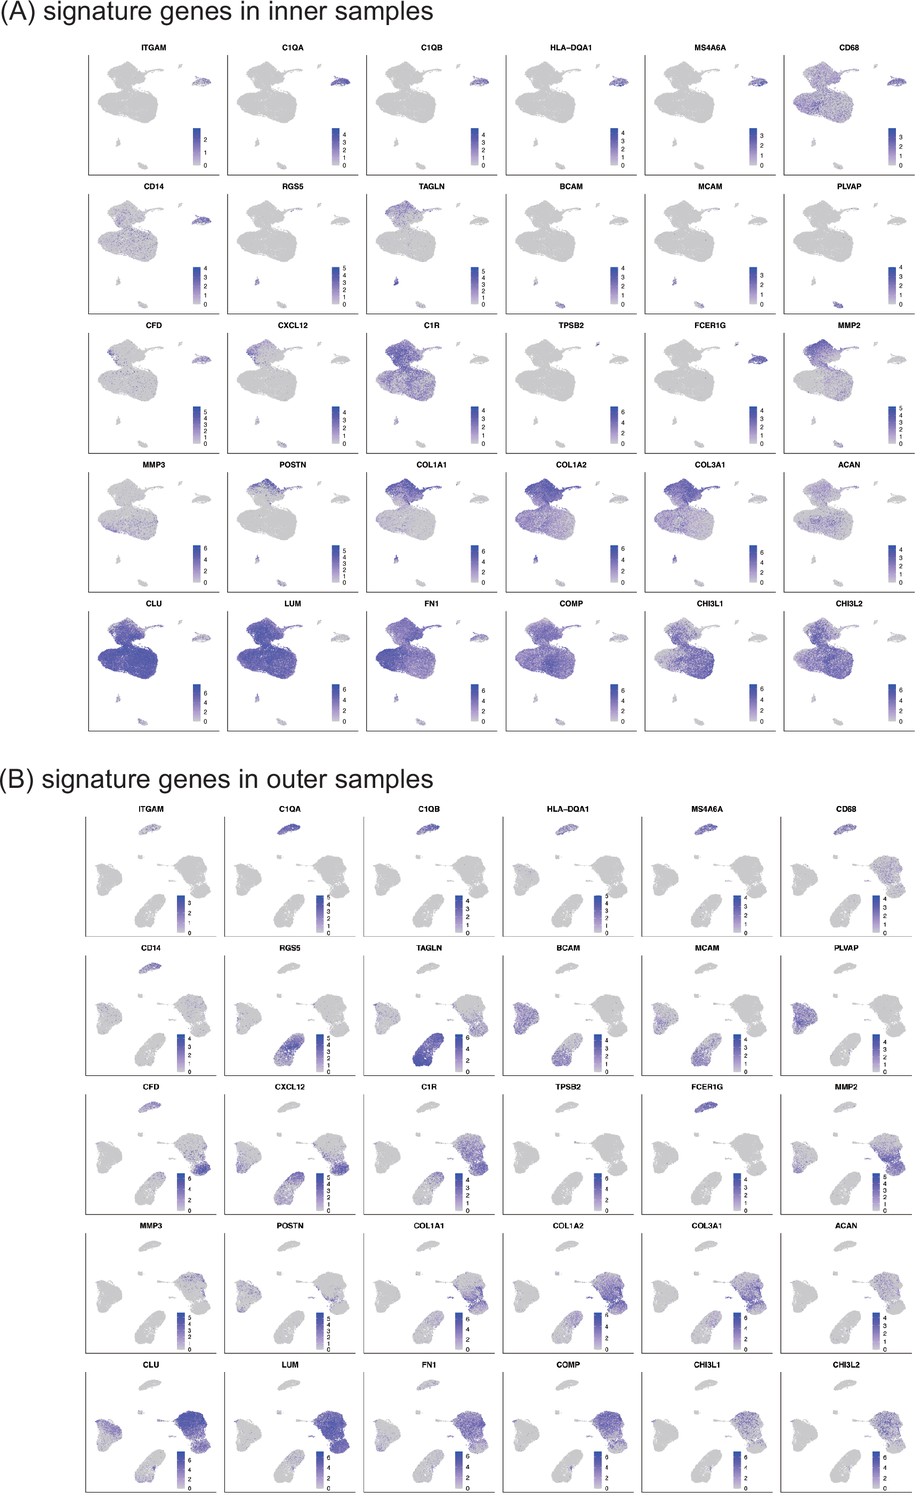
Signature genes of the large cell classes.
(A, B) The cluster marker genes expression levels are shown on the uniform manifold approximation and projection (UMAP) plots with colors. Inner samples: up; outer samples: down.
Figure 2 with 4 supplements
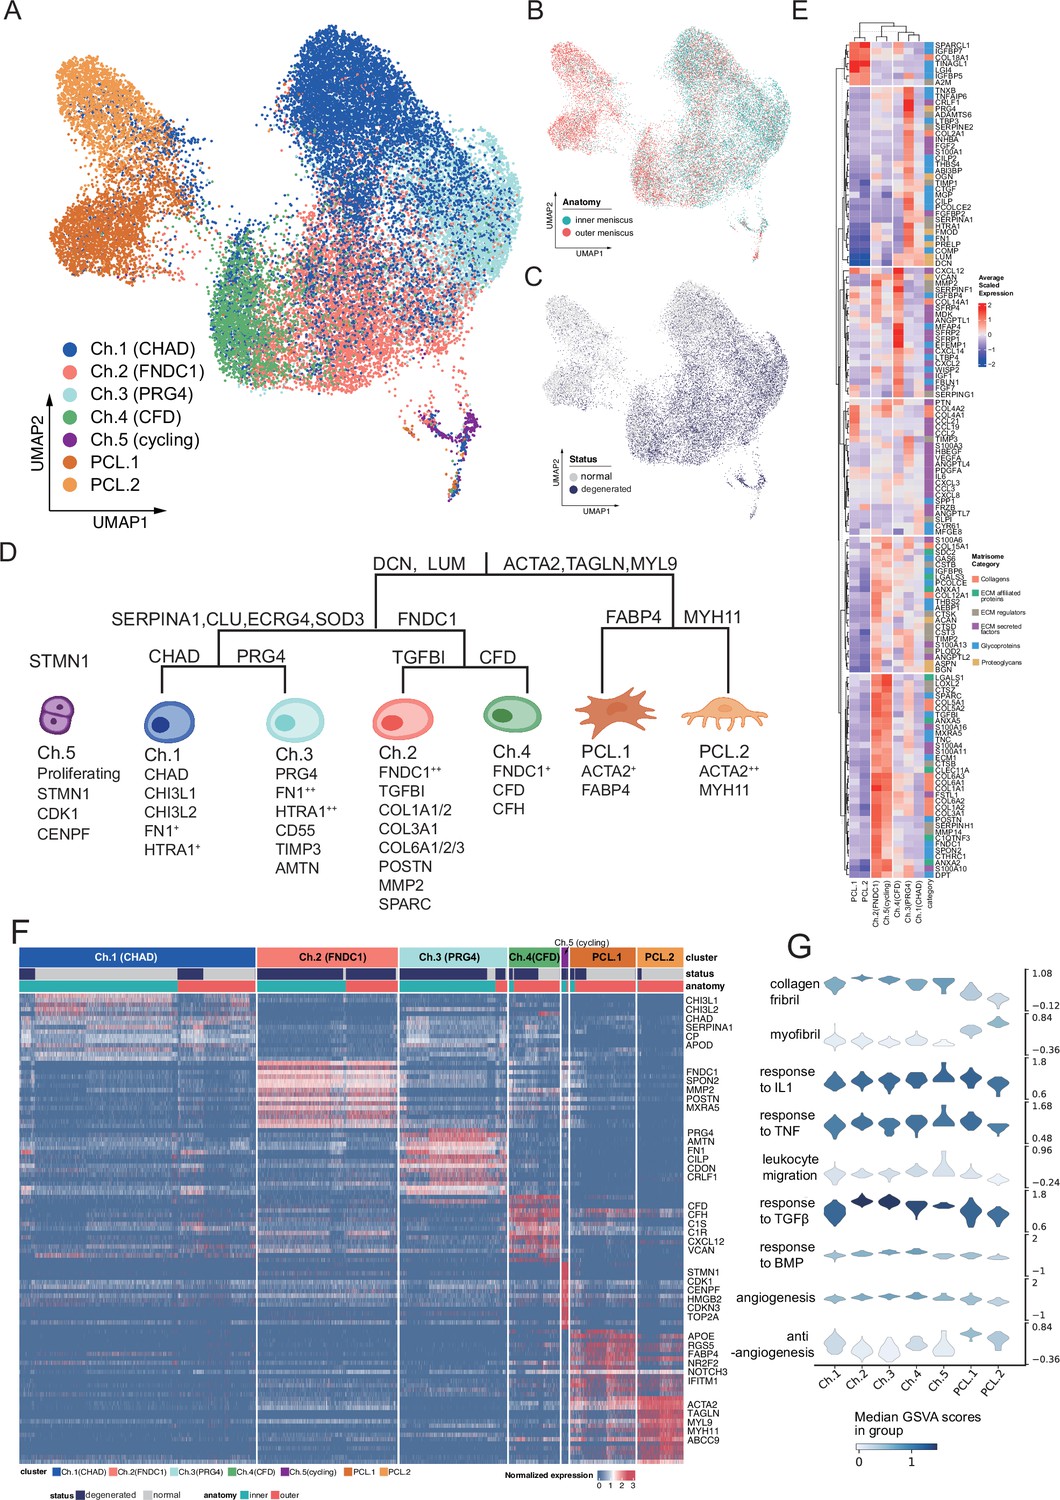
Identification of chondrocyte and PCL subclusters in human meniscus.
(A) Uniform manifold approximation and projection (UMAP) visualization of the chondrocyte and PCL class cells. (B, C) UMAP visualization of the distribution of chondrocytes at different anatomical sites (up) and different sample statuses (down). (D) A schematic diagram of the hierarchical classification of chondrocyte subgroups. The classification criteria are along the tree path, and each group’s highly expressed marker genes are given below each cluster. (E) A cluster-level heatmap shows extracellular matrix (ECM)-related gene expressions in each chondrocyte/PCL subpopulation. (F) A cell-level heatmap reveals the normalized expression of differentially expressed genes for each cluster defined in (D). (G) Violin plots score nine molecular themes of each cell type (leukocyte migration, suppression of angiogenesis, angiogenesis, response to BMP, collagen fibril, response to IL1, response to TGFβ, response to TNF, and myofibril). We calculated the scores using gene set variation analysis (GSVA) with gene sets picked from MSigDB.
Figure 2—figure supplement 1
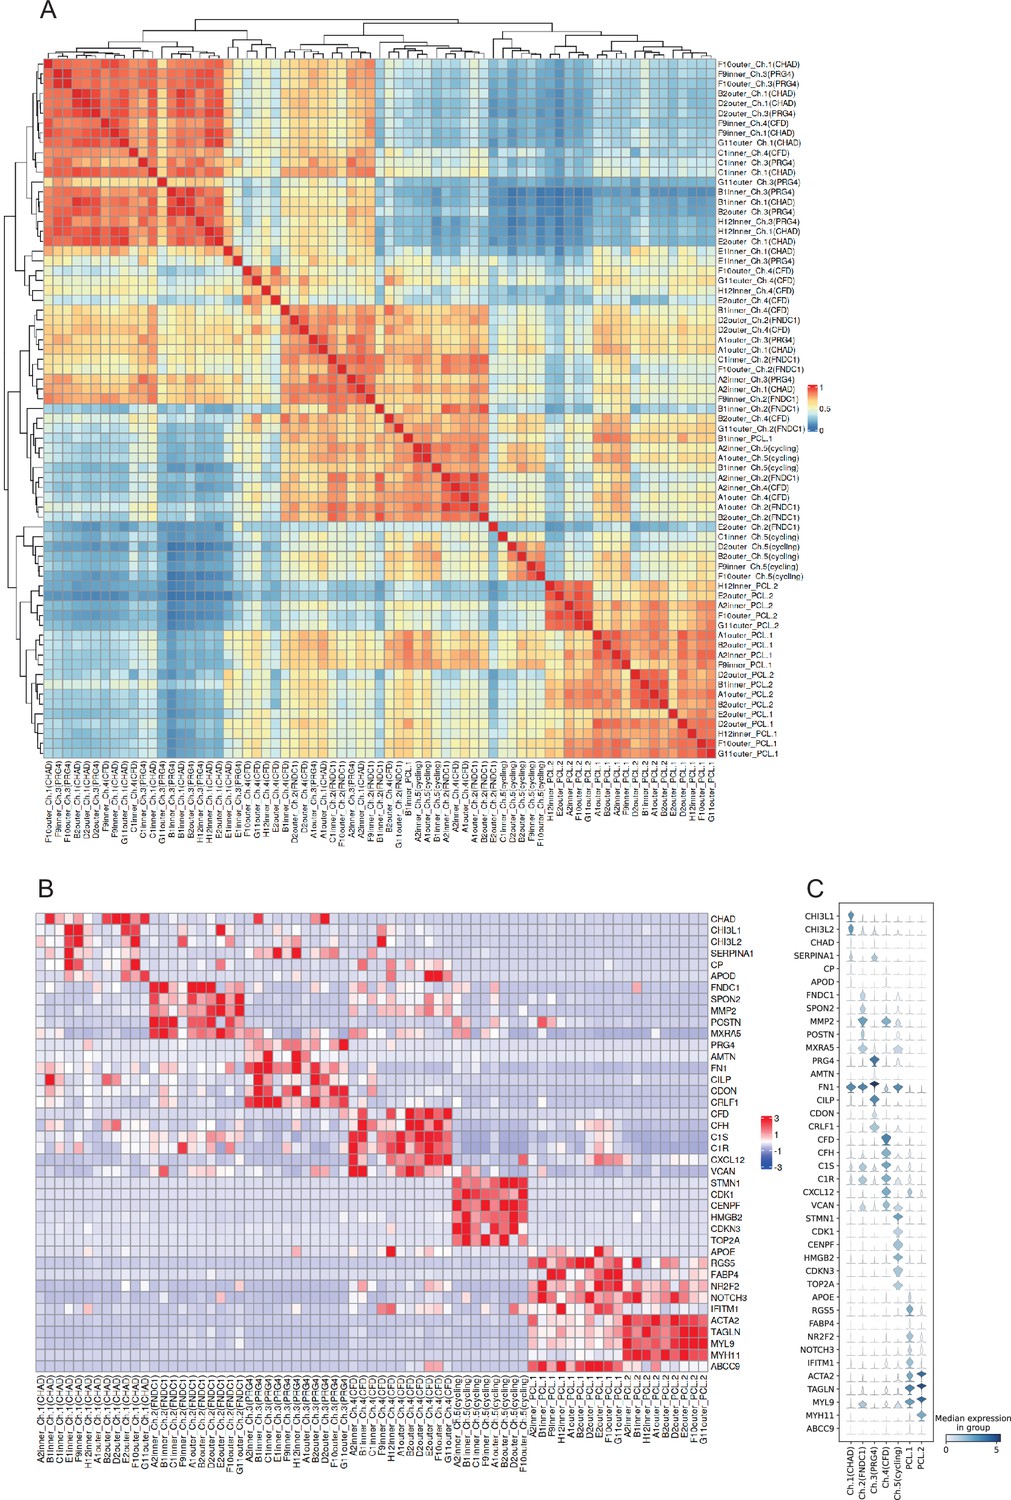
Label agreements of the chondrocyte and pericyte-like cells across samples.
(A) Pearson correlations of chondrocyte/PCL subclusters’ expression across all meniscus specimens. (B) The expressions of subcluster signatures genes across all meniscus specimens. The two heatmaps show clusters with the same name across different specimens are correlated and share similar expressions. (C) Violin plots show the marker expressions in chondrocyte and PCL subpopulations.
Figure 2—figure supplement 2
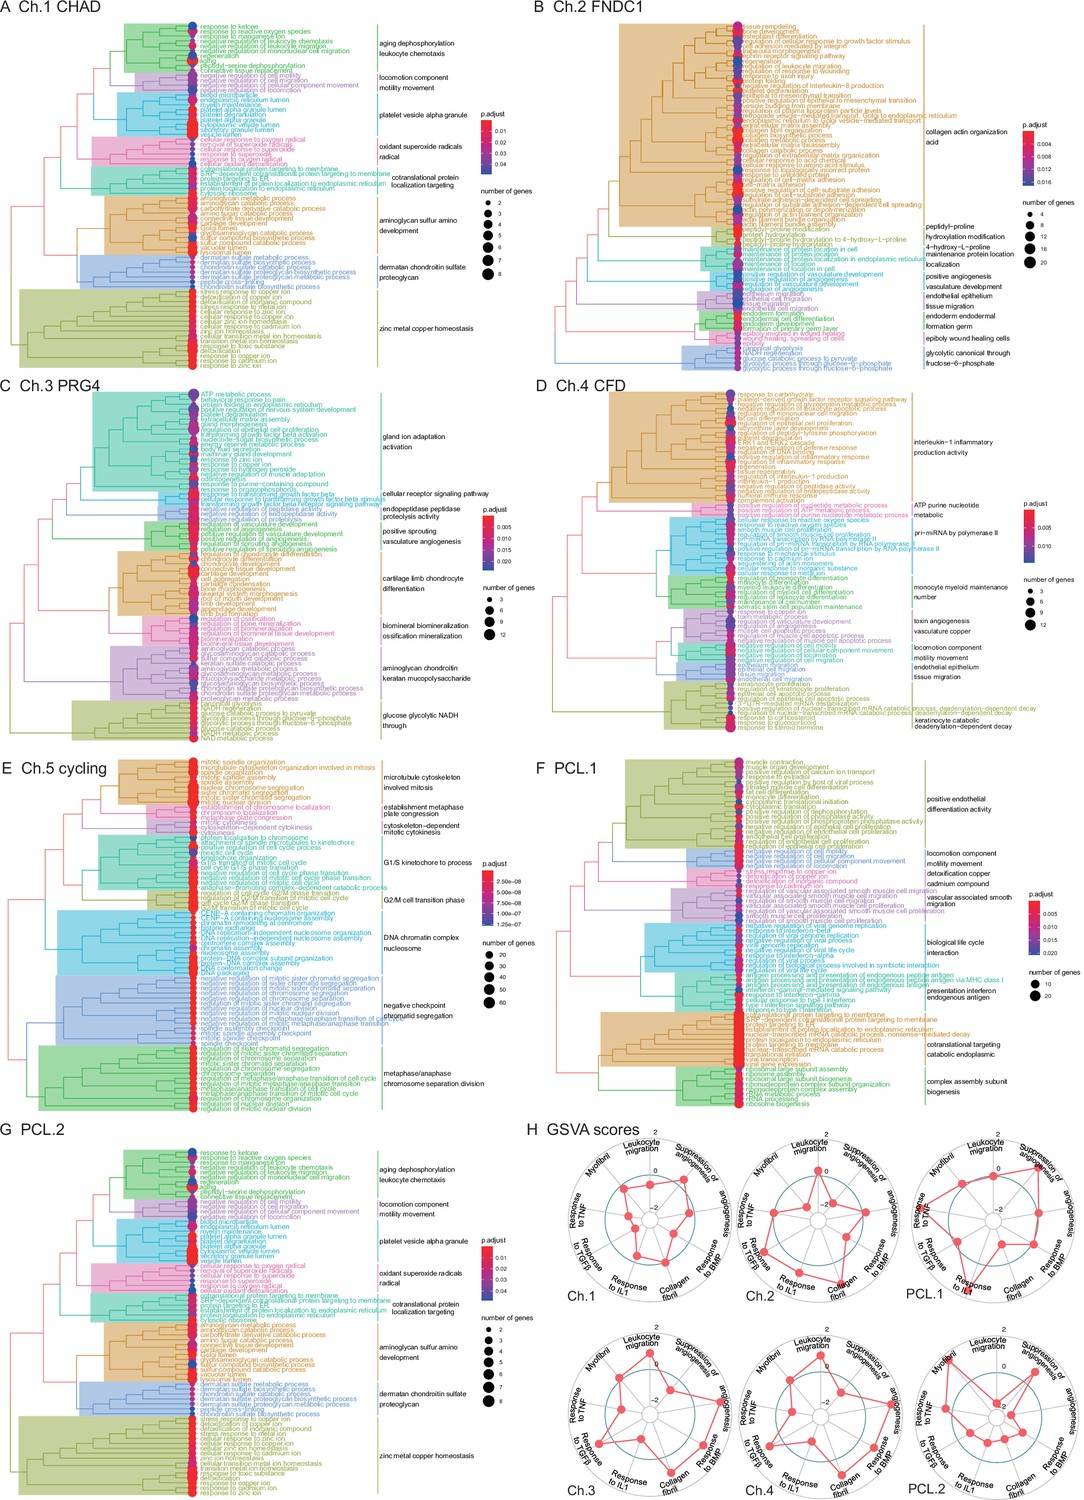
Gene ontology enrichment of chondrocyte and PCL subcluster markers.
(A–G) Pathway enrichment analysis of seven subpopulations of chondrocytes and pericyte-like cells. The gene set overrepresentation enrichment analysis (GSEA) enrichment was performed using gene set overrepresentation analysis using clusterProfiler. (H) Radar plots score nine molecular themes of each cell type (leukocyte migration, suppression of angiogenesis, angiogenesis, response to BMP, collagen fibril, response to IL1, response to TGFβ, response to TNF, and myofibril) using gene set variation analysis (GSVA).
Figure 2—figure supplement 3
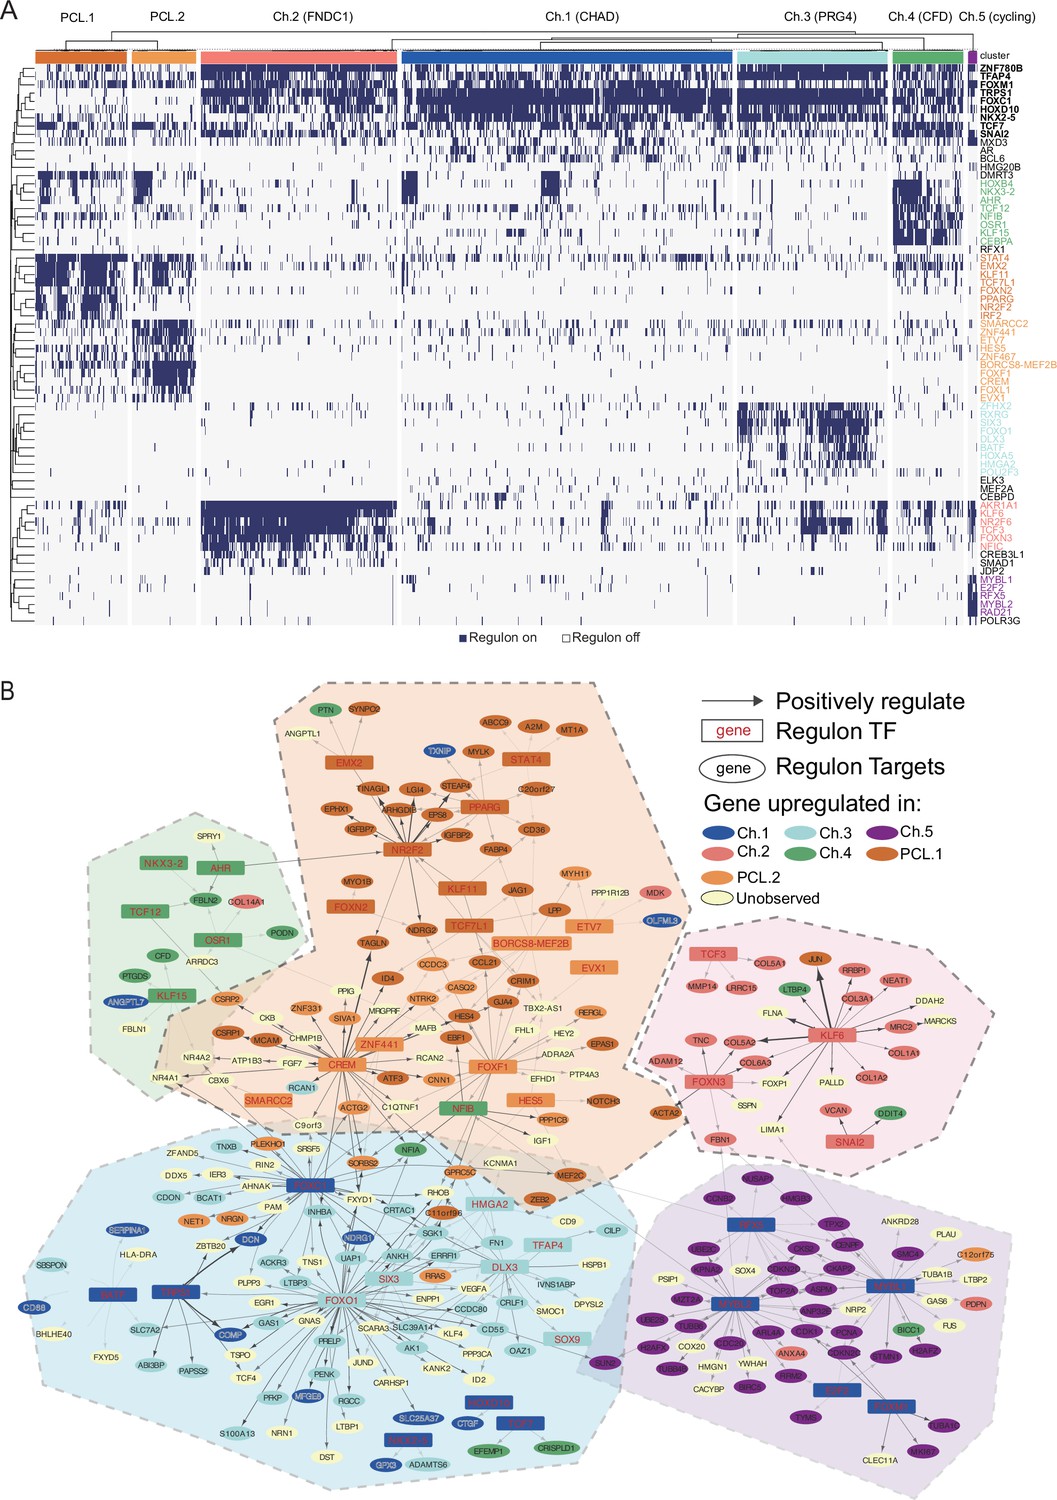
Regulons derived by pySCENIC.
(A) Binarized activity scores of GRN modules in chondrocytes and pericyte-like cells. Each row represents a GRN module, while each column represents a cell. The activation status of the module in one cell is converted to on (dark blue) and off (light gray) states and shown in the heatmap. An ‘on’ state indicates relatively high expression of a TF and its targets. (B) A core backbone network of the full gene regulatory network. A regulon module’s TF is marked in red color while the targets are in black. Arrows indicate positive regulatory relationships. A TF or target gene is grouped into a certain cell population if it is the DEGs of that population. Dashed line polygons highlight several cell-type-specific GRN cliques. GRN: gene regulatory networks; DEGs: differentially expressed genes.
Figure 2—figure supplement 4
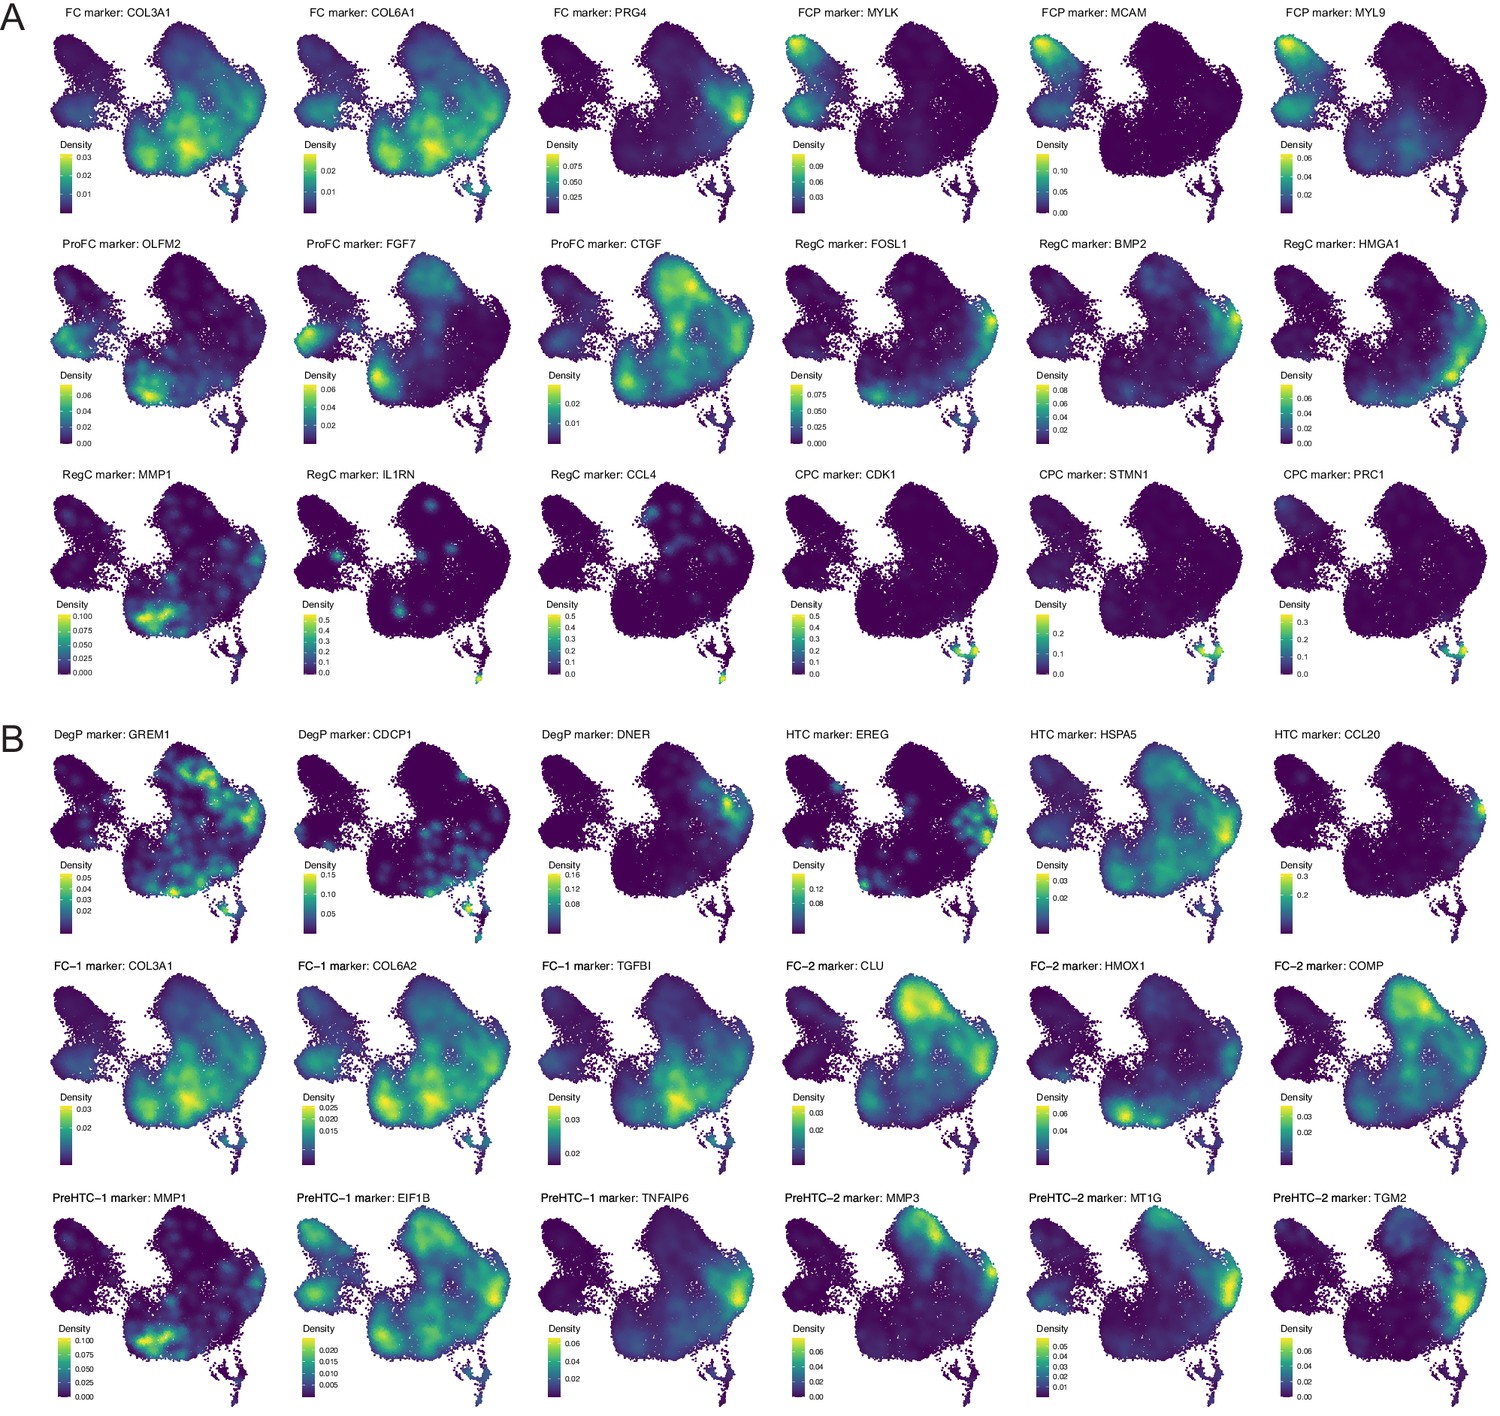
Public chondrocyte datasets reanalysis (I).
(A) GSE133449’s normal group marker genes of fibrochondrocytes (FC), regulatory chondrocytes (RegC), prehypertrophic chondrocytes (PreHTC), proliferating fibrochondrocytes (ProFC), cartilage progenitor cells (CPC), and fibrochondrocytes progenitors (FCP) on our data. (B) GSE133449’s degeneration group marker genes of degenerated progenitor (DegP), FC-2, PreHTC, ProFC, CPC, and FCP expressed on our data.
Figure 3 with 7 supplements

Degeneration molecular patterns in chondrocytes and PCLs.
(A) A volcano plot shows differentially expressed genes with high fold-change values. The comparison was made between (1) degenerated chondrocytes/PCL cells and (2) normal chondrocytes/PCL cells. (B) The proportion of each subcluster of chondrocytes in the degenerated and normal meniscus. (C–F) Gene set variation analysis (GSVA) of each cluster under degenerated/normal conditions. Gene sets supported functions are evaluated using GSVA (Methods), and scaled values are visualized in the heatmaps. We observed Ch.2 and Ch.3 had high scores for matrix disassembly activities, angiogenesis activities, chemotaxis activities, and chondrocyte hypertrophy regardless of the normal/degeneration status. The cycling chondrocytes Ch.5 have high scores in the cell-cycle-related terms.
Figure 3—figure supplement 1
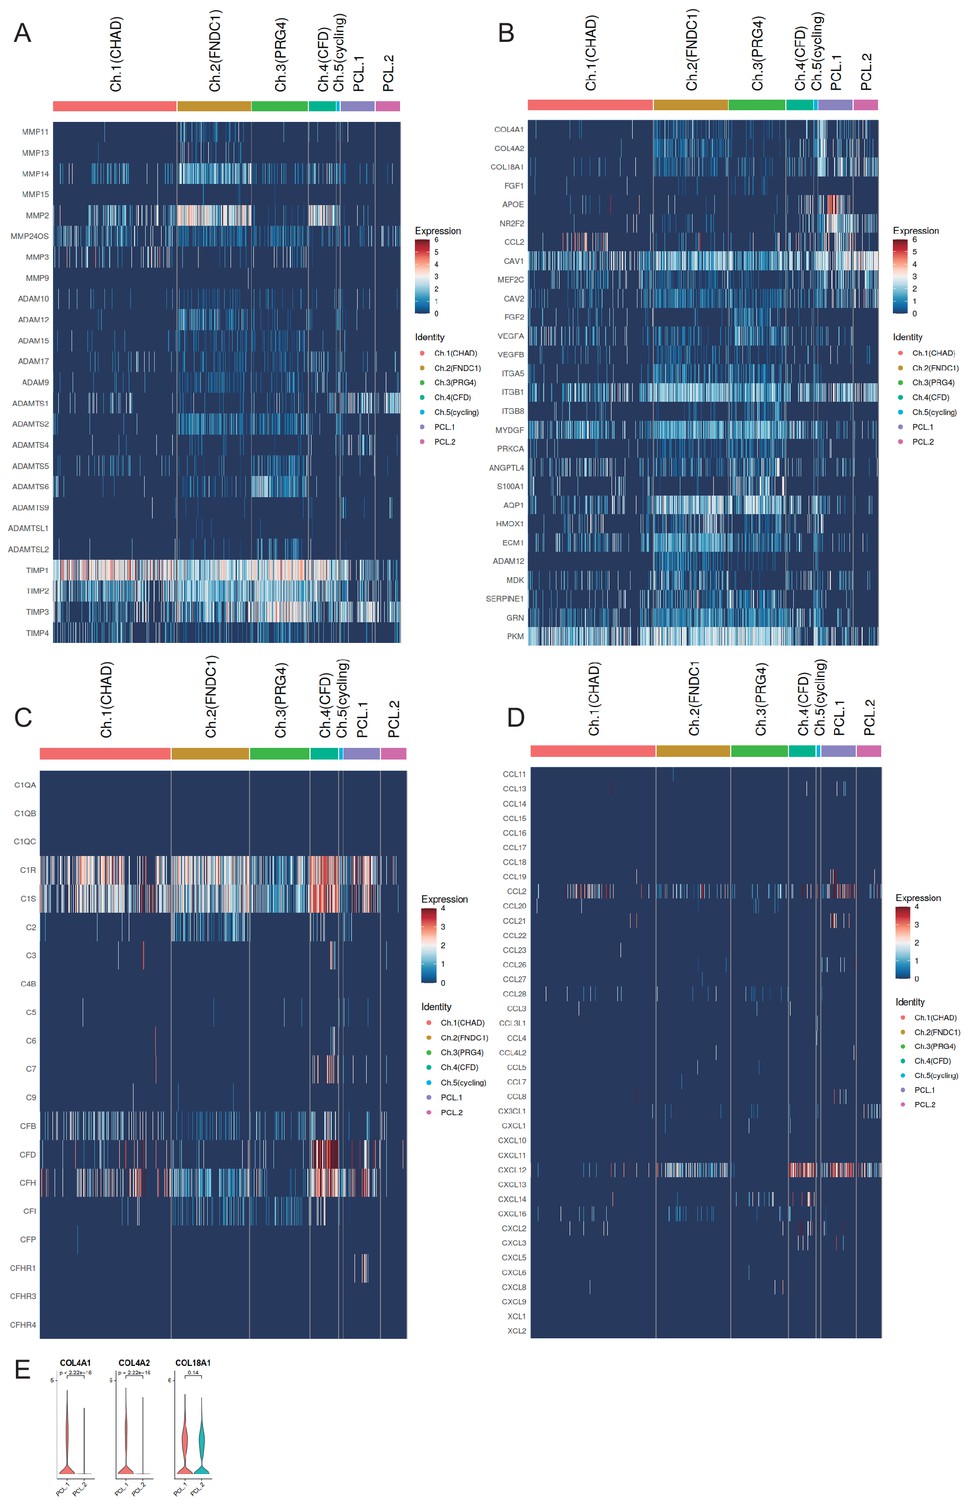
Expression levels of selected gene sets.
(A) Expression of extracellular matrix (ECM) decomposition-related genes and anti-decomposition-related genes in chondrocyte subpopulations. (B) Expression of genes associated with angiogenesis and anti-angiogenesis in chondrocytes subpopulations. (C) Expression of complement-related genes in chondrocyte subpopulations. (D) Expression of chemotaxis-related genes in chondrocyte subpopulations. (E) Differentially expressed collagen genes in PCL cells.
Figure 3—figure supplement 2
Public chondrocyte datasets reanalysis (II).
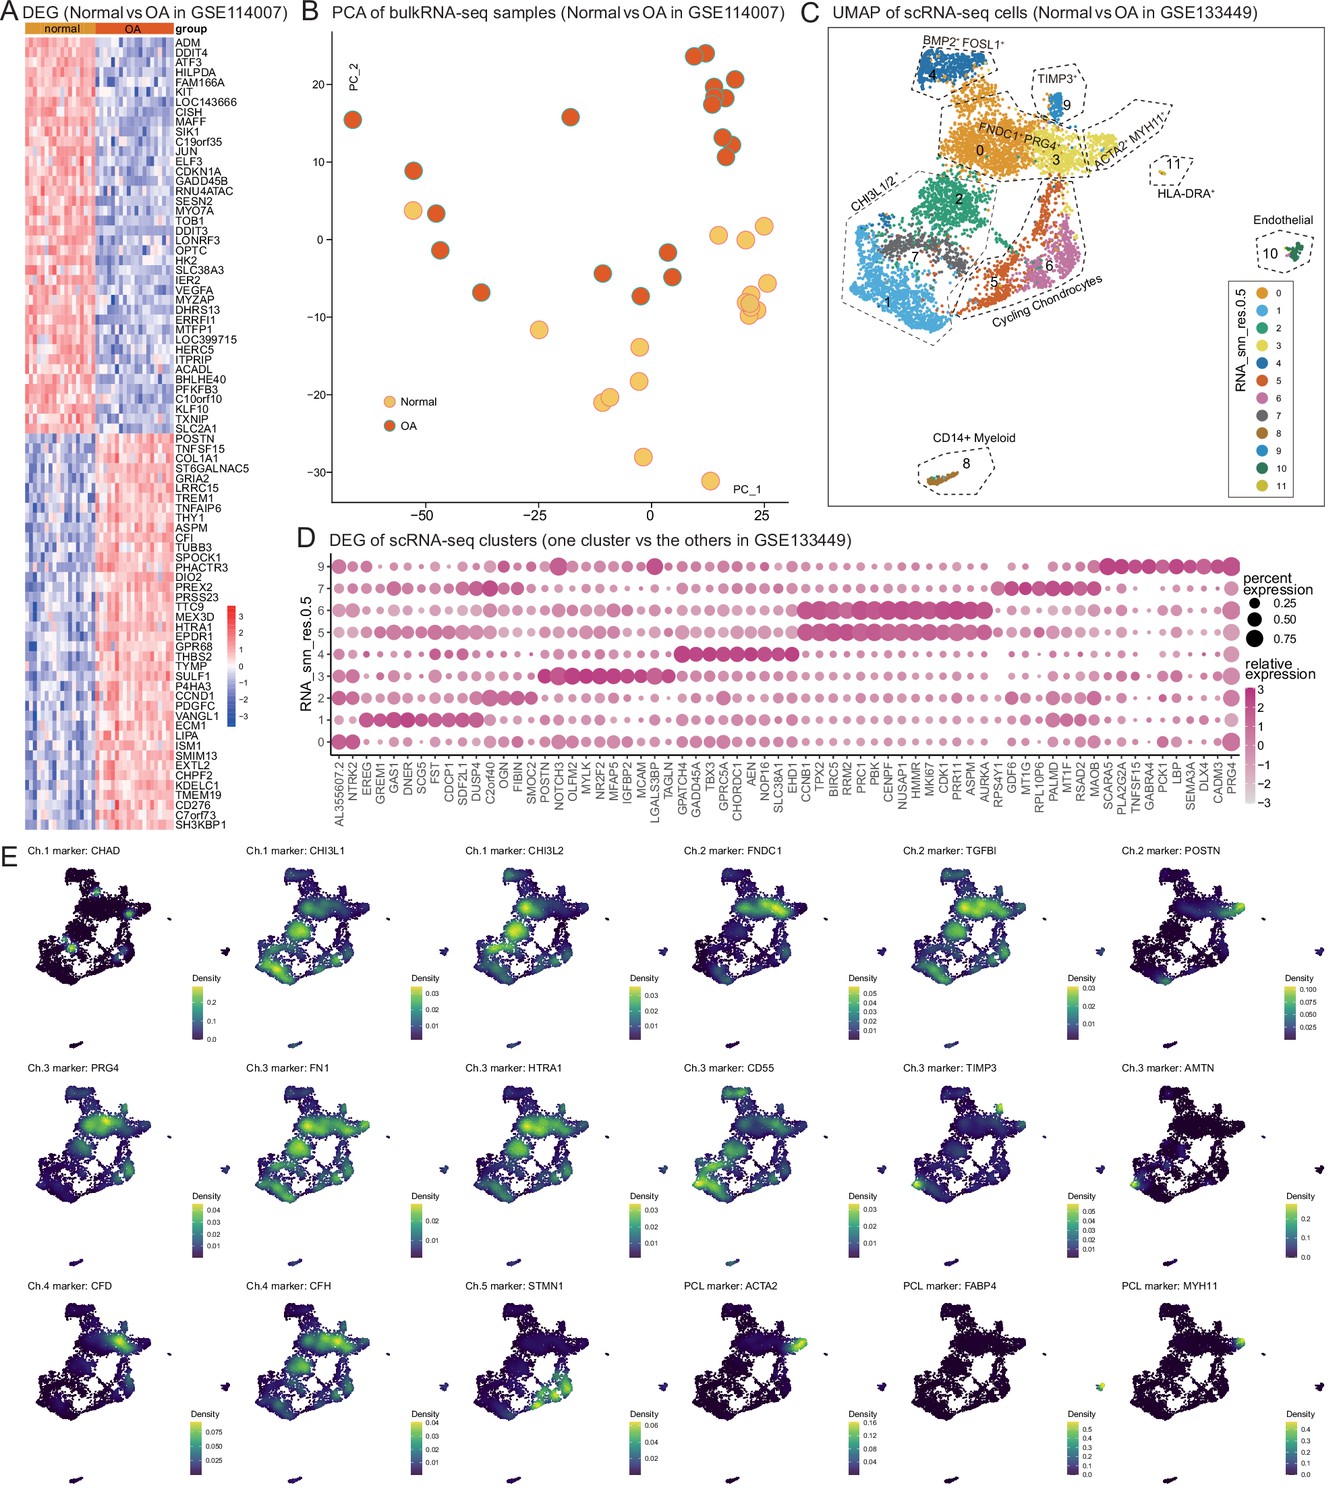
(A) Differentially expressed genes in osteoarthritis (OA). The heatmap shows the differential gene expression of articular cartilage in normal and OA states by reanalyzing public data (GSE114007). (B) PCA of the samples in (A). (C) Uniform manifold approximation and projection (UMAP) shows cell clustering results of the scRNA-seq meniscus dataset from Sun et al. (GSE133449). (D) The expression of signature genes in Figure 2 on GSE133449. Some highly expressed genes, such as CHAD were not detected on their dataset. This might be caused by different single-cell sample preparation protocols: we used the 10× Genomics platform, and they used the BD Rhapsody platform. (E) Ch.1–5 marker genes’ expressions on Sun et al.’s data.
Figure 3—figure supplement 3
Comprehensive integration of public data and in-house data.
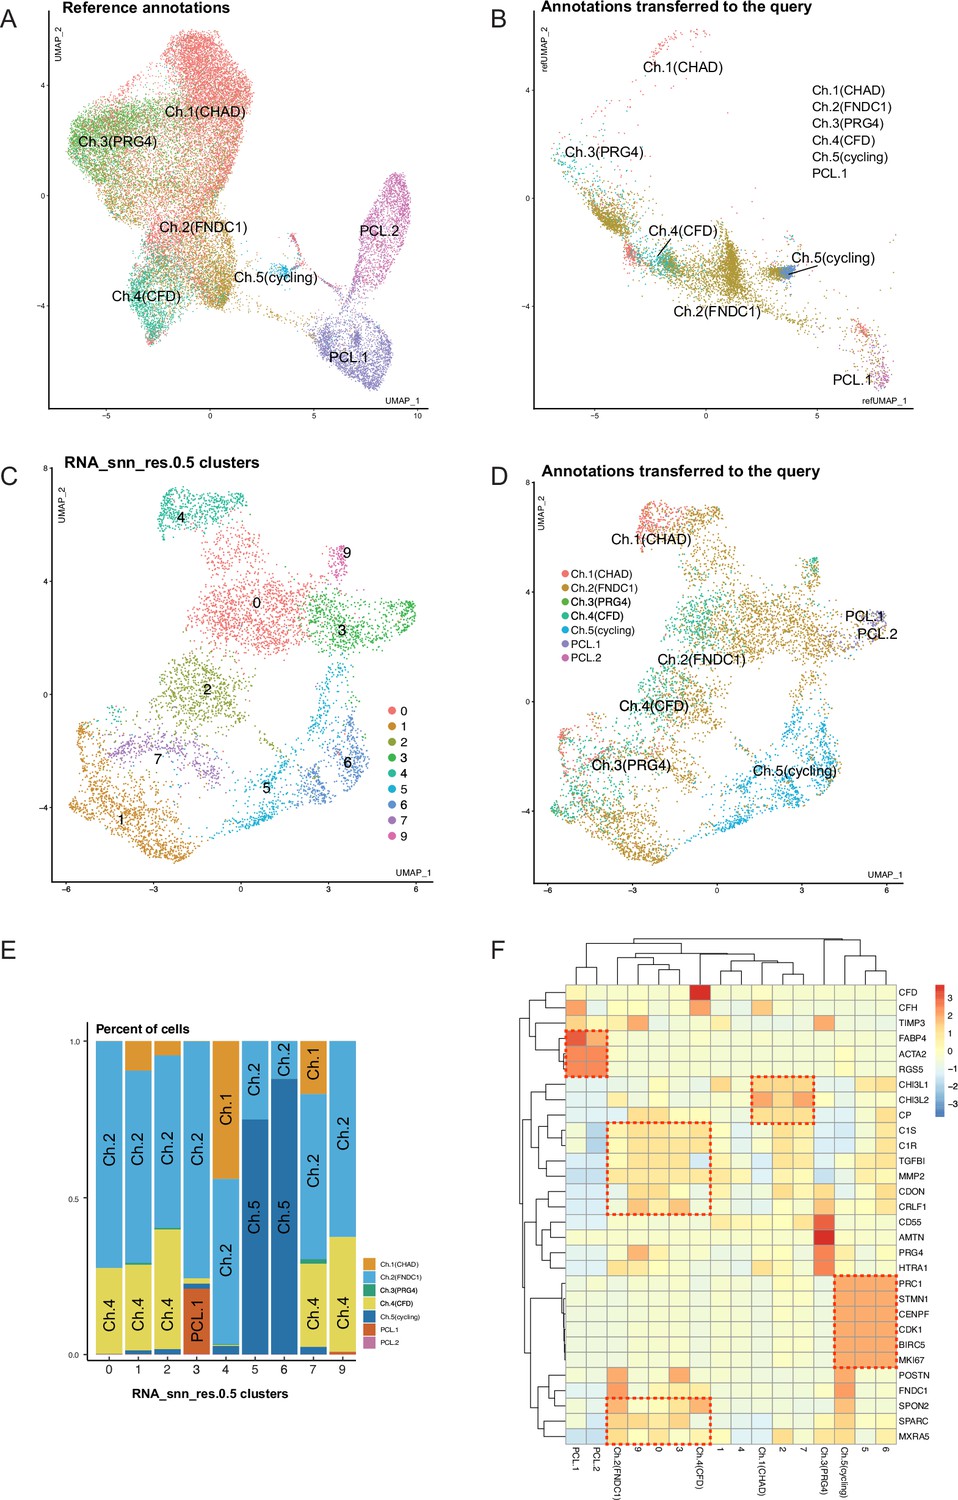
(A) Uniform manifold approximation and projection (UMAP) of in-house data as an integration reference. (B) UMAP of public data (GSE133449) after integration. Coordinates and reference labels were transferred from the in-house data. (C) UMAP of public data without integration. Public data clusters were calculated in public data alone without integration. (D) UMAP of public data without integration. Labels were transferred from the reference. (E) Percent of transferred labels in public data clusters. (F) A joint heatmap of public clusters and in-house subpopulations.
Figure 3—figure supplement 4
Finding differentially expressed genes (DEGs) in total chondrocytes and PCLs (degenerated vs. normal).
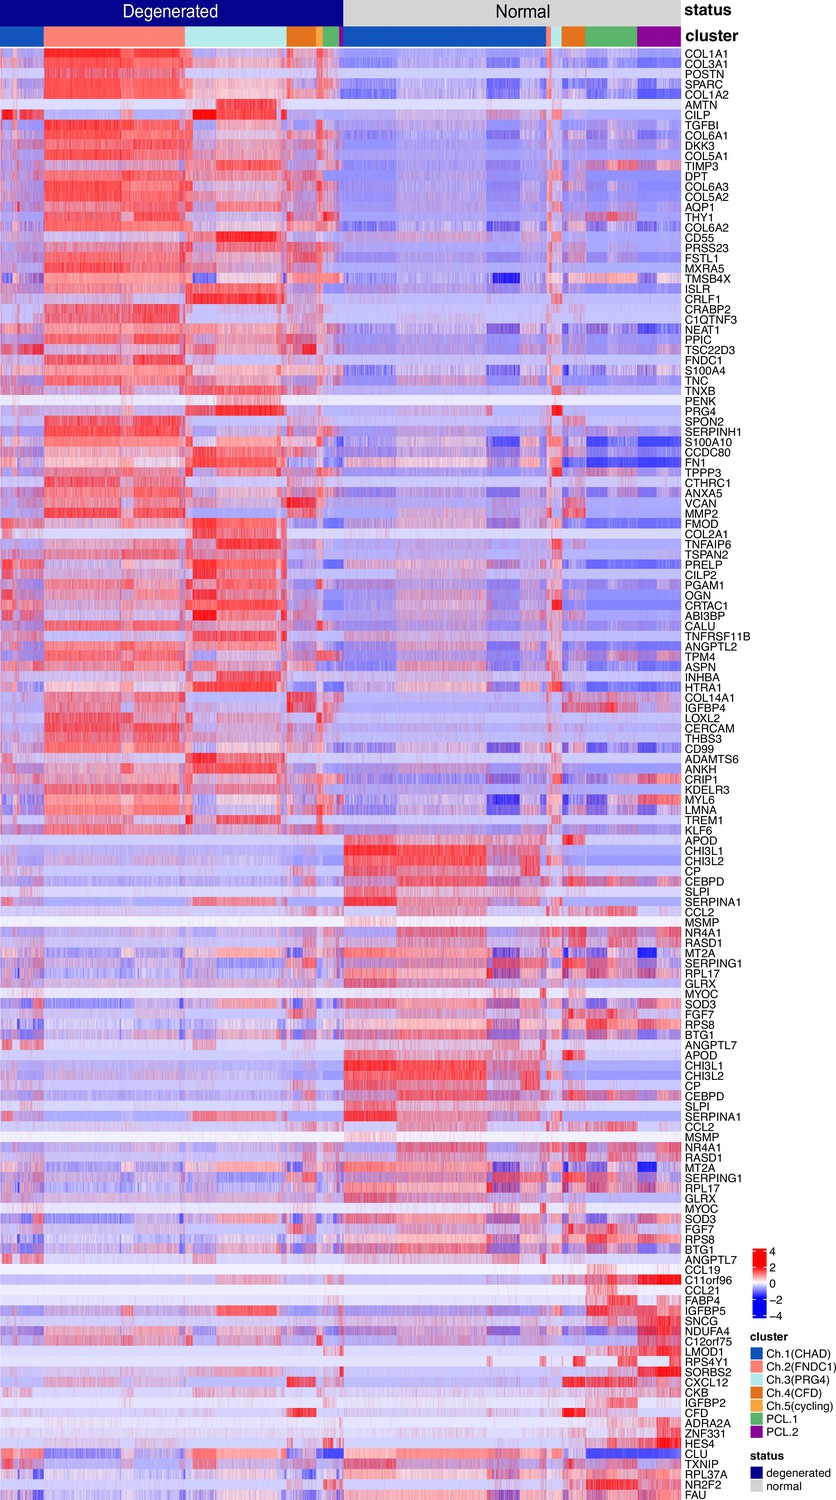
The heatmap shows the z-score-scaled expressions of DEGs in the degeneration group and the normal group. The DEG analysis was conducted on the total chondrocytes and total pericyte-like cells. Cell types and health states were annotated at the top of the heatmap.
Figure 3—figure supplement 5
Interpreting differentially expressed genes (DEGs) in total chondrocytes and PCLs (degenerated vs. normal).
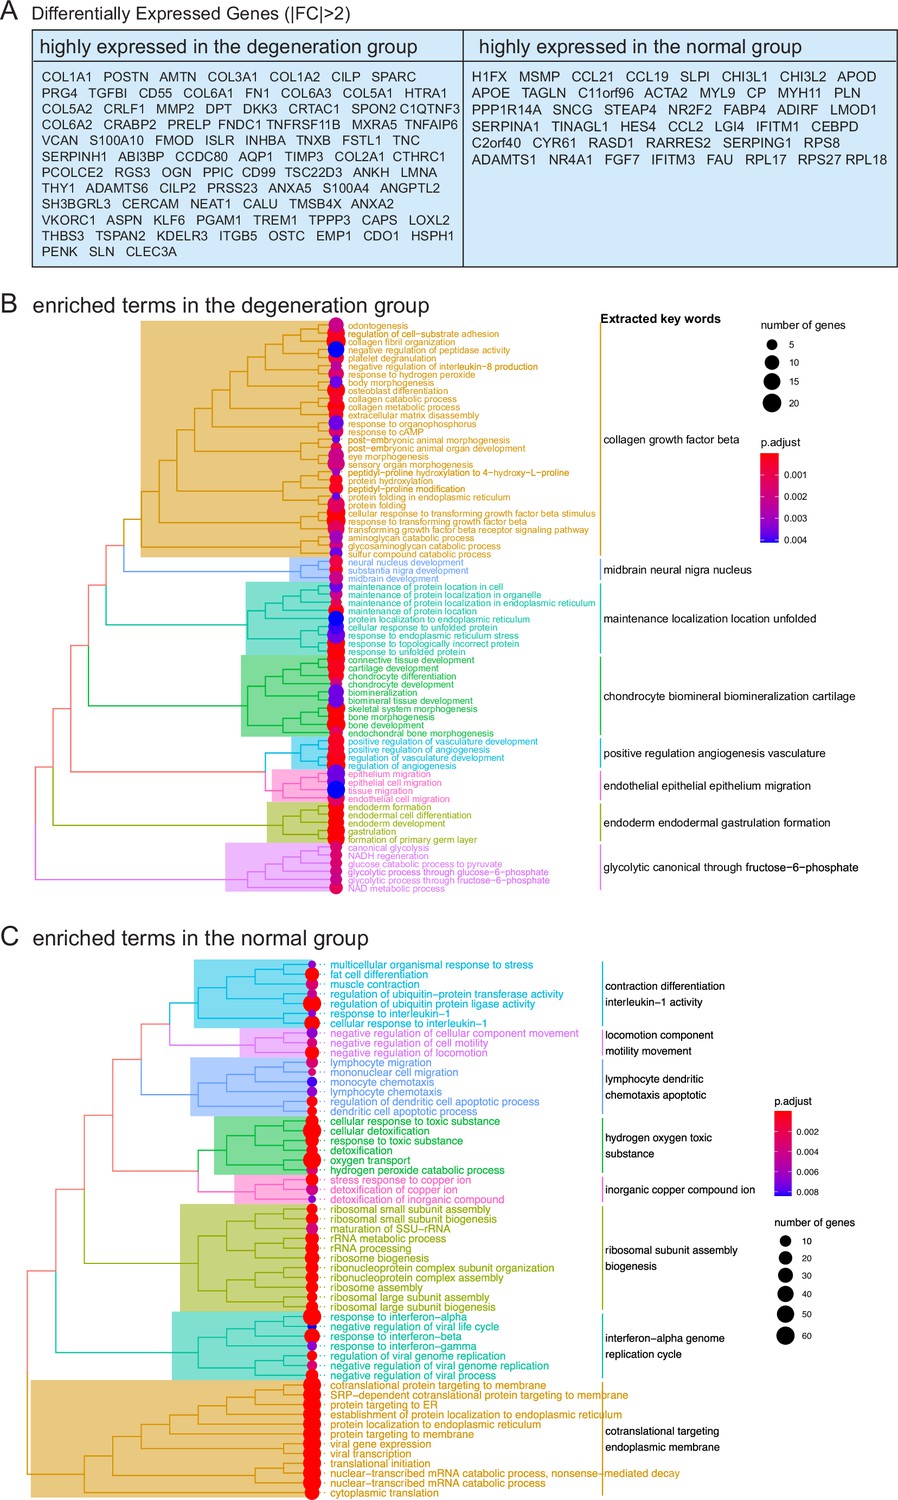
(A) Lists of selected top DEGs with absolute fold changes >2. (B, C) Enrichment analysis of DEGs in (A). The enrichment was performed using gene set overrepresentation analysis using clusterProfiler.
Figure 3—figure supplement 6
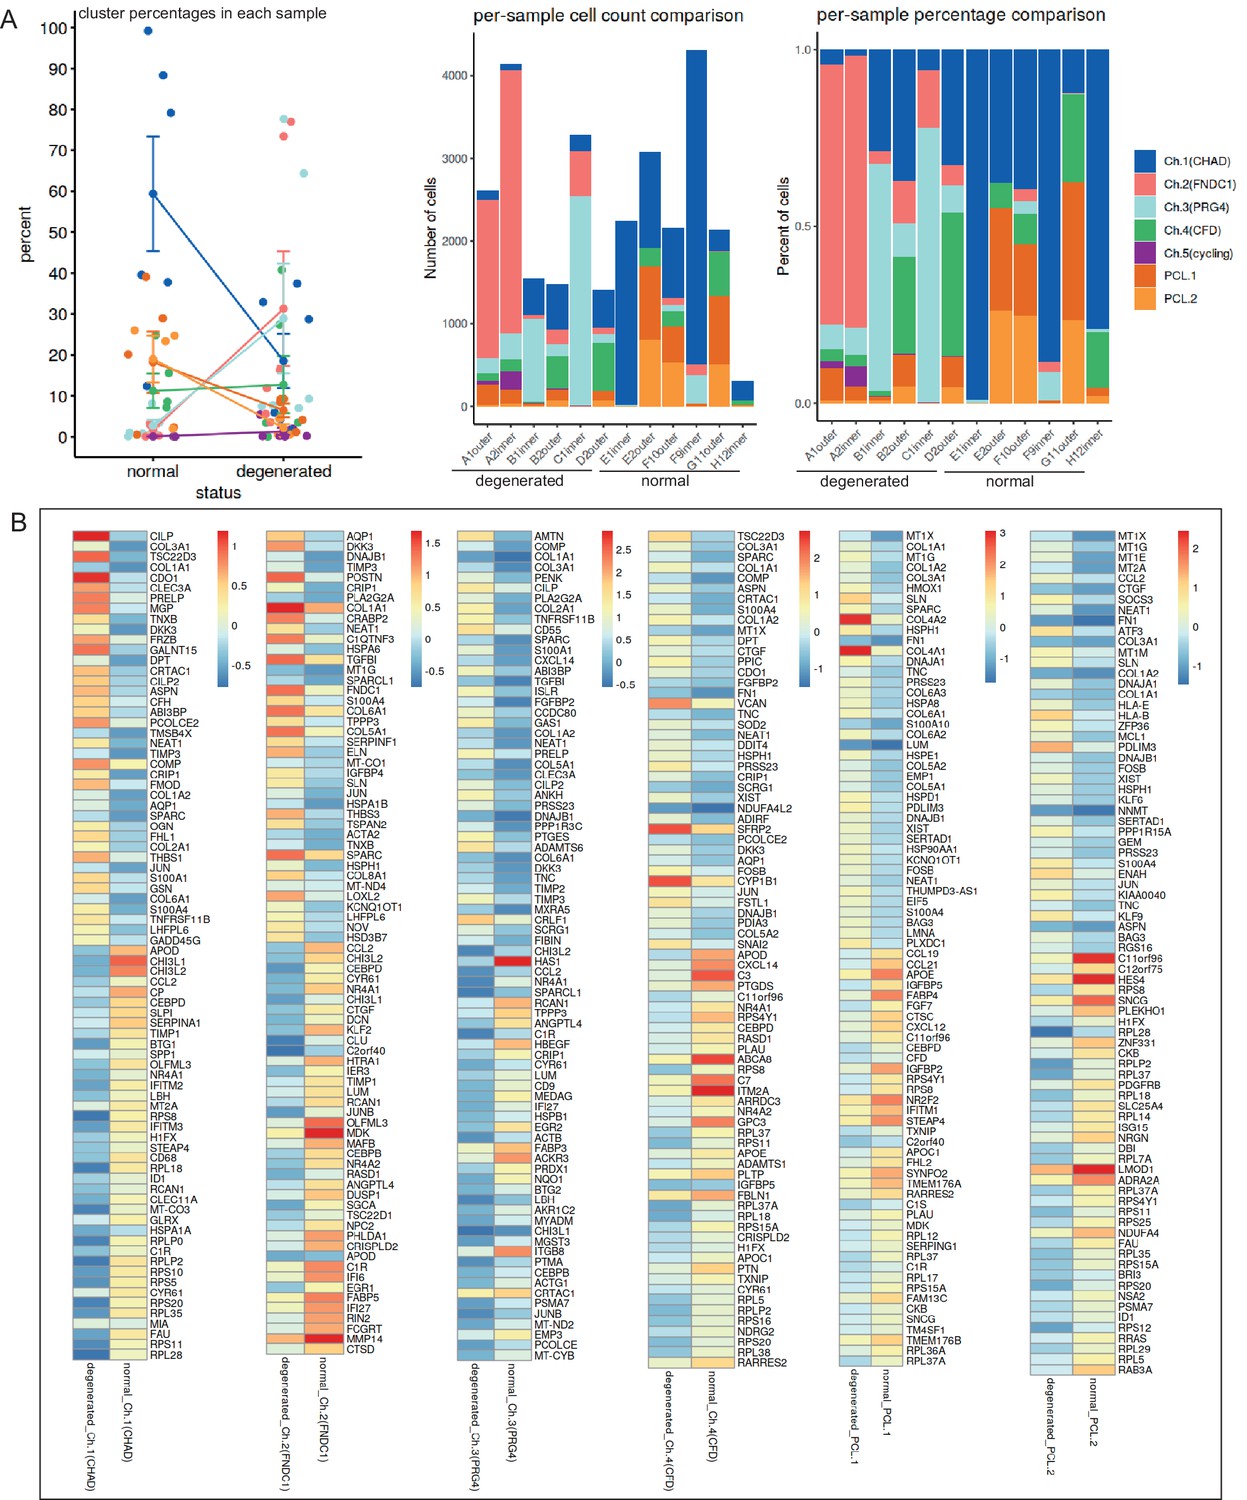
Finding composition changes and differentially expressed genes (DEGs) in individual chondrocyte and PCL clusters (degenerated vs. normal).
(A) Changes in the composition of the seven chondrocyte subclusters of a meniscus in different statuses and different samples. Left: summarized changes, error bars stand for standard deviations. Middle: per-cluster changes, absolute cell counts. Right: per-cluster changes, relative ratios. (B) Analyses of DEGs between normal and degenerated statuses in an individual cluster.
Figure 3—figure supplement 7
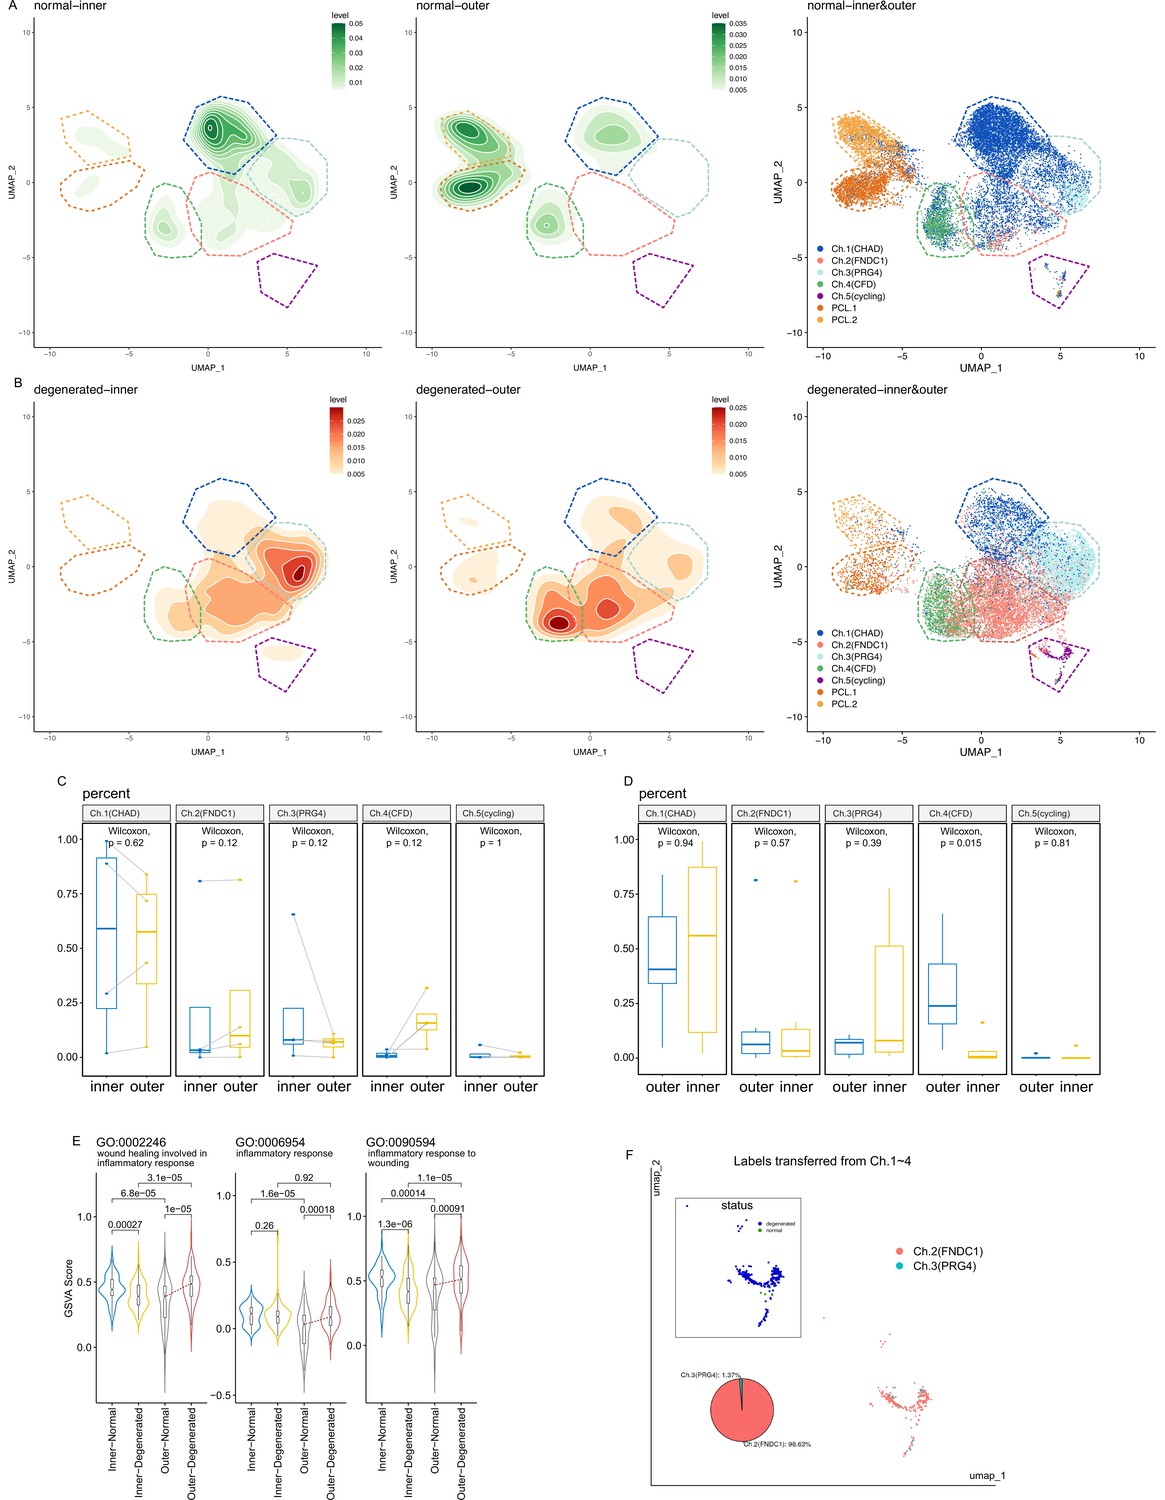
Shifts of cell type compositions and inflammation states.
(A, B) Kernel density estimation of data points in normal inner/outer and degenerated inner/outer samples. Color darkness represents the kernel density estimation of the data points. Isoclines are added to indicate similar density levels. The main occurrence regions of each cell type are annotated with dashed polygons. Raw scatter plots without density estimation are placed in the right panel. (C, D) Box plot comparison of cell subtype percentages between the inner and outer zones. (C) Paired Wilcoxon rank sum test for paired samples (A-inner vs. A-outer, B-inner vs. B-outer, E-inner vs. E-outer, F-inner vs. F-outer). (D) Unpaired Wilcoxon rank sum test for all samples, including samples in (C) besides C-inner, D-outer, G-outer, and H-inner. (E) Gene set variation analysis (GSVA) scores of three inflammation-associated gene ontology terms are visualized with violin plots. The scores are grouped into four subsets (inner-normal, inner-degenerated, outer-normal, and outer-degenerated) and compared with Wilcoxon rank sum test p values on the top. Notch box plots are added in the middle of violin plots, whose topmost, middle, and lowest horizontal lines indicate the 75th, 50th, and 25th percentiles. The notches in the middle represent median ±1.57 × IQR/n0.5. The red lines connecting medians highlight the increases of medians. (F) Cell identity mapping of Ch.5 cells using Ch.1–Ch.4 cells as a reference. The inset panel shows the distribution of normal/degenerated samples.
Figure 4
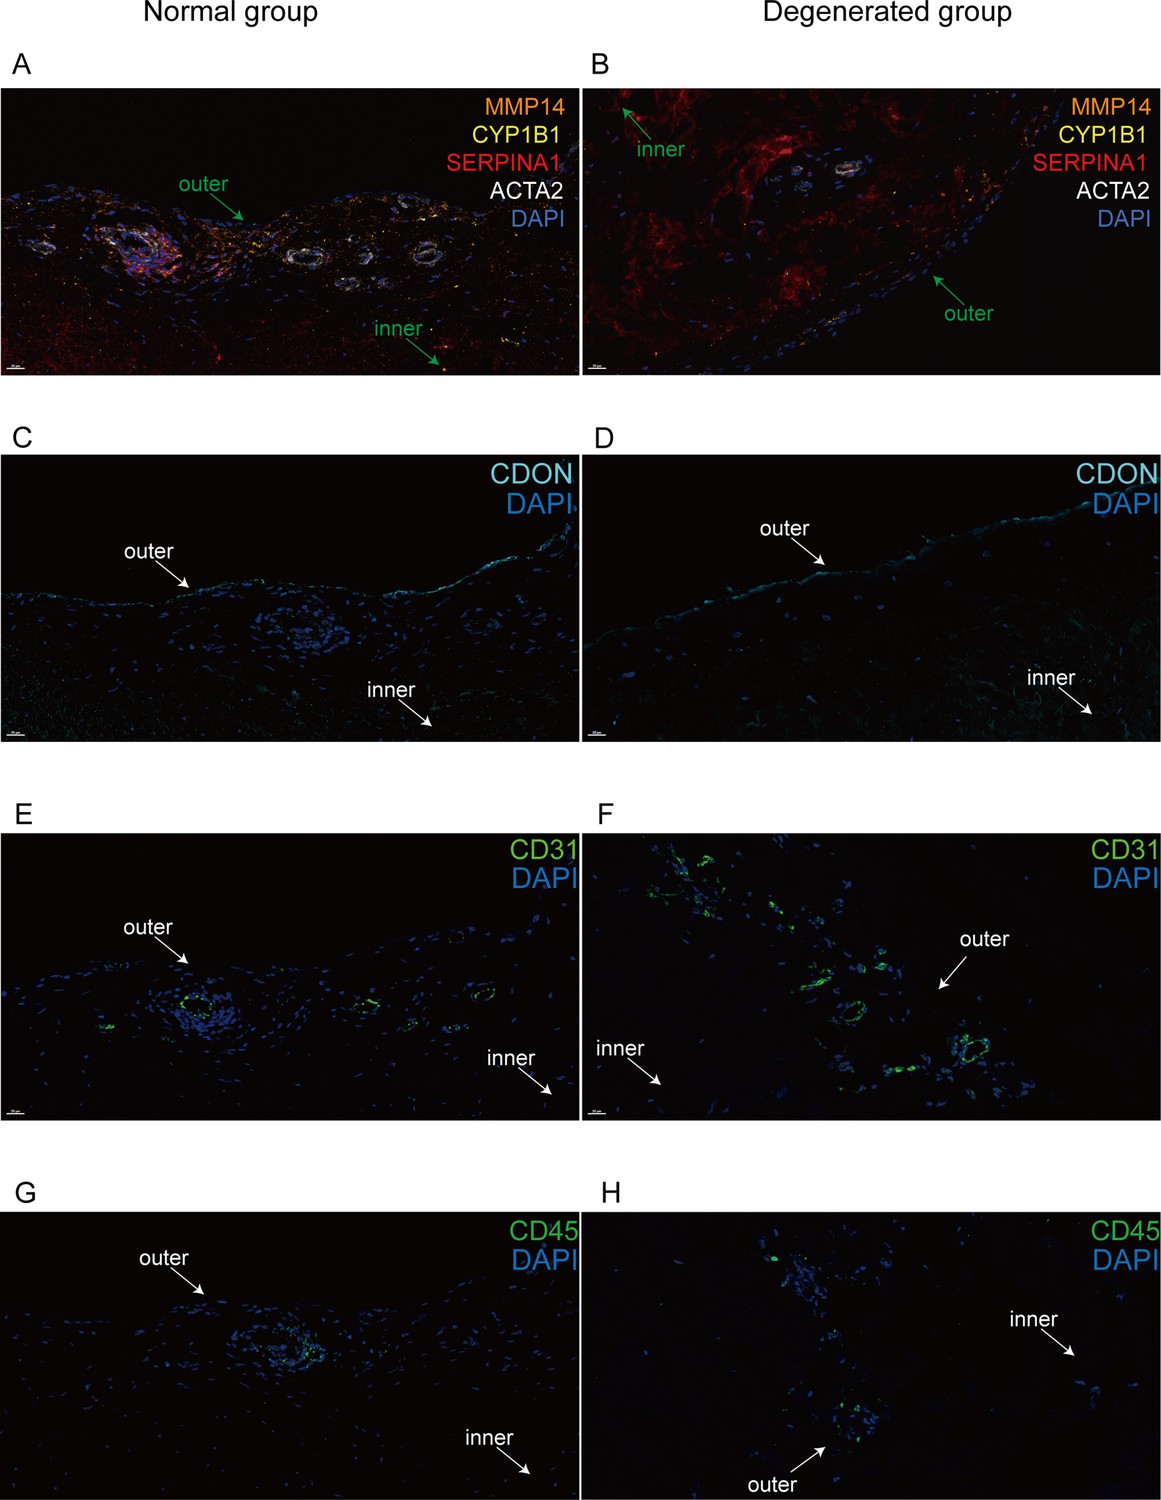
Immunofluorescent staining of human menisci demonstrating resident cell subtypes.
Representative immunofluorescence staining images. Color settings: MMP14 for Ch.2 cells (orange), SERPINA1 for Ch.1 cells (magenta), ACTA2 for PCL cells (white), CDON for Ch.3 cells (cyan), CYP1B1 for Ch.4 cells (yellow), CD31 for endothelial cells (green), and CD45 for immune cells (green). Nuclei are stained blue (DAPI). Scale bar 20 μm. (A) Multiplexed IF staining of the normal meniscus. (B) Multiplex IF staining of the degenerated meniscus. (C) IF staining of CDON in a normal sample. (D) IF staining of CDON in a degenerated sample. (E) IF staining of CD31 in a normal sample. (F) IF staining of CD31 in a degenerated sample. (G) IF staining of CD45 in a normal sample. (H) IF staining of CD45 in a degenerated sample (IF: immunofluorescence). The inner and outer zones of menisci were annotated with arrows.
Figure 5 with 2 supplements
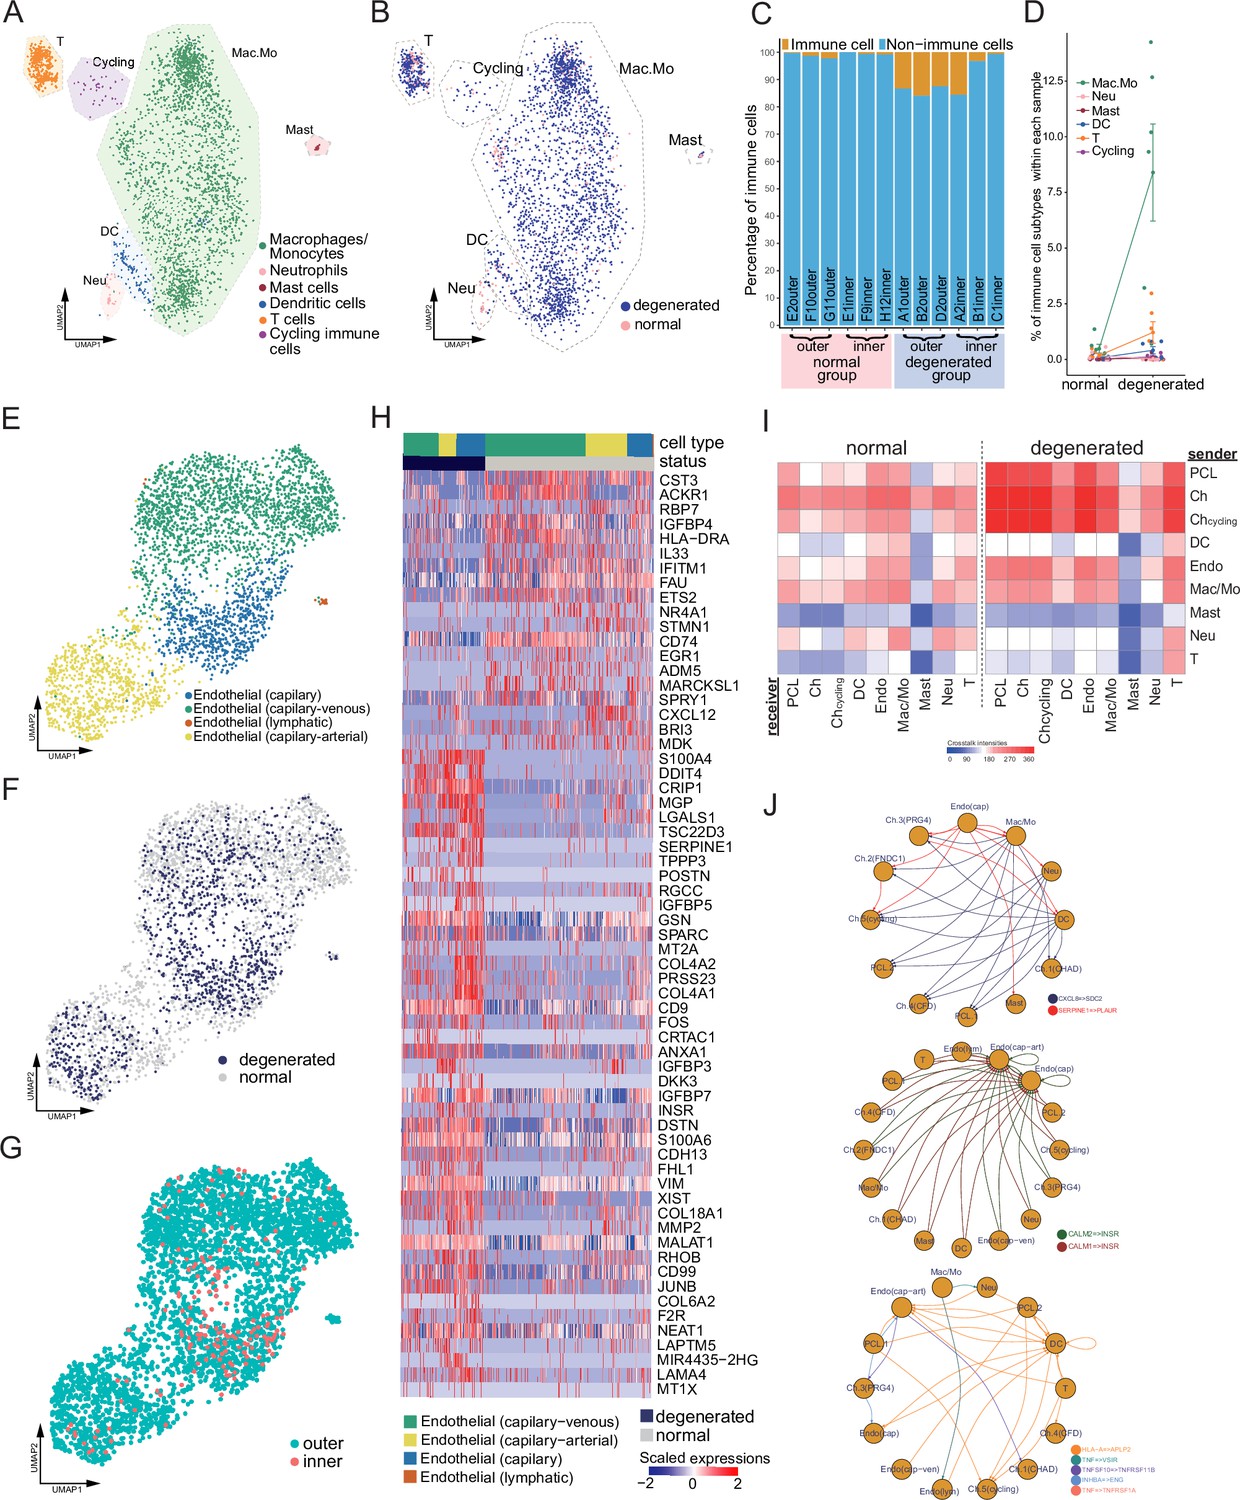
Immune, endothelial cells, and their crosstalk with chondrocytes.
(A) Uniform manifold approximation and projection (UMAP) visualization of the immune cell types in the meniscus. (B) UMAP visualization of the statuses of samples (degenerated/normal). (C) Per-sample bar plots visualize the immune cell percentage changes between the normal and degenerated group. (D) Changes in immune cell percent between normal and degenerated groups. Error bars show the standard deviations of the data. Wilcoxon p values: Mac.Mo 0.004, Cycling 0.10, DC 0.14, Neu 0.19, T 0.22, Mast 1.0. (E) UMAP visualization of the endothelial class cells’ subtypes. (F) UMAP visualization of sample status. (G) UMAP visualization of the anatomical regions. (H) Top differentially expressed genes between different health states (degenerated vs. normal). The heatmap shows z-score-scaled gene expression values. (I) General cell–cell crosstalk between large populations. The ligand–receptor pair crosstalk was evaluated at the large population level (Methods). (J) Representative crosstalk was significantly enhanced in the degeneration group.
Figure 5—figure supplement 1
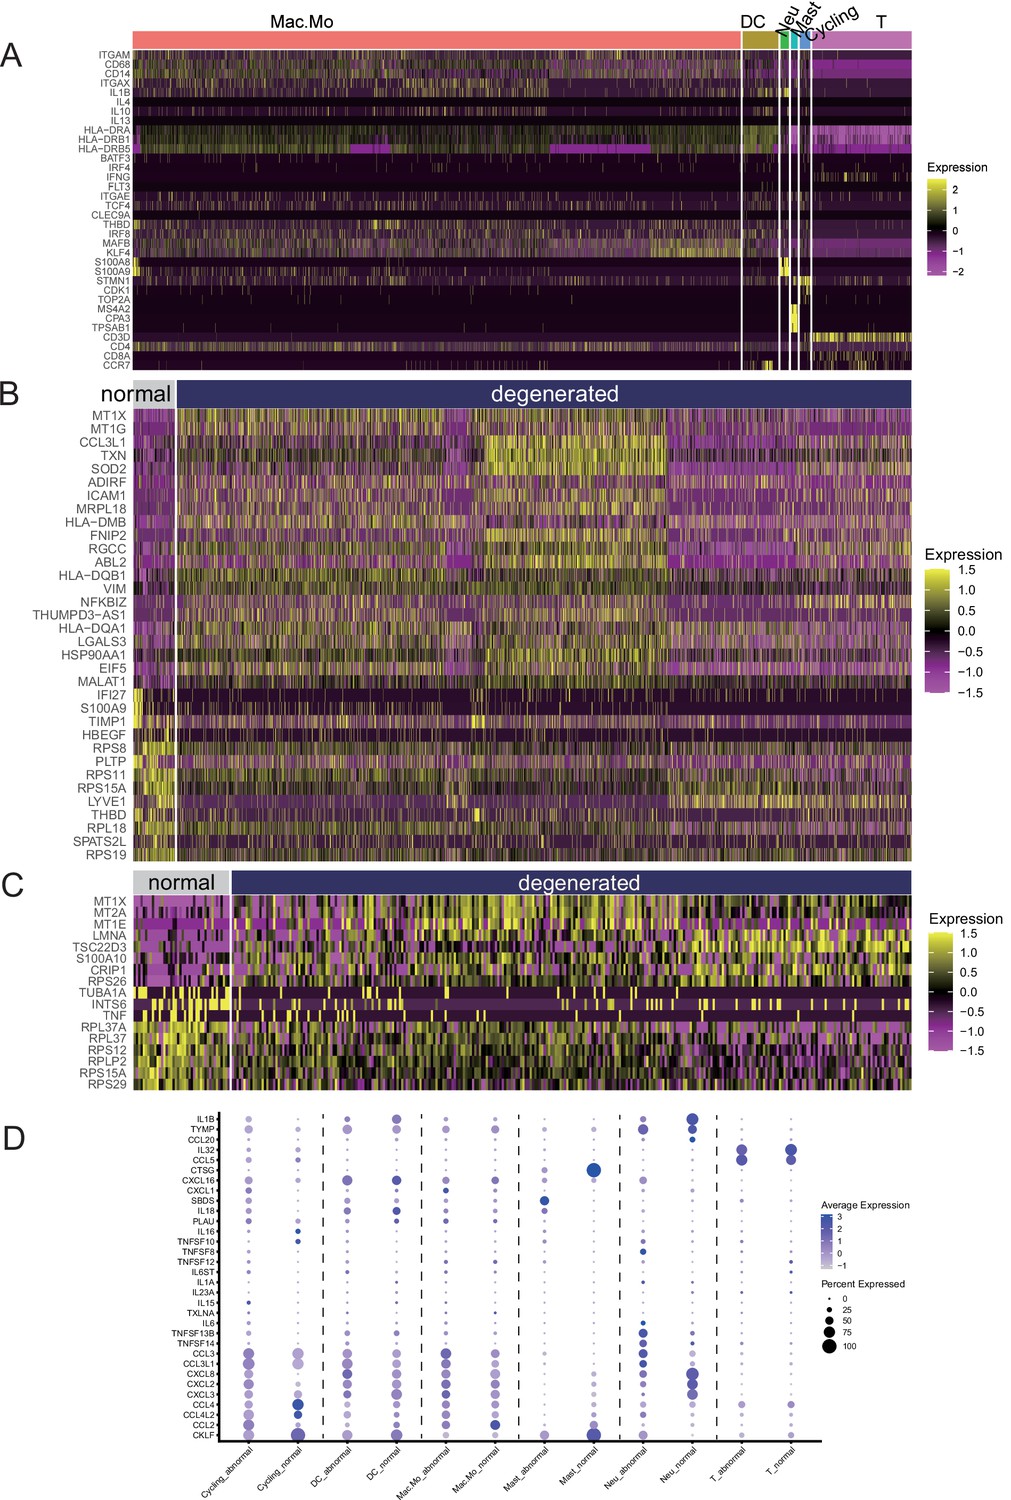
Immune cell signature genes.
(A) Signature genes that were used to define the immune cell subpopulations. (B) Finding DEGs in macrophages/monocytes (normal vs. degenerated). (C) Finding DEGs in T cells (normal vs. degenerated). (D) Analysis of cytokines and chemokines released by various immune cells in the normal and degenerated meniscus.
Figure 5—figure supplement 2
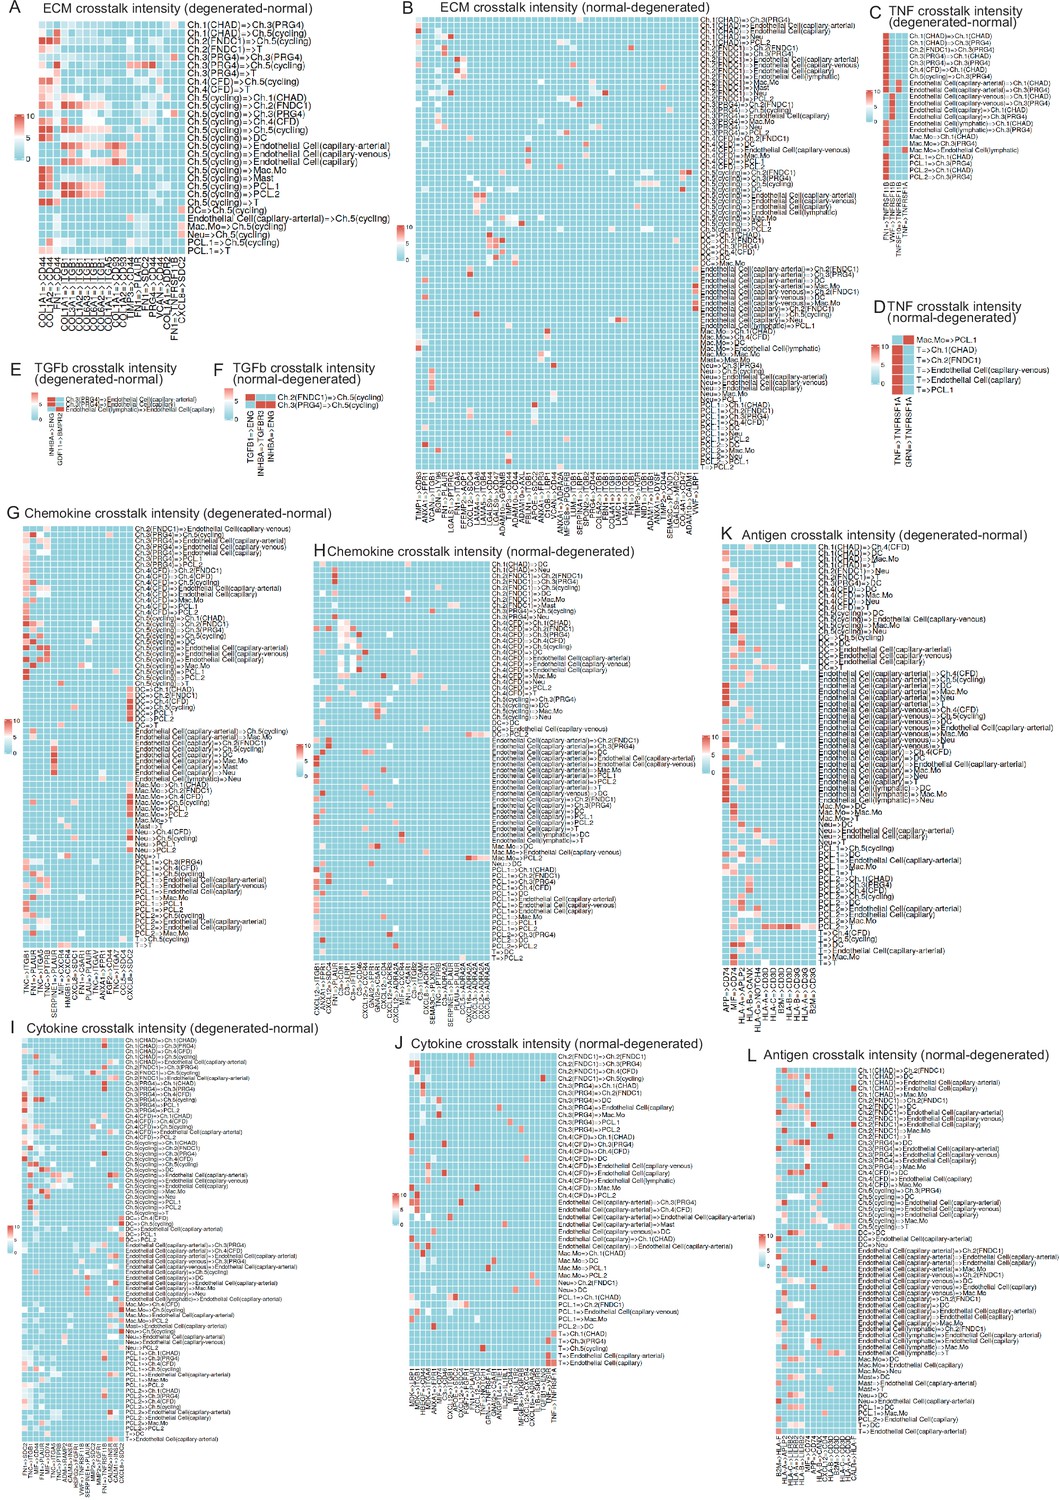
Ligand–receptor pairs that were up-/downregulated in degeneration.
(A–L) The heatmaps reported ligand–receptor pairs that have significant differences across all sender and receiver cell types.
Figure 6
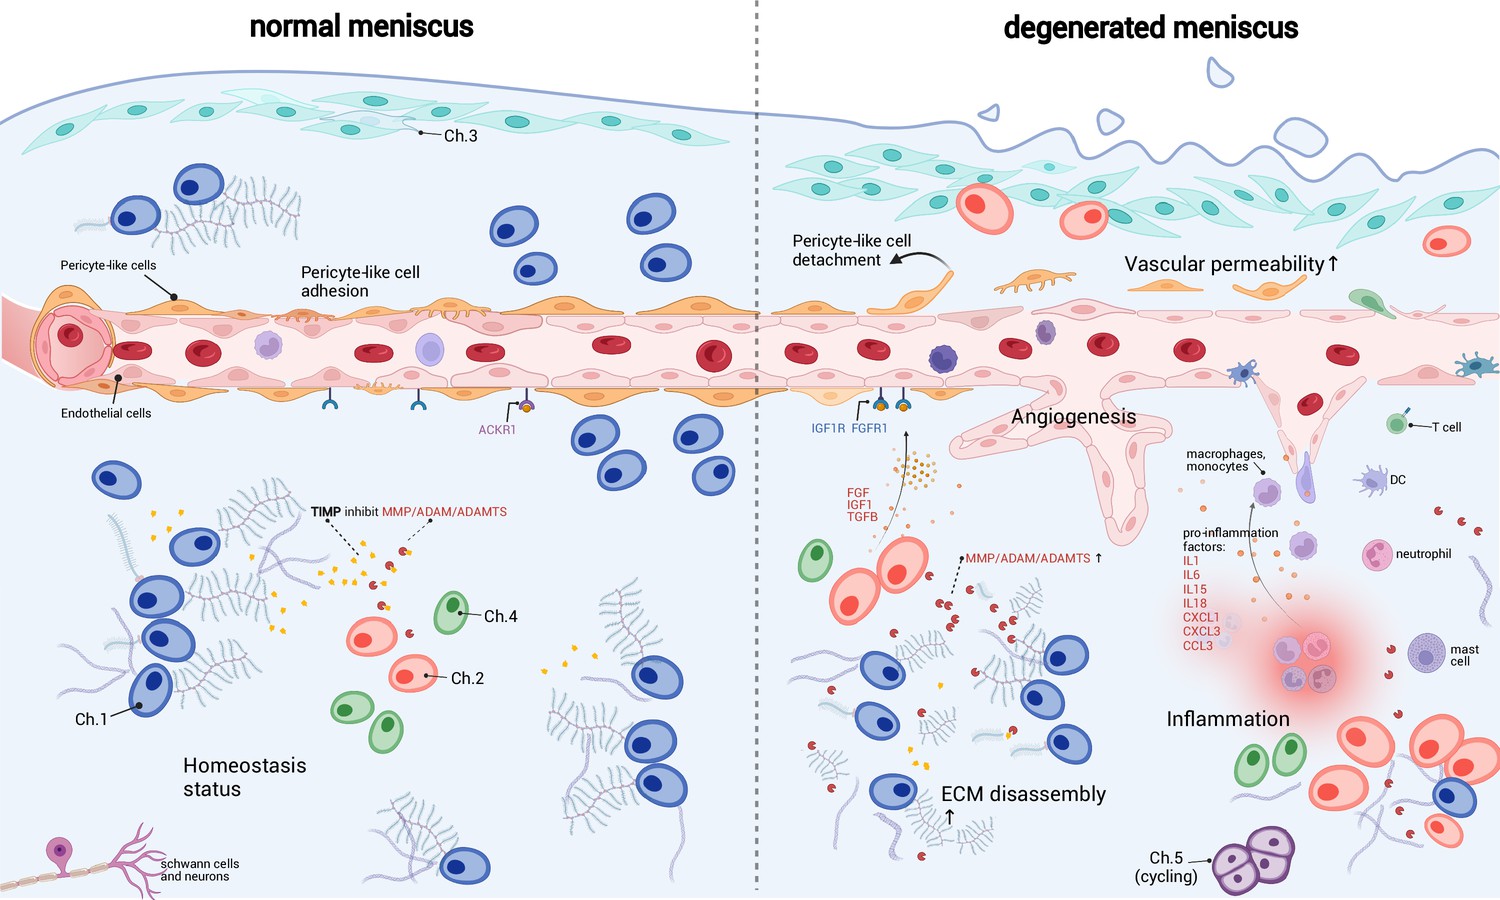
A schematic diagram of the microenvironment changes between the normal and the degenerated meniscus.
The left side visualizes the homeostasis meniscus, where Ch.1 is the dominant chondrocyte population. In this situation, the extracellular matrix (ECM) decomposition and synthesis reach a dynamic equilibrium, and the aberrant proliferation of blood vessels is inhibited. The right side visualizes the degenerated meniscus, where the orchestrated microenvironment balance is broken. The pericyte-like cells detach from the blood vessels and lower the stability of the blood vessels. The endothelial cells grew and formed new blood vessels in the degenerated area. The vascular permeability increased and allowed more immune cells to infiltrate the degenerated tissue. Ch.2 and Ch.3 increased in quantity and produced more matrix disassembly enzymes, damaging the ECM, releasing angiogenesis factors, and recruiting more immune cells. The immune cells, such as macrophage/monocytes, DCs, and T cells, also have chemotaxis functions. There are also cycling chondrocytes and nerve tissue cells in the meniscus.
Additional files
-
Supplementary file 1
Donor and sample information.
A table contains the descriptions of sample names, cell counts, cell viabilities, sample volumes, estimated numbers of cells loaded, donor states, donor genders, anatomical locations, estimated numbers of cells after filtering, body mass index (BMI) of donor, and ages of donor.
- https://cdn.elifesciences.org/articles/79585/elife-79585-supp1-v1.xlsx
-
Supplementary file 2
Differentially expressed genes of each cluster.
A list of differentially expressed genes of each cluster. The table contains gene symbols, corresponding clusters, average log2 fold-change values, percents of cells expressing this gene in groups 1 and 2, p values, and adjusted p-values.
- https://cdn.elifesciences.org/articles/79585/elife-79585-supp2-v1.xlsx
-
MDAR checklist
- https://cdn.elifesciences.org/articles/79585/elife-79585-mdarchecklist1-v1.docx
Download links
A two-part list of links to download the article, or parts of the article, in various formats.
Downloads (link to download the article as PDF)
Open citations (links to open the citations from this article in various online reference manager services)
Cite this article (links to download the citations from this article in formats compatible with various reference manager tools)
Cellular features of localized microenvironments in human meniscal degeneration: a single-cell transcriptomic study
eLife 11:e79585.
https://doi.org/10.7554/eLife.79585


