Large protein complex interfaces have evolved to promote cotranslational assembly
- MRC Human Genetics Unit, Institute of Genetics and Cancer, University of Edinburgh, United Kingdom
Figures
Figure 1 with 1 supplement
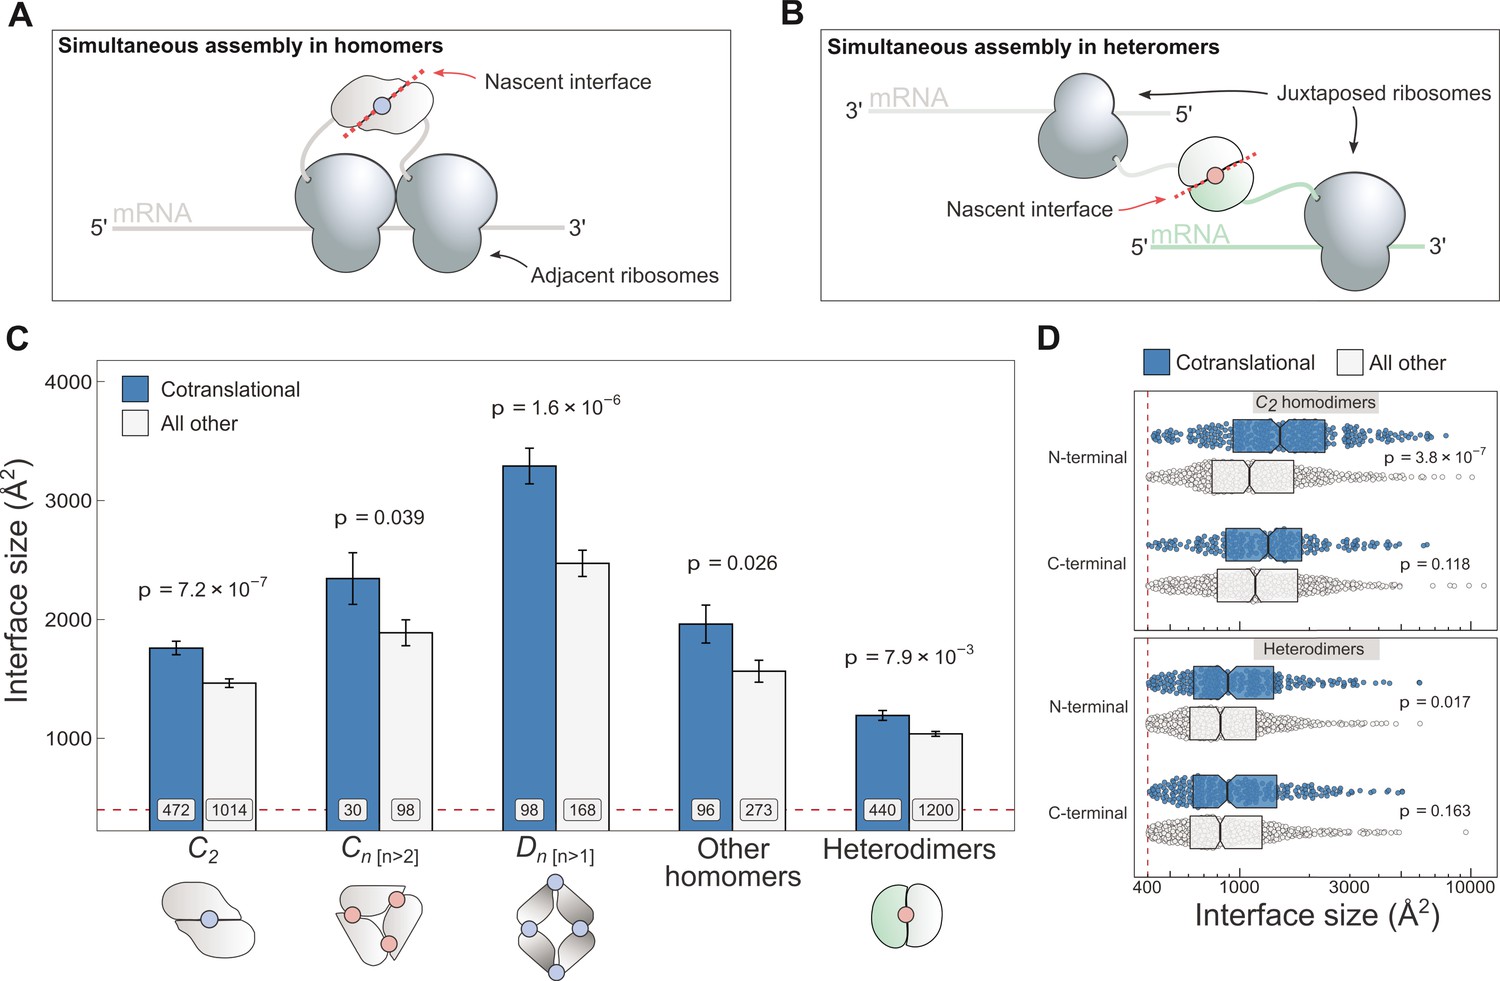
Cotranslationally assembling subunits are characterised by large interfaces.
(A) Schematic representation of (cis) simultaneous cotranslational assembly in homomers. (B) Schematic representation of (trans) simultaneous cotranslational assembly in heteromers. (C) Interface size differences between cotranslationally assembling and all other subunits of homomeric symmetry groups and heterodimers. Error bars represent standard error of the mean (SEM) and labels on bars show the number of proteins in each group. The p values were calculated with two-sided Wilcoxon rank-sum tests. Pictograms show the basic structure of symmetry group members, with the blue dots representing isologous and red dots representing heterologous and heteromeric interfaces. (D) Interface size distributions of cotranslationally assembling and all other subunits of C2 homodimers and heterodimers, subset by the terminal location of the interface. The p values were calculated with two-sided Wilcoxon rank-sum tests.
Figure 1—figure supplement 1
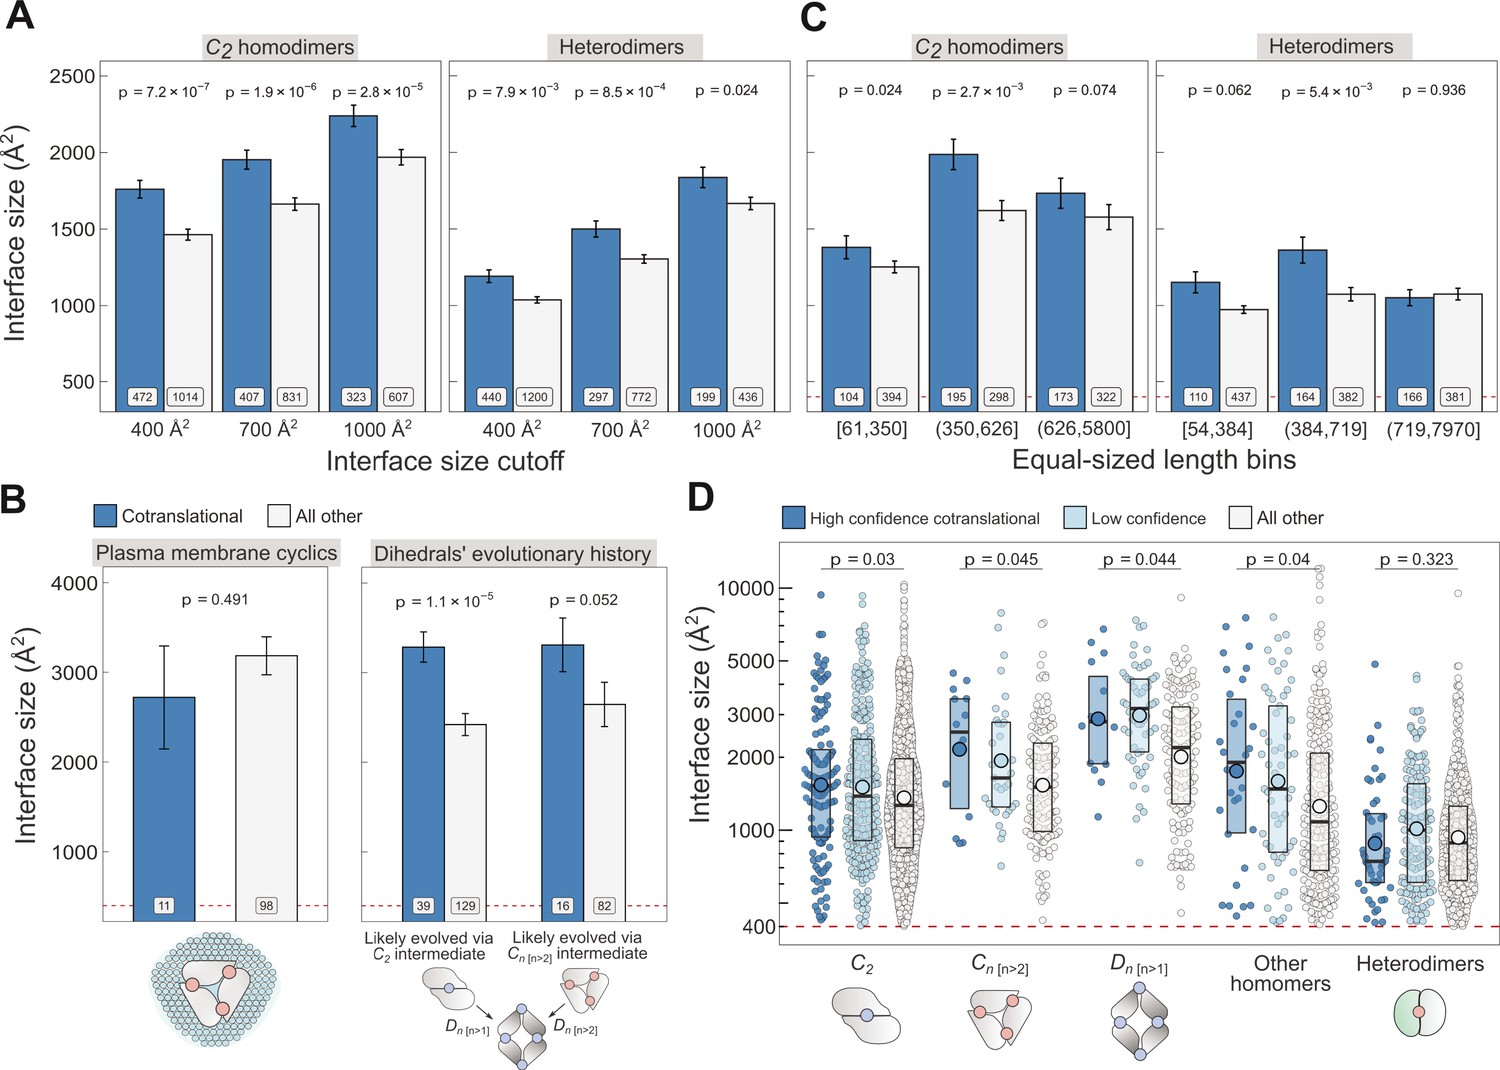
Controlling for potential confounders of the cotranslational assembly data.
(A) Interface size differences between cotranslationally assembling and all other subunits of C2 homodimers and heterodimers, measured at incremental interface area cutoffs. Error bars represent standard error of the mean (SEM) and labels show the number of proteins in each group. The p values were calculated with two-sided Wilcoxon rank-sum tests. (B) Left: Interface size differences between cotranslationally assembling and all other subunits of plasma membrane localised higher-order cyclic symmetry members. Right: Interface size differences between cotranslationally assembling and all other subunits of dihedral complexes grouped by their probable evolutionary history. The p values were calculated with two-sided Wilcoxon rank-sum tests. (C) Interface size differences between cotranslationally assembling and all other subunits of C2 homodimers and heterodimers, binned into three approximately equal-sized bins of sequence length. Error bars represent SEM and labels show the number of proteins in each group. The p values were calculated with two-sided Wilcoxon rank-sum tests. (D) Interface size differences subset by confidence in cotranslational assembly. Only proteins with cytoplasmic and nuclear localisations are included. Pictograms show the basic structure of symmetry group members, with the blue dots representing isologous and red dots representing heterologous and heteromeric interfaces. The p values were calculated with two-sided Wilcoxon rank-sum tests between high confidence and all other subunits. Differences between high confidence and low confidence subunits are not significant. Larger dots within boxes represent the sample mean.
Figure 2
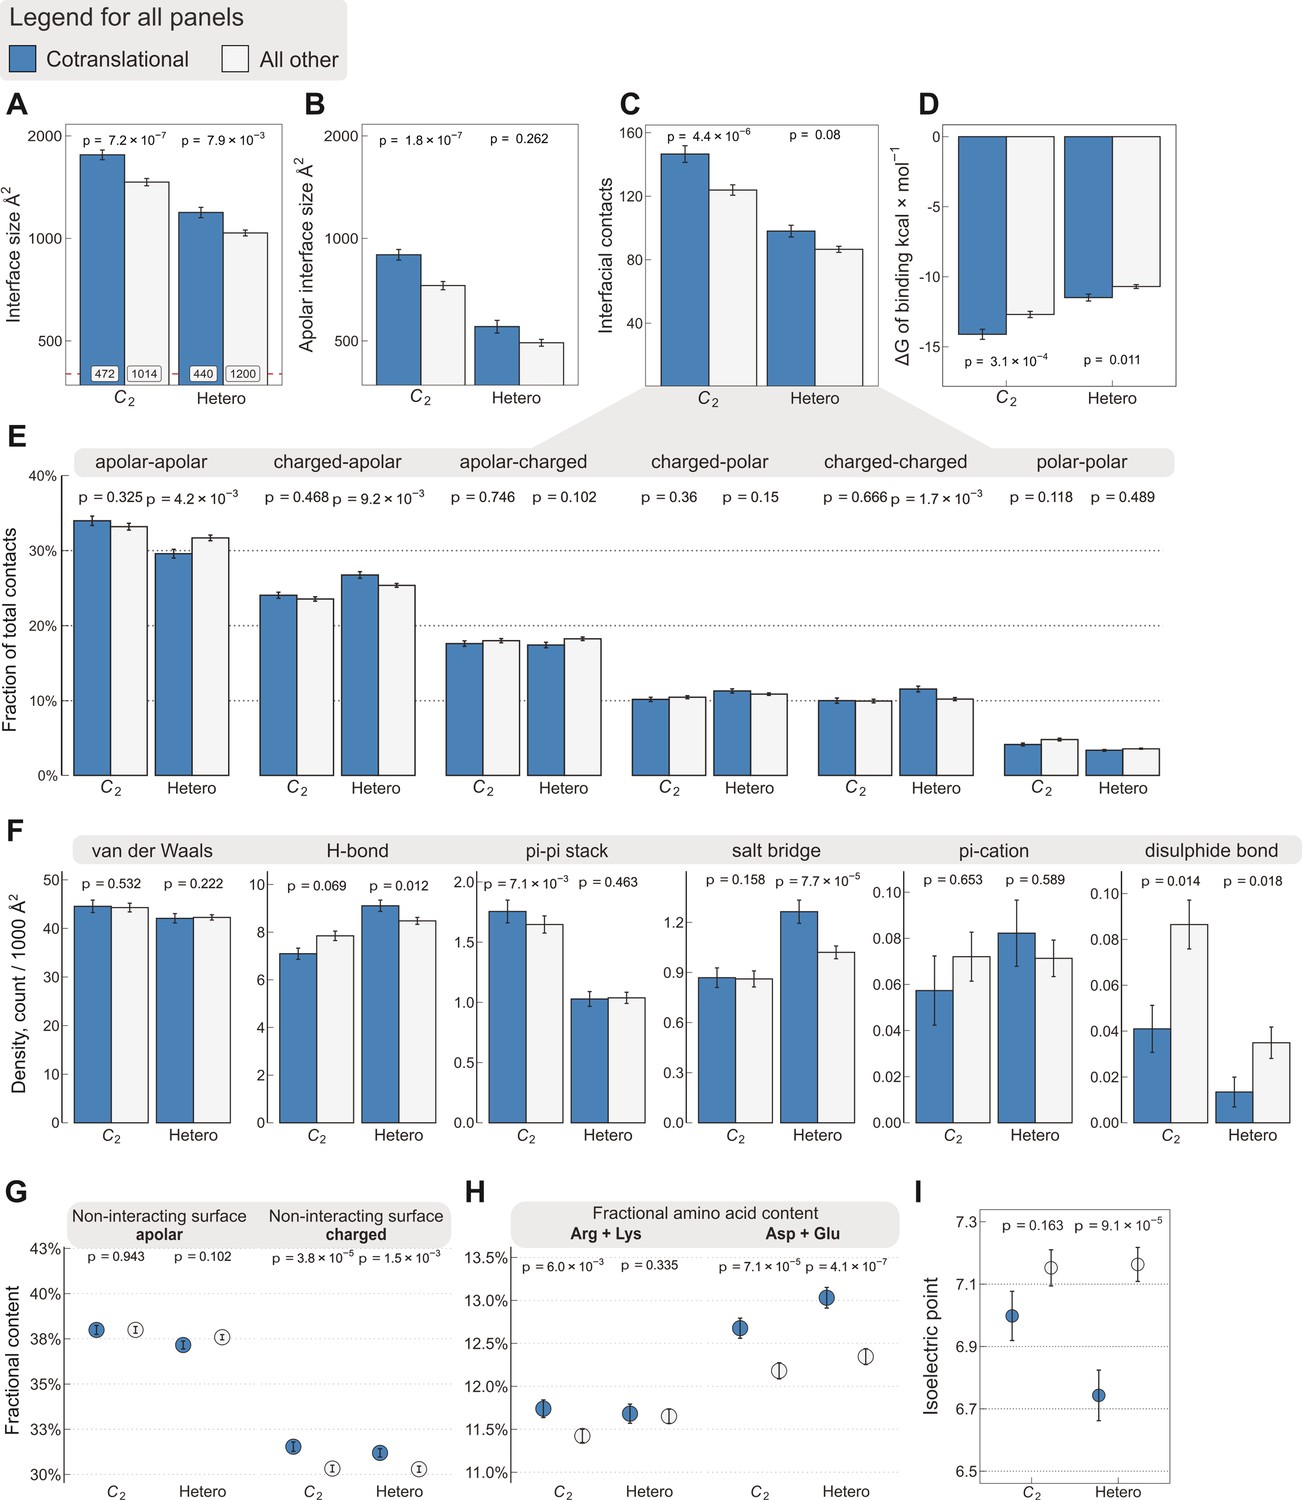
Interface area is more important than other interfacial contact-based properties for explaining cotranslational assembly.
All panels show the sample mean ± standard error of the mean (SEM) for cotranslationally assembling and all other subunits of human C2 symmetric homodimers and heterodimers. The p values were derived from two-sided Wilcoxon rank-sum tests in panels (A–D) and (I), and from two-sided Dunn’s test of multiple comparisons in panels (E–H). Labels on bars in panel (A) represent sample sizes. The following parameters are shown. (A) Total interface size (Å2). (B) Apolar interface size (Å2). (C) The absolute number of interfacial contacts. (D) Predicted Gibbs free energy (ΔG) of binding (kcal/mol). (E) Fraction of residue–residue contacts by chemical character, in descending order of prevalence. (F) Specific interaction density (count/1000 Å2), in descending order of prevalence. (G) Non-interacting surface apolar (NISa) and charged (NISc) residue per cent. (H) Fractional content of positively (Arg + Lys) and negatively (Asp + Glu) charged amino acids in the full-length sequence. (I) Protein isoelectric point determined with continuum electrostatics on the full monomeric structures.
Figure 3
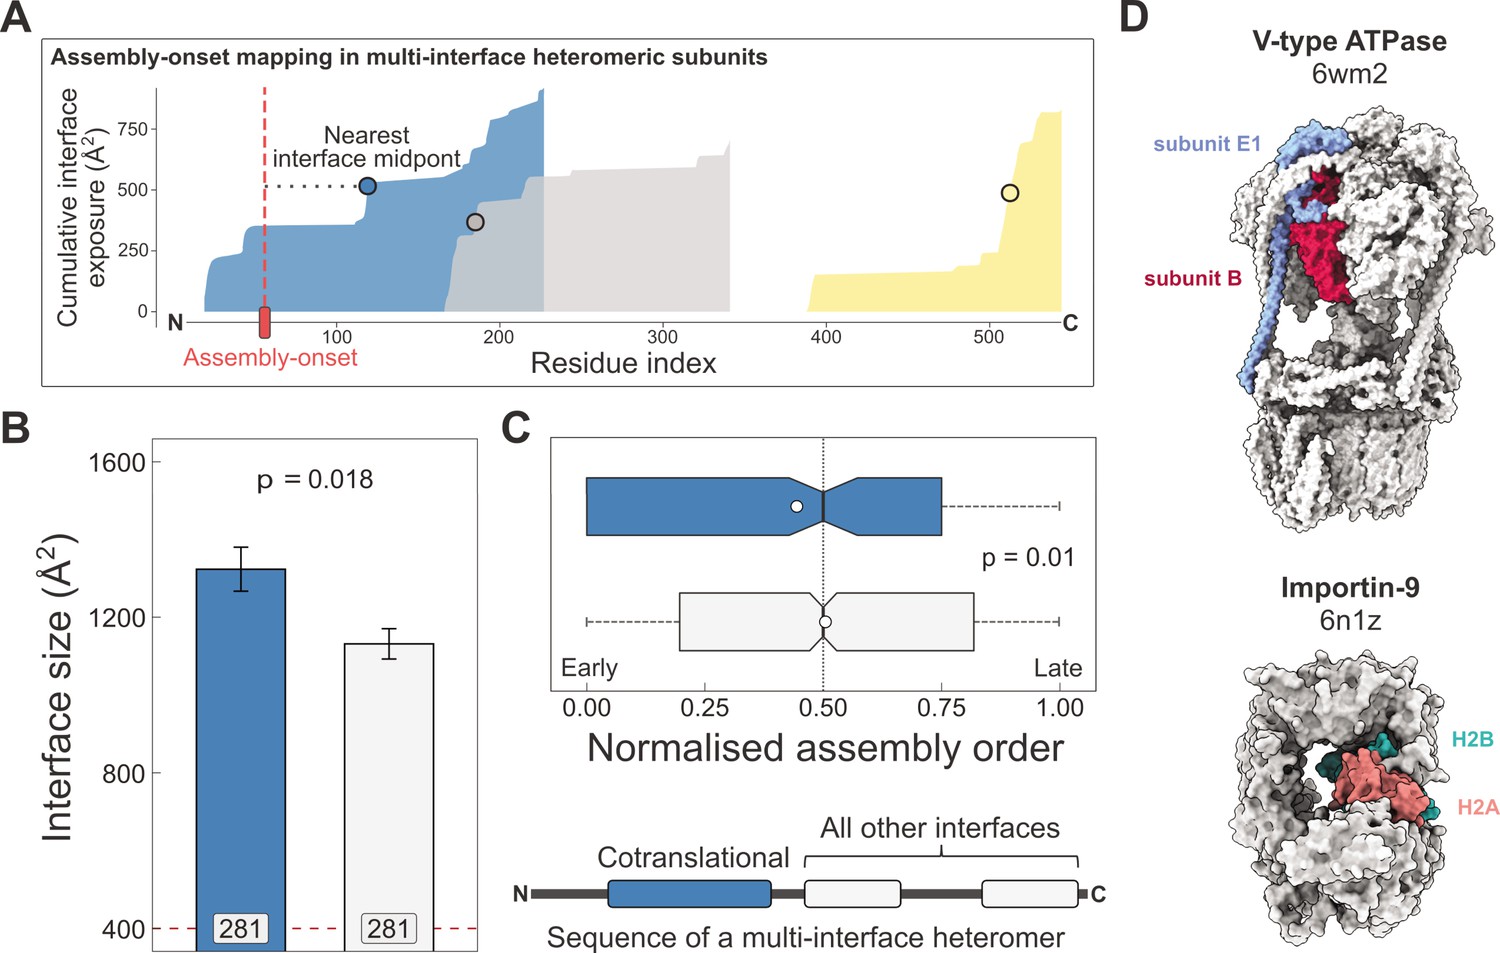
Larger and earlier-assembling interfaces tend to form cotranslationally in heteromeric subunits with multiple interfaces.
(A) Visual representation of the interface mapping protocol. The area plot shows the cumulative interface area build-up of individual interfaces during translation, which are shown in different colours. The midpoints (dots) are residues at which half of the eventually formed area is exposed. Assembly-onsets determined by Bertolini et al., 2021 are mapped to the nearest midpoint on condition that it is not a homomeric interface. (B) Pairwise comparison of cotranslationally forming (in the simultaneous mode) interfaces of multi-interface heteromeric subunits to the mean of all other heteromeric interfaces on them. For visual aid, see line diagram under panel (C) Error bars represent standard error of the mean (SEM) and labels on bars show the number of proteins in each group. The p value was calculated with the Wilcoxon signed-rank test. (C) Pairwise comparison of the normalised assembly order in 201 complexes between cotranslationally forming and all other heteromeric interfaces. The normalised assembly order is a 0-to-1 scale where 0 and 1 represent the first and the last steps of the predicted assembly pathway. The p value was calculated with the Wilcoxon signed-rank test. (D) Two examples of simultaneous cotranslational assembly between subunit pairs in heteromeric complexes: the subunits E and B1 of the V-type ATPase (pdb: 6wm2), and importin-9 with histone H2A (6n1z).
Figure 4
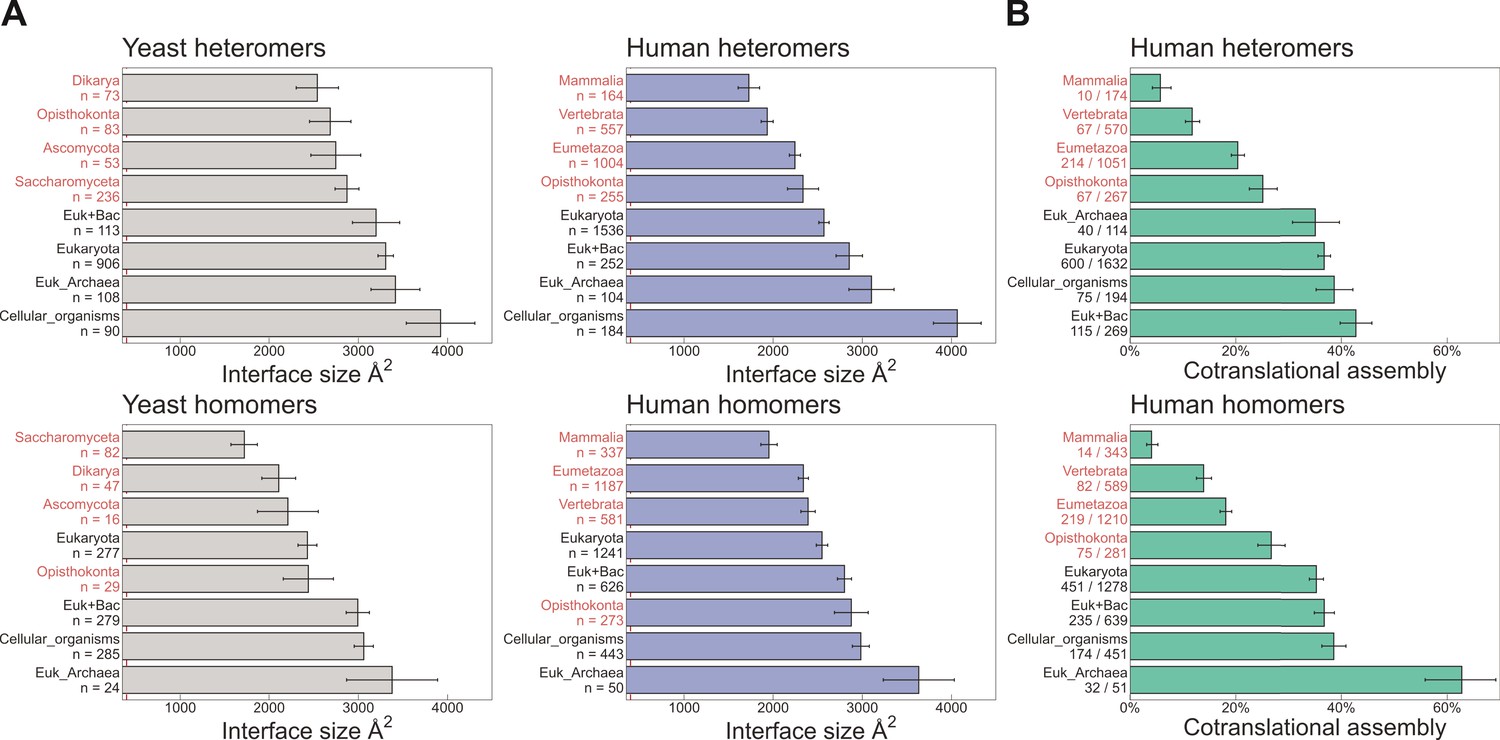
Evolutionarily more ancient subunits of complexes are more likely to undergo cotranslational assembly.
(A) Average (mean ± standard error of the mean [SEM]) interface sizes of yeast and human homo- and heteromeric subunits grouped by the evolutionary age of the protein. Age group labels coloured in red are defined as ‘more recent’ proteins, while those in black represent ‘ancient’ proteins. Numbers under labels represent the number of distinct proteins in the given age group. Homomeric interface sizes are a pool of experimentally determined structures and SWISS-MODEL homology models. (B) The frequency (%) of cotranslational assembly, as detected by Bertolini et al., 2021, in the different protein age groups, split into homo- and heteromers. Heteromer annotations were supplemented with those contained in hu.MAP2.0 (Drew et al., 2021). Fractions under labels denote the number of cotranslationally assembling proteins out of the total in the given age group. Error bars represent 68% Jeffrey’s binomial confidence intervals.
Figure 5 with 1 supplement
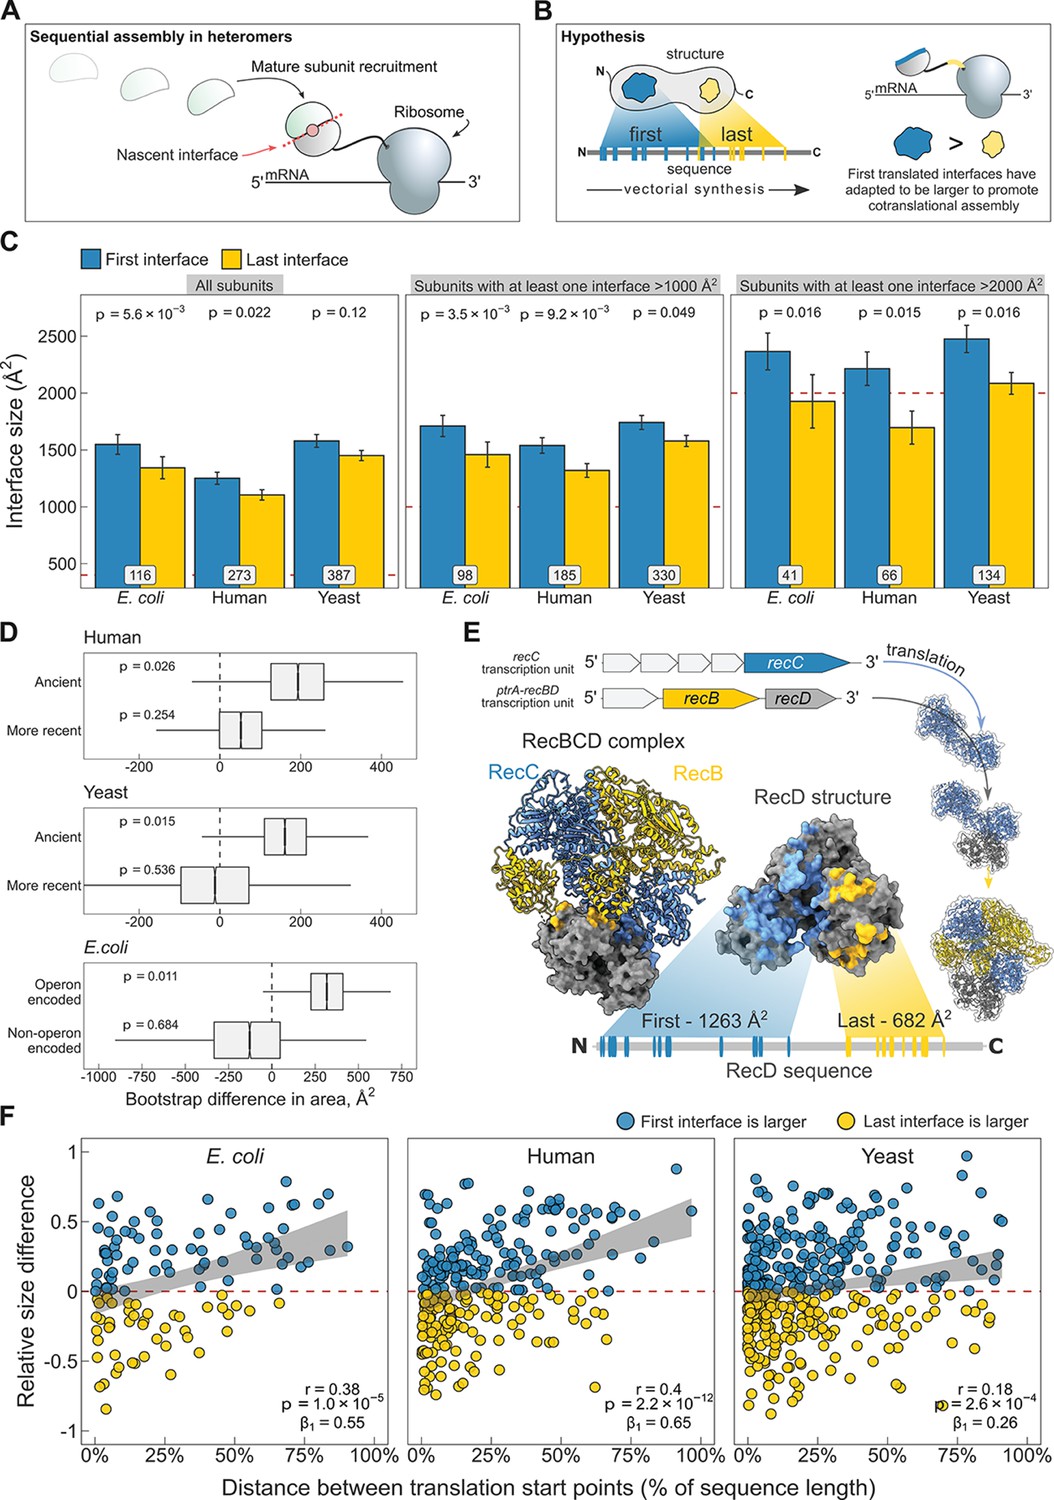
N-terminal interfaces tend to be larger than C-terminal interfaces supporting evolutionary selection for cotranslational assembly.
(A) Schematic representation of sequential cotranslational assembly in homomers. (B) Diagrammatic representation of the hypothesis test of the adaptive model of cotranslational assembly. (C) Area differences between the first and last translated interfaces in multi-interface heteromeric subunits across the species. Panels are ordered by the area cutoffs, 400, 1000, and 2000 Å2, which are satisfied if either the first or the last interface is larger than the given cutoff. Error bars represent standard error of the mean (SEM) and labels on bars show the number of proteins in each group. The p values were calculated with Wilcoxon signed-rank tests. (D) Bootstrap distributions of the area difference between the first and the last translated interfaces within two different categories. The first category (top two boxplots) is protein age, whereby yeast and human multi-interface heteromeric subunits are classified into ‘ancient’ and ‘more recent’ groups. In the second category (bottom boxplot), bacterial subunits are grouped based on whether or not they are encoded in operons. Positive values represent a larger first translated interface. The p values were calculated from 104 bootstrap resamples with correction for finite testing. (E) Example of an operon-encoded complex, the RecBCD nuclease (pdb: 5ld2). In the linear sequence of RecD, the interface with RecC is translated first, and that with RecB is last. The RecD:RecC interface is twice the area of the RecD:RecB interface, likely to promote cotranslational subunit recruitment. (F) Correlation between the relative distance of translational start points and the relative area difference of the first and last translated interfaces. Shaded lines represent the 95% confidence interval of the regression line. The Pearson’s correlation coefficient r, its p value, and the regression coefficient β1 are shown in the panels.
Figure 5—figure supplement 1
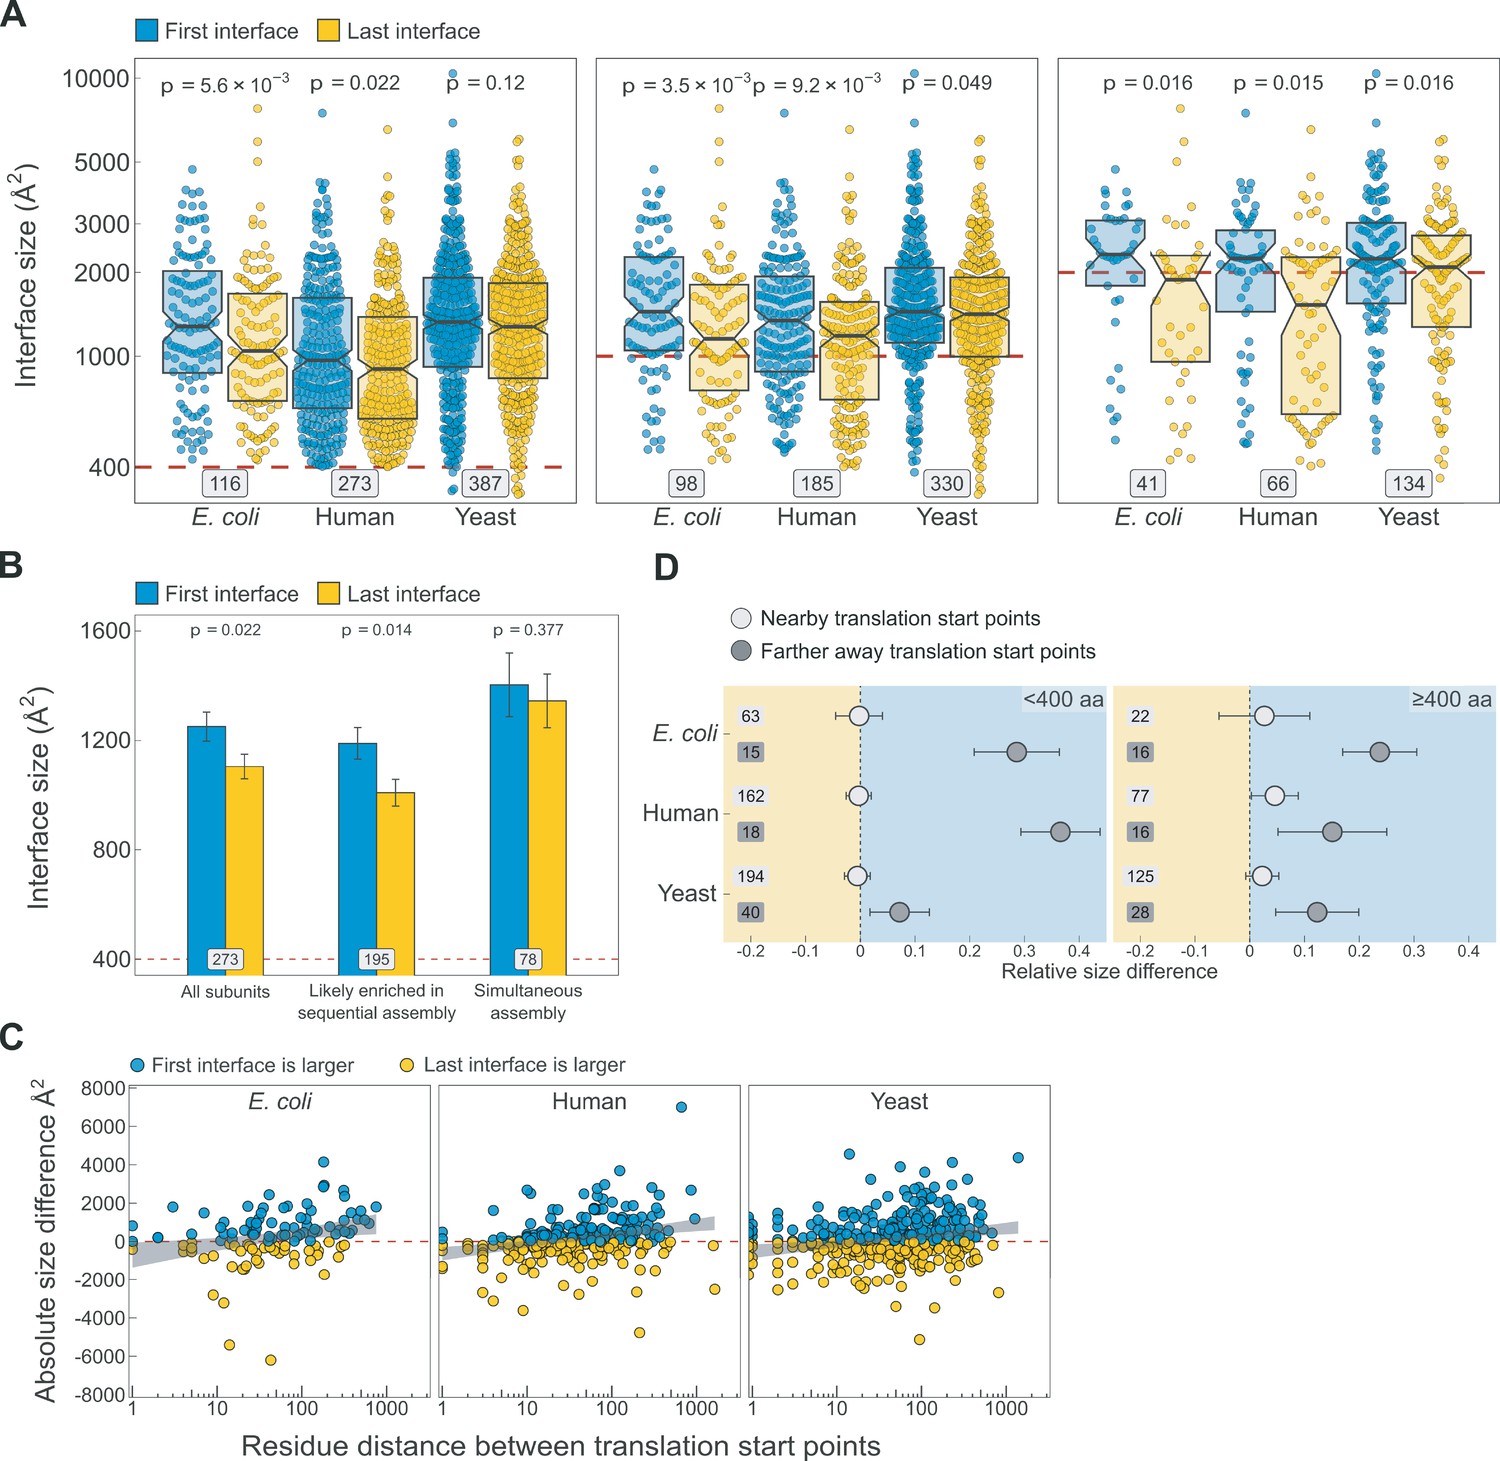
Additional analyses supporting the results shown in Figure 5.
(A) Full distribution of the first versus last translated interface size differences for all subunits, subunits with at least one interface >1000 Å2, and subunits with at least one interface >2000 Å2, in the first, second, and third panels, respectively. (B) Interface size differences between the first and last translated interfaces in human multi-interface heteromeric subunits, with those identified to have simultaneously forming interfaces shown as a separate group. Error bars represent standard error of the mean (SEM) and labels on bars show the number of proteins in each group. The p values were calculated with Wilcoxon signed-rank tests. (C) Scatter plots showing the absolute distance in amino acids between translational start points of the first and last translated interfaces and the absolute area difference across species. Shaded lines represent the 95% confidence interval of the regression line. (D) TIE-fighter plots demonstrating that interface separation increases the area difference in favour of the first interface independent of protein length. For all species, the relative translational distance interval was split at the mean, and the plot is divided into less and more than 400 amino acid long sequences. Dots represent the mean and error bars are SEM. Labels are the number of proteins in each group. Background colour reflects the direction of the size difference: blue – first interface larger, yellow – last interface larger.
Tables
Table 1
Table of yeast multi-interface heteromeric subunits, which have been shown to utilise the sequential mode of cotranslational assembly.
The yeast Set1, part of the COMPASS complex, binds multiple partners during its translation process (Halbach et al., 2009), but the order of these assembly steps is uncertain. In a partial structure of the histone methyltransferase complex (6b × 3), Set1 is found to have two biologically significant interfaces, the first with Swd3 and the last with Swd1. For the rest of the cases, the mature partners are known and the available structural data support a model where the first translated interface is larger relative to the last translated interface, likely to promote cotranslational subunit recruitment.
| Study | Nascent chain | Mature partner | First (Å2) | Last (Å2) | Source |
|---|---|---|---|---|---|
| Halbach et al., 2009 | Set1 | uncertain | 1,467 | 1,025 | 6b × 3 |
| Shiber et al., 2018; Fischer et al., 2020 | Fas2 | Fas1 | 4,226 | 484 | 6ql9 |
| Shiber et al., 2018 | Pfka1 | Pfk2 | 7,796 | 5,749 | 3o8o |
| Shiber et al., 2018 | Gcn3 | Gcd2 | 1,210 | 687 | Humphreys et al., 2021 |
| Panasenko et al., 2019 | Rpt2 | Rpt1 | 4,226 | 484 | 6fvt |
Additional files
Download links
A two-part list of links to download the article, or parts of the article, in various formats.
Downloads (link to download the article as PDF)
Open citations (links to open the citations from this article in various online reference manager services)
Cite this article (links to download the citations from this article in formats compatible with various reference manager tools)
Large protein complex interfaces have evolved to promote cotranslational assembly
eLife 11:e79602.
https://doi.org/10.7554/eLife.79602


