Brain atlas for glycoprotein hormone receptors at single-transcript level
- Center for Translational Medicine and Pharmacology, Icahn School of Medicine at Mount Sinai, United States
- Department of Medicine and of Pharmacological Sciences, Icahn School of Medicine at Mount Sinai, United States
- Department of Pathology, Emory University School of Medicine, United States
- Department of Psychiatry, Icahn School of Medicine at Mount Sinai, United States
- Alamak Biosciences, United States
- Memorial Sloan Kettering Cancer Center, United States
- Department of Pediatrics, Icahn School of Medicine at Mount Sinai, United States
- Maine Medical Center Research Institute, United States
- Faculty of Life and Health Sciences, and Brain Cognition and Brain Disease Institute, Shenzhen Institute of Advanced technology, Chinese Academy of Sciences, China
Figures
Figure 1 with 2 supplements
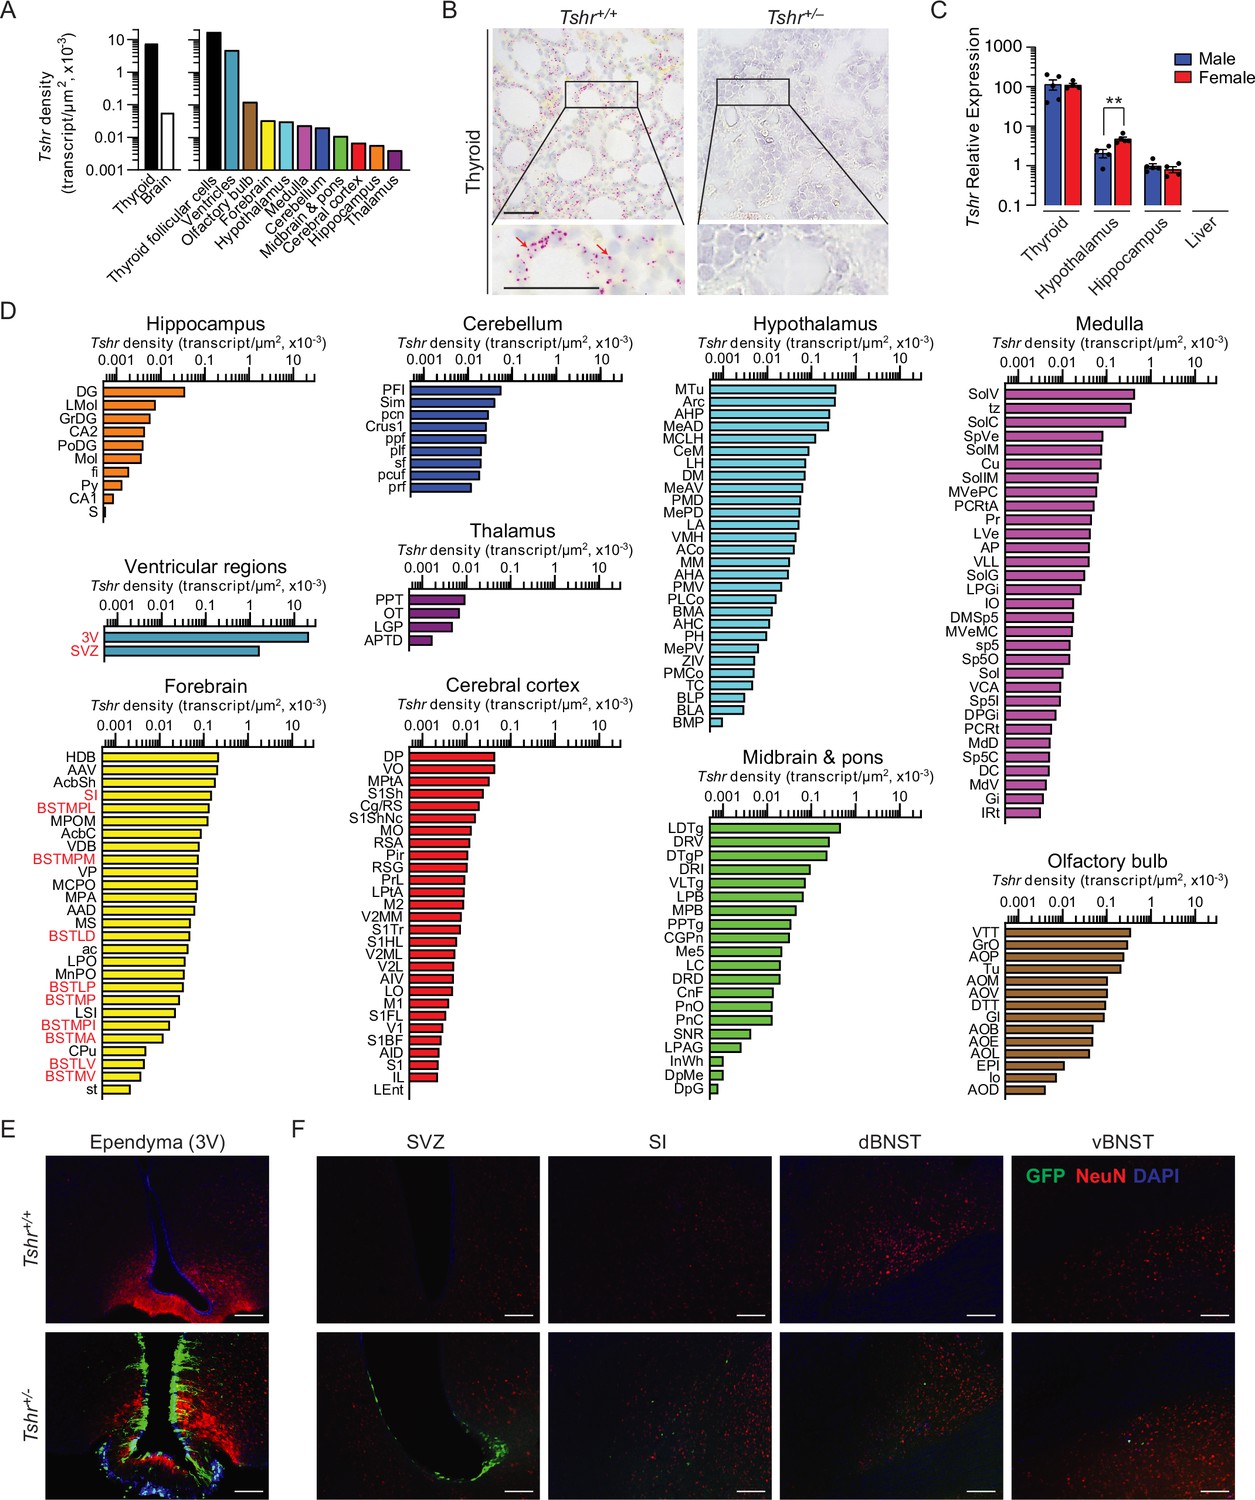
Tshr expression in the mouse brain.
(A) Tshr transcript density in the thyroid and various brain regions detected by RNAscope. (B) RNAscope probe specificity is confirmed in the Tshr+/+ thyroid. Tshr–/– thyroid was used as negative control. Scale bar: 50 µm. (C) Tshr expression in the mouse hypothalamus and hippocampus using quantitative PCR. The thyroid and liver serve as positive and negative controls, respectively. Statistics: mean ± SEM, N = 4–5 mice/group, **p<0.01. Data were analyzed by two-tailed Student’s t-test using Prism v.9.3.1 (GraphPad, San Diego, CA). Significance was set at p<0.05. (D) Tshr transcript density in nuclei and subnuclei of the ventricular regions, olfactory bulb, forebrain, hypothalamus, medulla, cerebellum, midbrain and pons, cerebral cortex, hippocampus, and thalamus. (E) Abundant GFP immunofluorescence (green) was detected in the ependymal layer of the third ventricle in Tshr+/– heterozygous mice, in which a GFP cassette replaced exon 1 of the Tshr gene. This GFP signal was absent in Tshr+/+ mice. (F) GFP immunofluorescence was also detected in the subventricular zone (SVZ) of the lateral ventricle, and substantia innominata (SI) and dorsal and ventral bed nucleus of stria terminalis (BNST) in the forebrain of the Tshr+/– mice. Sections were co-stained with DAPI (blue) and a neuronal marker, NeuN (red). Scale bar: 100 µm.
-
Figure 1—source data 1
Tshr density in brain regions, nuclei, and subnuclei.
- https://cdn.elifesciences.org/articles/79612/elife-79612-fig1-data1-v2.xlsx
-
Figure 1—source data 2
Tshr mRNA expression levels in mouse tissues (qPCR).
- https://cdn.elifesciences.org/articles/79612/elife-79612-fig1-data2-v2.xlsx
Figure 1—figure supplement 1
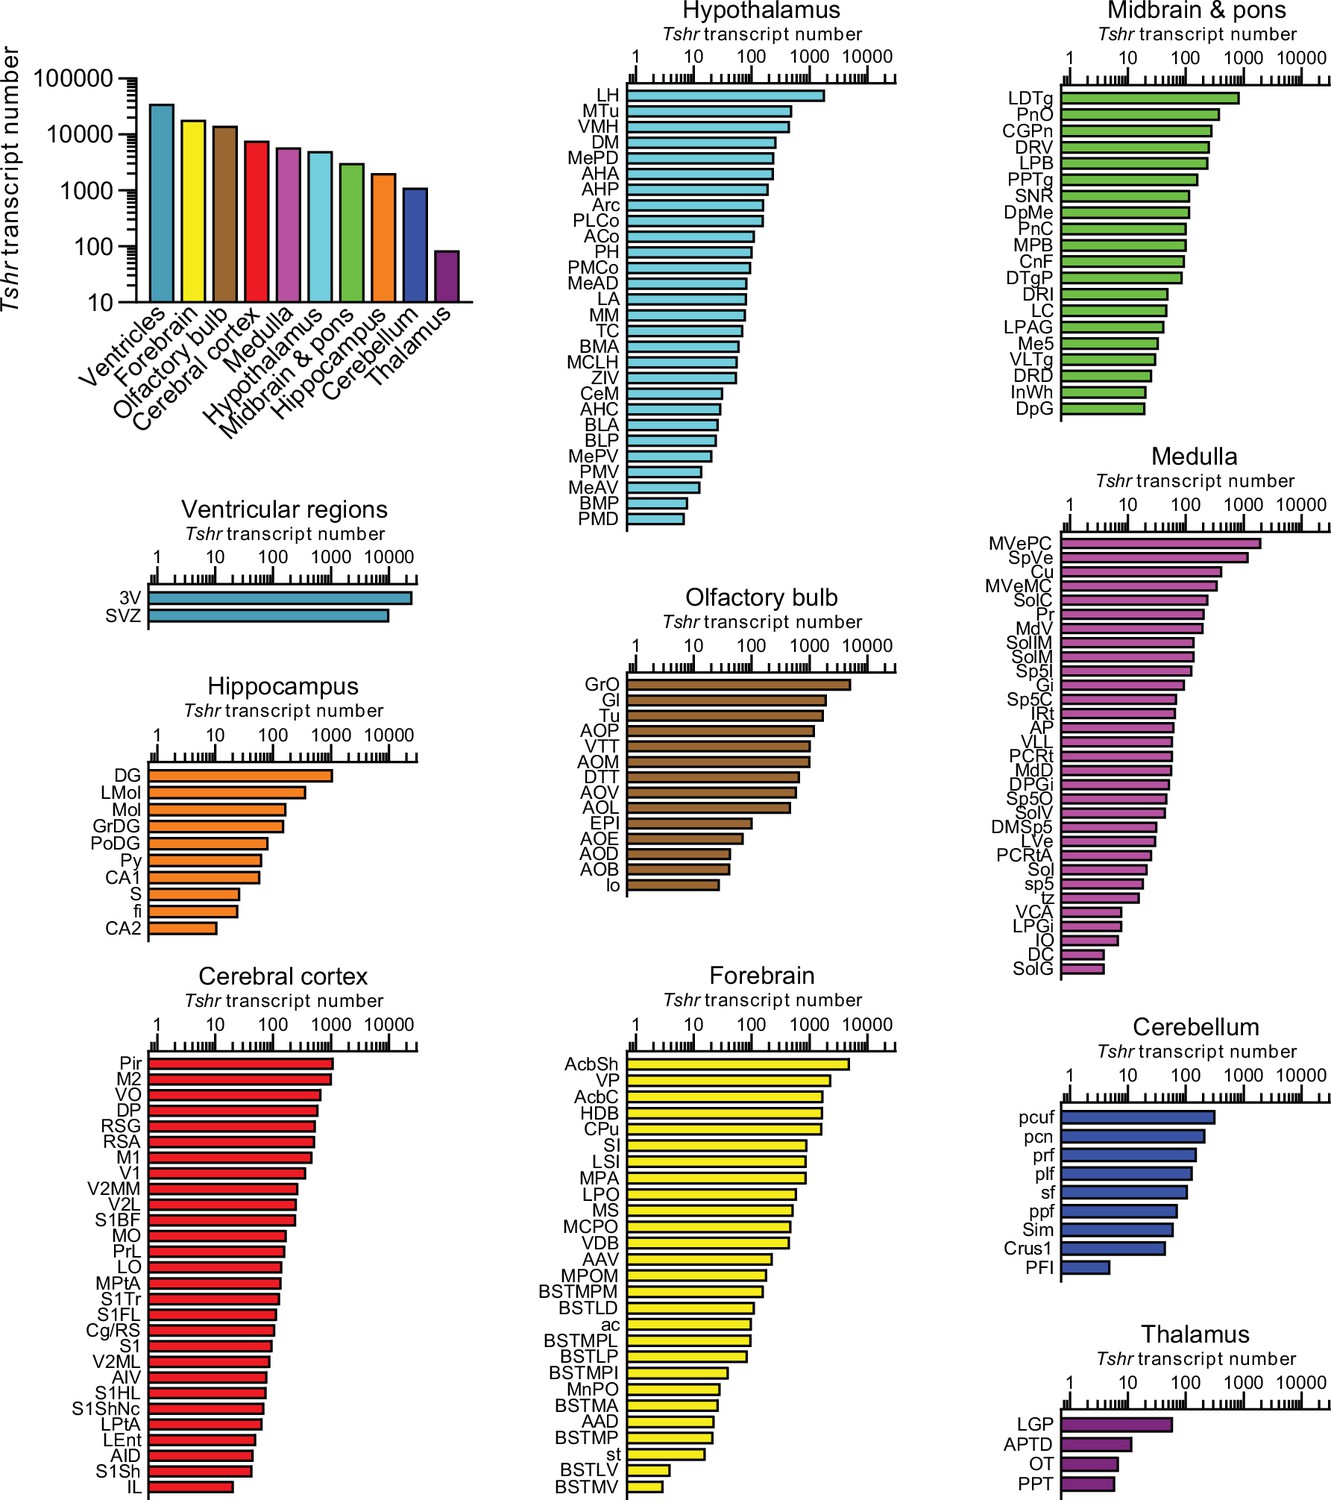
Raw Tshr transcript counts in each brain region, nuclei, and subnuclei.
-
Figure 1—figure supplement 1—source data 1
Tshr transcript count in brain regions, nuclei, and subnuclei.
- https://cdn.elifesciences.org/articles/79612/elife-79612-fig1-figsupp1-data1-v2.xlsx
Figure 1—figure supplement 2
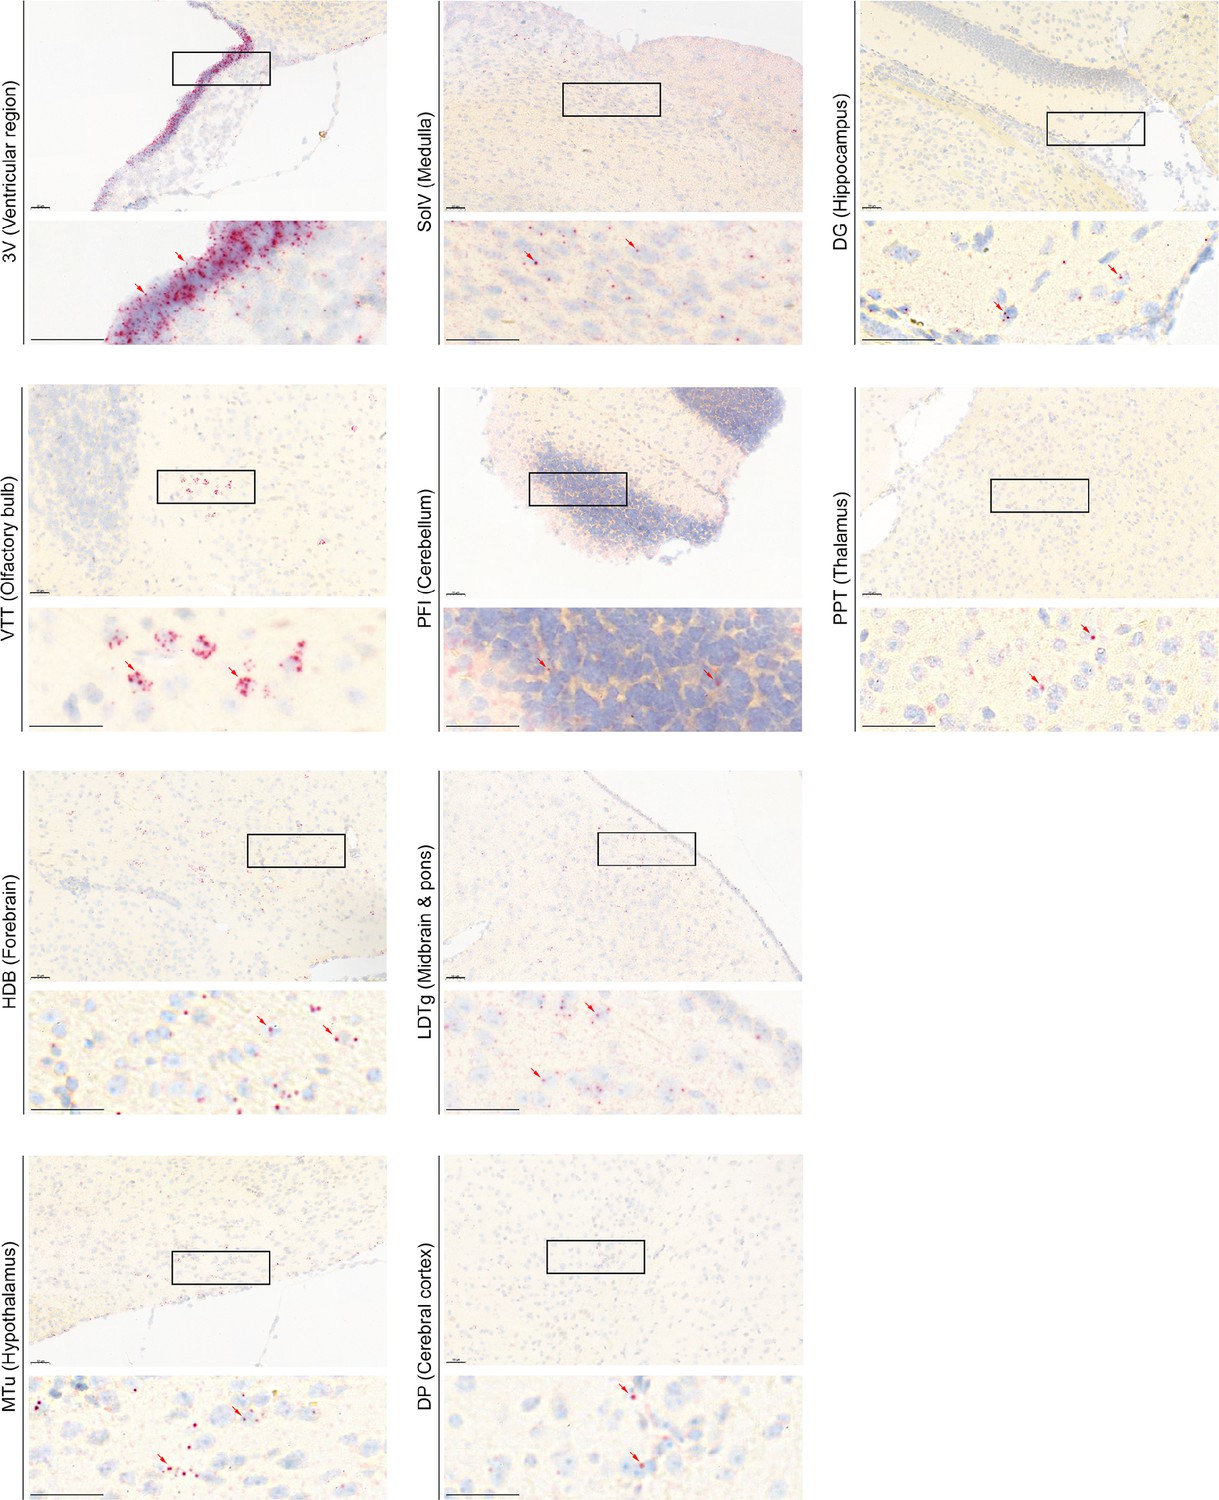
Representative RNAscope micrographs showing Tshr transcripts in various regions of the brain.
Representative RNAscope micrographs showing Tshr transcripts in the ependymal layer of the third ventricle (3V), ventral tenia tecta (VTT) of the olfactory bulb, nucleus of the horizontal limb of the diagonal band (HDB) of the forebrain, medial tuberal nucleus (MTu) of the hypothalamus, solitary nucleus, ventral part (SolV) of the medulla, paraflocculus (PFI) of the cerebellum, laterodorsal tegmental nucleus (LDTg) of the midbrain and pons, dorsal peduncular cortex (DP) of the cerebral cortex, dentate gyrus (DG) of the hippocampus, and posterior pretectal nucleus (PPT) of the thalamus.
Scale bar: 50 µm.
Figure 2 with 2 supplements
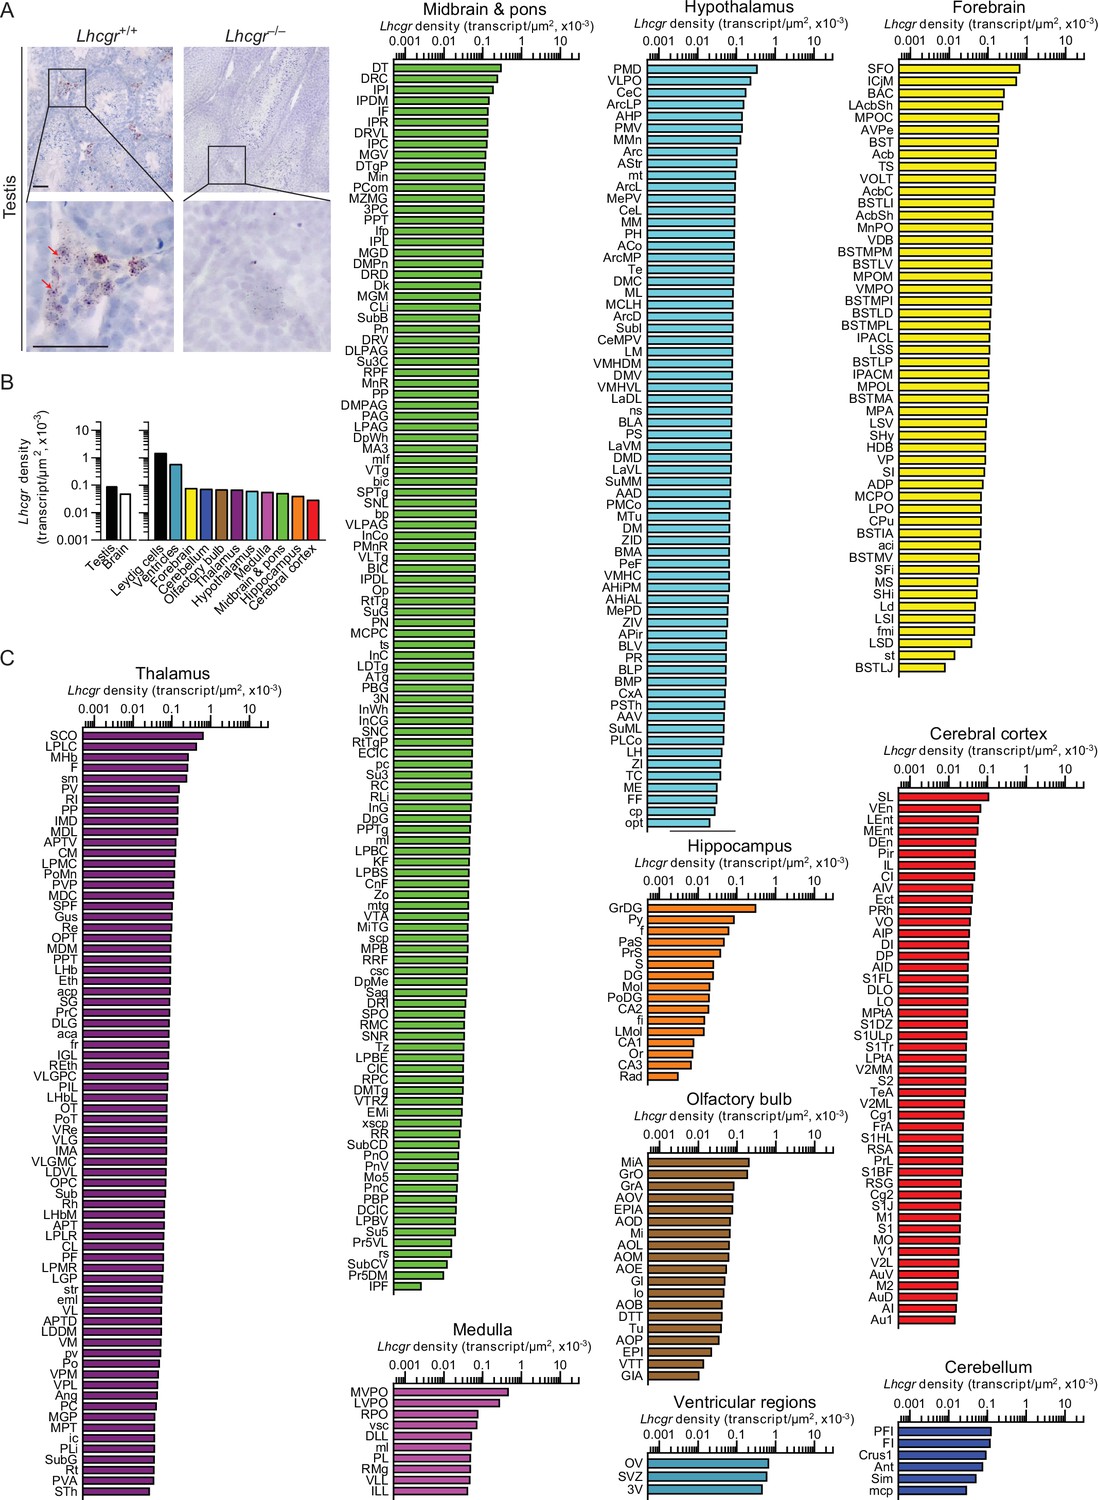
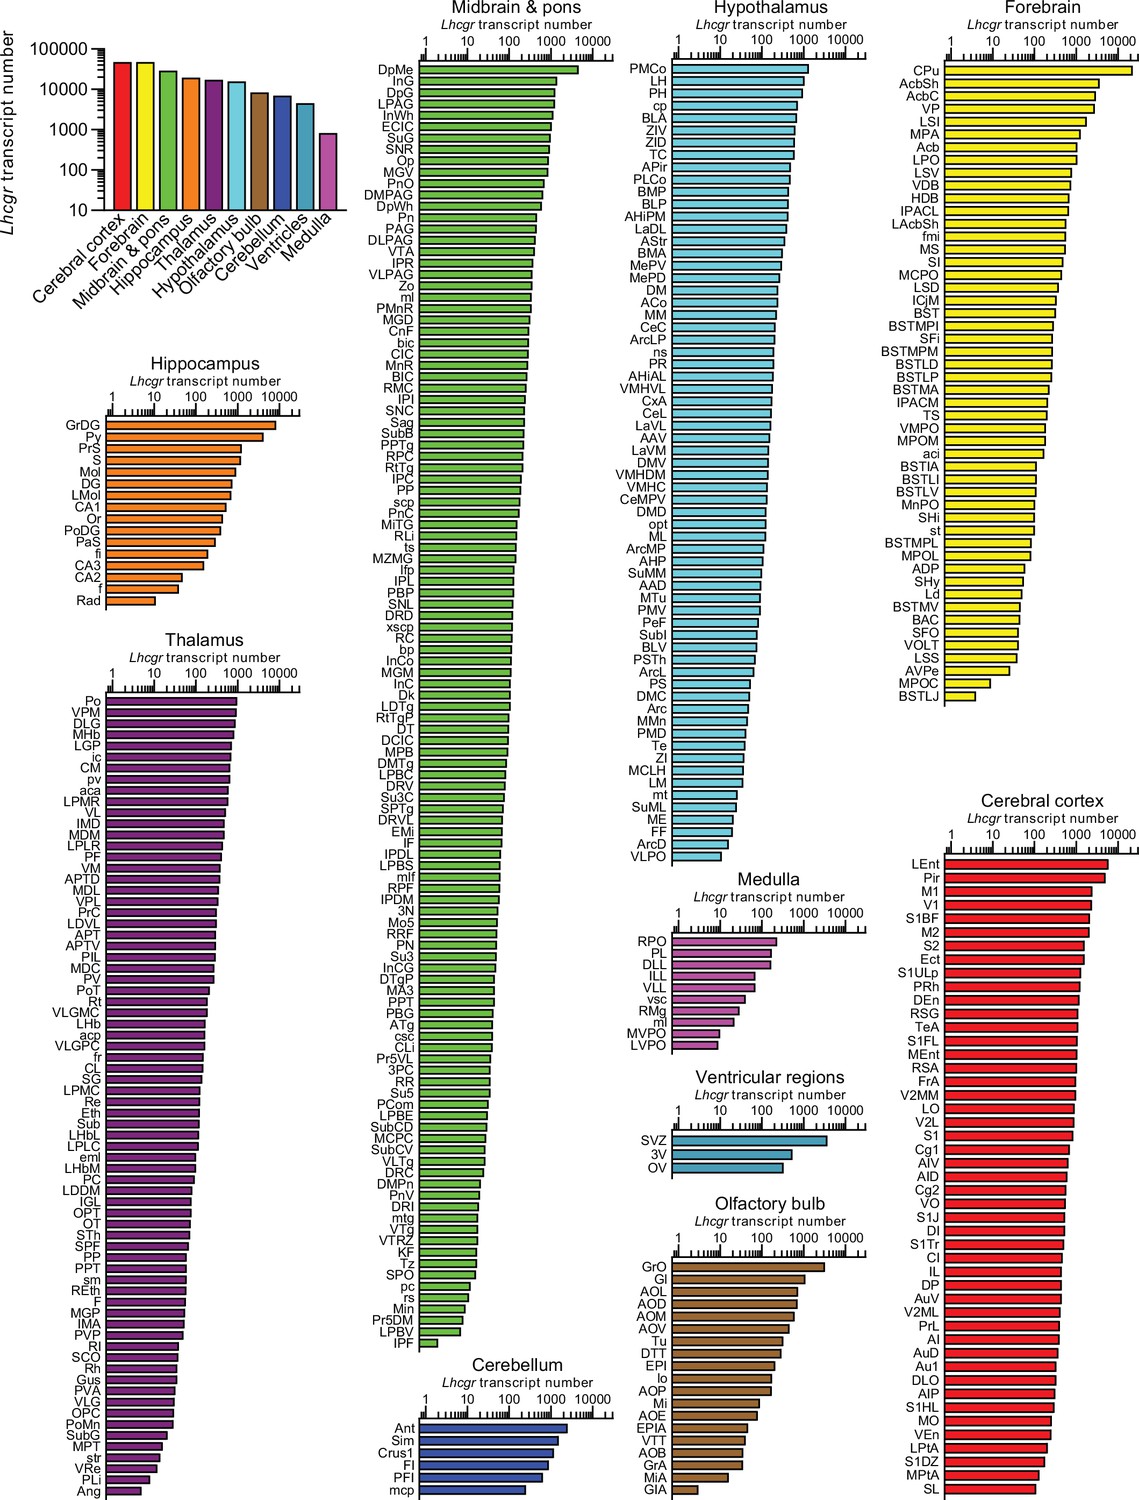
Lhcgr expression in the mouse brain.
(A) RNAscope signals were detected in the Leydig cells, but not juxtaposed Sertoli cells, in the mouse testis, confirming probe specificity. Scale bar: 25 µm. (B) Lhcgr transcript density in the testis and various brain regions detected by RNAscope. (C) Lhcgr transcript density in nuclei and subnuclei of the ventricular regions, forebrain, cerebellum, olfactory bulb, thalamus, hypothalamus, medulla, midbrain and pons, hippocampus and cerebral cortex.
-
Figure 2—source data 1
Lhcgr density in brain regions, nuclei, and subnuclei.
- https://cdn.elifesciences.org/articles/79612/elife-79612-fig2-data1-v2.xlsx
Figure 2—figure supplement 1
Raw Lhcgr transcript counts in each brain region, nuclei, and subnuclei.
-
Figure 2—figure supplement 1—source data 1
Lhcgr transcript count in brain regions, nuclei, and subnuclei.
- https://cdn.elifesciences.org/articles/79612/elife-79612-fig2-figsupp1-data1-v2.xlsx
Figure 2—figure supplement 2
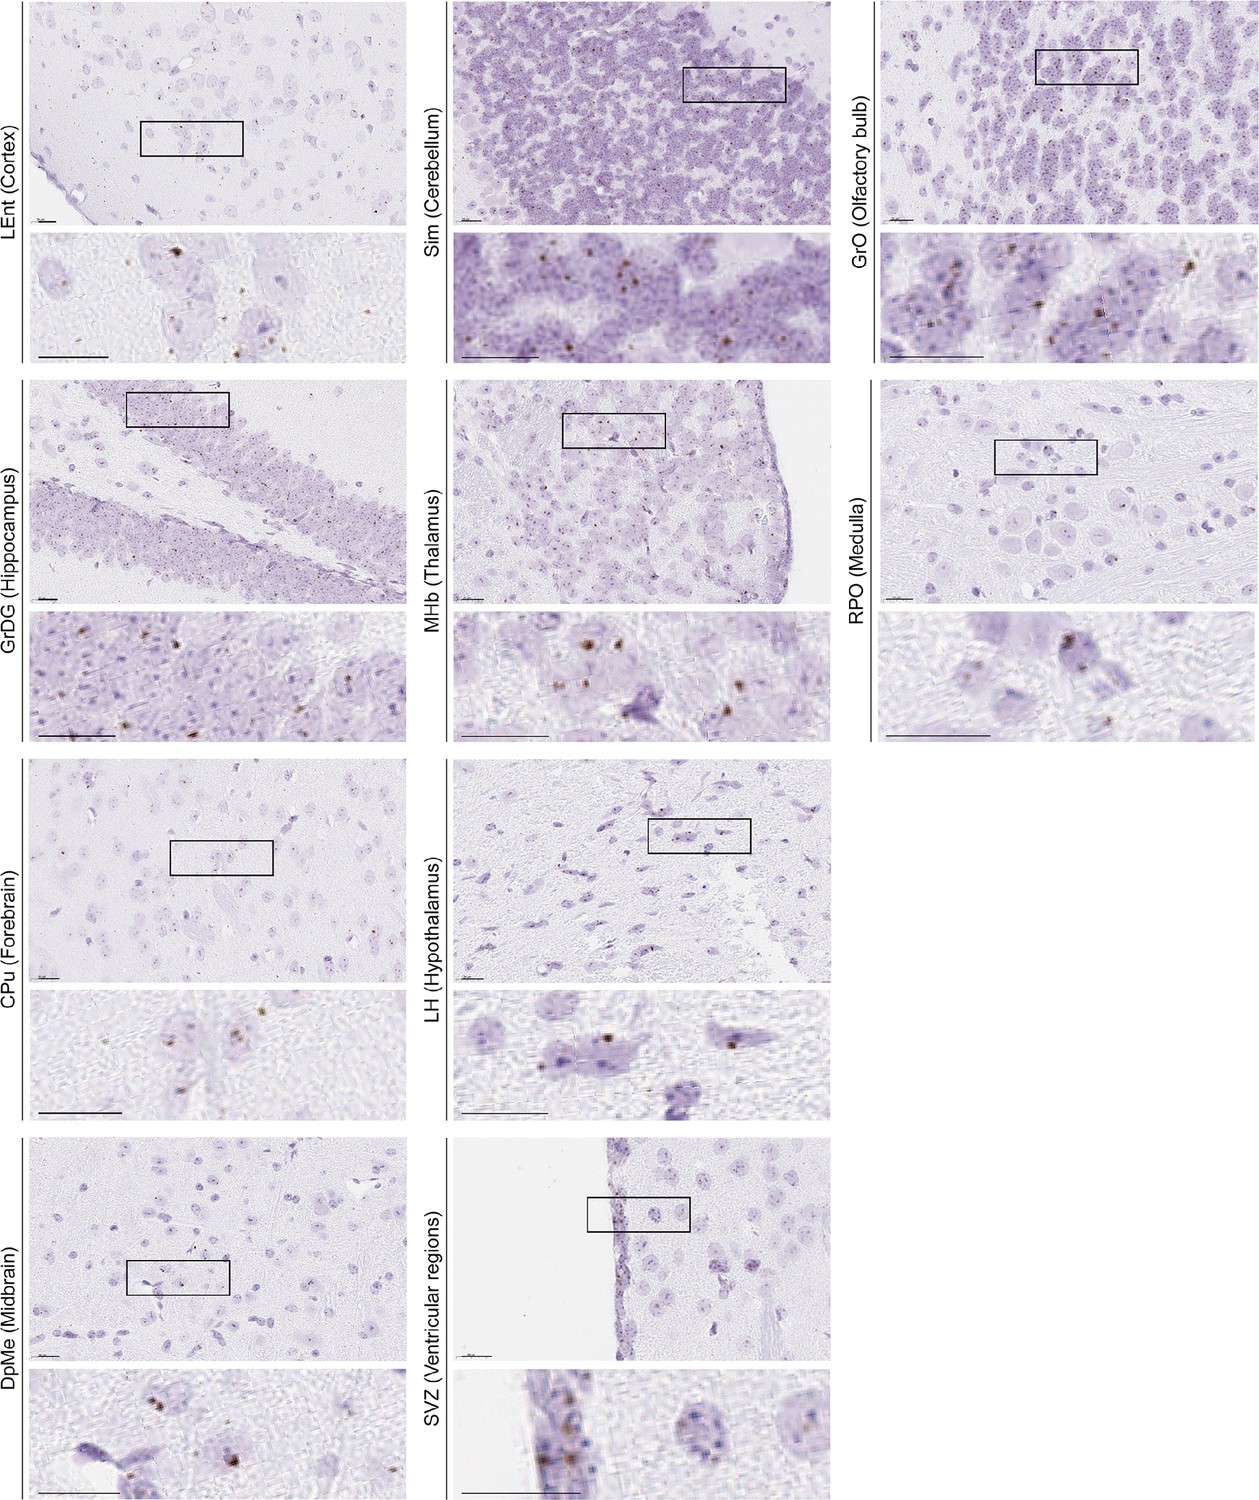
Representative RNAscope micrographs showing Lhcgr transcripts in various regions of the brain.
Representative RNAscope micrographs showing Lhcgr transcripts in the olfactory ventricle (OV), subfornical organ (SFO) of the forebrain, paraflocculus (PFI) of the cerebellum, mitral cell layer of the accessory olfactory bulb (MiA), subcommissural organ (SCO) of the thalamus, premammillary nucleus, dorsal part (PMD) of the hypothalamus, medioventral periolivary nucleus (MVPO) of the medulla, dorsal terminal nucleus of the accessory optic tract (DT) of the midbrain and pons, granular layer of the dentate gyrus (GrDG) of the hippocampus, and semilunar nucleus (SL) of the cerebral cortex.
Scale bar: 50 µm.
Figure 3 with 2 supplements
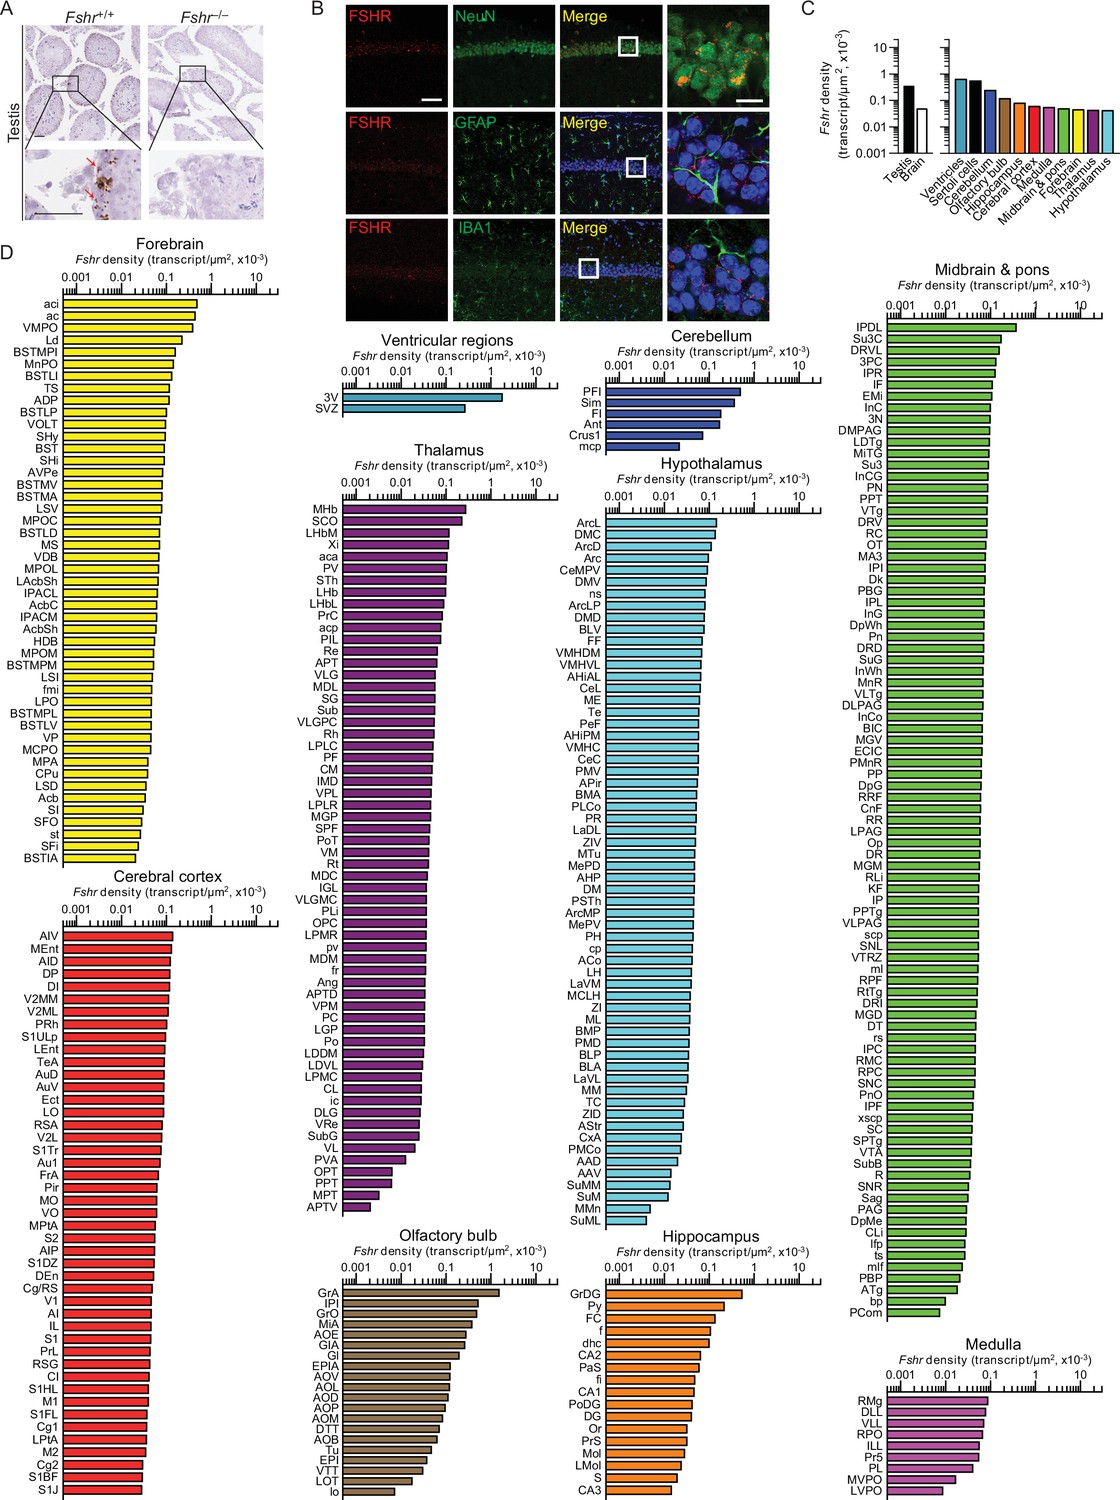
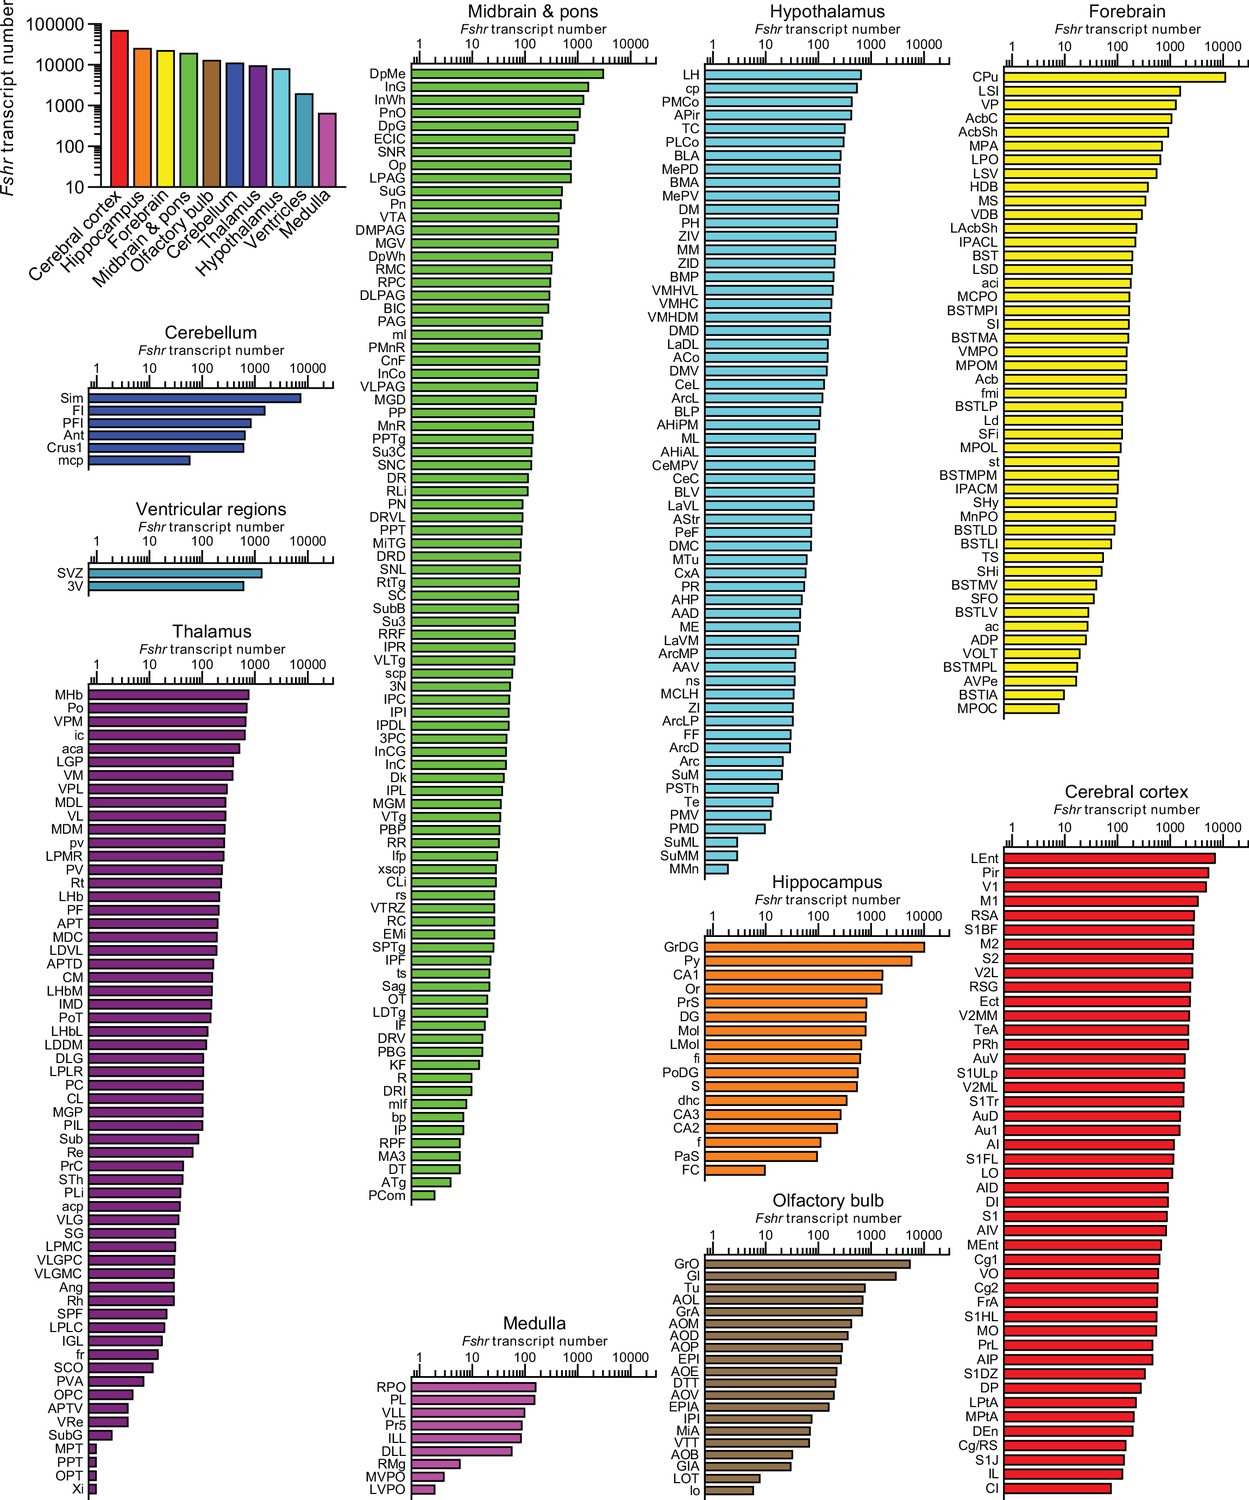
Fshr expression in the mouse brain.
(A) RNAscope signals were detected in the Sertoli cells, but not juxtaposed Leydig cells, in the mouse testis, confirming probe specificity. Scale bar: 50 µm. (B) Follicle-stimulating hormone receptor (FSHR) immunofluorescence (red) was colocalized with NeuN-positive neurons, but not with GFAP-positive glial cells or IBA1-positive microglia. Scale bar: 100 µm (magnified view, 10 µm). (C) Fshr transcript density in the testis and various brain regions detected by RNAscope. (D) Fshr transcript density in nuclei and subnuclei of the ventricular regions, cerebellum, olfactory bulb, hippocampus, cerebral cortex, medulla, midbrain and pons, forebrain, thalamus, and hypothalamus.
-
Figure 3—source data 1
Fshr density in brain regions, nuclei and subnuclei.
- https://cdn.elifesciences.org/articles/79612/elife-79612-fig3-data1-v2.xlsx
Figure 3—figure supplement 1
Raw Fshr transcript counts in each brain region, nuclei, and subnuclei.
-
Figure 3—figure supplement 1—source data 1
Fshr transcript count in brain regions, nuclei, and subnuclei.
- https://cdn.elifesciences.org/articles/79612/elife-79612-fig3-figsupp1-data1-v2.xlsx
Figure 3—figure supplement 2
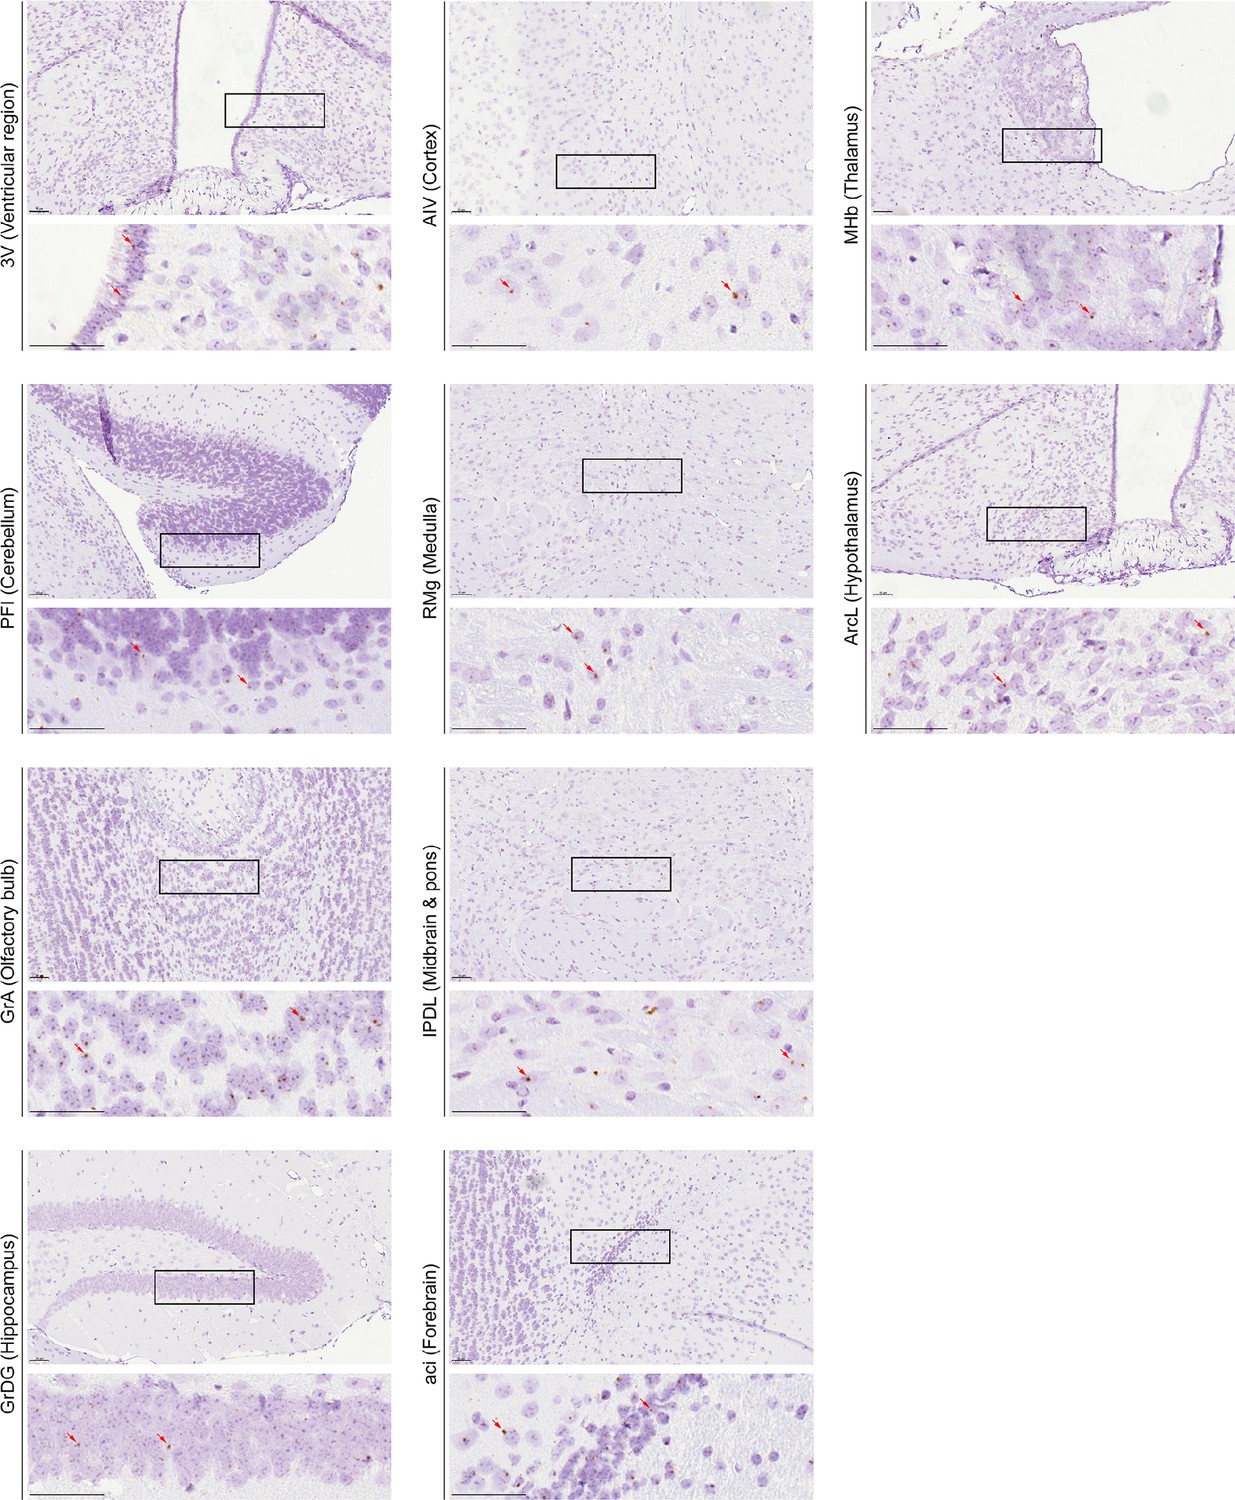
Representative RNAscope micrographs showing Fshr transcripts in various regions of the brain.
Representative RNAscope micrographs showing Fshr transcripts in the ependymal layer of the third ventricle (3V), paraflocculus (PFI) of the cerebellum, granule cell layer of the accessory olfactory bulb (GrA), granular layer of the dentate gyrus (GrDG) of the hippocampus, agranular insular cortex, ventral part (AIV) of the cerebral cortex, raphe magnus nucleus (RMg) of the medulla, interpeduncular nucleus, dorsolateral subnucleus (IPDL) of the midbrain and pons, anterior commissure, intrabulbar part (aci) of the forebrain, medial habenular nucleus (MHb) of the thalamus, and arcuate hypothalamic nucleus, lateral part (ArcL) of the hypothalamus.
Scale bar: 50 µm.
Figure 4
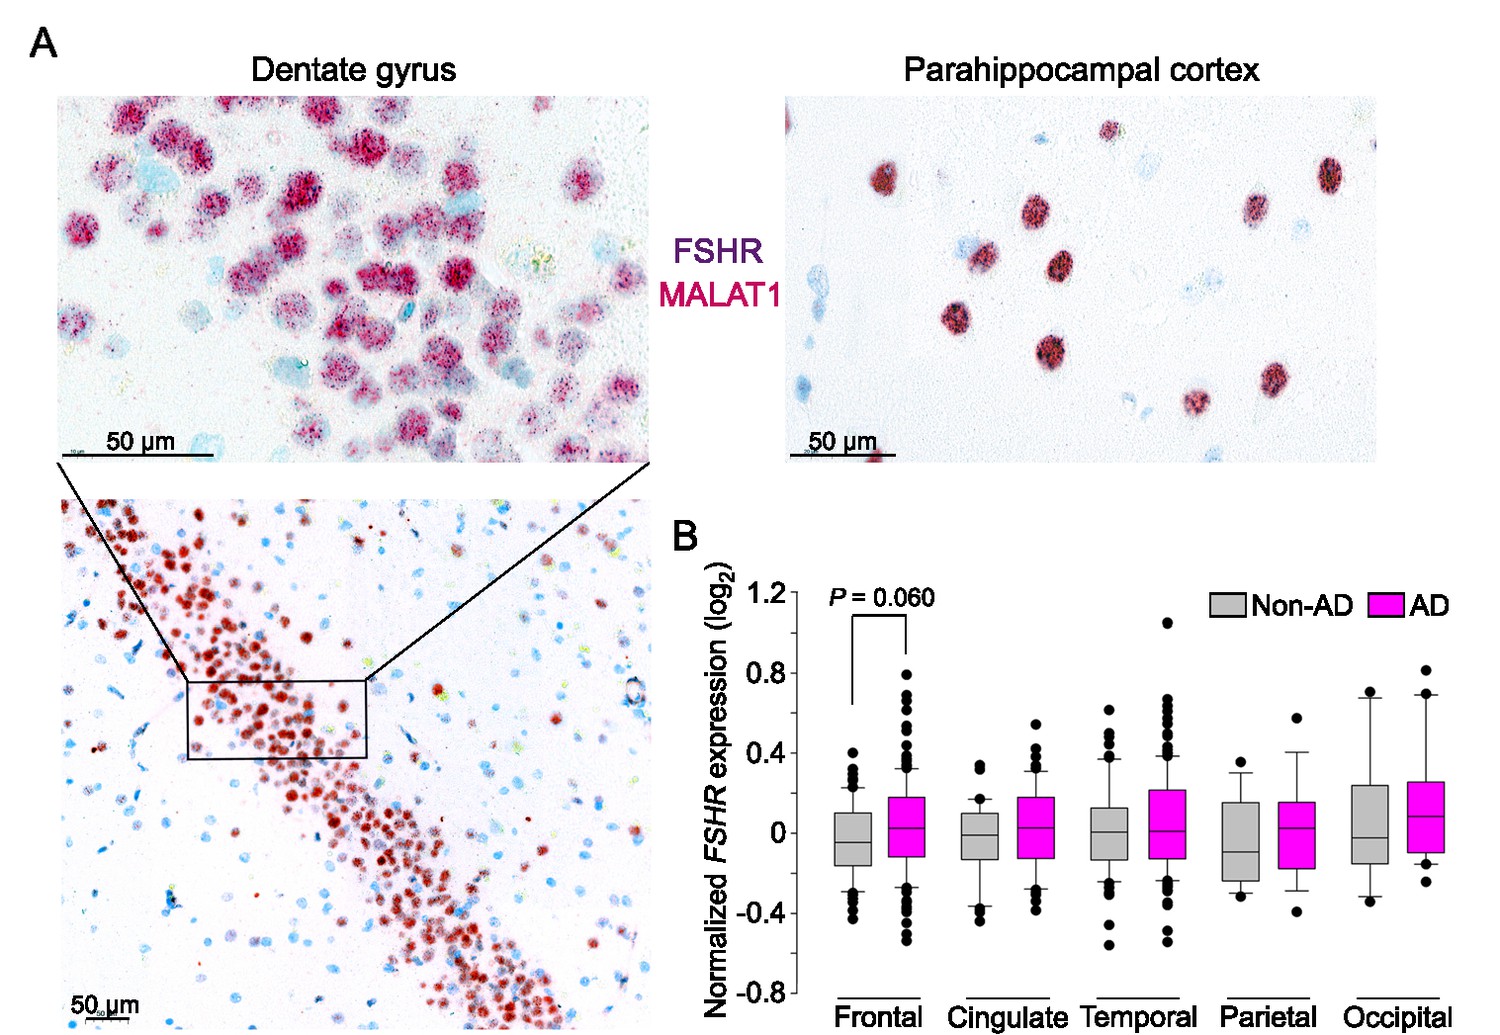
FSHR expression in the human brain.
(A) FSHR expression in the human hippocampus and parahippocampal cortex was detected by ViewRNA in neuronal cells that coexpress the noncoding RNA MALAT1. (B) FSHR mRNA expression in the frontal, cingulate, temporal, parietal, and occipital subregions of human cortex in postmortem normal and Alzheimer’s disease (AD) brains (Affymetrix microarray, from GEO accession: GSE84422). Statistics: mean ± SEM, N = 2–15group, Data were analyzed by two-tailed Student’s t-test using Prism v.9.3.1 (GraphPad, San Diego, CA).
-
Figure 4—source data 1
FSHR mRNA expression in the frontal, cingulate, temporal, parietal, and occipital subregions of human cortex in postmortem normal and Alzheimer’s disease (AD) brains.
- https://cdn.elifesciences.org/articles/79612/elife-79612-fig4-data1-v2.xlsx
Tables
Table 1
Known functions of thyroid-stimulating hormone receptor (TSHR), follicle-stimulating hormone receptor (FSHR), and luteinizing hormone/human chorionic gonadotropin receptor (LHCGR) in brain.
| Receptor | Species | Brain region | Possible function | Reference |
|---|---|---|---|---|
| TSHR | Rat | Hypothalamus | Aging | Emanuele et al., 1985 |
| Mice | Hippocampus | Spatial learning and memory | Luan et al., 2020 | |
| Rat | Hypothalamus, hippocampus, pyriform and postcingulate cortex | Thyroid regulation | Crisanti et al., 2001 | |
| Rat | Hypothalamus | Feeding behavior | Burgos et al., 2016 | |
| Human | Hypothalamus, amygdala, cingulate gyrus, frontal cortex, hippocampus, thalamus | Mood disorders | Naicker and Naidoo, 2018 | |
| Quail | Hypothalamus | Seasonal reproduction | Williams, 2011 | |
| FSHR | Yak | Hypothalamus, pineal gland | Follicle growth, maturation, estrus | Huo et al., 2017 |
| Mice | Hippocampus | Mood regulation | Bi et al., 2020 | |
| LHCGR | Rat | Hypothalamus | Aging | Emanuele et al., 1985 |
| Mice | Hippocampus, cortex | Spatial memory, cognition, plasticity | Blair et al., 2019 | |
| Rat | Hippocampus | Brain metabolism | Liu et al., 2007 | |
| Fish | Hypothalamus | Functional roles | Peng et al., 2018 | |
| Mice | Hippocampus | Promote amyloid-β formation | Lin et al., 2010 | |
| Mice | Cortex | Regulation of neurosteroid production | Apaja et al., 2004 | |
| Mice | Hypothalamus, hippocampus, midbrain, cortex | Regulation of reproductive functions | Hämäläinen et al., 1999 | |
| Yak | Hypothalamus, pineal gland | Follicle growth, maturation, estrus | Huo et al., 2017 | |
| Rat | Hypothalamus, hippocampus, dentate gyrus, cerebellum, brainstem, cortex | Cognitive function (Alzheimer’s disease) | Lei et al., 1993 |
Additional files
Download links
A two-part list of links to download the article, or parts of the article, in various formats.
Downloads (link to download the article as PDF)
Open citations (links to open the citations from this article in various online reference manager services)
Cite this article (links to download the citations from this article in formats compatible with various reference manager tools)
Brain atlas for glycoprotein hormone receptors at single-transcript level
eLife 11:e79612.
https://doi.org/10.7554/eLife.79612


