Wide-ranging consequences of priority effects governed by an overarching factor
- Department of Biology, Stanford University, United States
- Biocontrol and Molecular Ecology, Manaaki Whenua - Landcare Research, New Zealand
- Department of Plant Biology, Carnegie Institution for Science, United States
- Department of Ecology, Evolution and Marine Biology, University of California, Santa Barbara, United States
- Koch Institute for Integrative Cancer Research, Massachusetts Institute of Technology, United States
- Department of Earth System Science, Stanford University, United States
Figures
Figure 1
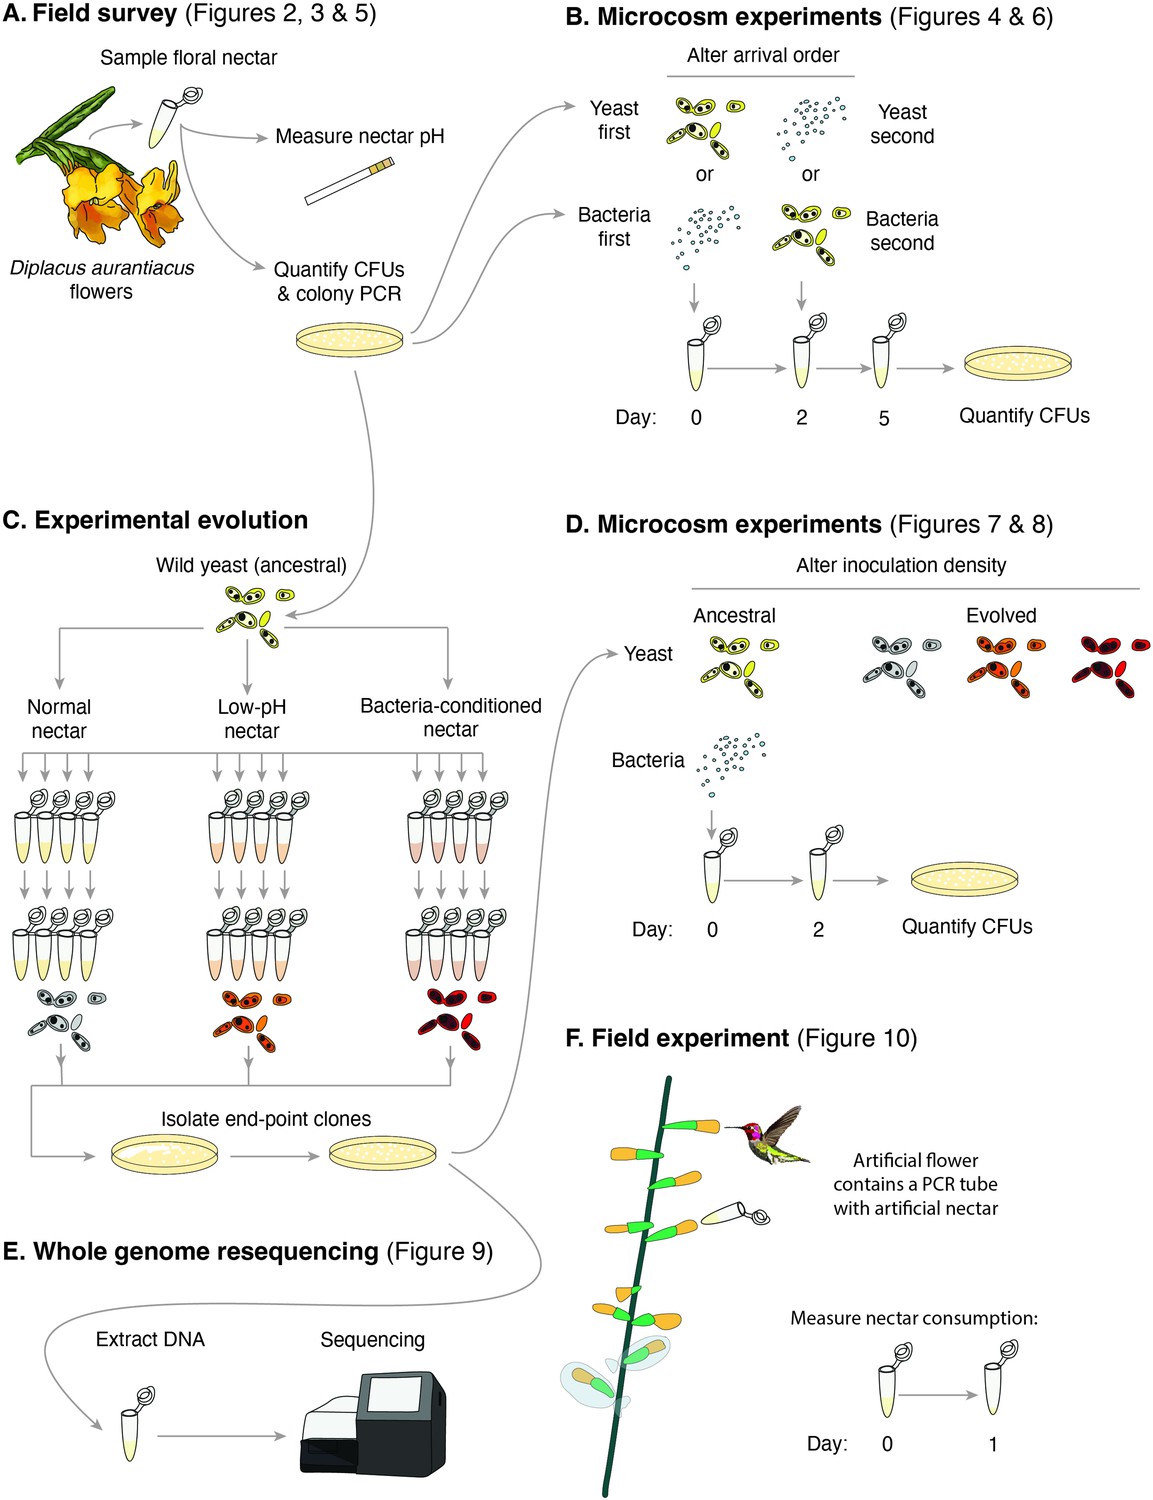
Schematic of the approaches taken in this study.
(A) Field survey to characterize the distribution of yeast and bacteria in flowers as well as nectar pH of Diplacus aurantiacus, (B) initial microcosm experiments to assess strength of priority effects and identify nectar pH as a potential driver, (C) experimental evolution to study adaptation to low-pH and bacteria-conditioned nectar, (D) secondary microcosm experiments to study the effect of adaptation to nectar environments, (E) whole genome resequencing to identify genomic differences between evolved strains, and (F) field experiments to study the effect of low pH on nectar consumption by pollinators.
Figure 2 with 4 supplements
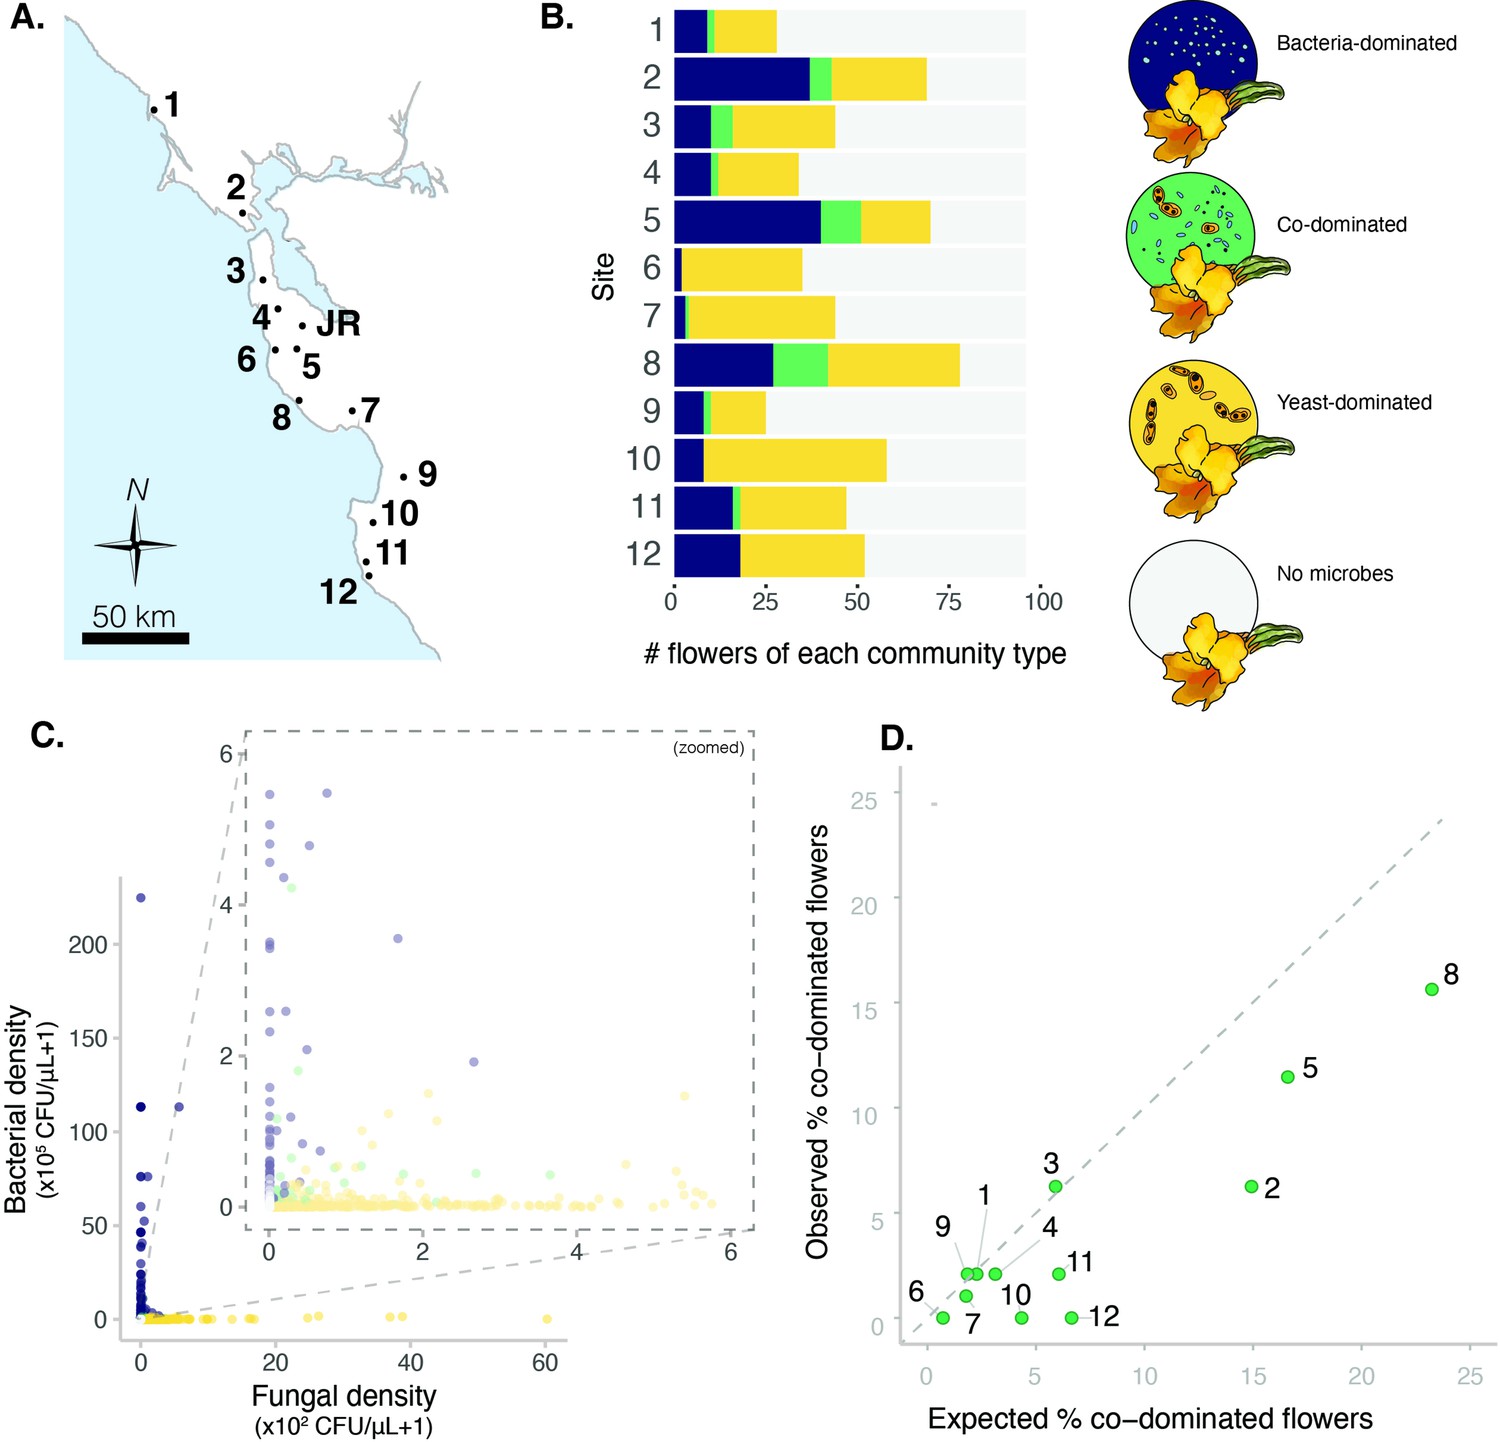
Sites vary in regional dominance of bacteria and yeast.
(A) Ninety-six Diplacus aurantiacus flowers were harvested from each of 12 field sites in and around the San Francisco Peninsula in California, USA (Figure 2—source data 1) with (B) variable numbers of flowers classified as bacteria-dominated (blue), fungi-dominated (yellow), co-dominated (green) flowers, or flowers where microbes were too rare to determine (grey) (n=1152). (C) Flowers are often dominated by bacteria or yeast, but rarely both. Each point represents a floral community and inset plot represents zoomed-in version of the plot behind it (n=1152). (D) Co-dominated flowers were observed less frequently than expected. In panel D, each point represents a site, with the numbers indicating the site numbers shown in panels A and B. In panel A, the location of Jasper Ridge Biological Preserve (JR) is also indicated (n=12).
-
Figure 2—source data 1
Field sites in Diplacus aurantiacus field survey.
- https://cdn.elifesciences.org/articles/79647/elife-79647-fig2-data1-v2.docx
-
Figure 2—source data 2
Association between percentage of flowers colonized by yeast or bacteria per plant and the distance between host plants.
To determine whether climatic factors and seasonality influence microbial abundance in this system, WorldClim bioclimatic variables (average annual mean temperature, temperature seasonality, and average monthly precipitation) were extracted for each plant and site. These variables, along with sampling date, were modeled as variables predicting bacterial and fungal abundance, respectively, in a linear mixed model with site as a random effect.
- https://cdn.elifesciences.org/articles/79647/elife-79647-fig2-data2-v2.docx
-
Figure 2—source data 3
Association between bioclimate variables, date of sampling, and microbial colonization.
Linear mixed model predicting bacterial or yeast abundance by average annual temperature (WorldClim bio1), temperature seasonality (WorldClim bio4), annual precipitation (WorldClim bio12), sampling date, with site location included as a random effect (n=144).
- https://cdn.elifesciences.org/articles/79647/elife-79647-fig2-data3-v2.docx
Figure 2—figure supplement 1

Preliminary association between flow cytometry cell counts (populations identified by forward and side scatter) and colony forming units of A. nectaris growing on tryptic soy agar with cycloheximide.
Figure 2—figure supplement 2
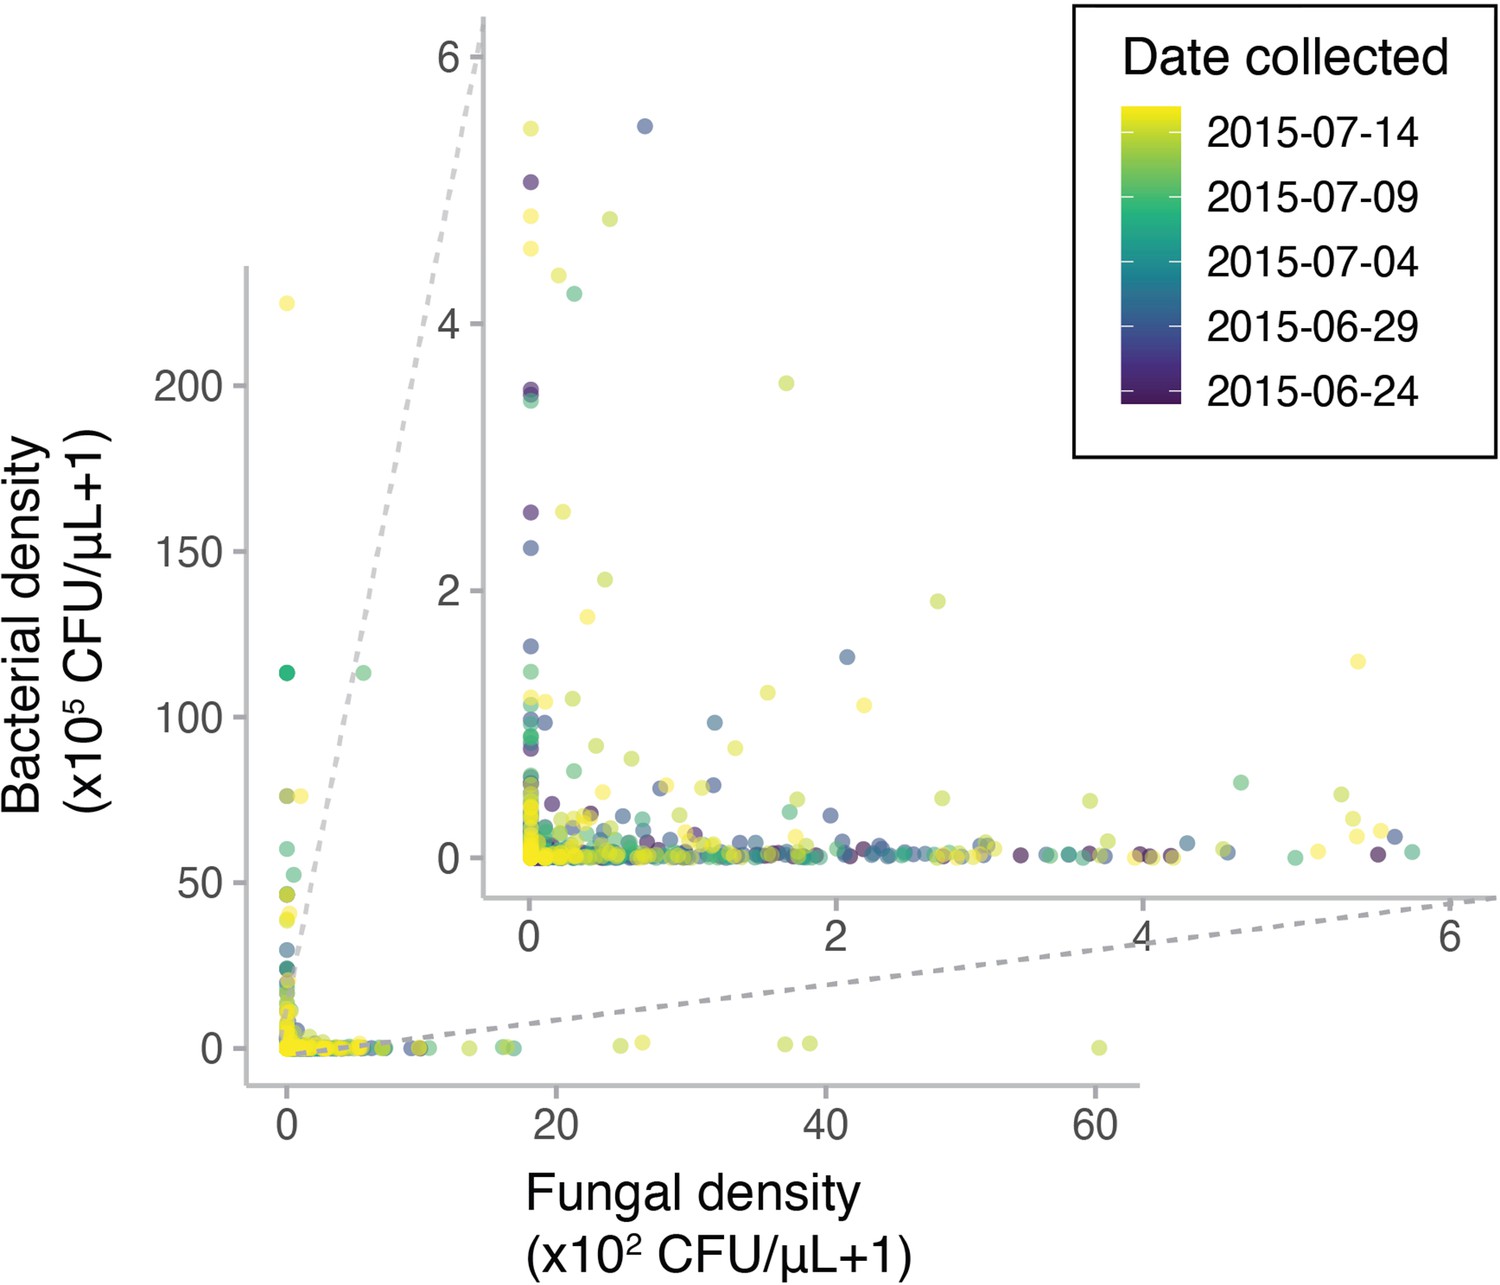
Diplacus aurantiacus flowers were harvested from 12 field sites in and around the San Francisco Peninsula (California, USA) at various dates in June and July 2015 with variable densities of bacteria and yeast (n=1152).
Points are colored by the date each flower was sampled.
Figure 2—figure supplement 3
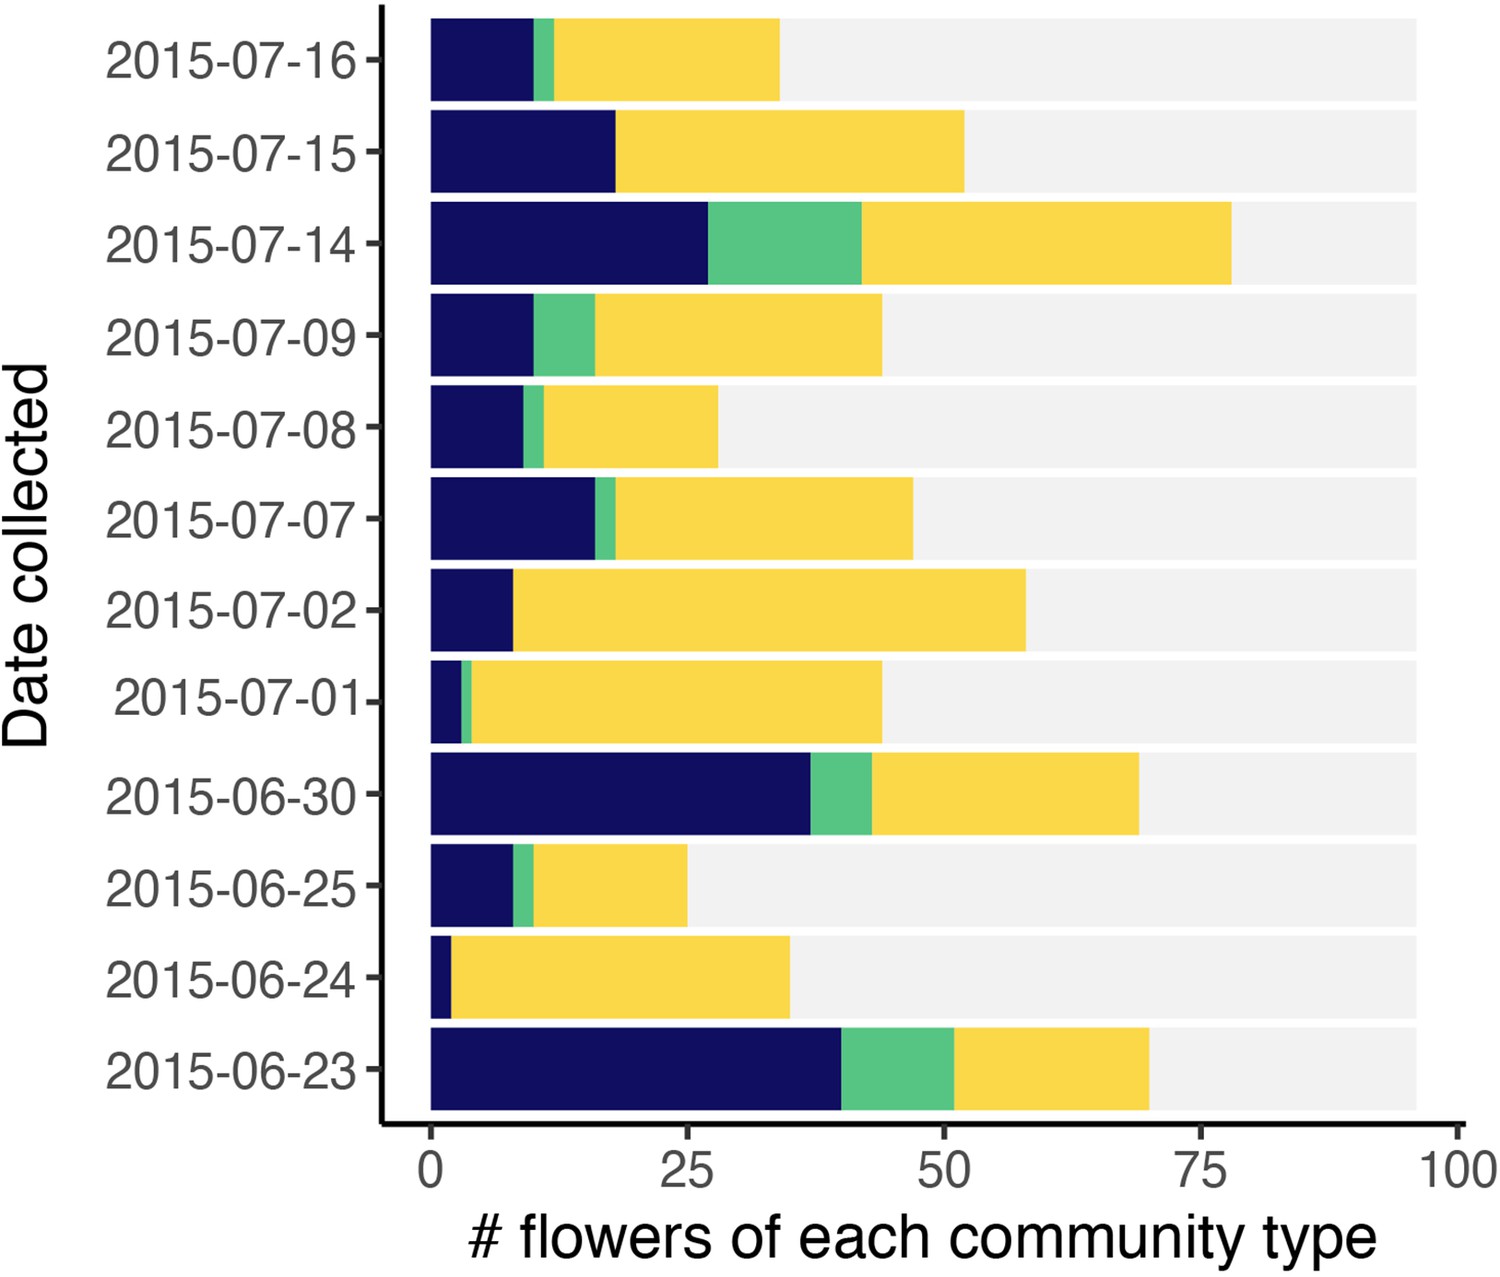
Classification of flowers into bacteria-dominated (blue), yeast-dominated (yellow), co-dominated (green), or microbes too rare to determine (grey).
Each point represents a floral community. Bars are ordered by the date sampled (n=1152).
Figure 2—figure supplement 4
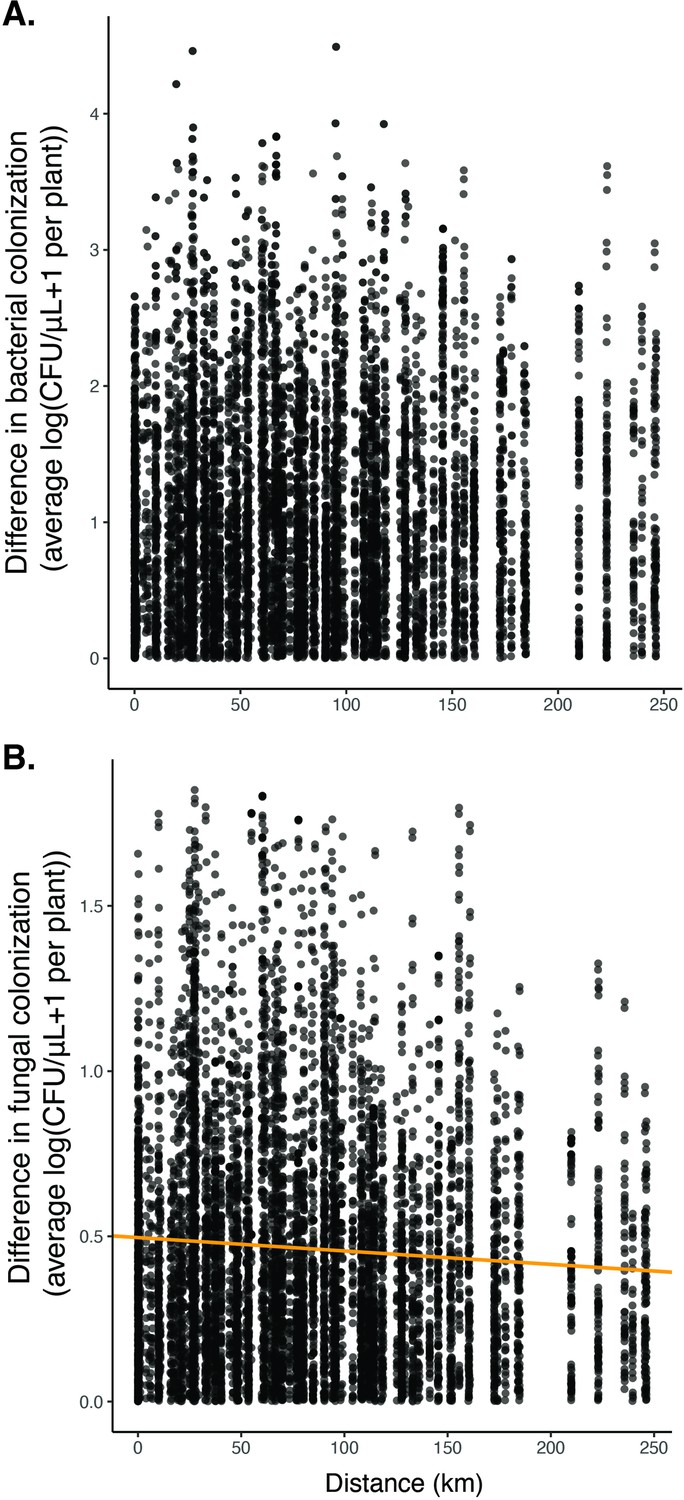
We found no significant relationship between distance and the difference in bacterial colonization (A, n=8775, p=0.07, R2=0.0003) and a slightly negative association between distance and the difference in fungal colonization (B, n=8775, p<0.05, R2=0.004).
These results suggest that there was no obvious overall spatial pattern in whether flowers were dominated by yeast or bacteria.
Figure 3
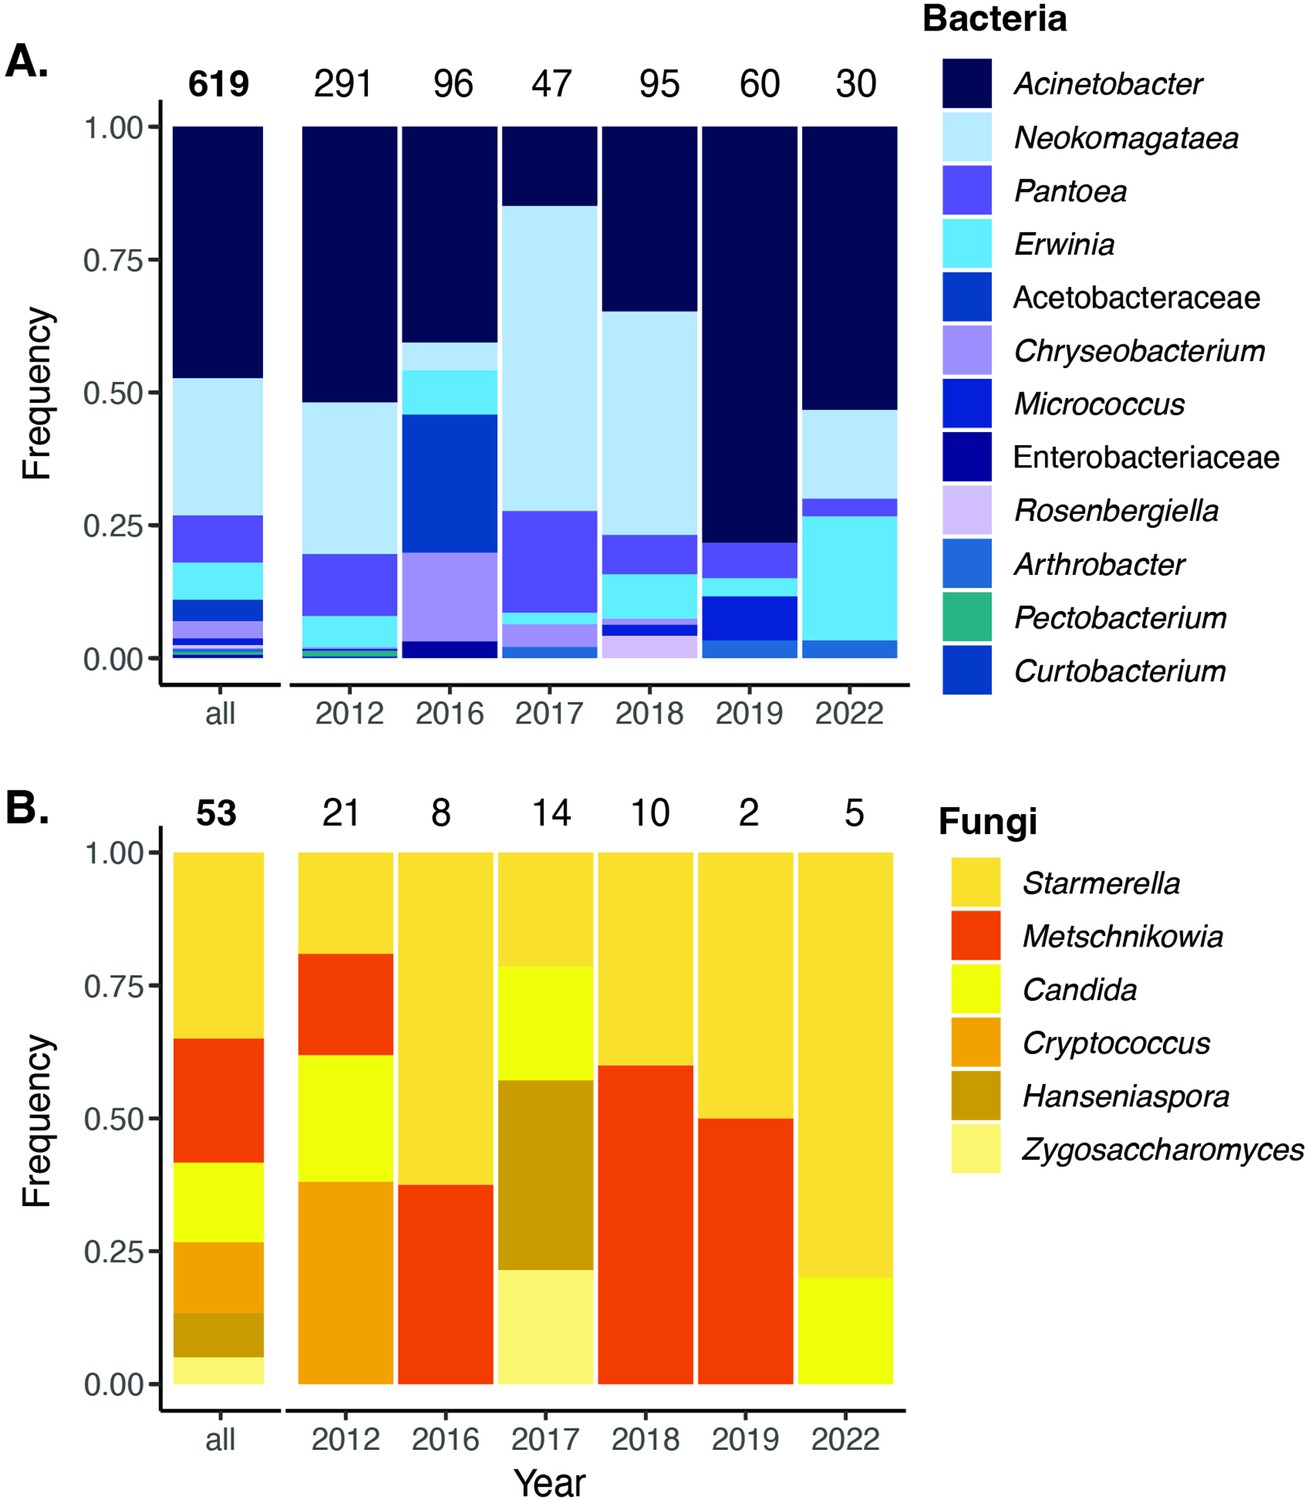
Cultured bacteria and yeast from a 6year survey.
Cultured nectar bacteria (A) and yeast (B) from a 6-year survey of D. aurantiacus nectar at Jasper Ridge identified by colony PCR. The number placed at the top of each bar indicates the number of colony samples analyzed. Single fungal colonies were isolated on yeast mold agar (YMA) with supplemented 100 mg/L of the antibacterial chloramphenicol. Single bacterial colonies were either isolated on Reasoner’s 2A agar (R2A) supplemented with 20% sucrose and 100 mg/L of the antifungal cycloheximide (2012–2018), or tryptic soy agar (TSA) supplemented with 100 mg/L of the antifungal cycloheximide (2019–2022).
-
Figure 3—source data 1
Primer sequences and PCR cycles for colony PCR.
- https://cdn.elifesciences.org/articles/79647/elife-79647-fig3-data1-v2.docx
Figure 4 with 4 supplements
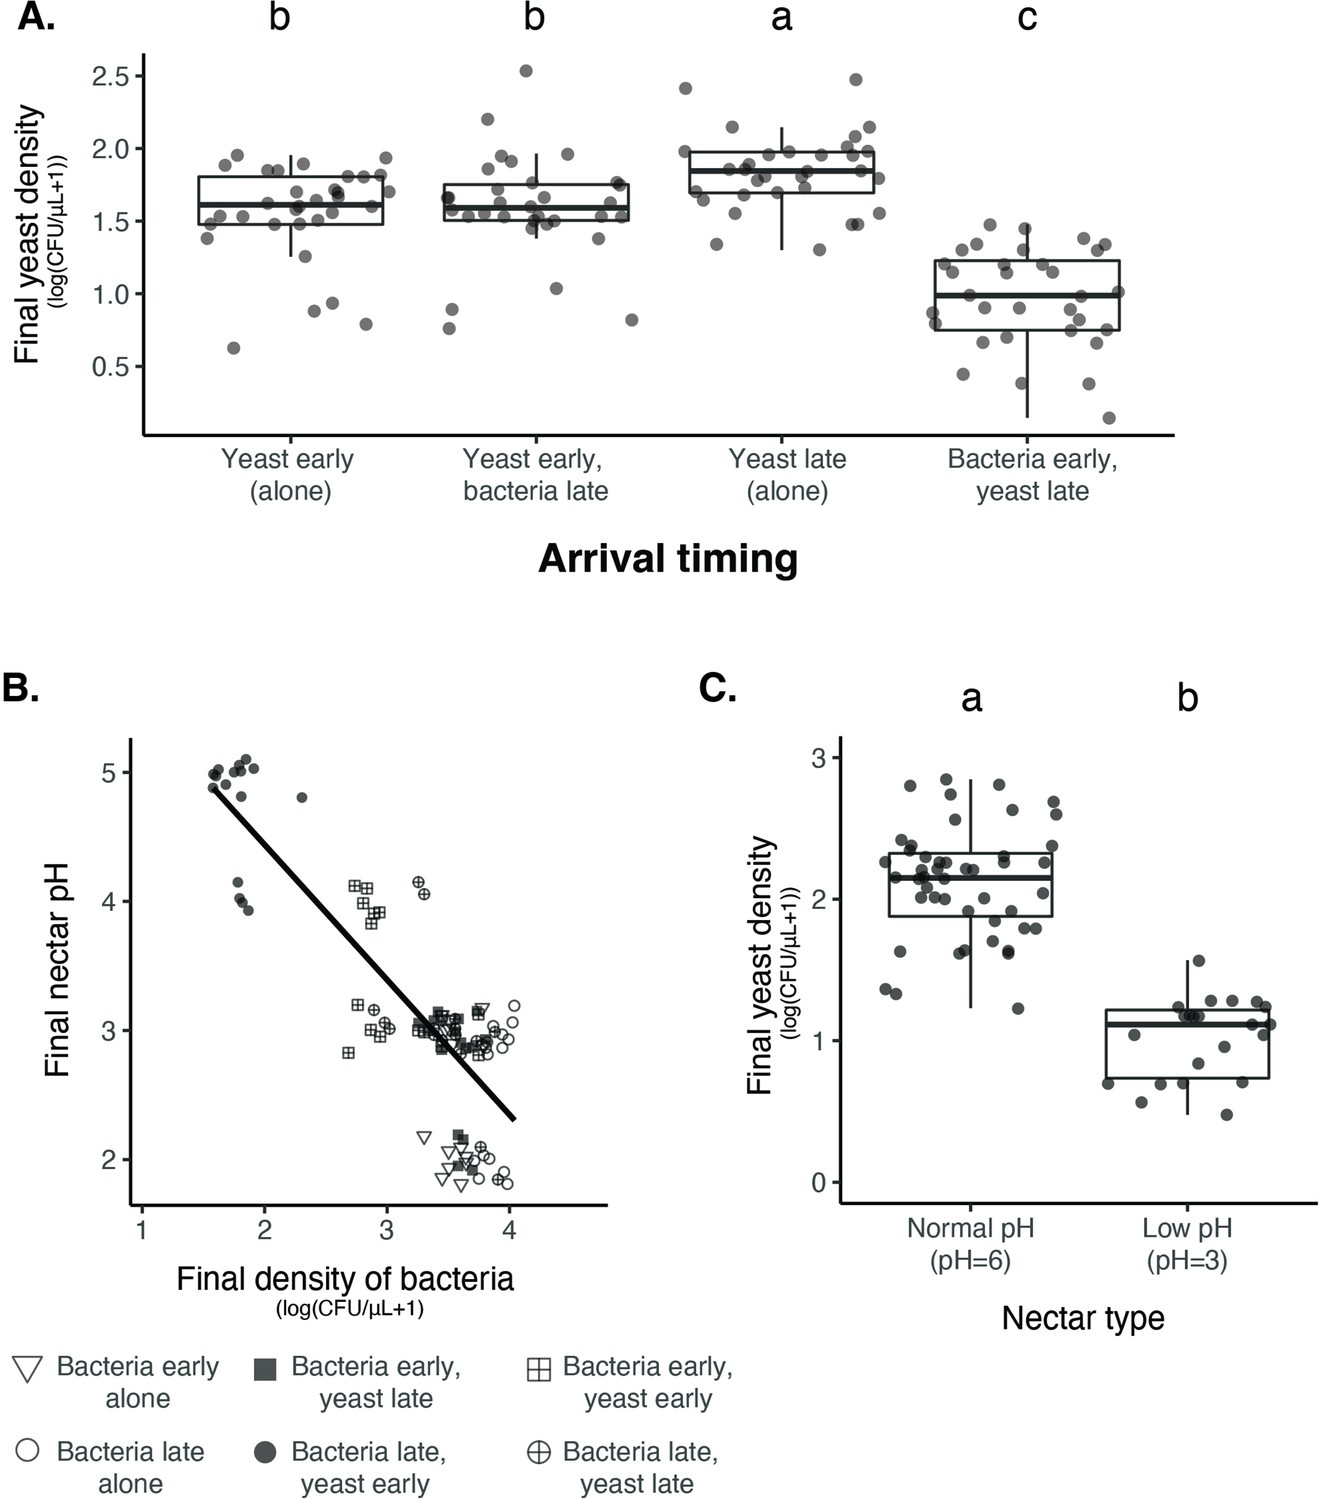
Nectar bacteria exert negative priority effects against nectar yeast, potentially due to reduction in nectar pH.
(A) Metschnikowia reukaufii (strain MR1) yeast population density after five days of growth with alternating arrival order with Acinetobacter nectaris bacteria or growth alone with inoculation on either the first or third day (arriving early or late) of the experiment (n=128). (B) Final pH of nectar after 5 days of bacterial growth; higher densities of bacteria are associated with lower pH. The shape of each point represents the treatments represented in panel A. Points are jittered on the y-axis (n=96). (C) Low pH (pH = 3) nectar depresses yeast growth when grown in low-density monoculture (n=72). In box plots (panels A and C), treatments that share the same letter placed above their boxes were statistically indistinguishable from one another.
-
Figure 4—source data 1
Priority effect experiment treatments.
Treatments used in priority effects experiment with ancestral yeast, fully factorial experiment testing the effect of arrival order on priority effects.
- https://cdn.elifesciences.org/articles/79647/elife-79647-fig4-data1-v2.docx
-
Figure 4—source data 2
Priority effect experiment results.
Results from a linear mixed model testing the effect of arrival order on yeast growth, where BY and YB represents initial arrival by bacteria or yeast, respectively. -Y and Y- represent the comparable growth of yeast at either arrival time (day 0 or day 2). Bold text shows p-values less than or equal to 0.05.
- https://cdn.elifesciences.org/articles/79647/elife-79647-fig4-data2-v2.docx
Figure 4—figure supplement 1
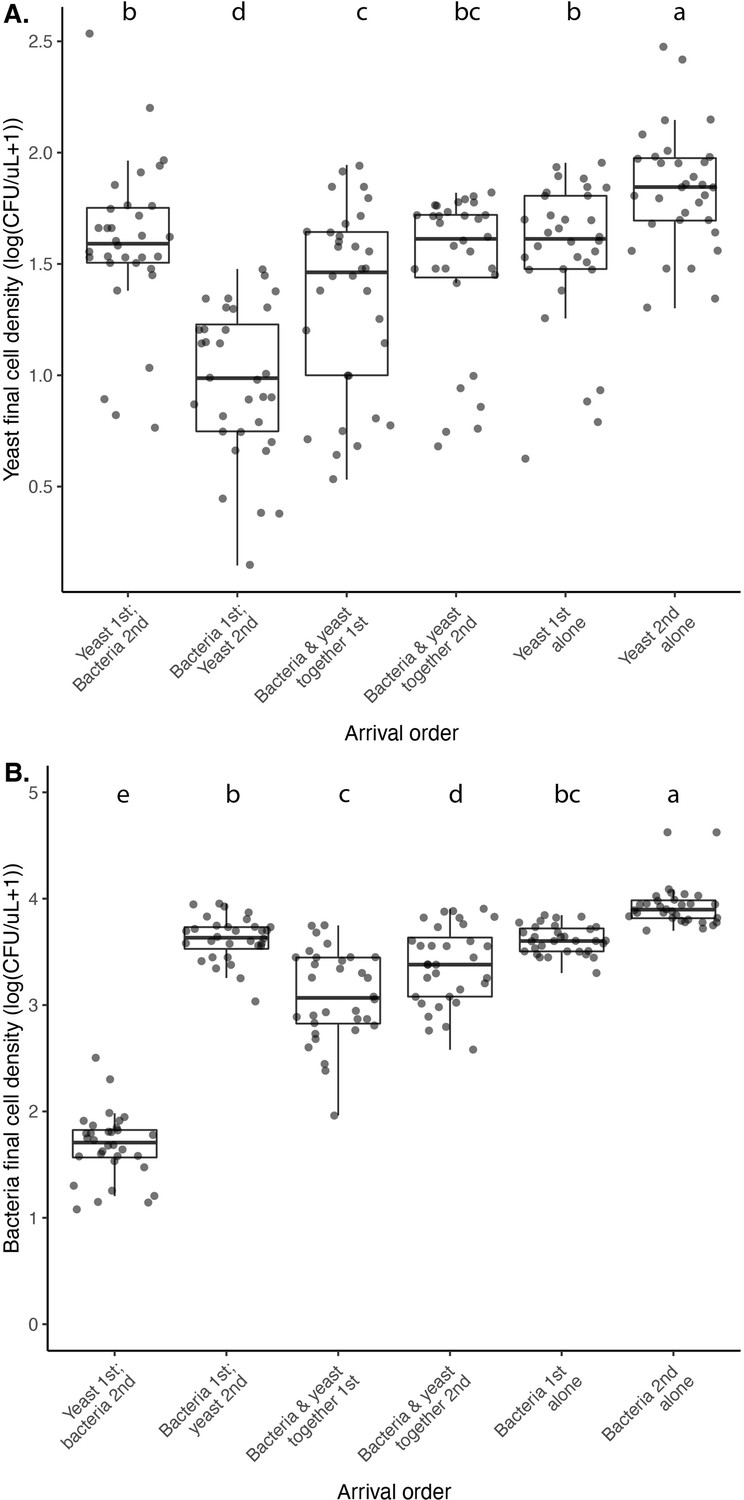
M. reukaufii yeast and A. nectaris bacteria exhibit negative priority effects against each other, as evidenced by growth in microcosm experiments where arrival order is altered.
Statistical analysis for significance codes are in Figure 4—source data 2 for yeast (a) and bacteria (b). Letters shown above each box (each treatment) indicate statistical significance as in Figure 4.
Figure 4—figure supplement 2
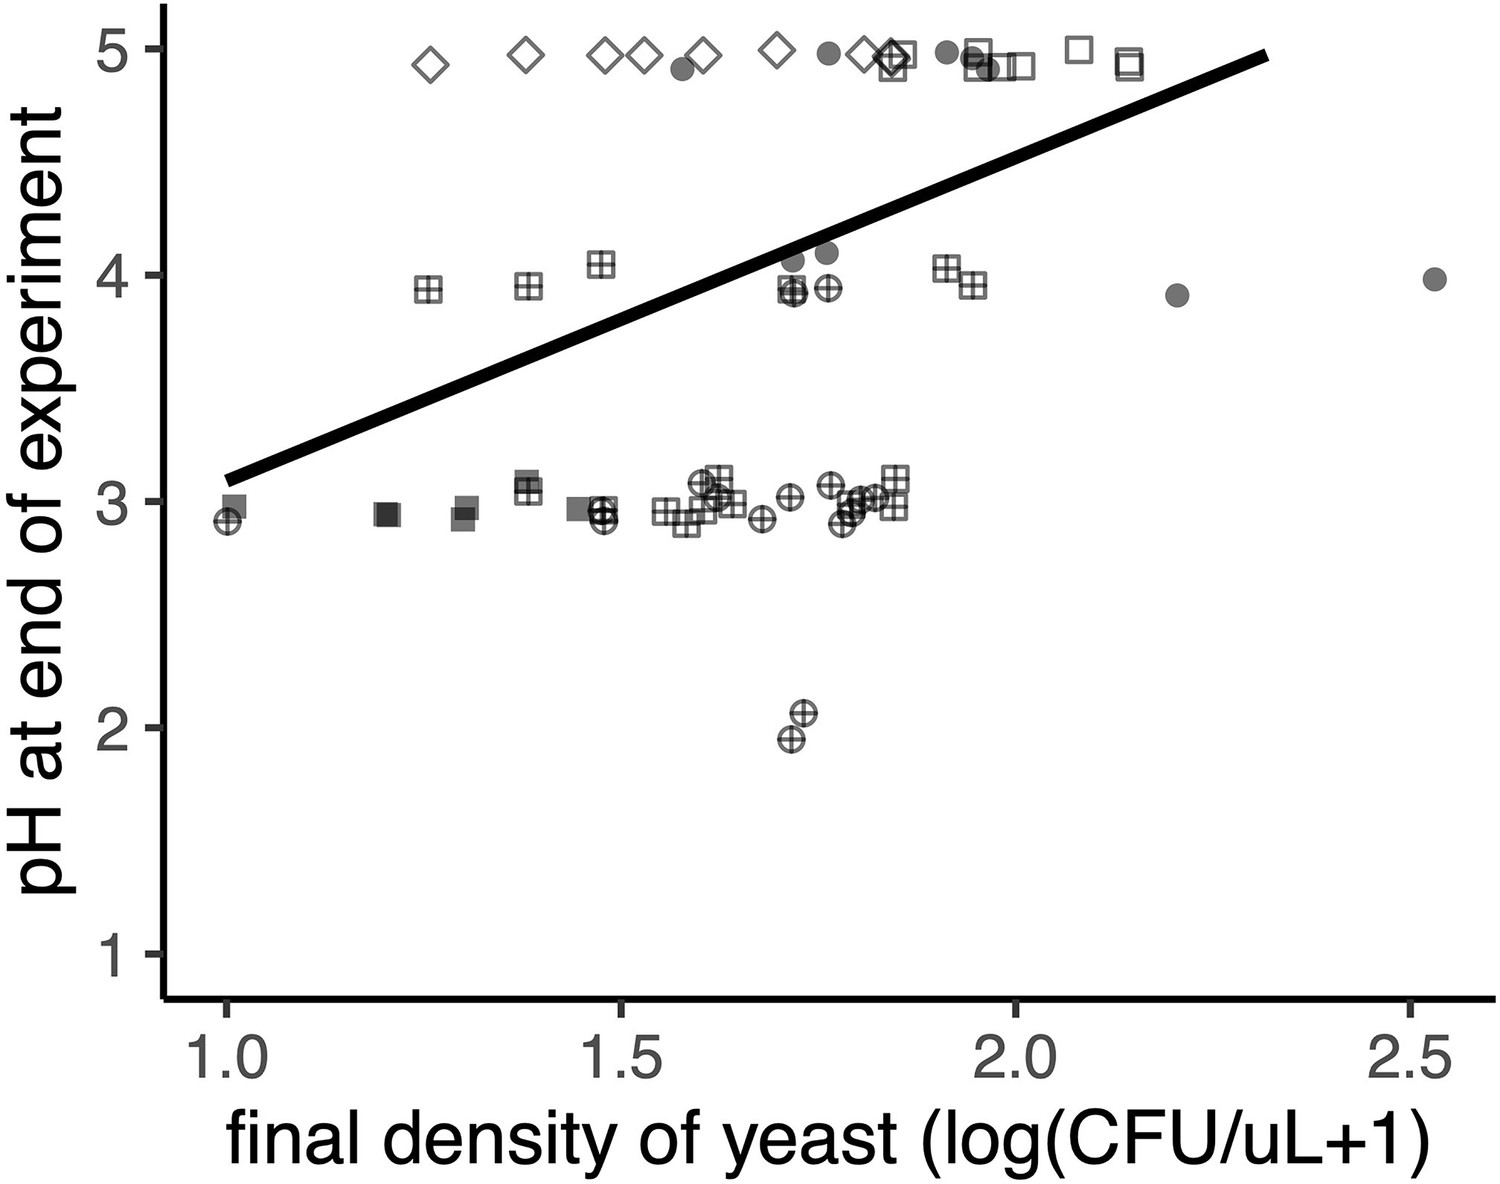
Yeast increases nectar pH (p<0.05, Spearman rank correlation).
The shape of each point represents the various treatments (described in Figure 3B), where yeast first, then bacteria (‘YB’) are filled circles, bacteria first followed by yeast (‘BY’) are filled squares, early arriving bacteria and yeast (‘YB-’) are cross-hatched squares, late arriving bacteria and yeast (‘BY-’) are cross-hatched circles, late arriving yeast (‘-Y’) are open squares, early arriving yeast (‘Y-’) are open diamonds, late arriving bacteria (‘-B’) are open circles, and early arriving bacteria (‘B-’) are triangles. Points are slightly jittered on the y axis.
Figure 4—figure supplement 3

We found no effect of nectar type (pH=3, pH=6) on the growth of M. reukaufii, when grown in monoculture at a high density (approximately 10,000 cells/µL).
M. reukaufii growth was calculated by subtracting the initial from final cell density. Positive values represent instances of population growth whereas negative values represent instances of population decline.
Figure 4—figure supplement 4
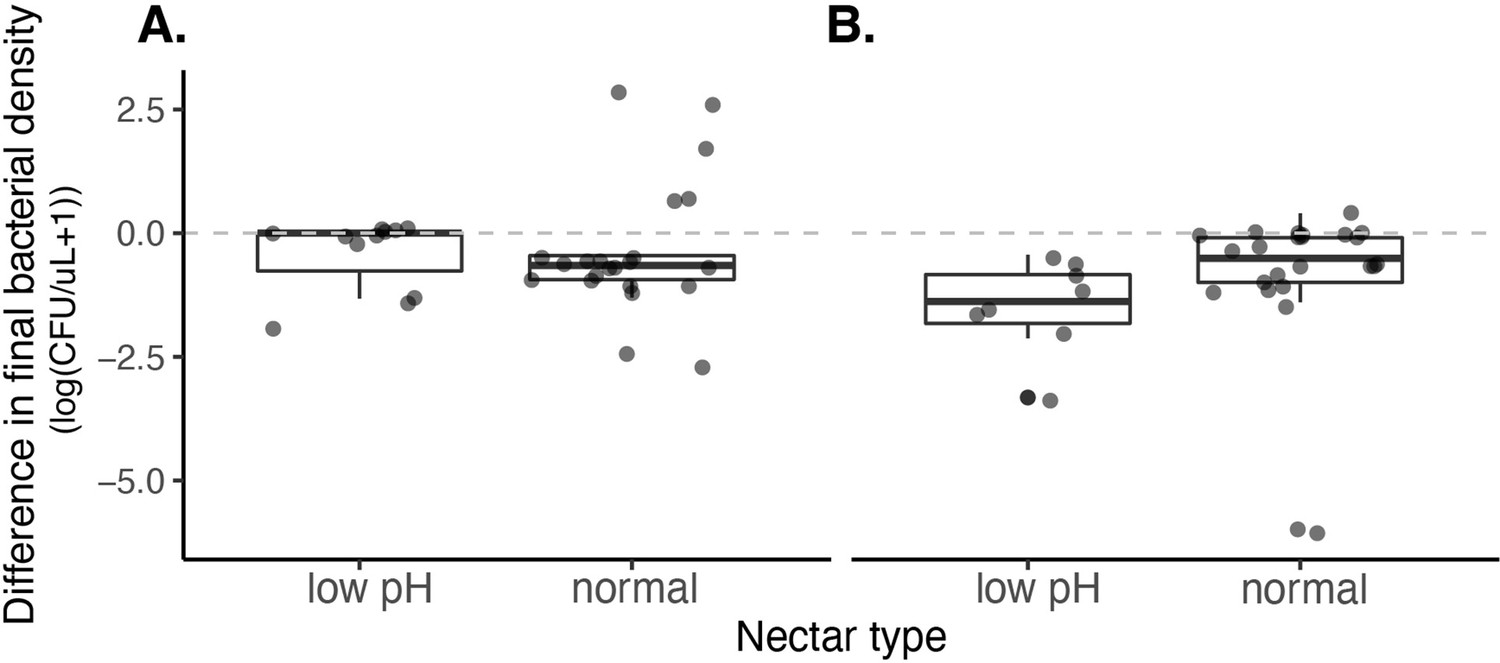
We found no effect of nectar type (pH=3, pH=6) on the growth of A. nectaris when grown in monoculture at a low density (approximately 10 cells/µL) (A) or high density (approximately 10,000 cells/µL) (B).
A. nectaris growth was calculated by subtracting the initial from final cell density. Positive values represent instances of population growth whereas negative values represent instances of population decline.
Figure 5 with 2 supplements
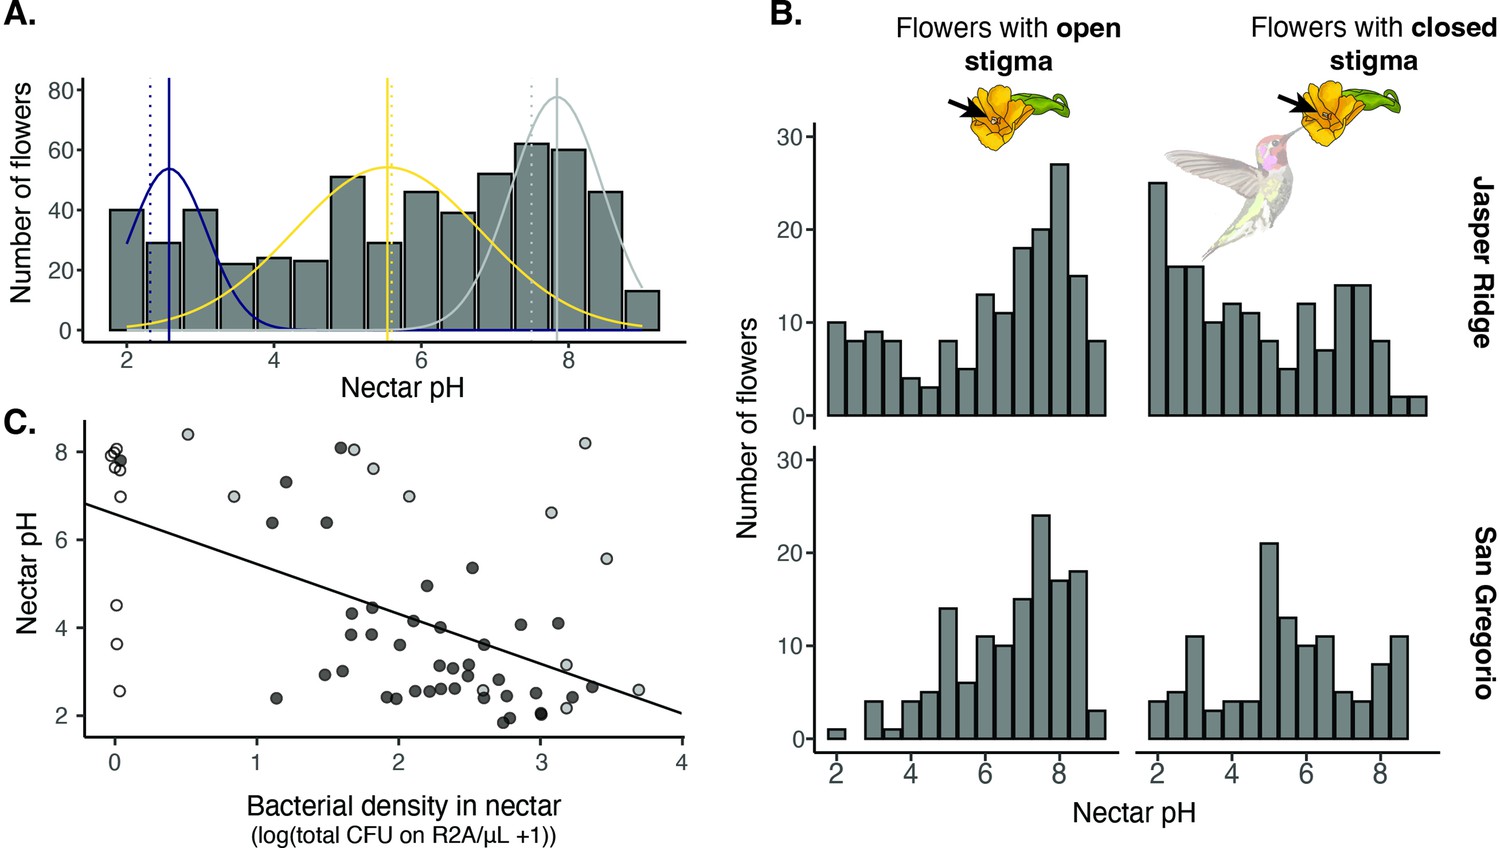
Field survey of nectar pH in D. aurantiacus.
(A) Distribution of nectar pH in individual D. aurantiacus flowers collected at Jasper Ridge and San Gregorio (n=576 flowers from which we were able to extract a sufficient amount of nectar to measure pH; 21% of flowers sampled, i.e.,152 of 728 flowers, had too little nectar for pH measurement). The tri-modal distributions represent the prediction from a 3-part mixture model, with the modes indicated by solid vertical lines. Dashed vertical lines indicate experimental pH measurements from Vannette et al., 2013, where bacteria (blue dashed vertical line) and yeast (yellow dashed vertical line) were grown in field-collected D. aurantiacus nectar (control as grey dashed vertical line), and pH was measured after four days of growth. (B) Distributions of nectar pH amongD. aurantiacus flowers with open and closed stigmas (a closed stigma indicatesvisitation by a pollinator in D. aurantiacus; Fetscher and Kohn, 1999) shown separately for Jasper Ridge and San Gregorio (site 6). At Jasper Ridge, 71/233 and 37/204 flowers with closed and open stigma, respectively, had too little nectar to measure pH. At San Gregorio, 31/145 and 13/146 flowers with closed and open stigma, respectively, had too little nectar to measure pH. (C) Association between bacterial density in individual flowers and nectar pH (n=62). White points represent flowers where no microbes were cultured on R2A, but some colonies were present on TSA. Grey points represent flowers where yellow colonies were present on R2A at a greater density than other colonies on R2A. Preliminary data suggest that these yellow colonies represent non-acidifying bacteria such as Pseudomonas. Black points represent flowers with colonies on R2A that do not fit into either of the prior categories. The regression line was shown for all data.
Figure 5—figure supplement 1
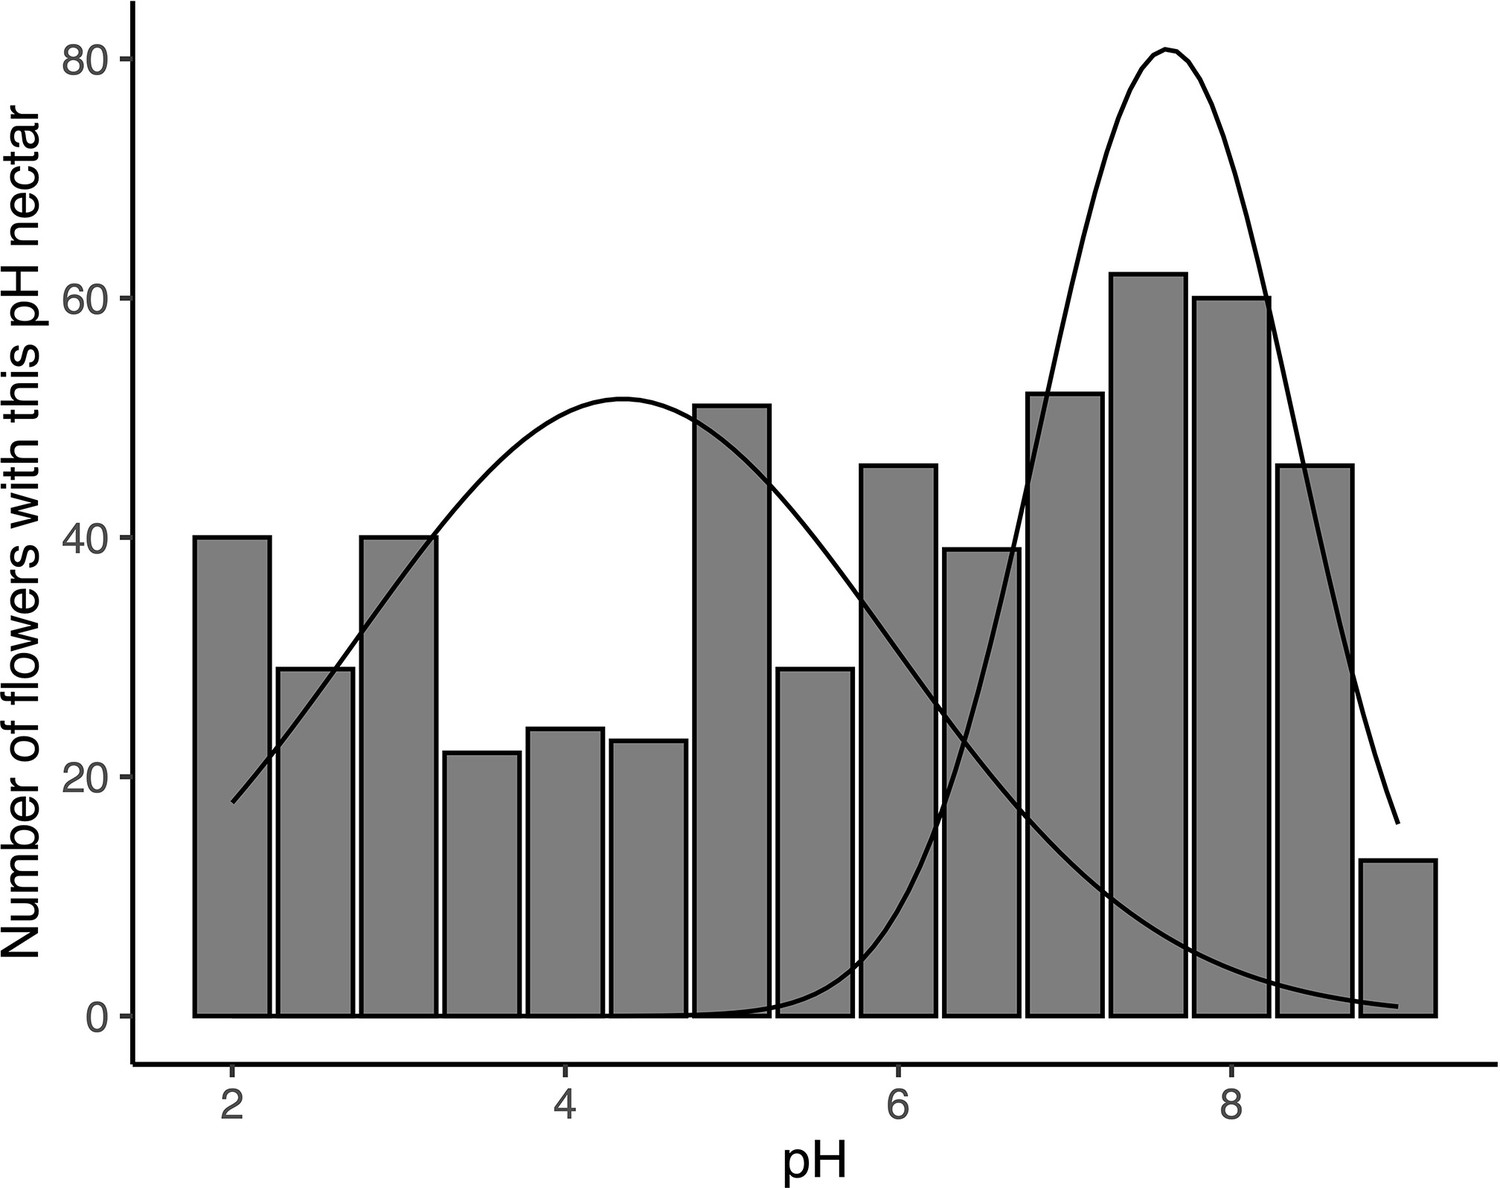
Expectation-maximization (EM) algorithm-based mixture model of nectar pH from D.aurantiacus flowers harvested from Jasper Ridge and San Gregorio in June-July 2022.
Figure 5—figure supplement 2
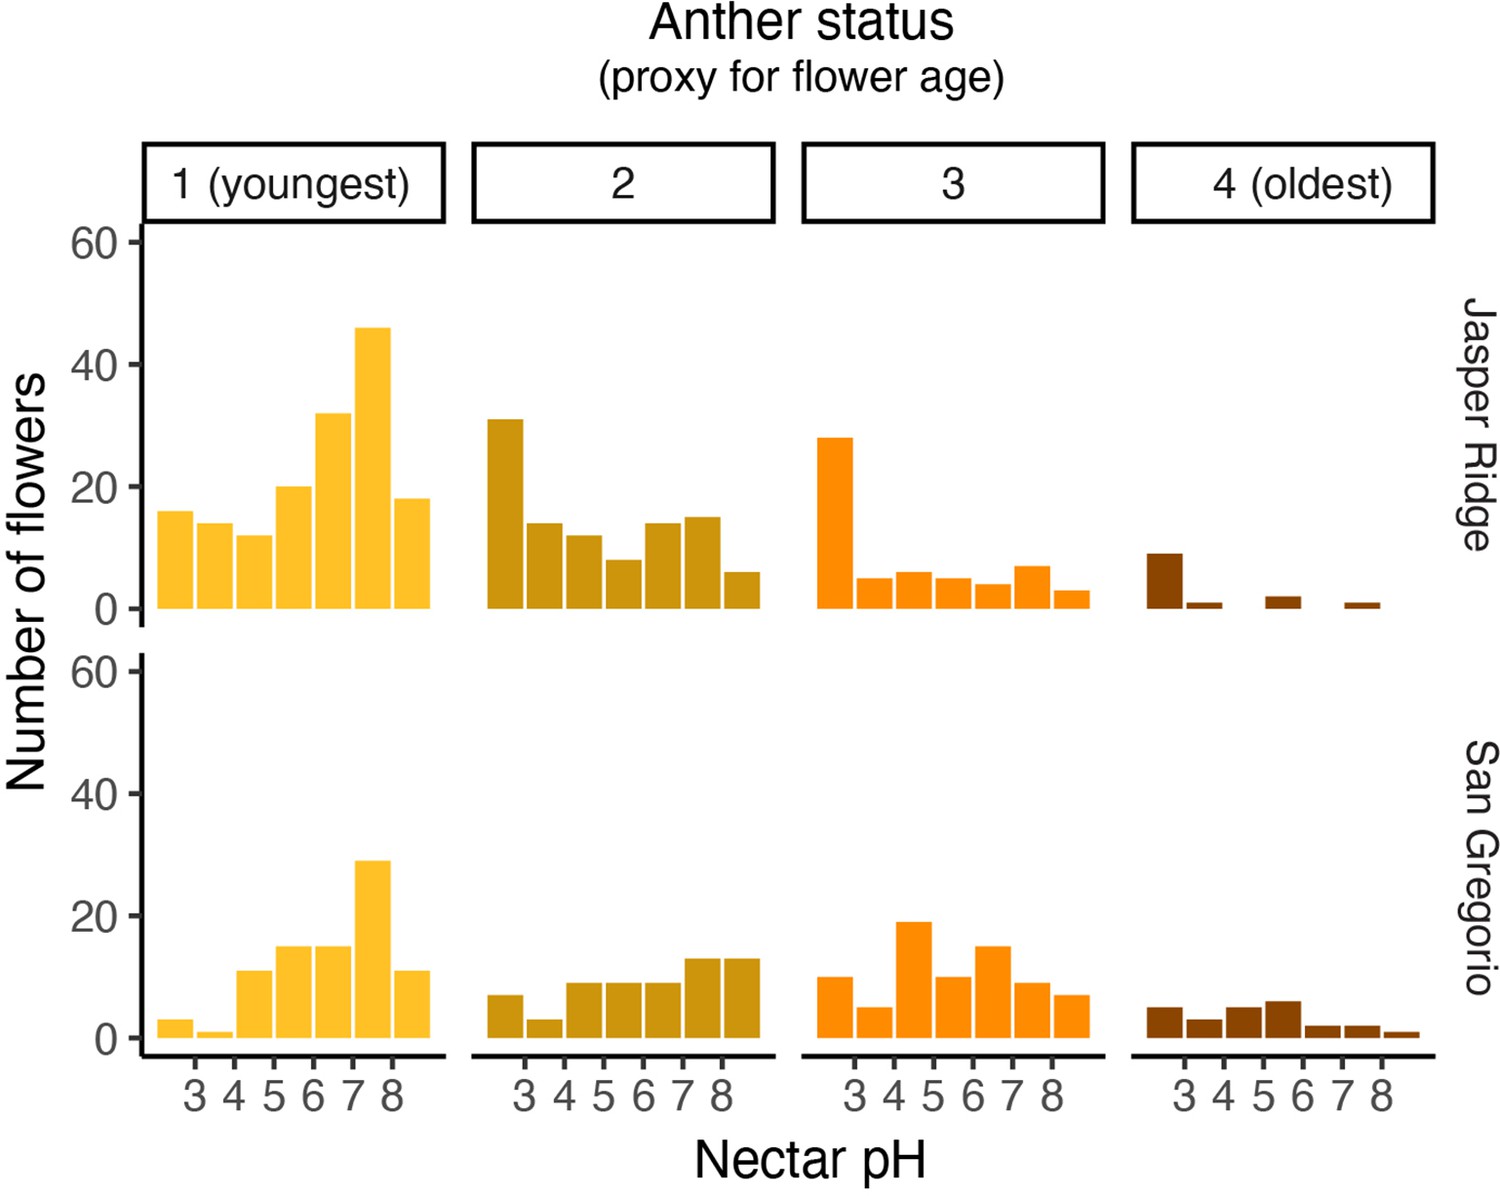
Distribution of nectar pH for flowers harvested from Jasper Ridge and San Gregorio separated by anther status.
Anthers from each flower were categorized from 1 (youngest) to 4 (oldest) as a rough estimate of the flower’s age (Tsuji et al., 2016). Missing anthers were classified as 0. An anther categorized as a 1 displayed a bright yellow appearance with no brown spots, an anther of 2 was a mix of yellow and golden brown, an anther of 3 was only golden brown, and an anther of 4 was dark brown and wrinkled.
Figure 6
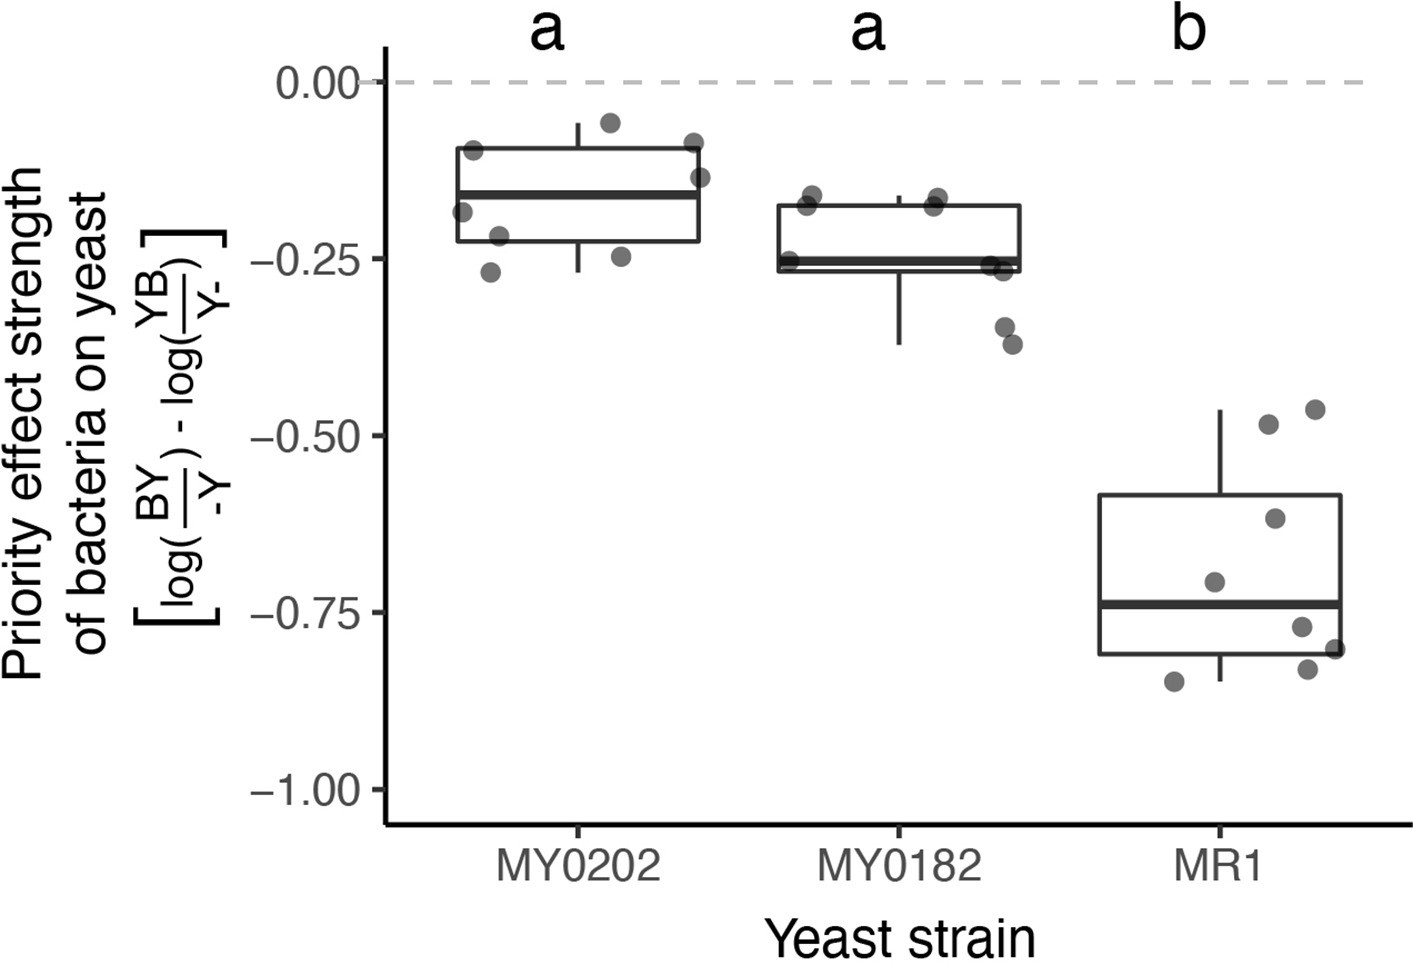
M. reukaufii strains differ in susceptibility to bacterial priority effects.
Three strains of M. reukaufii were differentially affected by early arrival of bacteria (n=25). For each strain, we calculated the strength of priority effects using a metric that compares growth between varying initial inoculation densities with a competitor and alone. BY and YB represents initial dominance by bacteria or yeast (e.g. BY represents bacteria arriving early and yeast arriving late). Y- and -Y represent the comparable growth of yeast at either density (early or late) alone. Letters shown above each box (each treatment) indicate statistical significance as in Figure 4.
-
Figure 6—source data 1
Priority effect experiment results with wild strains.
Results from a linear mixed model testing the effect of yeast strain (MR1, MY0182, MY0202) on the strength of priority effects exerted by A. nectaris calculated using this metric:, where BY and YB represents initial dominance by bacteria or yeast, respectively. -Y and Y- represent the comparable growth of yeast at either density, alone and treatment densities were averaged by round of the experiment. Bold text shows p-values less than or equal to 0.05.
- https://cdn.elifesciences.org/articles/79647/elife-79647-fig6-data1-v2.docx
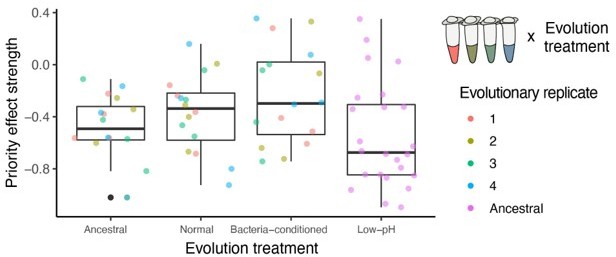
Figure 7 with 2 supplements
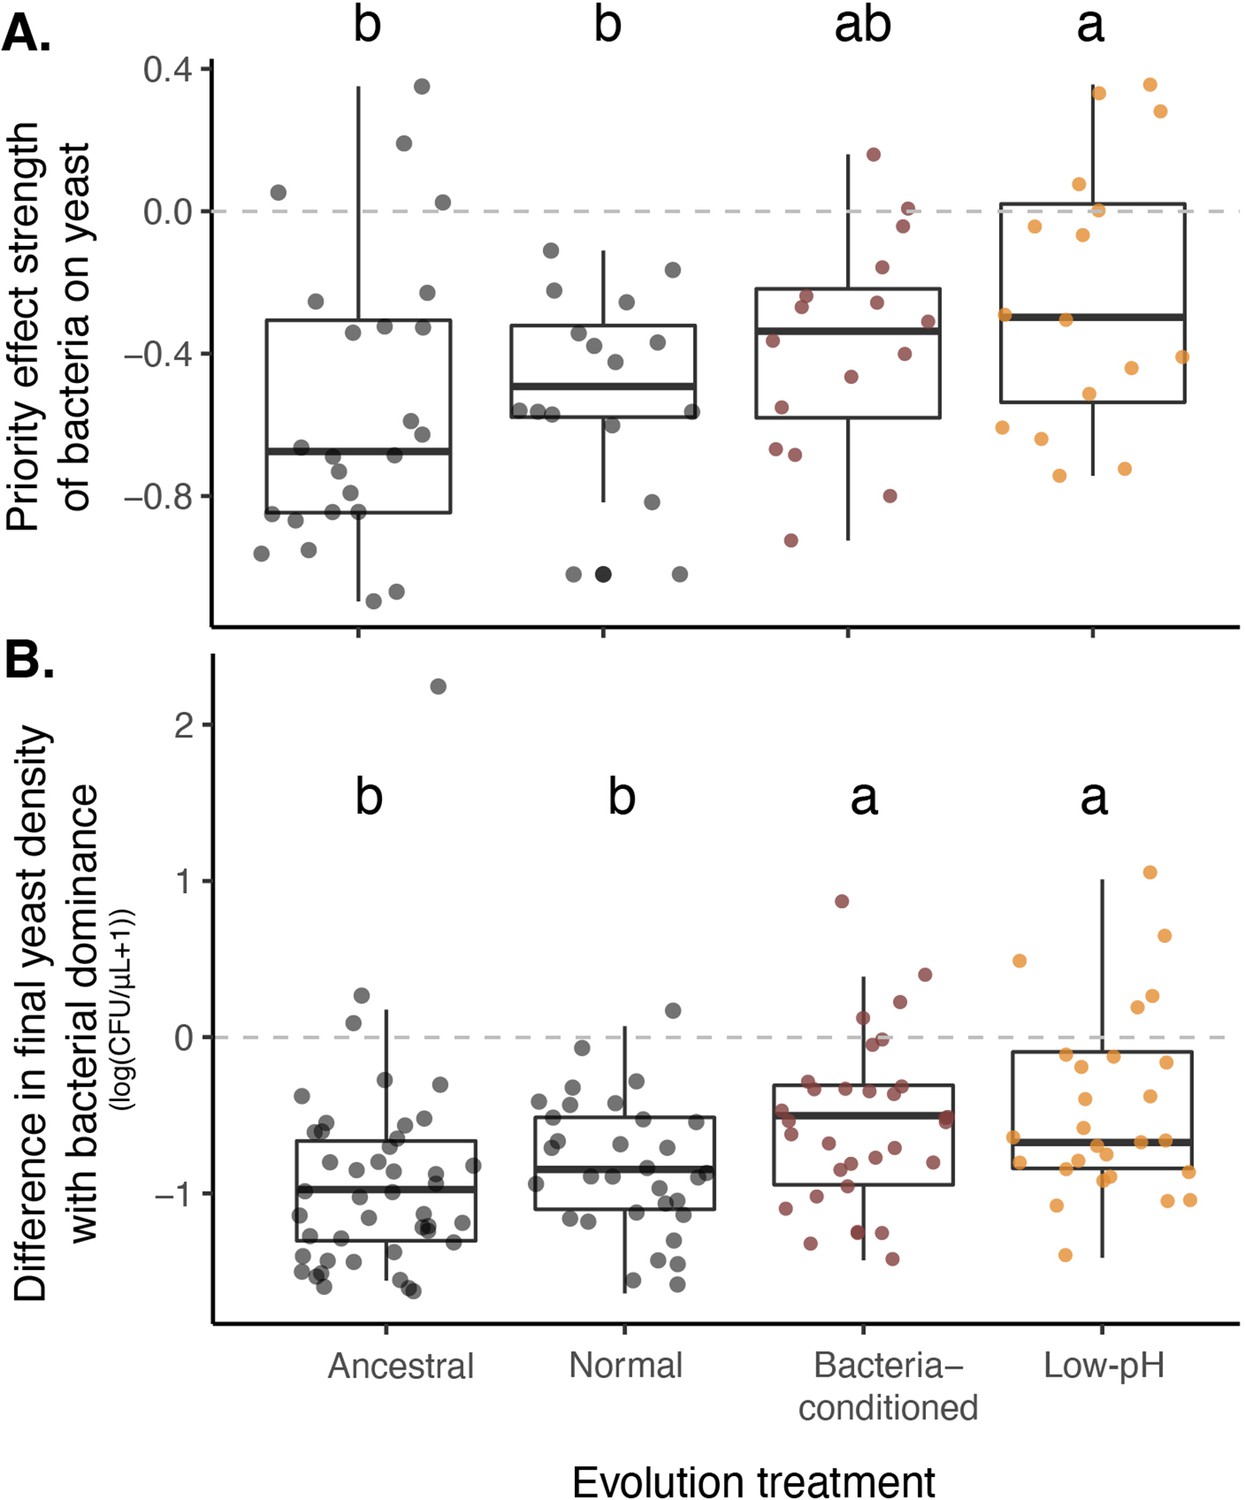
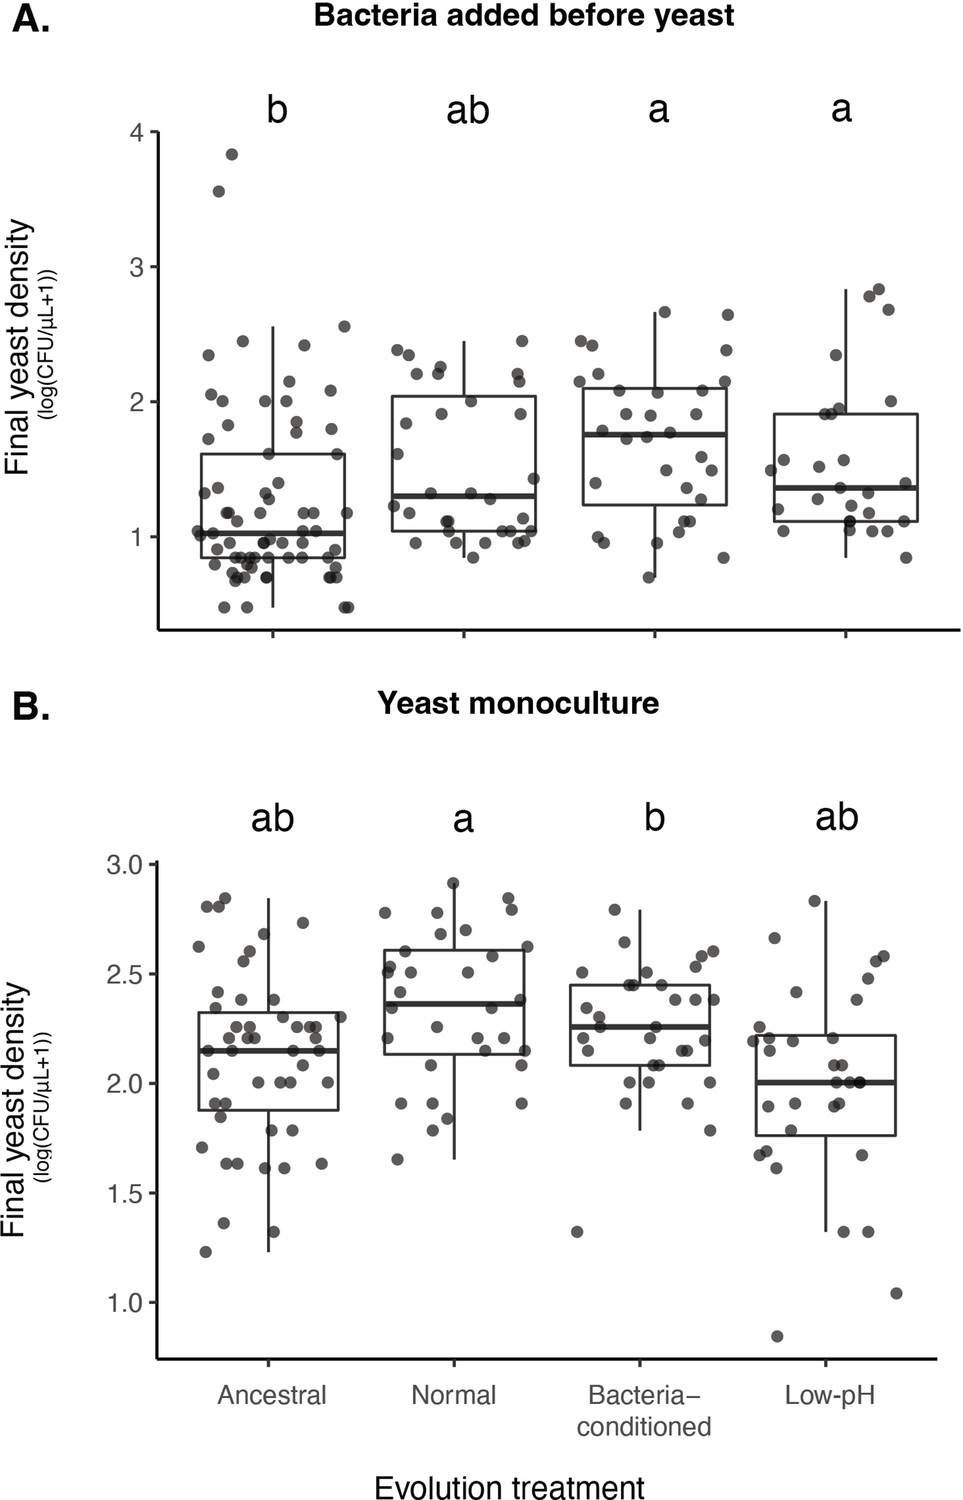
Yeast evolved with bacterial niche modification were more resistant to bacterial priority effects.
(A) Yeast evolved in low-pH nectar was less affected by bacterial priority effects than other treatments, especially compared to ancestral yeast and yeast evolved in normal nectar (n=72). Consequently, (B) yeast evolved in bacteria-like nectar (both bacteria-conditioned and low-pH) was less negatively affected by initial bacterial dominance, relative to their growth alone, than ancestral yeast or yeast evolved in normal nectar (n=168). Letters shown above each box (each treatment) indicate statistical significance as in Figure 4.
-
Figure 7—source data 1
Evolution treatments.
Treatments used in priority effects experiment with experimentally-evolved yeast, fully factorial experiment testing the effect of initial density (10,000 cells/µL (‘early’) or 10 cells/µL (‘late’)), evolution treatment (ancestral, evolved in normal nectar, low-pH nectar, or bacteria-conditioned nectar), and evolutionary replicate (independent evolutionary lineages) on priority effects.
- https://cdn.elifesciences.org/articles/79647/elife-79647-fig7-data1-v2.docx
-
Figure 7—source data 2
Priority effect experiment results with evolved strains (priority effect metric).
Results from a linear mixed model testing the effect of evolution treatment (ancestral, evolved in normal nectar, low-pH nectar, or bacteria-conditioned nectar) on the strength of priority effects calculated using one of two metrics: Priority effect metric #1: (Figure 7), where BY and YB represent initial dominance by bacteria or yeast, respectively. -Y and Y- represent the comparable growth of yeast at either density, alone and treatment densities were averaged by round of the experiment. Bold text shows p-values less than or equal to 0.05. Priority effect metric #2: (Figure 7—figure supplement 1)., where BY and YB represent initial dominance by bacteria or yeast, respectively. Treatment densities were averaged by round of the experiment. Bold text shows p-values less than or equal to 0.05.
- https://cdn.elifesciences.org/articles/79647/elife-79647-fig7-data2-v2.docx
-
Figure 7—source data 3
Differences in growth between evolved strains with and without bacteria.
Results from a linear mixed model testing the effect of yeast initial density (10,000 colony forming units/µL (‘early’) or 10 cells/µL (‘late’), yeast monoculture or competition with bacteria) treatment and evolution treatment (ancestral, evolved in normal nectar, low-pH nectar, or bacteria-conditioned nectar) on the difference in final yeast density between treatments with a high density of bacteria and a low density of yeast (BY) and yeast grown in monoculture at a low density (-Y). Growth difference was calculated as (BY) - (-Y). Bold text shows p-values less than or equal to 0.05.
- https://cdn.elifesciences.org/articles/79647/elife-79647-fig7-data3-v2.docx
-
Figure 7—source data 4
Difference in final yeast densities between evolved strains with and without bacteria.
Results from a linear mixed model testing the effect of yeast initial density (10,000 colony forming units/µL (‘high’) or 10 cells/µL (‘low’), yeast monoculture or competition with bacteria) treatment and evolution treatment (ancestral, evolved in normal nectar, low-pH nectar, or bacteria-conditioned nectar) on final density of yeast. Bold text shows p-values less than or equal to 0.05.
- https://cdn.elifesciences.org/articles/79647/elife-79647-fig7-data4-v2.docx
Figure 7—figure supplement 1
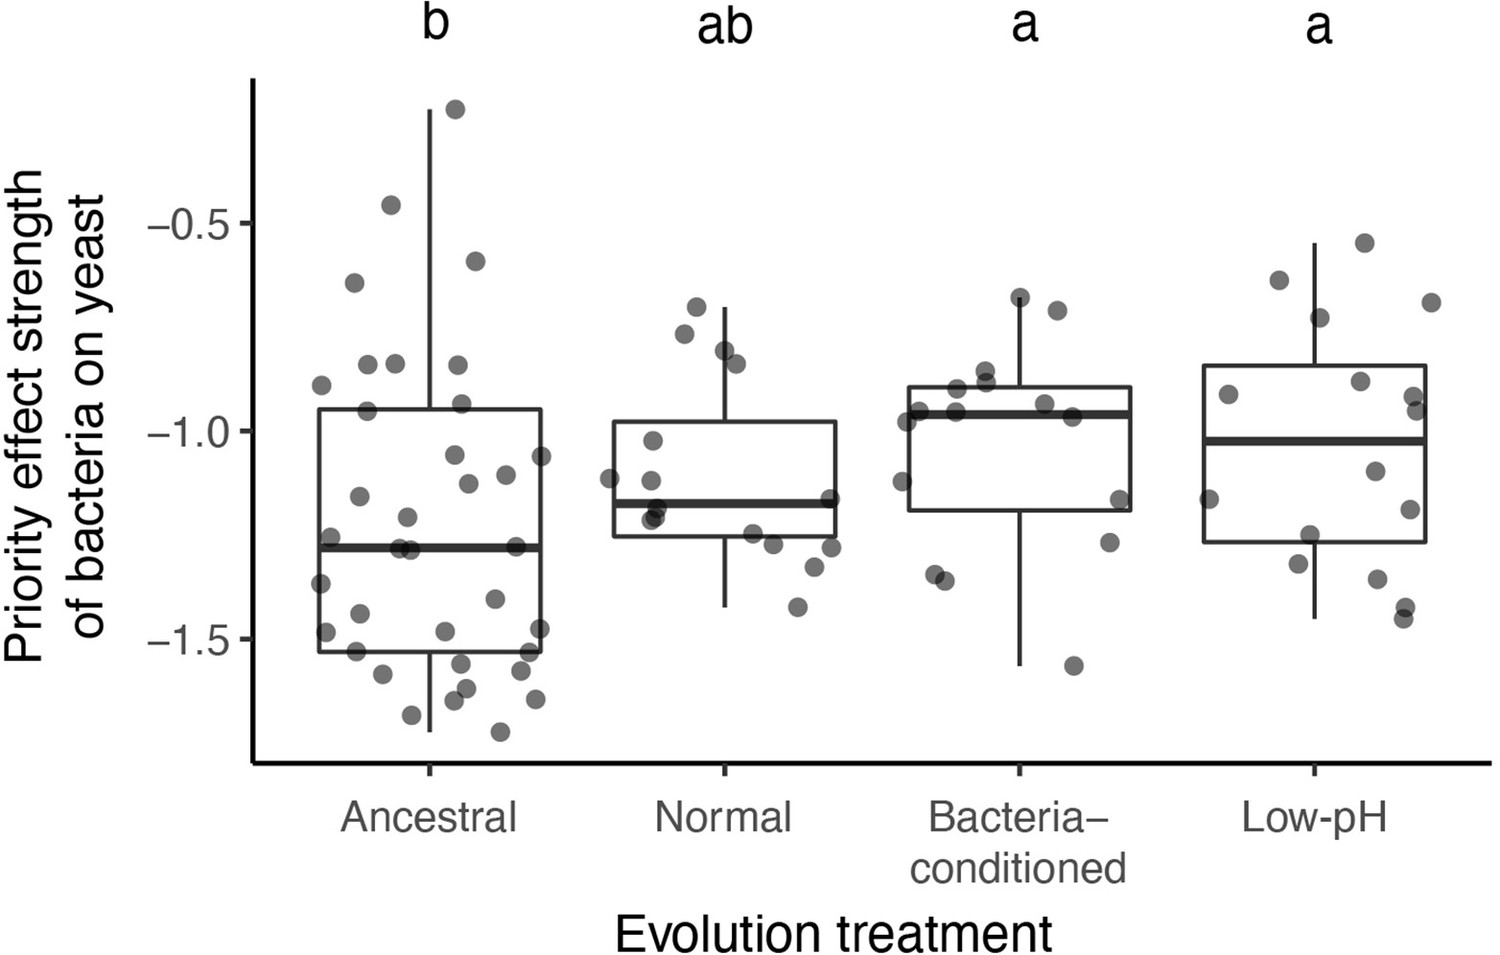
We calculated an additional priority effect metric, which corroborated our main result.
This metric is calculated by taking the natural logarithm of growth ratio between different initial dominance:. Letters shown above each box (each treatment) indicate statistical significance as in Figure 4.
Figure 7—figure supplement 2
Effects of evolution treatments and bacterial addition on yeast density.
(A) Yeast evolved in bacteria-conditioned and low-pH nectars were better able to grow than ancestral yeast when bacteria were dominant (BY bacterial priority effects treatment). (B) This difference in growth was not due to a difference in intrinsic growth rate (-Y monoculture treatment). Letters shown above each box (each treatment) indicate statistical significance as in Figure 4.
Figure 8 with 1 supplement
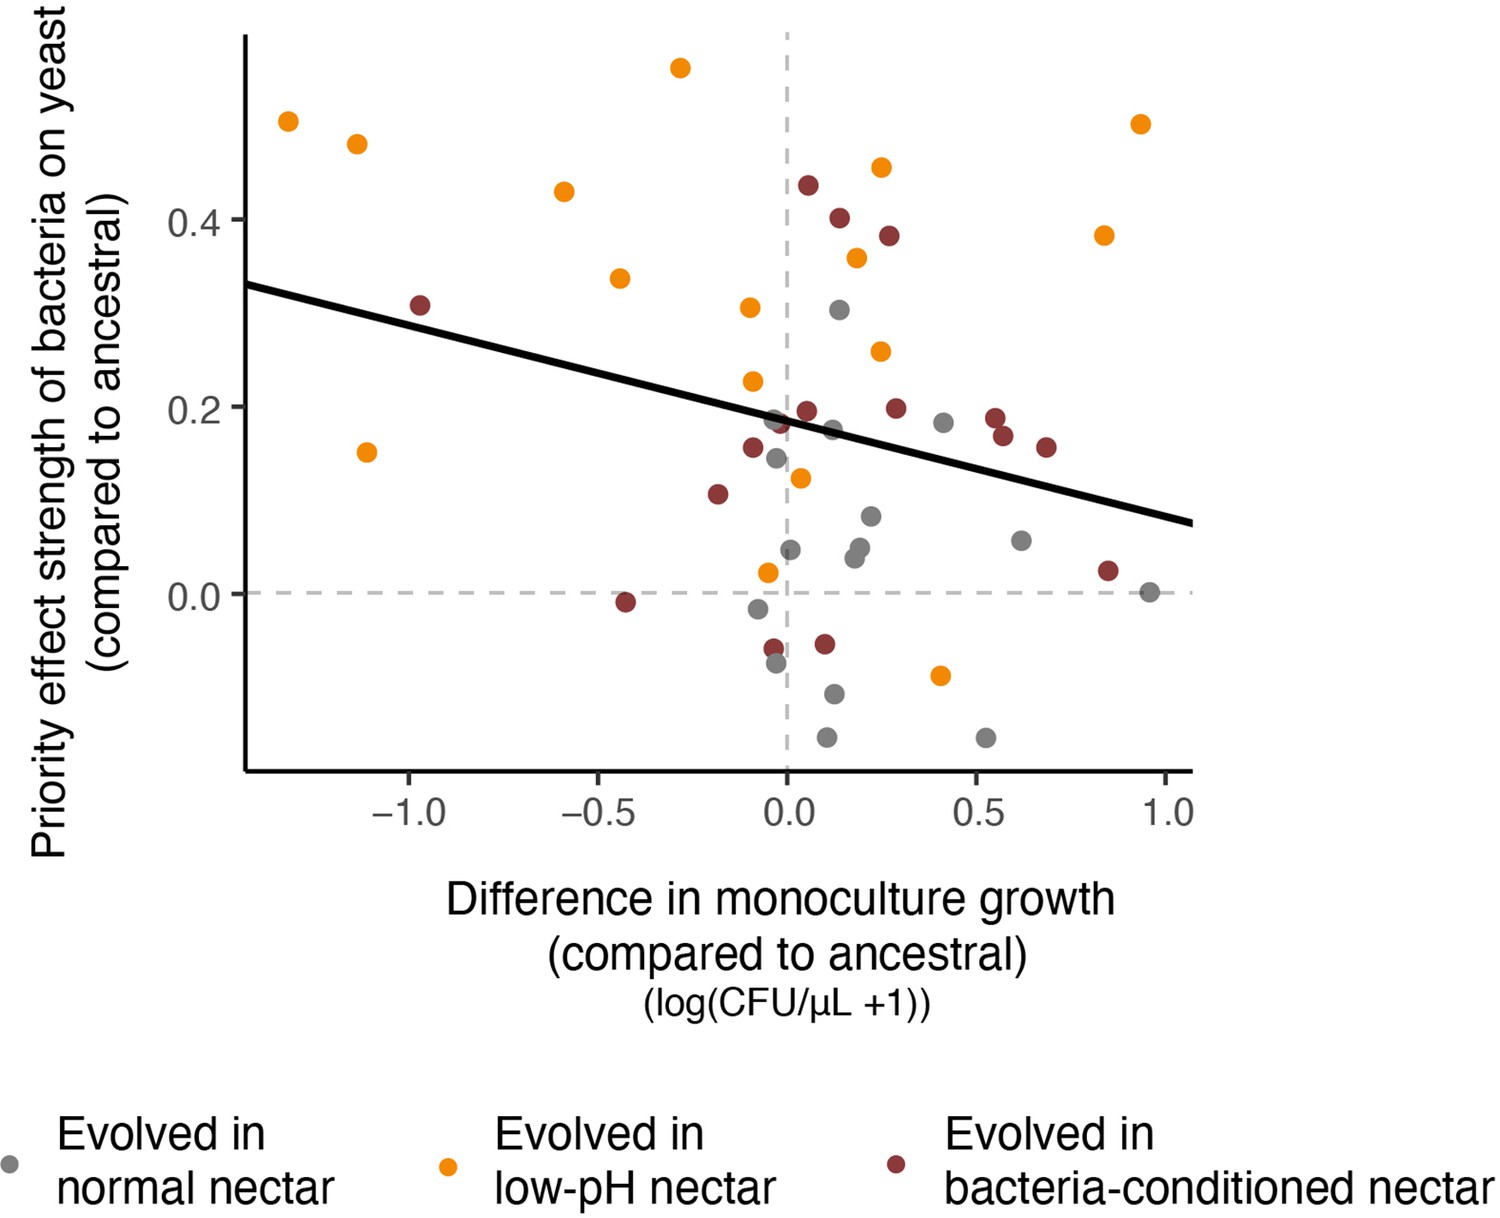
Relationship between resistance to priority effects and monoculture growth.
Strains that could more strongly resist priority effects by bacteria were poor at growing in monoculture (upper left quadrant). Conversely, strains that were more affected by bacterial priority effects were better able to grow in monoculture (upper right quadrant). Each point in the plot represents an evolved strain, plotted with respect to the ancestral strain grown in that round of the experiment (centered on the origin) (n=60).
-
Figure 8—source data 1
Relationship between resistance to priority effects and monoculture growth.
The relationship between monoculture growth and resistance to priority effects was calculated using a linear mixed model predicting the difference in the strength of priority effects from the monoculture growth. Both of these values were comparing each evolved strain to the ancestral strain within a single weekly iteration of the experiment, which was also included as a random effect. Additional model associated with Figure 8—figure supplement 1: (raw data for evolved strains not adjusted for ancestral).
- https://cdn.elifesciences.org/articles/79647/elife-79647-fig8-data1-v2.docx
Figure 8—figure supplement 1
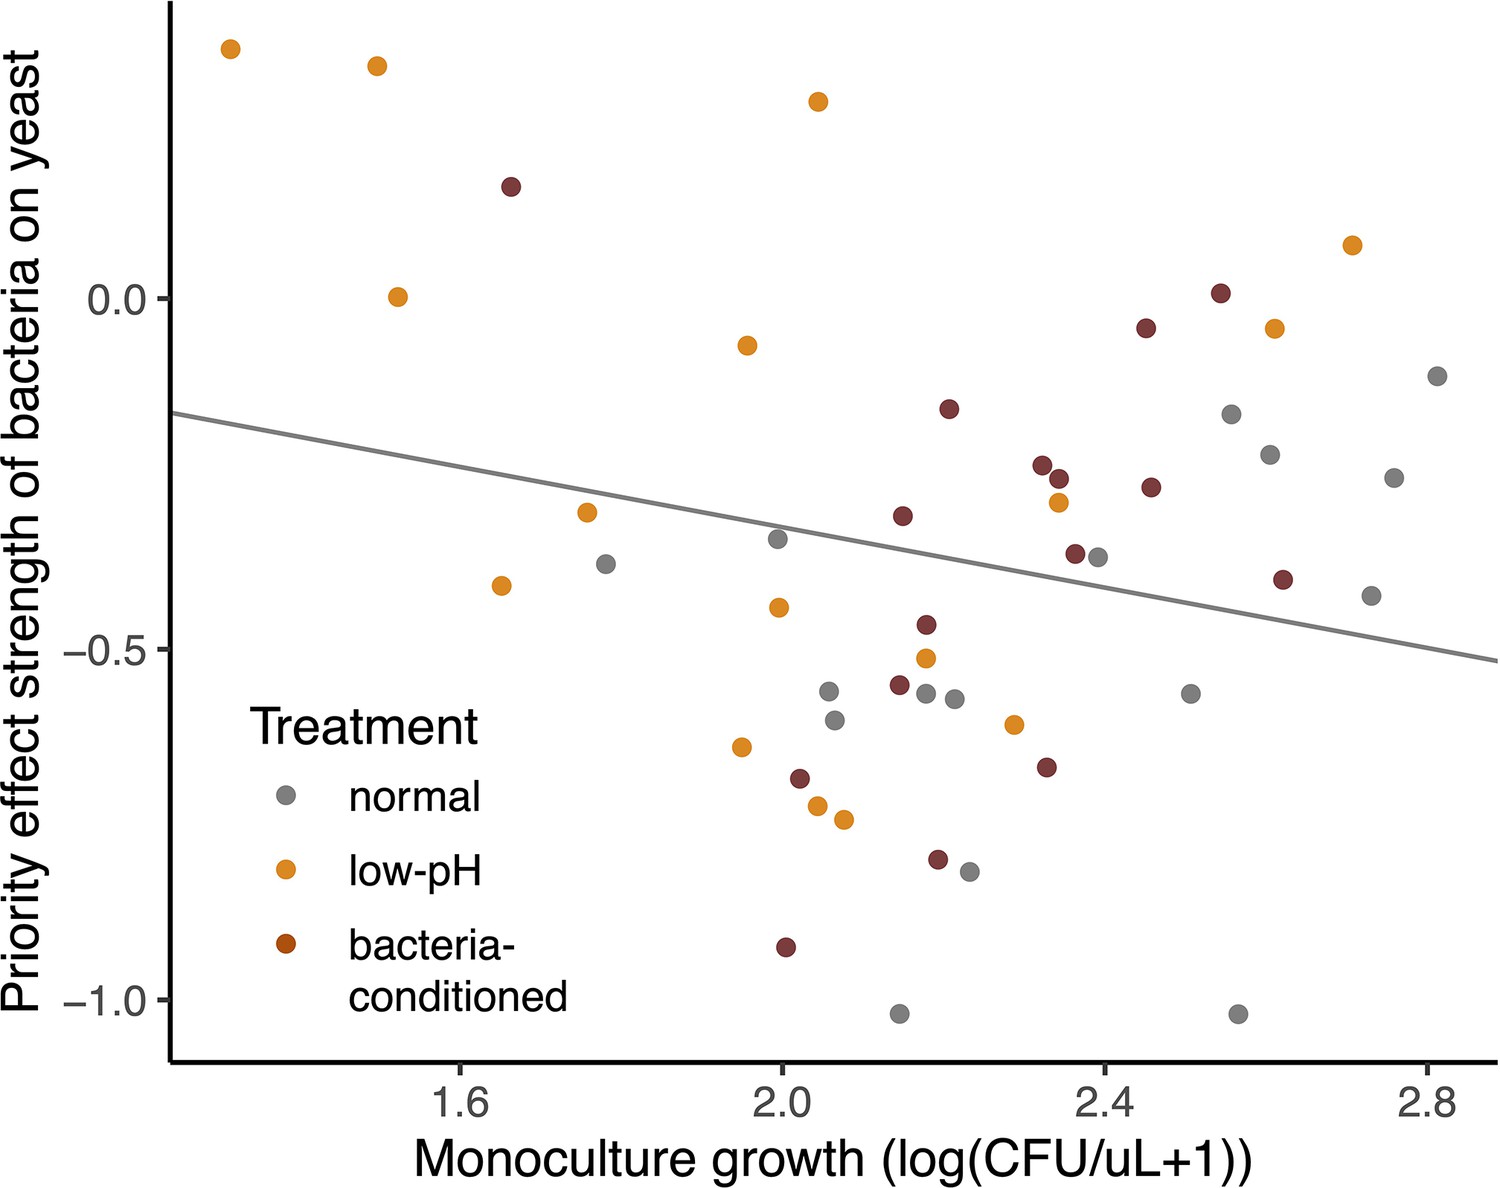
Negative relationship between the strength of priority effects of bacteria and yeast on their monoculture growth rate at a low density, with round of the experiment (week) as a random effect (LMM: n=48, p=0.006).
Note that this data is not adjusted for differences between ancestral strains within rounds, as in Figure 7.
Figure 9 with 2 supplements
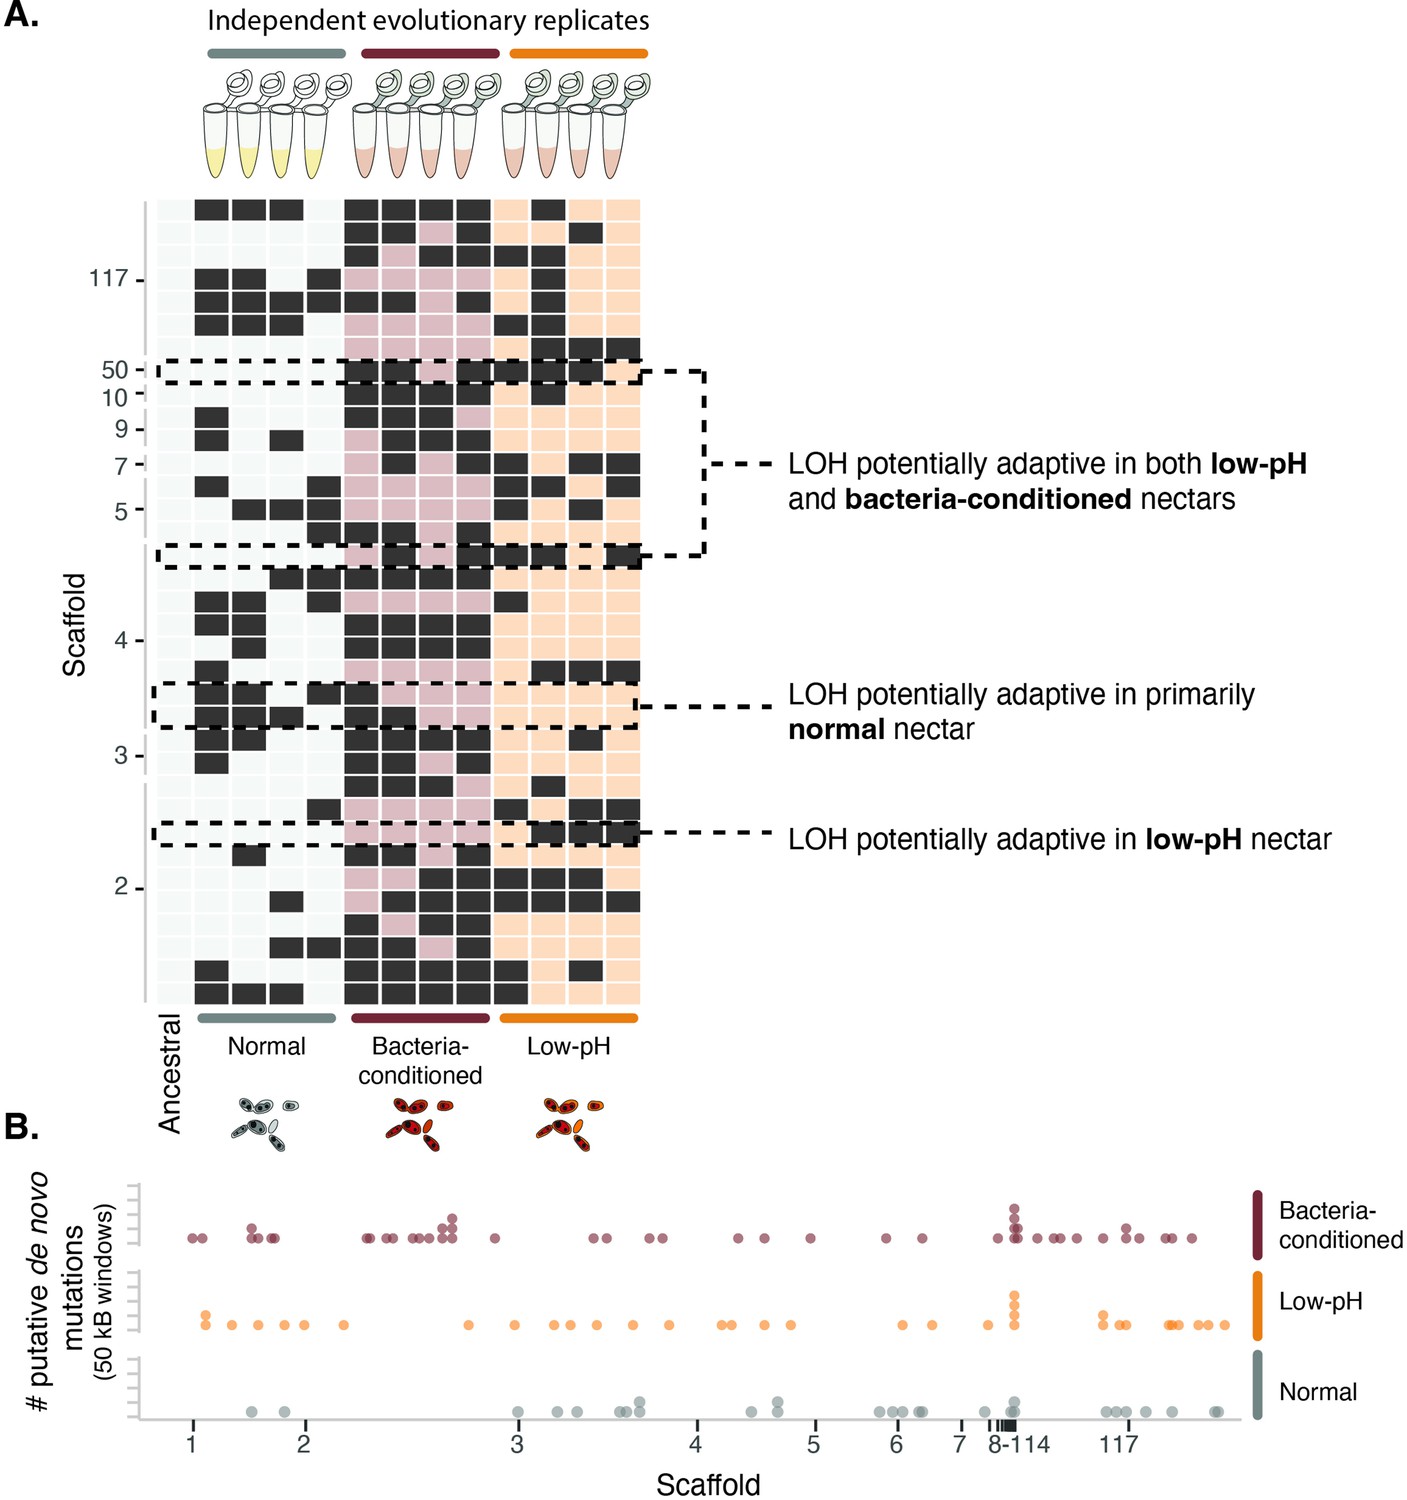
Yeast evolved to synthetic nectar.
(A) Heat map depicting treatment-specific loss of heterozygosity (LOH). Columns represent individual samples (independent evolutionary trajectories) and rows represent single sites with LOH. White or light red/orange boxes indicate sites without LOH, while dark grey boxes represent a site with LOH. Sites selected for the figure exhibited FST >0.3 and permutation-derived p-value <0.1 when comparing the ancestral strain and one of the evolved clones at that site. Boxes with dashed lines are highlighted examples of sites that are potentially adaptive in low-pH nectar, both low-pH and bacteria-conditioned nectar, and normal nectar but not the other two nectar types. (B) Distribution of putative de novo mutations across the genome in 50 kB windows and separated by treatment. Dots represent the sum of putative de novo mutations in a 50 kB window, per treatment (n=146).
-
Figure 9—source data 1
Sequencing and mapping QC.
Mapping summary of evolved and ancestral genomes. Link to full MultiQC report. The average per sample, genome-wide coverage was 444X.
- https://cdn.elifesciences.org/articles/79647/elife-79647-fig9-data1-v2.docx
-
Figure 9—source data 2
Nearest annotated gene with treatment-specific divergence.
Nearest annotated gene to each loci with treatment specific divergence (loss of heterozygosity permutation test) with P<0.1 and FST = 0.3–0.5.
- https://cdn.elifesciences.org/articles/79647/elife-79647-fig9-data2-v2.docx
-
Figure 9—source data 3
Nearest annotated gene with punitive de novo singleton mutation.
Nearest annotated gene to each putative de novo singleton mutation.
- https://cdn.elifesciences.org/articles/79647/elife-79647-fig9-data3-v2.docx
Figure 9—figure supplement 1
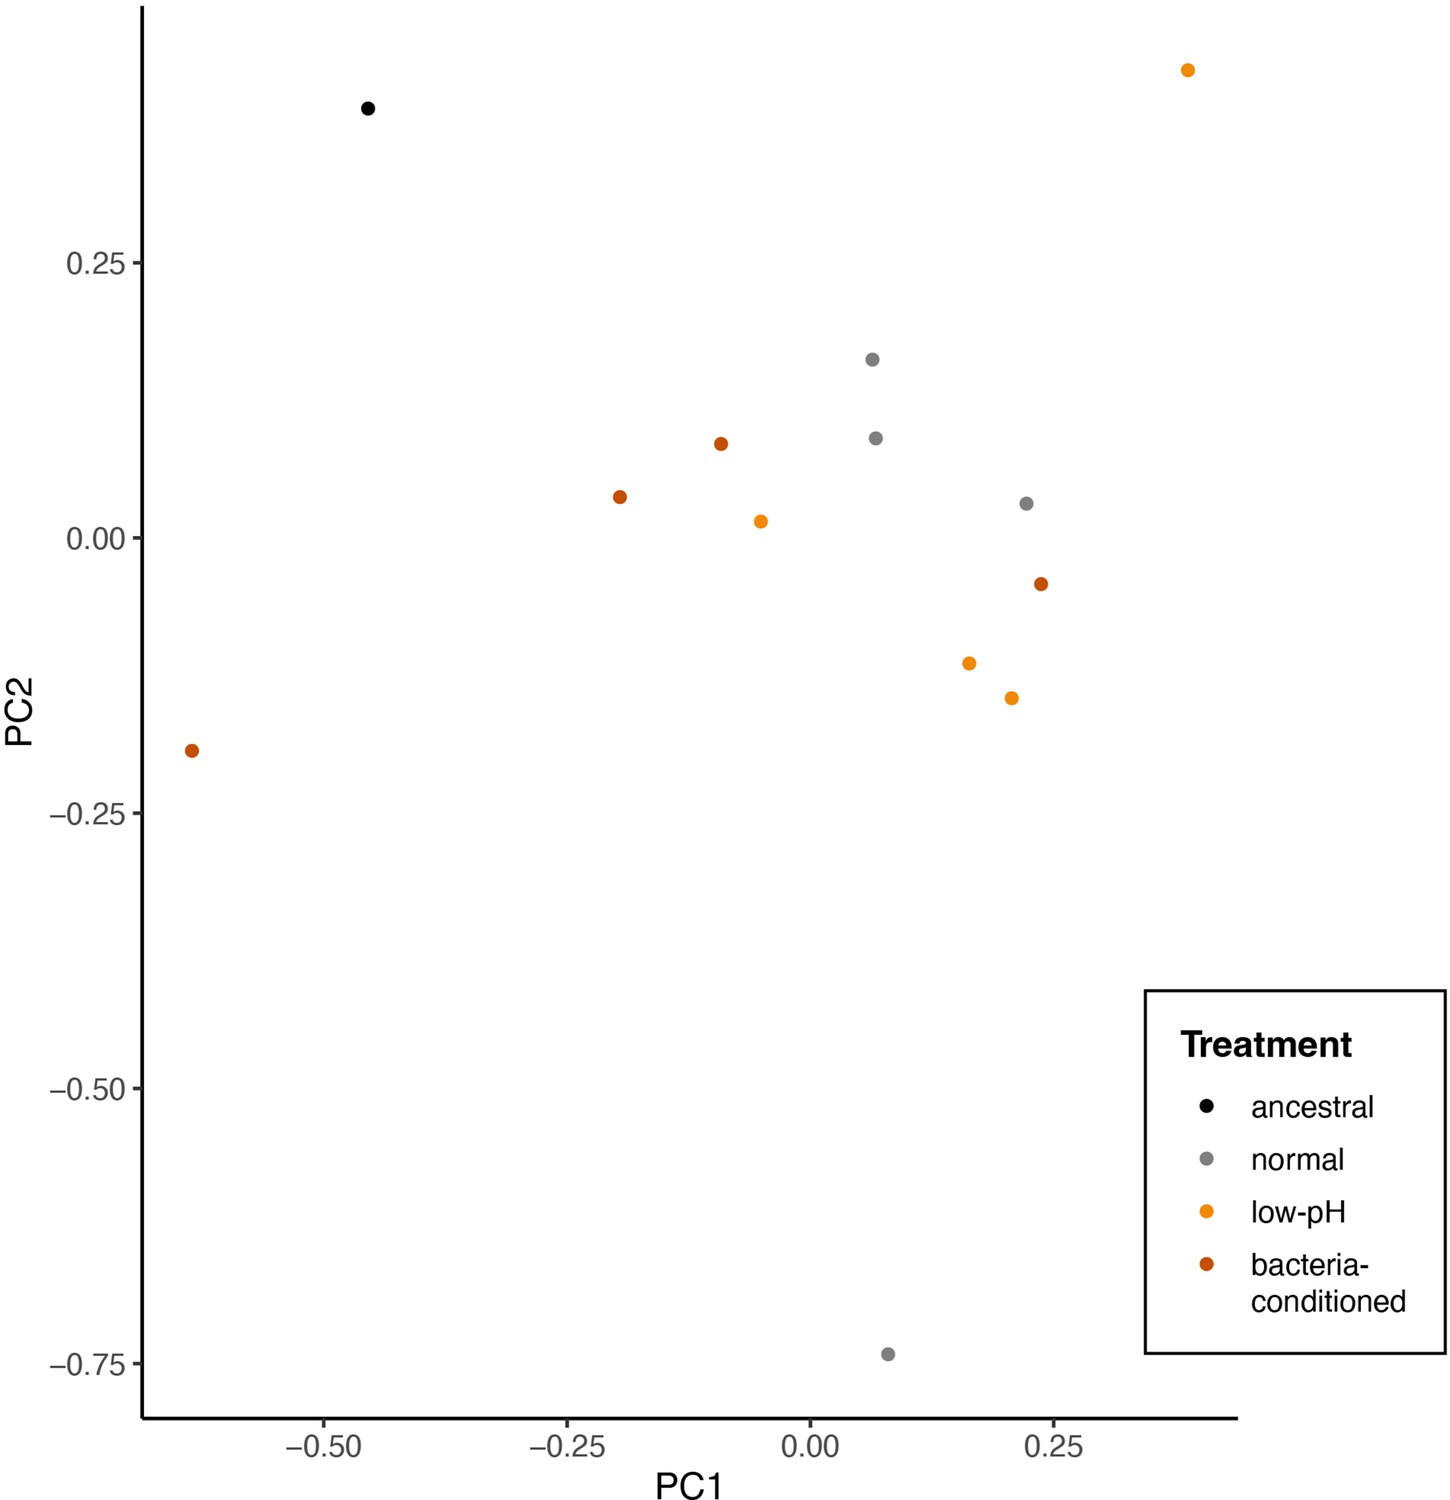
Principal components analysis of single nucleotide polymorphisms that differ between evolved and any ancestral strain (2319 sites).
Points represent individual end-point clones (individuals) and are colored by evolution treatment (ancestral in black, neutral in grey, evolved in low-pH nectar in orange, and evolved in bacteria-conditioned nectar in dark red) (perMANOVA, p=0.19, n=12).
Figure 9—figure supplement 2
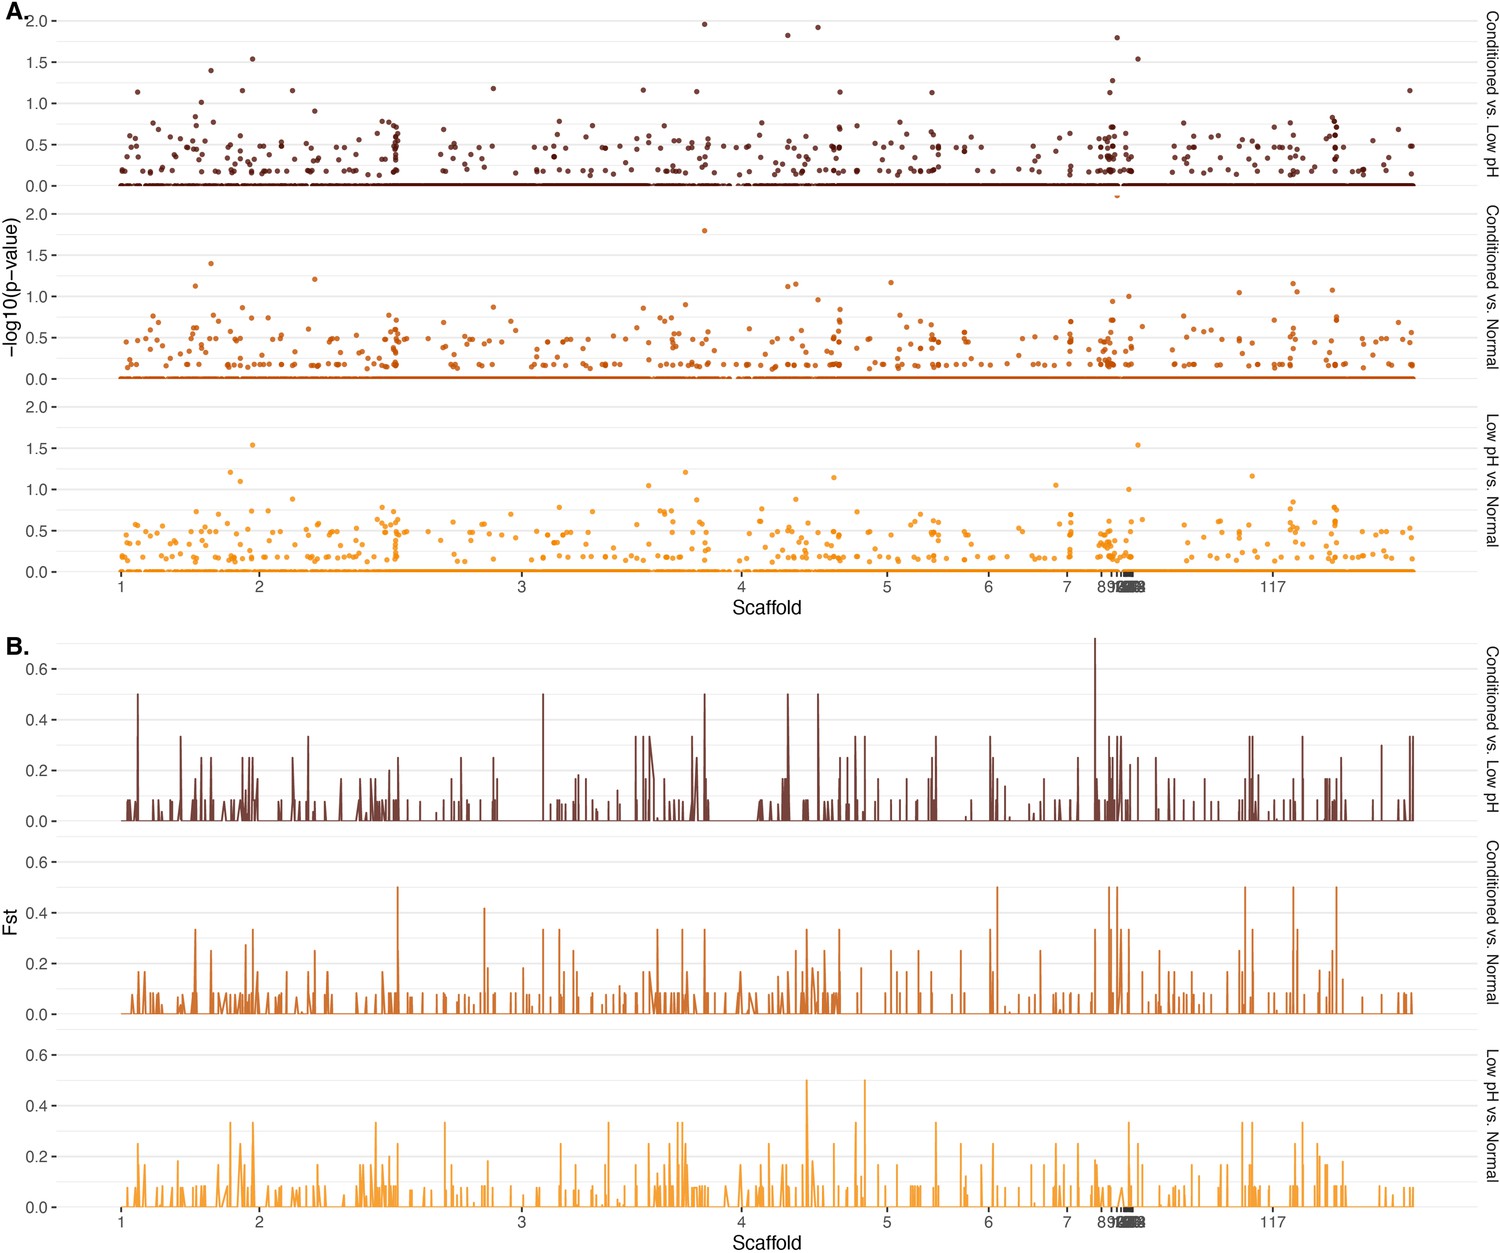
Genome-wide differentiation by (A) computed p-values for observed patterns of loss of heterozygosity (LOH) and (B) Weir-Cockerham estimator of FST.
Figure 10 with 2 supplements

Low nectar pH reduces nectar consumption by flower-visiting animals.
(A) Photo of field experiment setup: hummingbird visits artificial flowers containing PCR tubes of nectar attached to a garden stake. See this link for video: https://www.youtube.com/watch?v=LbD2r43dvnQ or refer to Rich Media (Figure 10—video 1) (B) Flower-visiting animals consumed less nectar from flowers containing low pH/high amino-acid nectar than high pH/high amino acid nectar (n=79). Letters shown above each box (each treatment) indicate statistical significance as in Figure 4.
Figure 10—figure supplement 1
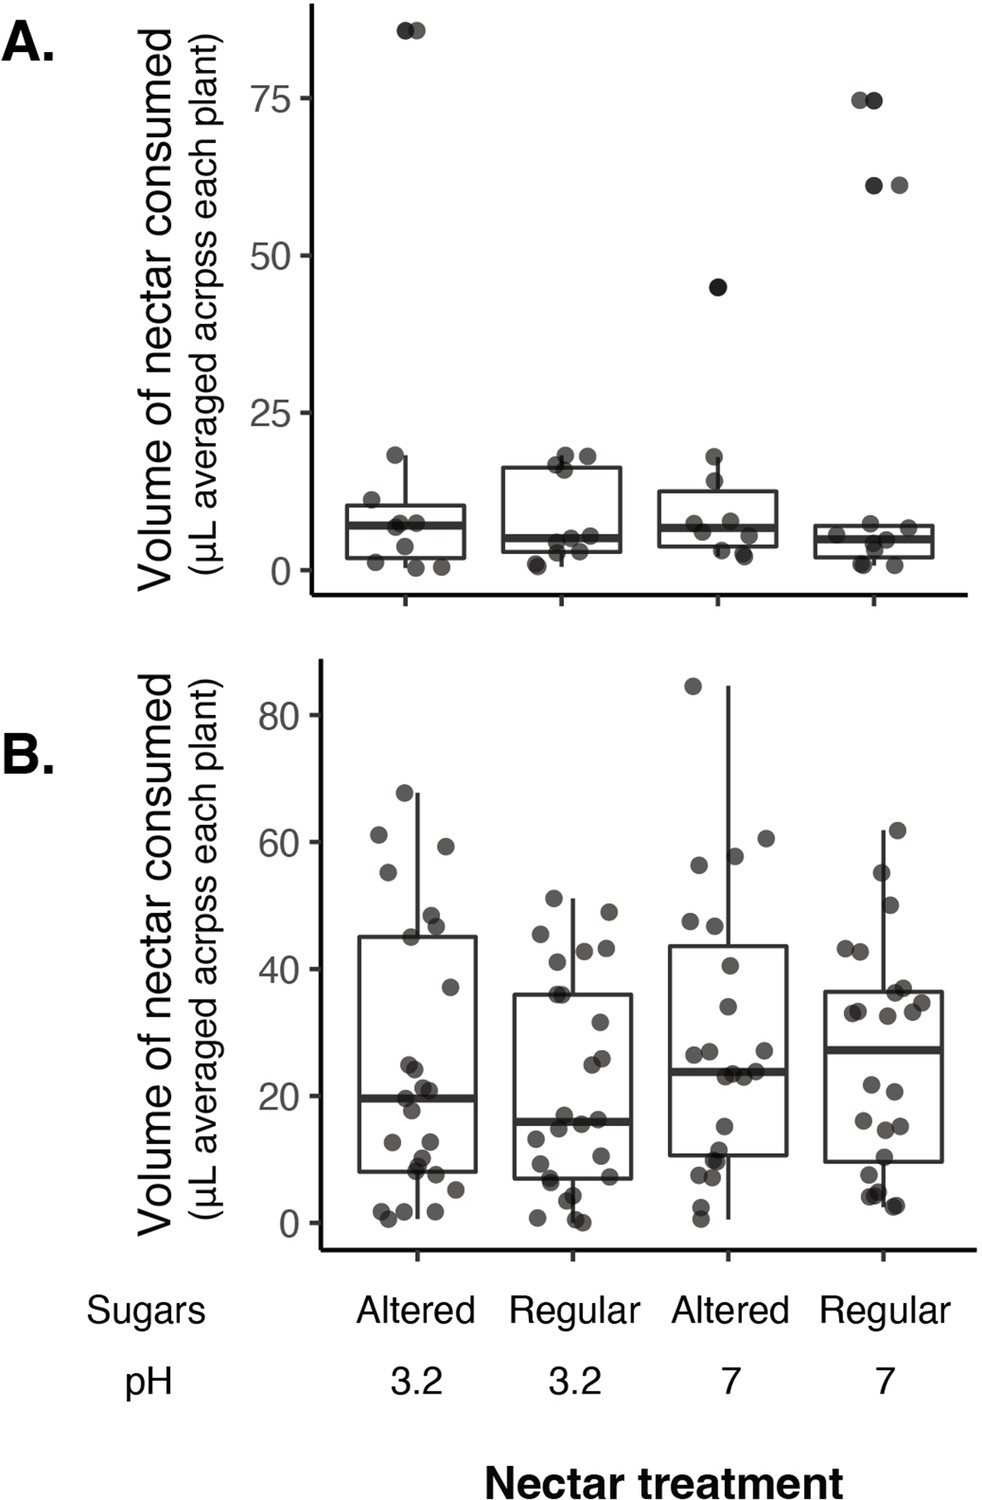
No difference in the volume of nectar consumed by nectar treatment in 2016 (A) or 2018 (B) when nectar sugars were altered with pH.
Figure 10—video 1
Anna's hummingbirds (Calypte anna) visiting experimental plants to consume artificial nectar at the Jasper Ridge Biologial Preserve of Stanford University in California, USA (video taken on July 19th, 2013 by Trevor Hebert and Tadashi Fukami).
Figure 11

pH is an eco-evolutionary driver of priority effects in nectar microbes.
(A) Field observations show that nectar yeast and bacteria in individual flowers exhibit alternative stable states, where some flowers are either dominated by bacteria (dark blue), yeast (yellow (ancestral) or red (evolved)) or lack significant microbial growth (gray). (B) Laboratory experiments identify negative priority effects between bacteria (dark blue) and yeast (yellow (ancestral) or red (evolved)) that lead to alternative states; for example, where early arriving bacteria lower the pH of nectar (depicted here in light blue), limiting the growth of later arriving yeast. Experimentally evolved nectar yeast (red) was less affected by bacterial priority effects, supporting pH as the key mechanism by which nectar bacteria inhibit yeast growth. (C) A field experiment shows one functional outcome of bacterial dominance in nectar: low nectar pH decreases nectar consumption by pollinators. Graphics modified from Chappell and Fukami, 2018.
Appendix 2—figure 1
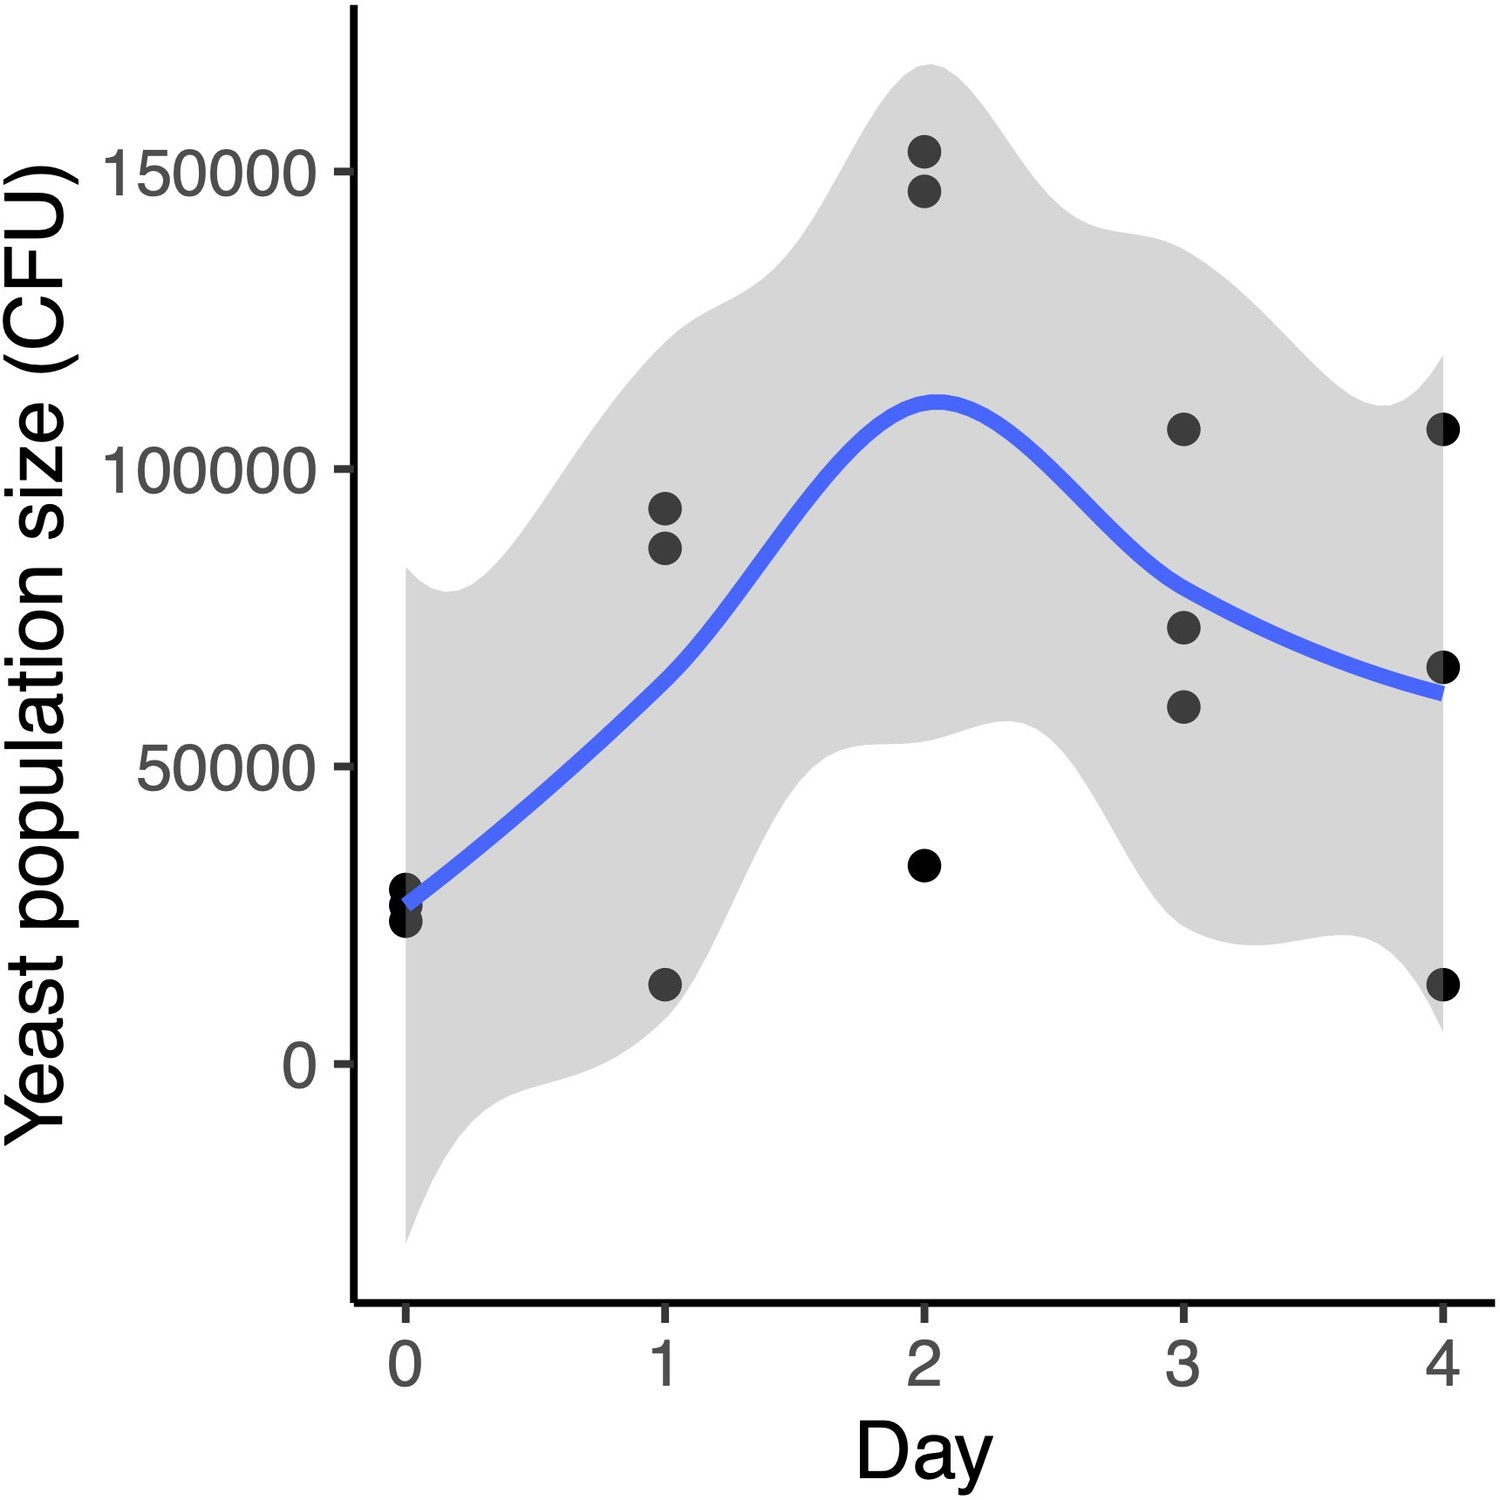
M. reukaufii growth over four days in experimental microcosms.
Author response image 1
Additional files
-
Supplementary file 1
Abstract in German, Hindi, Japanese, Mandarin, and Spanish.
Translation of the English abstract in some of the other languages spoken by the authors.
- https://cdn.elifesciences.org/articles/79647/elife-79647-supp1-v2.docx
-
MDAR checklist
- https://cdn.elifesciences.org/articles/79647/elife-79647-mdarchecklist1-v2.docx
Download links
A two-part list of links to download the article, or parts of the article, in various formats.
Downloads (link to download the article as PDF)
Open citations (links to open the citations from this article in various online reference manager services)
Cite this article (links to download the citations from this article in formats compatible with various reference manager tools)
Wide-ranging consequences of priority effects governed by an overarching factor
eLife 11:e79647.
https://doi.org/10.7554/eLife.79647


