α1-Adrenergic receptor–PKC–Pyk2–Src signaling boosts L-type Ca2+ channel CaV1.2 activity and long-term potentiation in rodents
- Department of Pharmacology, University of California, United States
- Department of Pharmacology, University of Iowa, United States
Figures
Figure 1
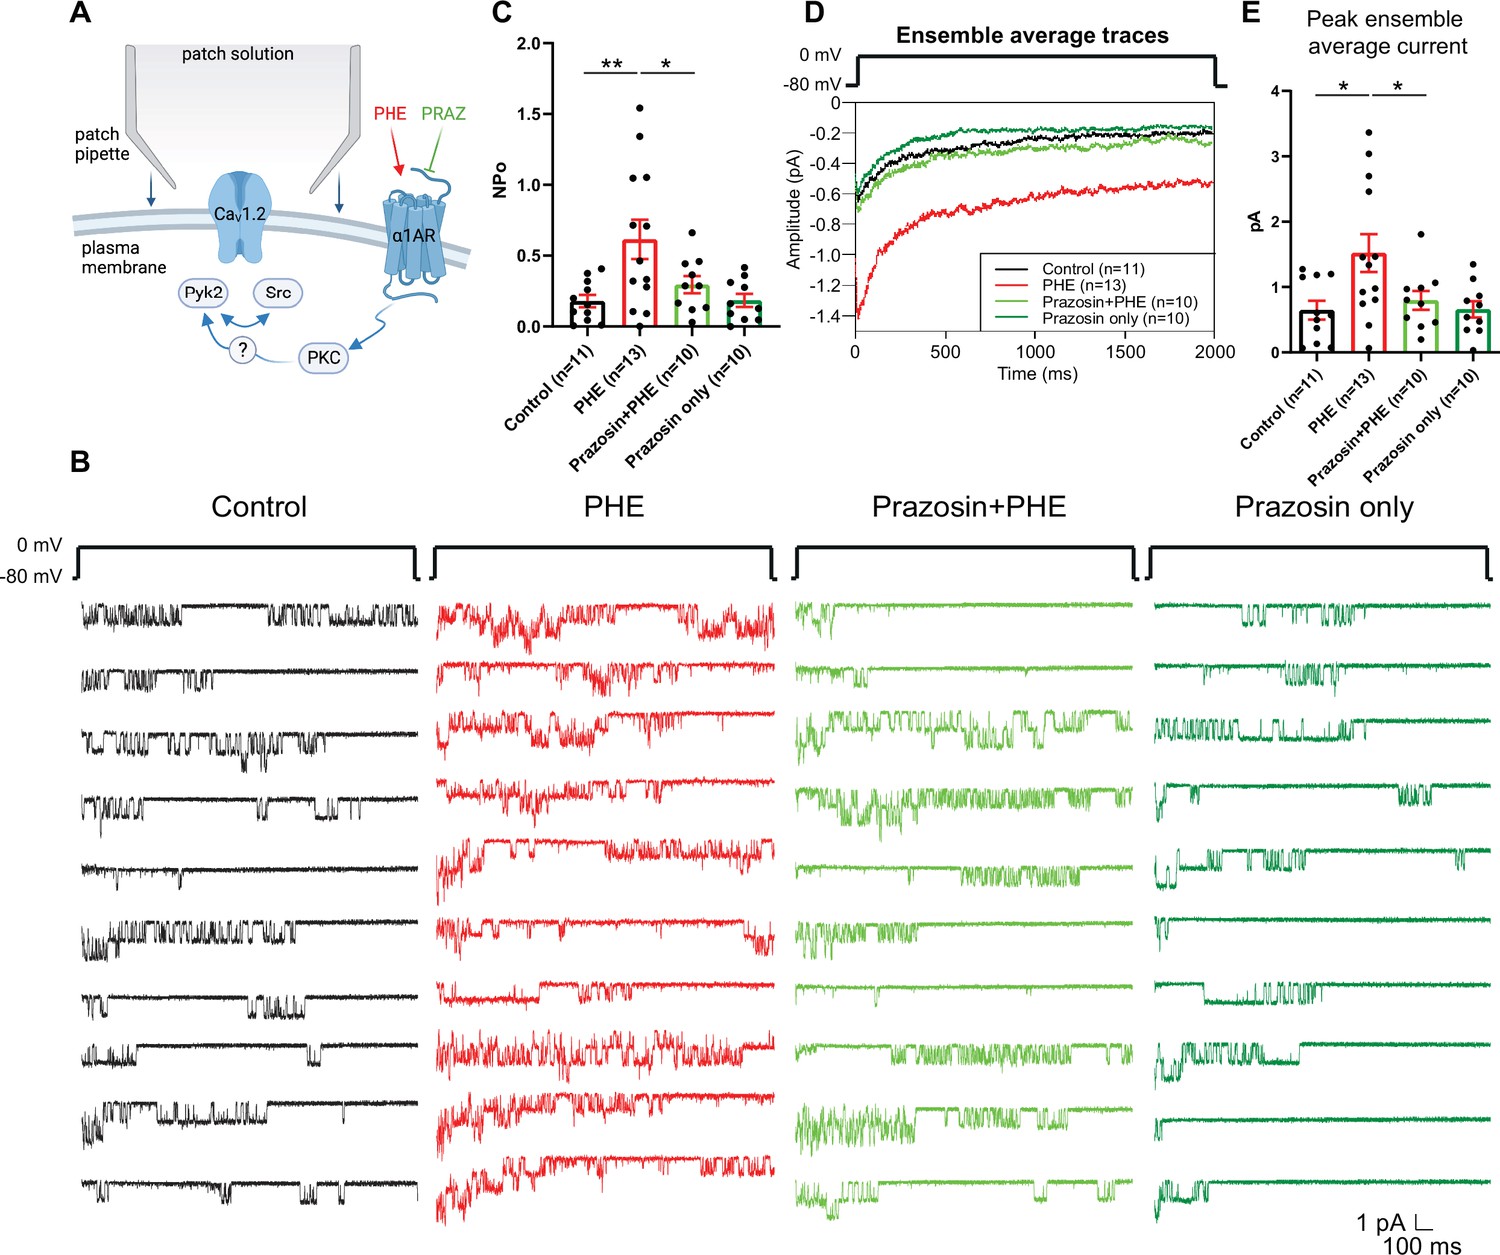
The α1AR agonist phenylephrine (PHE) augments NPo of L-type Ca2+ channels (LTCCs) in hippocampal neurons.
(A) Neurons were preincubated with vehicle, PHE and prazosin (PRAZ) before seal formation. (B) Ten consecutive traces from representative cell-attached single-channel recordings of LTCCs from cultured hippocampal neurons with vehicle (water; black), 10 µM PHE (red), PHE plus 20 nM prazosin (bright green), and prazosin alone (dark green). (C) The increase in NPo by PHE was blocked by prazosin. F3,40 = 5.474. Control vs. PHE, p = 0.0036; PHE vs. Prazosin + PHE, p = 0.0334; Control vs. Prazosin only, p = 0.9723. (D) Ensemble averages during depolarization. (E) The increase in ensemble average peak currents by PHE was blocked by prazosin. F3,40 = 4.506. Control vs. PHE, p = 0.0101; PHE vs. Prazosin + PHE, p = 0.0316; Control vs. Prazosin only, p = 0.9722. (C, E) Data are presented as means ± standard error of the mean (SEM). n represents the number of cells (*p ≤ 0.05, **p ≤ 0.01; analysis of variance [ANOVA] with post hoc Holm–Sidak’s multiple comparisons test). Panel A was created using Biorender.com.
Figure 2 with 1 supplement
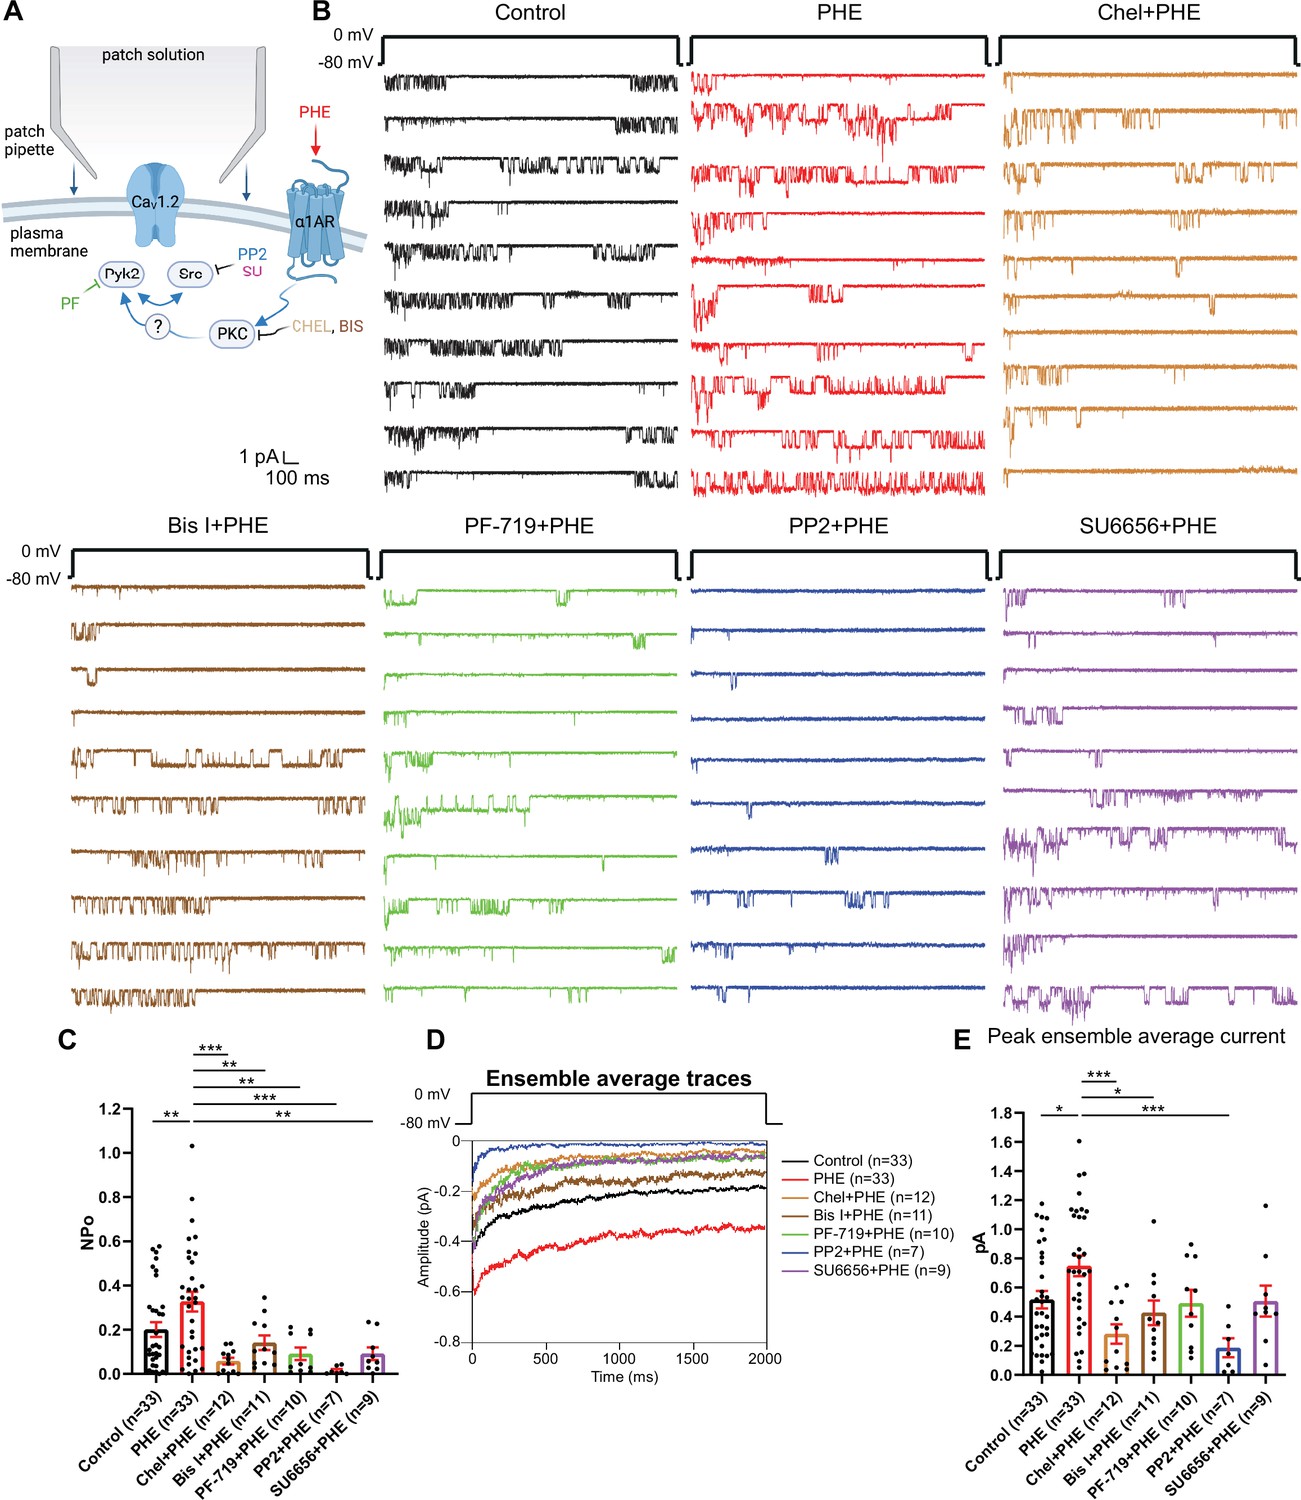
The phenylephrine (PHE)-induced increase in NPo of L-type Ca2+ channels (LTCCs) in hippocampal neurons requires PKC, Pyk2, and Src.
(A) Neurons were preincubated with vehicle, PHE, and the indicated kinase inhibitors before seal formation. (B) Ten consecutive traces from representative cell-attached single-channel recordings of LTCCs with vehicle (0.1% DMSO; black) and PHE either alone (red) or with the PKC inhibitors chelerythrine (Chel; 10 µM; bright brown) and bisindolylmaleimide I (Bis I; 100 nM; dark brown), the Pyk2 inhibitor PF-719 (1 µM; green), or the Src inhibitors PP2 (10 µM; blue) and SU6656 (10 µM; purple). (C) The increase in NPo by PHE was blocked by all inhibitors. F6,108 = 6.434. Control vs. PHE, p = 0.0076; PHE vs. Chel + PHE, p = 0.0001; PHE vs. Bis I + PHE, p = 0.0076; PHE vs. PF-719 + PHE, p = 0.0018; PHE vs. PP2 + PHE, p = 0.0003; PHE vs. SU6656 + PHE, p = 0.0022. (D) Ensemble averages during depolarization. (E) The increase in ensemble average peak currents by PHE was blocked by PKC inhibitors chelerythrine, bisinolylmaleimide I, and Src inhibitor PP2. F6,108 = 4.839. Control vs. PHE, p = 0.0242; PHE vs. Chel + PHE, p = 0.0004; PHE vs. Bis I + PHE, p = 0.0242; PHE vs. PF-719 + PHE, p = 0.0723; PHE vs. PP2 + PHE, p = 0.0006; PHE vs. SU6656 + PHE, p = 0.0723. (C, E) Data are presented as means ± standard error of the mean (SEM). n represents the number of cells (*p ≤ 0.05, **p ≤ 0.01, ***p ≤ 0.001; analysis of variance [ANOVA] with post hoc Holm–Sidak’s multiple comparisons test). Panel A was created using Biorender.com.
Figure 2—figure supplement 1

Group I mGluR and muscarinic receptor agonists did not change NPo of L-type Ca2+ channels (LTCCs) in hippocampal neurons.
(A) Ten consecutive traces from representative cell-attached single-channel recordings of LTCCs from cultured hippocampal neurons with vehicle (H2O; black), 100 µM dihydroxyphenylglycine (DHPG, pink), and 10 µM muscarine (cyan). (B) DHPG and muscarine did not alter NPo. F2,35 = 0.6559. Control vs. DHPG, p = 0.648; Control vs. Muscarine, p = 0.6843. (C) Ensemble averages during depolarization. (D) DHPG and muscarine did not alter the amplitudes of the peak ensemble average current. F2,35 = 0.007689. Control vs. DHPG, p = 0.9904; Control vs. Muscarine, p = 0.9904. (B, D) Data are presented as means ± standard error of the mean (SEM). n represent the number of cells (n.s., not significant; analysis of variance [ANOVA] with post hoc Holm–Sidak’s multiple comparisons test).
Figure 3 with 1 supplement
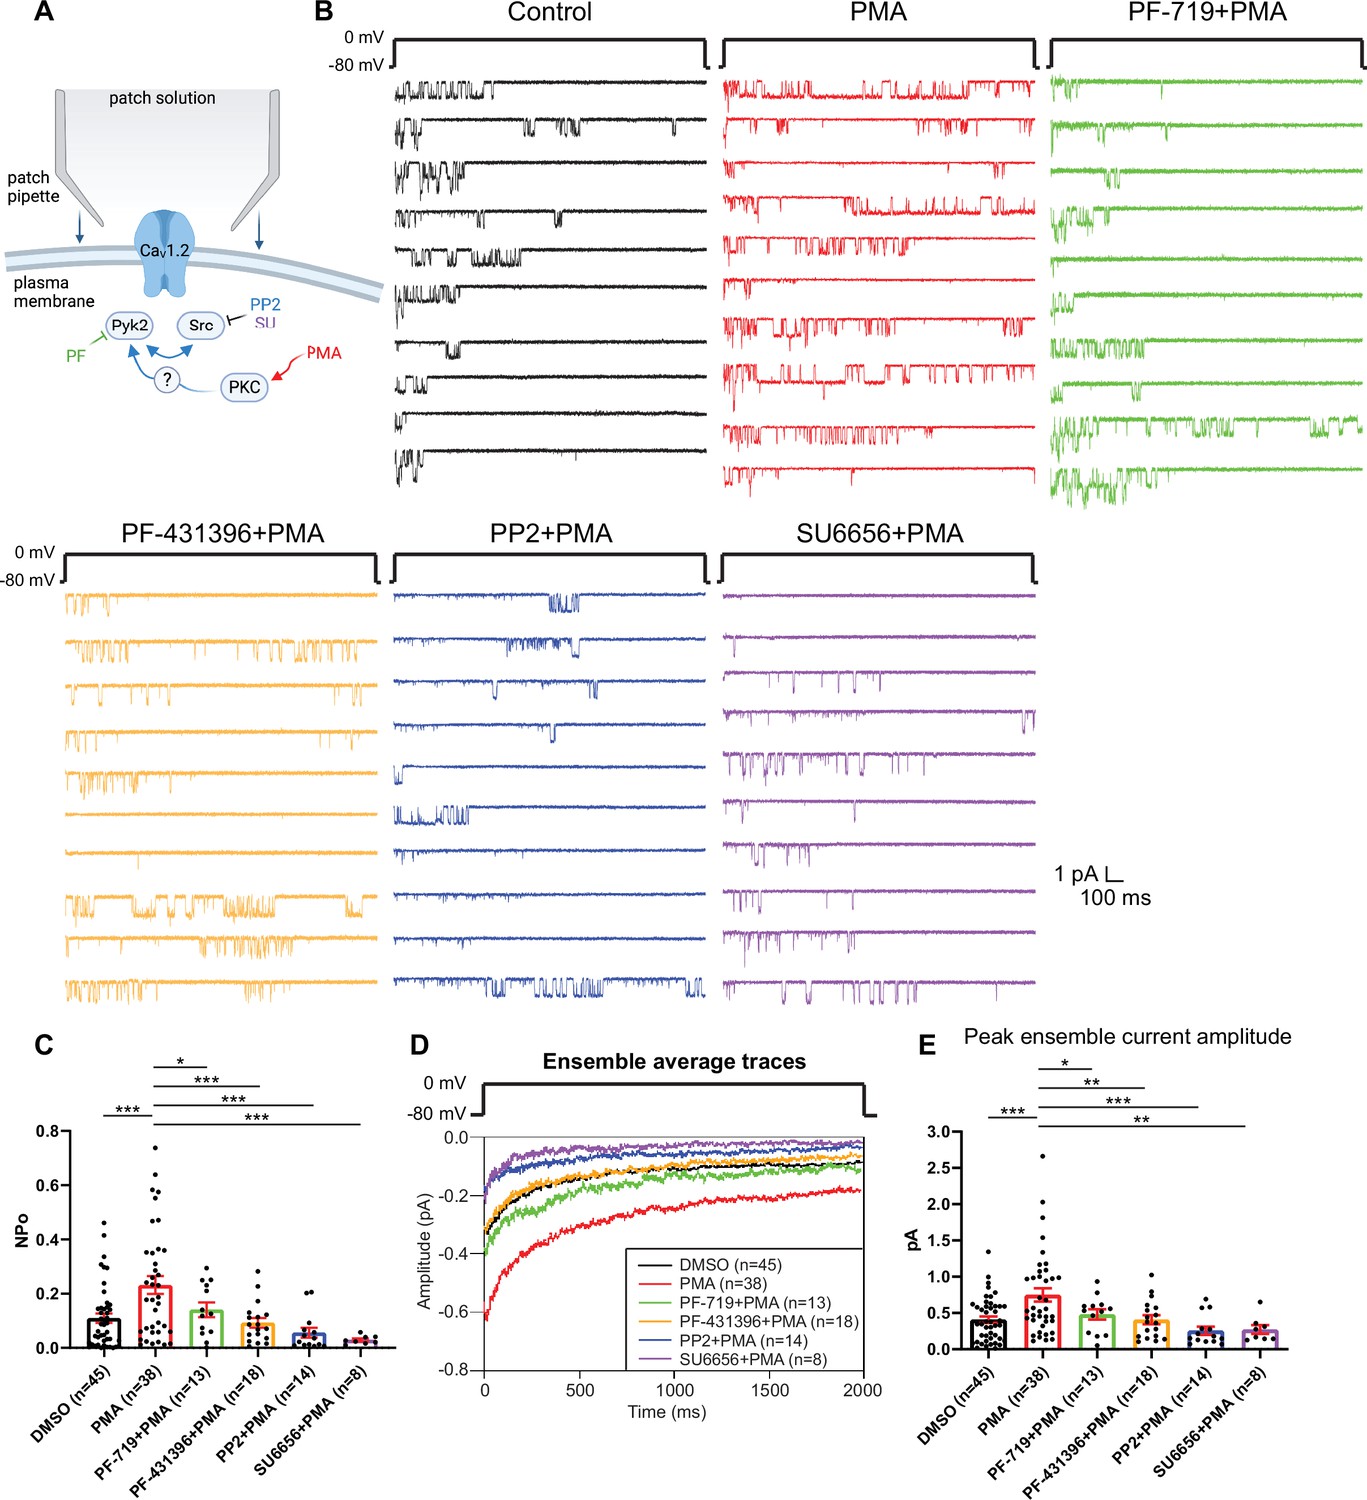
The increase in NPo of L-type Ca2+ channels (LTCCs) in hippocampal neurons by PKC requires Pyk2 and Src.
(A) Neurons were preincubated with vehicle, the phorbol ester phorbol-12-myristate-13-acetate (PMA), and the indicated kinase inhibitors before seal formation. (B) Ten consecutive traces from representative cell-attached single-channel recordings of LTCCs with vehicle (0.06% DMSO; black) and 2 µM PMA either alone (red) or with the Pyk2 inhibitors PF-719 (1 µM; green) and PF-431396 (3 µM; orange), or the Src inhibitors PP2 (10 µM; blue) and SU6656 (10 µM; purple). (C) The increase in NPo by PMA was blocked by all inhibitors. F5,130 = 6.530. DMSO vs. PMA, p = 0.0003; PMA vs. PF-719 + PMA, p = 0.0372, PMA vs. PF-431396 + PMA, p = 0.0009; PMA vs. PP2 + PMA, p = 0.0003; PMA vs. SU6656 + PMA, p = 0.0005. (D) Ensemble averages during depolarization. (E) The increase in ensemble average peak currents by PMA was blocked by all inhibitors. F5,130 = 5.665. DMSO vs. PMA, p = 0.0003; PMA vs. PF-719 + PMA, p = 0.0303, PMA vs. PF-431396 + PMA, p = 0.0051; PMA vs. PP2 + PMA, p = 0.0003; PMA vs. SU6656 + PMA, p = 0.0051. (C, E) Data are presented as means ± standard error of the mean (SEM). n represents the number of cells (*p ≤ 0.05, **p ≤ 0.01, ***p ≤ 0.001; analysis of variance [ANOVA] with post hoc Holm–Sidak’s multiple comparisons test). Panel A was created using Biorender.com.
Figure 3—figure supplement 1

L-type channel blocker isradipine completely blocks L-type single-channel currents in the presence of phorbol-12-myristate-13-acetate (PMA).
PMA (2 μM) in the bath solution potentiated the open probability of L-type channels during single-channel recording. Isradipine (10 μM) in the pipette solution completely blocked L-type currents in PMA-containing bath solution. Data are presented as as means ± standard error of the mean (SEM). n represents the number of cells (*p ≤ 0.05; analysis of variance [ANOVA] with post hoc Holm–Sidak’s multiple comparisons test). F2,26 = 6.004. DMSO vs. PMA, p = 0.0139; PMA vs. Isradipine + PMA, p = 0.0129.
Figure 4
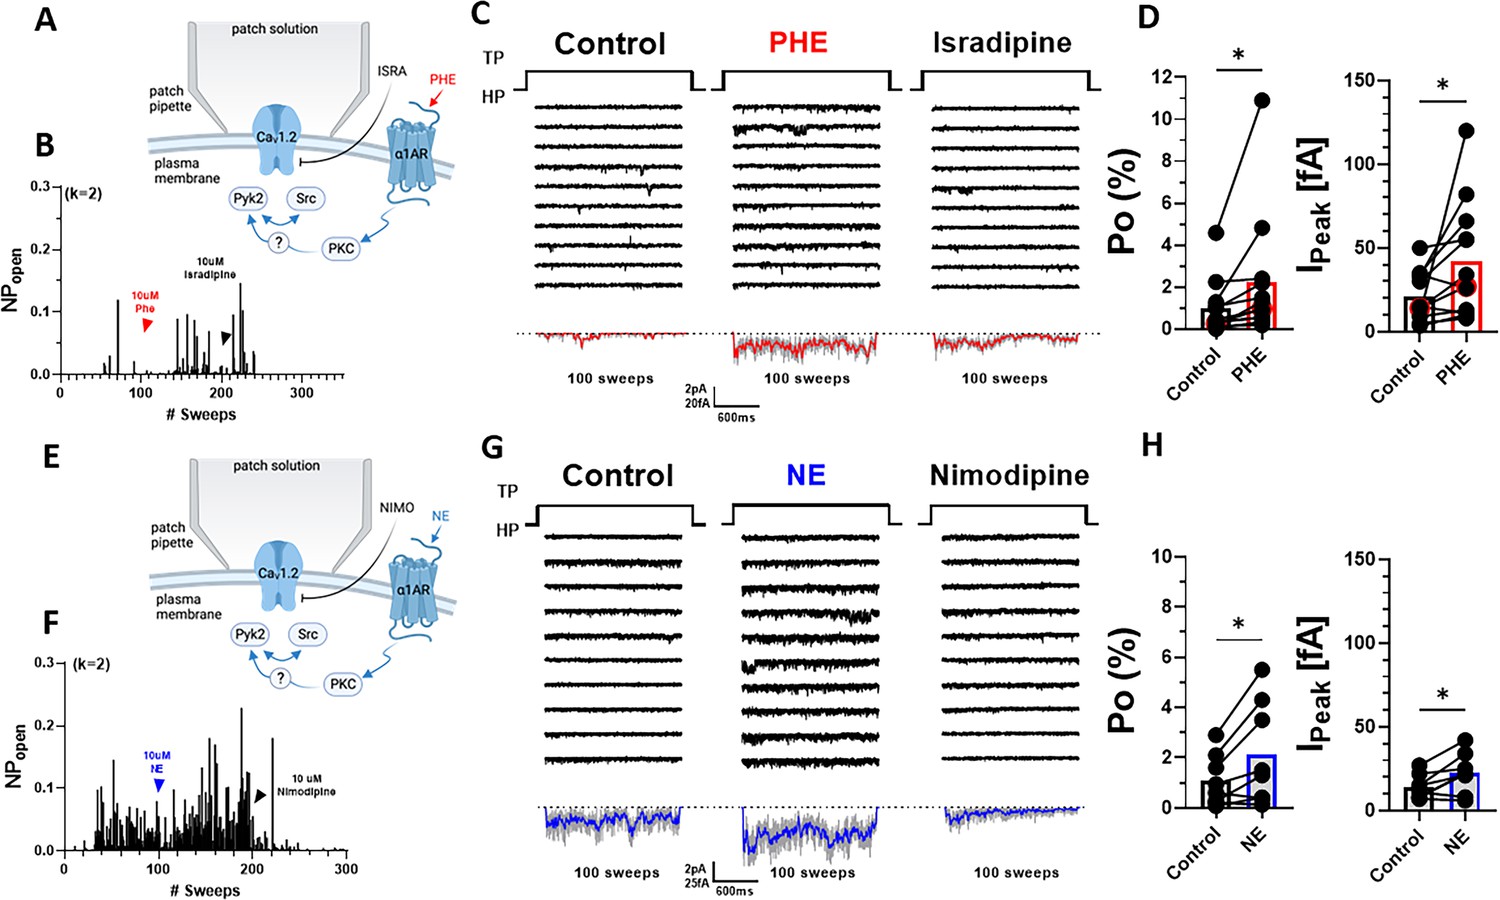
α1AR signaling augments Po of L-type Ca2+ channels (LTCCs) in hippocampal neurons.
(A, E) Seals were formed by the recording pipettes before application of phenylephrine (PHE) or norepinephrine (NE) and ultimately of either isradipine or nimodipine to ensure channel activity was mediated by LTCCs. (B) Sample diary shows time course of Po before and after application of 10 µM PHE and then 10 µM isradipine. The number of channels under the patch was estimated based on the maximal number of observed stagged openings in each patch (k; upper left). (C) Ten consecutive traces from representative cell-attached single-channel LTTC recordings before and after application of PHE and then isradipine. Bottom panels show ensemble averages. (D) PHE increases Po (left) and peak currents of ensemble averages (n = 12 cells; right). (F) Sample diary shows time course of Po before and after application of 10 µM NE and then 10 µM isradipine. (G) Ten consecutive traces from representative cell-attached single-channel recordings of LTCCs before and after application of NE and then nimodipine. Bottom panels show ensemble averages. (H) NE increases Po (left) and peak currents of ensemble averages (n = 8 cells; right). (D, H) Data are presented as means ± standard error of the mean (SEM). Statistical significance was tested by a paired, two-tailed Student’s t-test, *p ≤ 0.05. Panels A and E were created using Biorender.com.
Figure 5
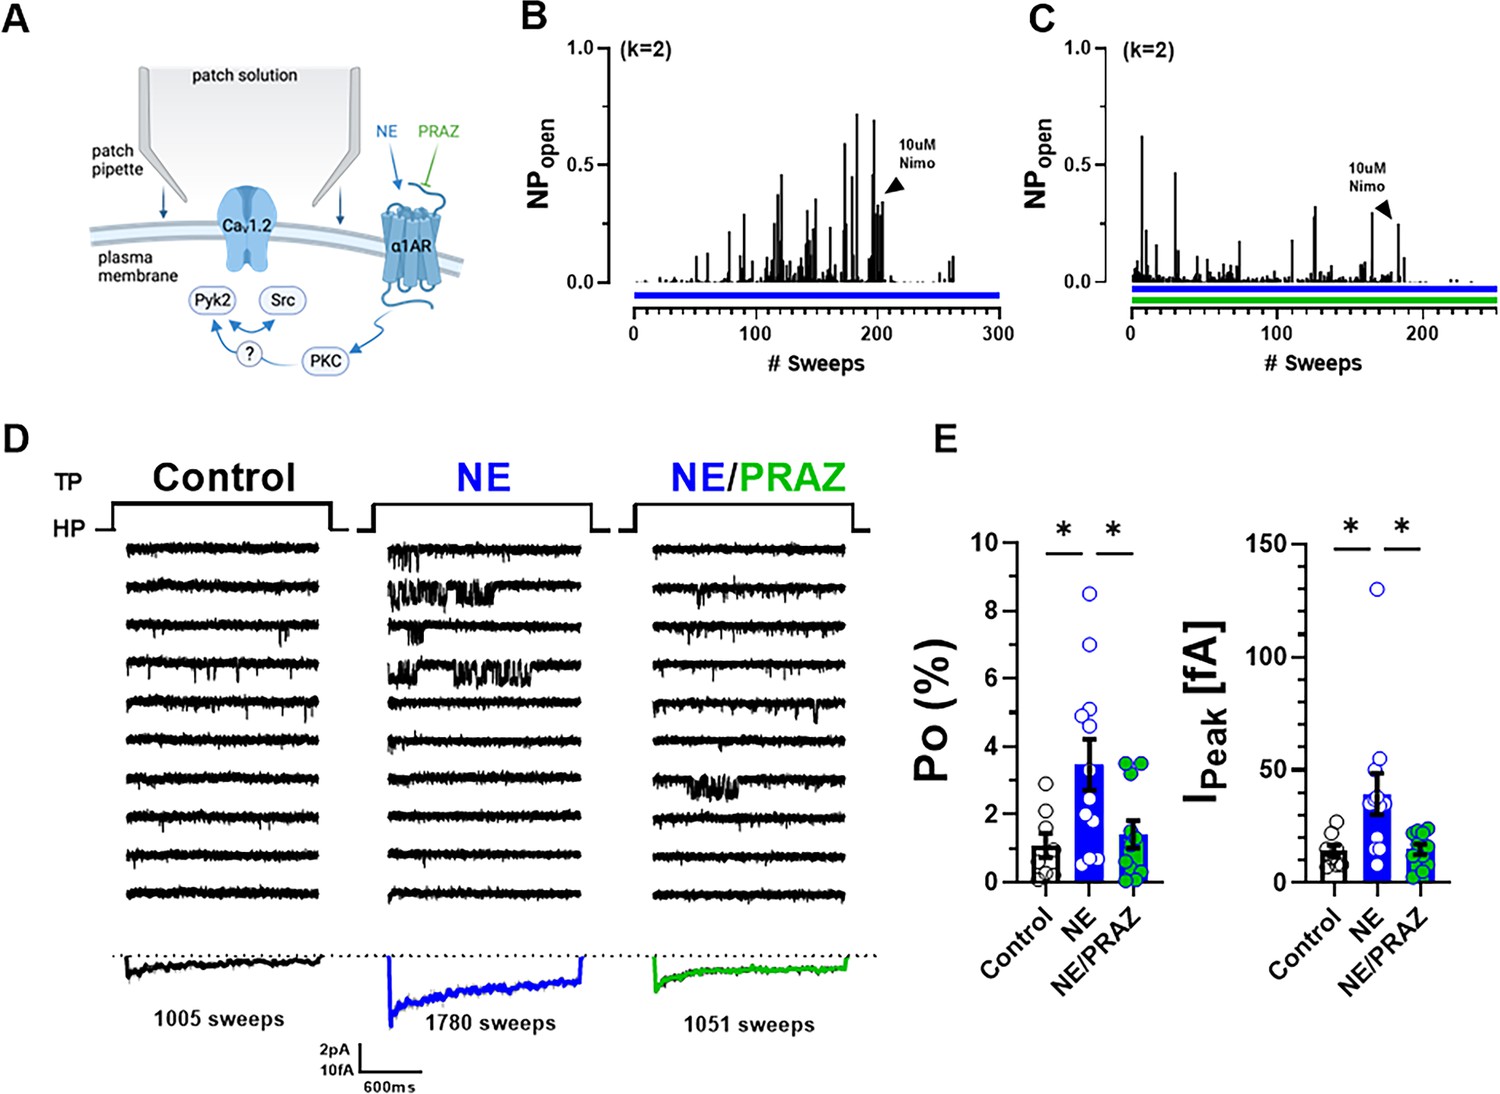
Norepinephrine (NE) can augment Po of L-type Ca2+ channels (LTCCs) via α1AR signaling in hippocampal neurons.
(A) Neurons were preincubated with NE ± prazosin (PRAZ) before seal formation. (B, C) Sample diaries show time courses of Po recordings obtained after preincubation with either NE alone or NE + PRAZ and seal formation. The number of channels under the patch was estimated based on the maximal number of observed stagged openings in each patch (k; upper left). (D) Ten consecutive traces from representative cell-attached single-channel recordings of LTCCs under control conditions or upon pre-incubation with either NE alone or NE plus PRAZ. Bottom panels show ensemble averages. (E) NE strongly increases Po (left) and peak currents of ensemble averages (right), which was strongly but not fully inhibited by PRAZ. Data are presented as means ± standard error of the mean (SEM; Control, n = 8 cells; NE, n = 12 cells; NE/PRAZ, n = 11 cells). Statistical significance was tested by a one-way analysis of variance (ANOVA) with Bonferroni correction, *p ≤ 0.05. Panel A was created using Biorender.com.
Figure 6
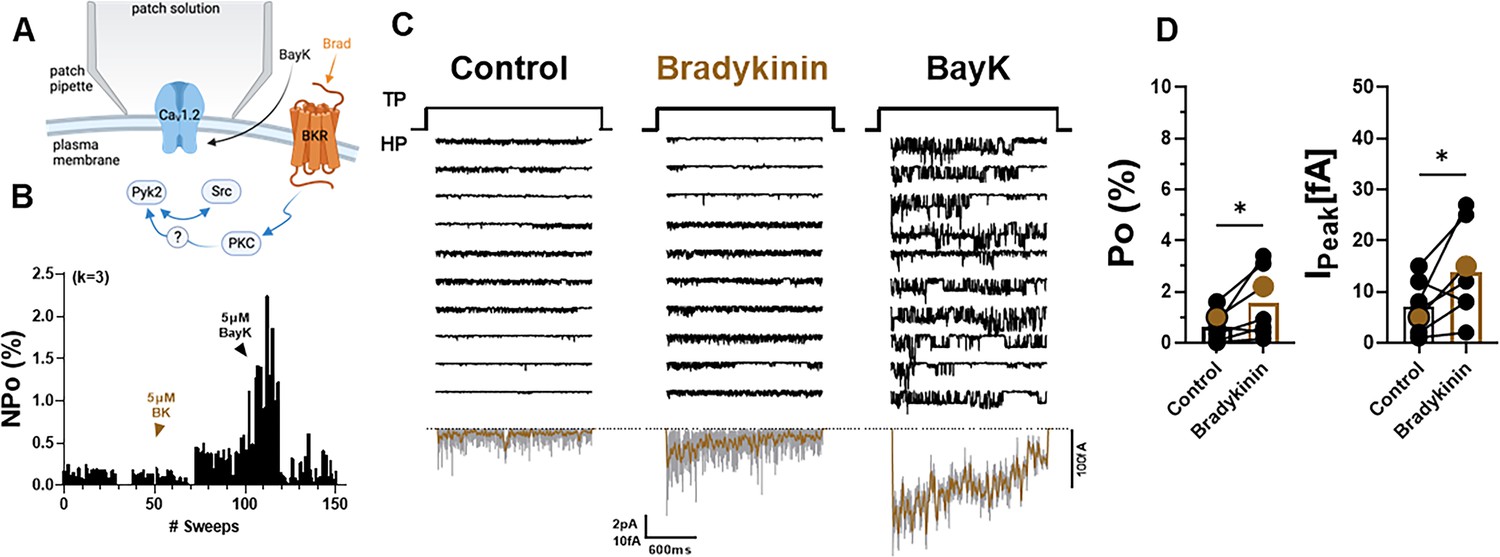
Bradykinin (BK) signaling augments Po of L-type Ca2+ channels (LTCCs) in hippocampal neurons.
(A) Seals were formed by the recording pipettes before application of BK and ultimately of BayK8644 (BayK) to ensure channel activity was mediated by LTCCs. (B) Sample diary shows time course of Po before and after application of 5 µM BK and then 5 µM BayK to not only provide further evidence that the channels in the patch were LTCC but also aid in determining channel number k (upper left), which is the number of channels under the patch as estimated based on the maximal number of observed stagged openings in each patch. (C) Ten consecutive traces from representative cell-attached single-channel recordings of LTCCs before and after application of BK and then BayK. Bottom panels show ensemble averages. (D) BK increases Po (left) and peak currents of ensemble averages (right). Data are presented as means ± standard error of the mean (SEM; n = 7 cells). Statistical significance was tested by a paired, two-tailed Students t-test, *p ≤ 0.05. Panel A was created using Biorender.com.
Figure 7
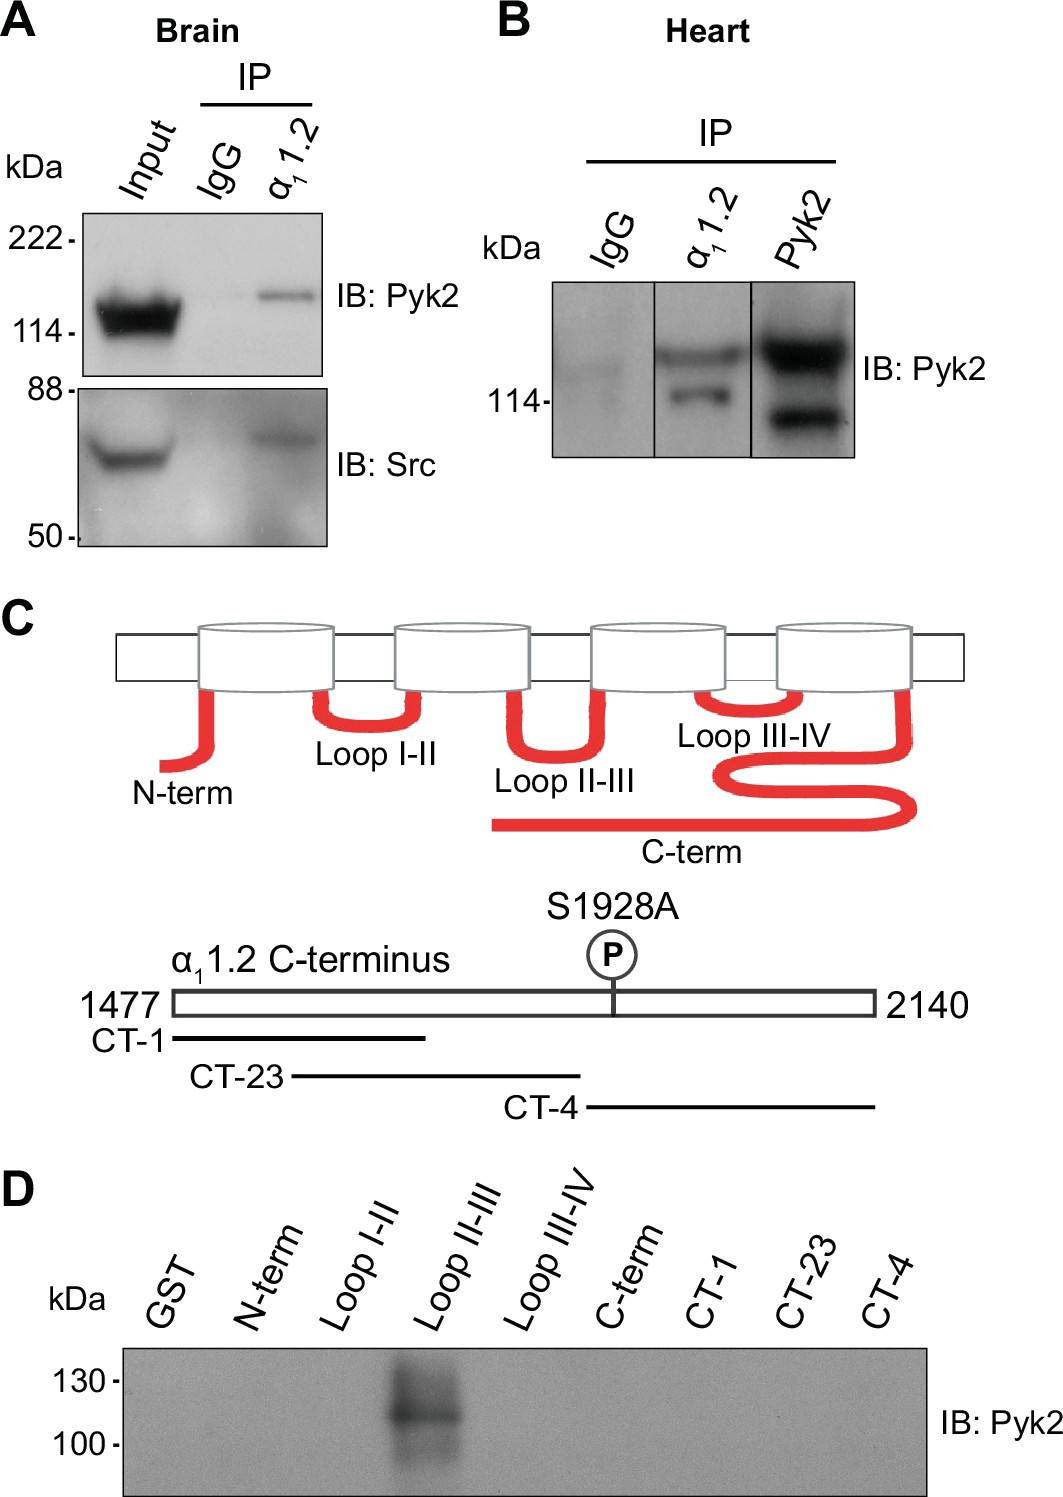
Pyk2 binds to the loop between domains II and III of α11.2. Co-immunoprecipitation of Pyk2 and Src with CaV1.2 from brain (A) and heart (B).
Triton X-100 extracts were cleared from non-soluble material by ultracentrifugation before immunoprecipitation (IP) with antibodies against α11.2, Pyk2 itself, or non-immune control antibodies (rabbit IgG) and immunoblotting (IB) with anti-Pyk2 and anti-Src. Brain lysate (A, Input; 20 μl) and Pyk2 immunoprecipitates (B) served as positive control for detection of Pyk2 and Src by IB. Lanes for rabbit IgG control and α11.2 IP in B are from the same IB as the Pyk2 IP, which is depicted from a shorter exposure than the IgG and α11.2 IP lanes because IB signal was much stronger after Pyk2 IP than α11.2 IP. Comparable results were obtained in four independent experiments. (C) Schematic diagram of the intracellular α11.2 fragments used in the pulldown assay (Supplementary file 1). (D) Pulldown assay of Pyk2 binding to α11.2 fragments. GST fusion proteins of the N-terminus, the loops between domains I and II, II and III, III and IV, the whole C-terminus, and three different overlapping fragments covering the C-terminus were expressed in Escherichia coli, immobilized on glutathione Sepharose, washed and incubated with purified His-tagged Pyk2. Comparable amounts of fusion proteins were present (data not shown but see Hall et al., 2013; Hall et al., 2007; Patriarchi et al., 2016; Xu et al., 2010). Comparable results were obtained in five independent experiments.
-
Figure 7—source data 1
Original files of the full raw unedited blots with bands labeled in red boxes.
- https://cdn.elifesciences.org/articles/79648/elife-79648-fig7-data1-v2.zip
Figure 8
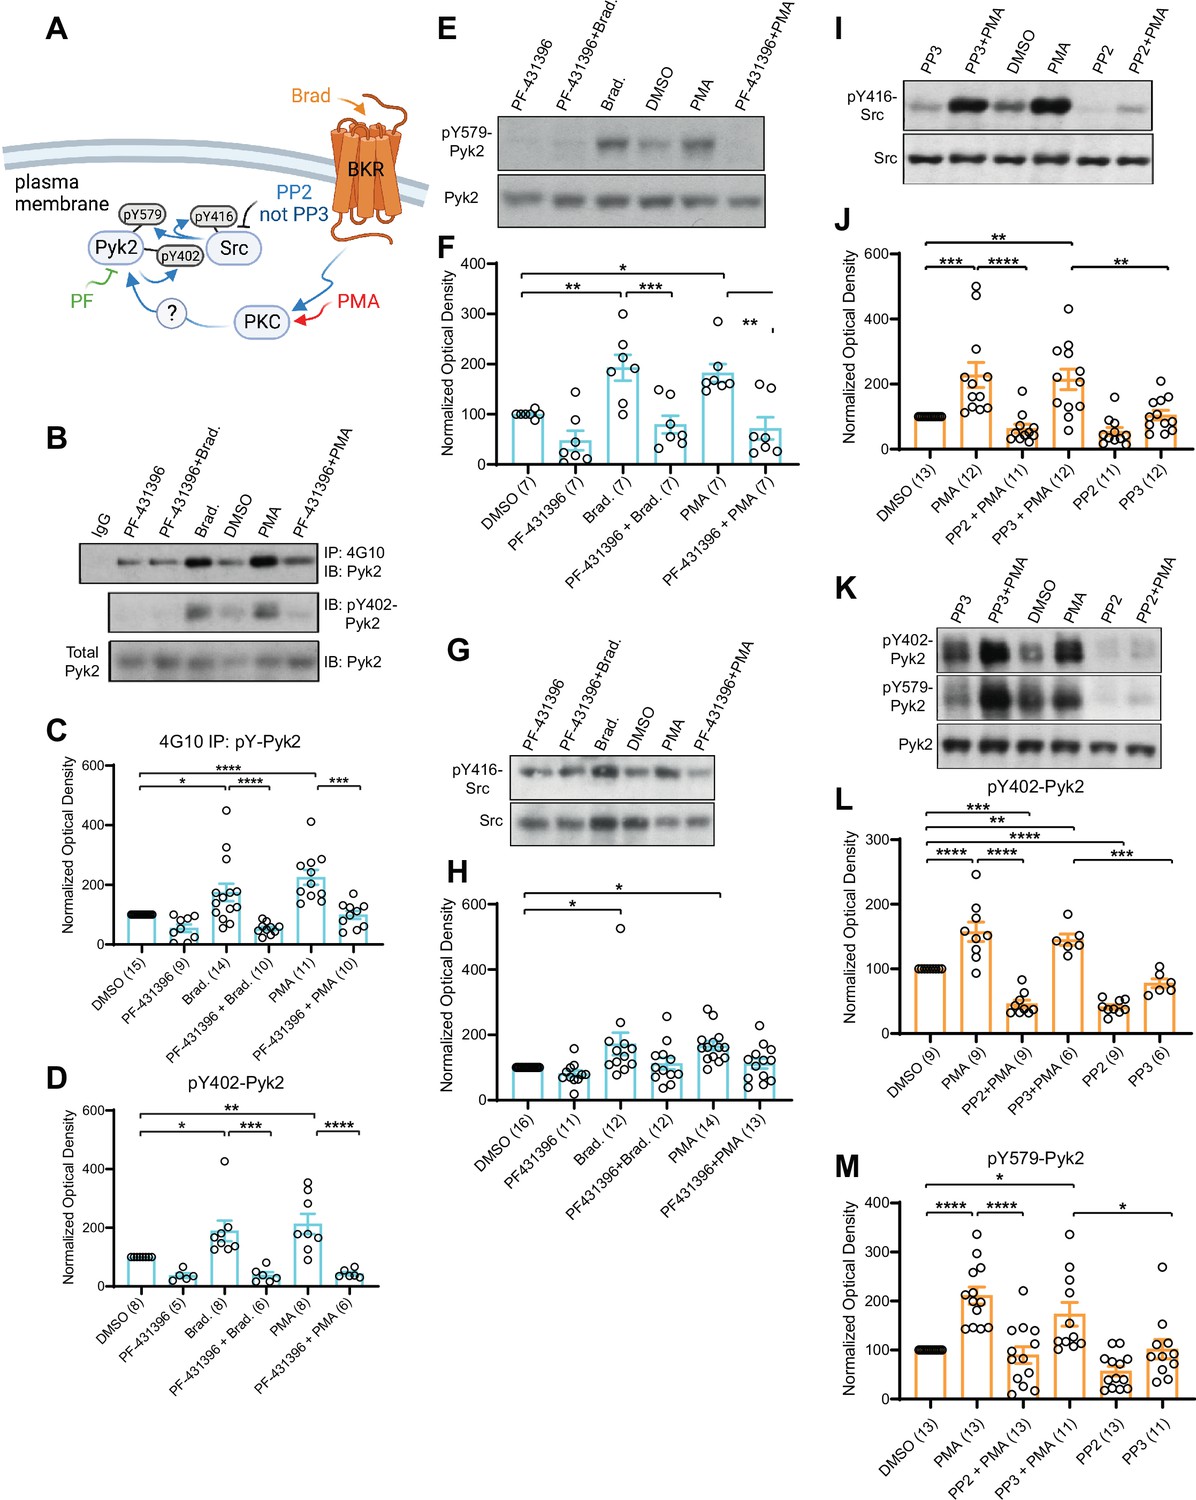
PKC activates interdependent Pyk2 and Src.
PC12 cells were pretreated with vehicle (0.02% DMSO), the Pyk2 inhibitor PF-431396 (3 μM), and the Src inhibitor PP2 (10 μM) or its inactive analogue PP3 (10 μM) for 5 min before application of bradykinin (Brad., 2 μM) or phorbol-12-myristate-13-acetate (PMA, 2 μM) for 10 min, extraction with 1% sodium dodecyl sulfate (SDS) at 65°C to ensure dissociation of all proteins, neutralization of SDS with excess of Triton X-100, and ultracentrifugation. Supernatants were analysed by direct immunoblotting (IB) with the indicated Pyk2 and Src antibodies.
Some samples underwent immunoprecipitation (IP) with the anti-phosphotyrosine antibody 4G10 before IB with anti-Pyk2 antibody (top panel in A and quantification in B). IgG indicates control IP with non-immune mouse IgG. (A) Schematic diagram depicting the bradykinin receptor–PKC–Pyk2/Src signaling cascade and drugs used to target each molecular entity. (B) Upper panel: Total pY levels of Pyk2 determined by IP with 4G10 and IB with anti-Pyk2. Middle panel: pY402 levels of Pyk2 detected with anti-pY402 in corresponding lysates. Lower panel: Levels of total Pyk2 detected with anti-Pyk2 in same lysates. (C) Ratios of total pY of Pyk2 after 4G10 IP to total Pyk2 in lysates, normalized to control. F5,63 = 12.73. DMSO vs. Brad., p = 0.012; DMSO vs. PMA, p < 0.0001; Brad. vs. PF-431396 + Brad., p < 0.0001; PMA vs. PF-431396 + PMA, p = 0.0001. (D) Ratios of pY402 to total Pyk2 signals in lysates, normalized to control. F5,35 = 10.94. DMSO vs. Brad., p = 0.039; DMSO vs. PMA, p = 0.0052; Brad. vs. PF-431396 + Brad., p = 0.0005; PMA vs. PF-431396 + PMA, p < 0.0001. (E) Upper panel: pY579 levels of Pyk2 detected with anti-pY579. Lower panel: Levels of total Pyk2 detected with anti-Pyk2 in same lysates. (F) Ratios of pY579 to total Pyk2 signals in lysates, normalized to control. F5,36 = 10.18. DMSO vs. Brad., p = 0.0072; DMSO vs. PMA, p = 0.021; Brad. vs. PF-431396 + Brad., p = 0.0008; PMA vs. PF-431396 + PMA, p = 0.0011. (G, I) Upper panels: pY416 levels of Src detected with anti-pY416. Lower panels: Levels of total Src detected with anti-Src in same lysates. (H, J) Ratios of pY416 to total Src signals in lysates, normalized to control. (H) F5,72 = 4.464. DMSO vs. Brad., p = 0.0167; DMSO vs. PMA, p = 0.0226. (J) F5,65 = 11.06. DMSO vs. PMA, p = 0.001; PMA vs. PP2 + PMA, p < 0.0001; DMSO vs. PP3 + PMA, p = 0.0042; PP3 vs. PP3 + PMA, p = 0.0086. (K) Upper panel: pY402 levels of Pyk2 detected with anti-pY402. Middle panel: pY579 levels of Pyk2 detected with anti-pY579. Lower panel: Levels of total Pyk2 detected with anti-Pyk2 in same lysates. (L, M) Ratios of pY402 and pY579 to total Pyk2 signals in lysates, normalized to control. (L) F5,42 = 35.85. DMSO vs. PMA, p < 0.0001; PMA vs. PP2 + PMA, p < 0.0001; PP3 vs. PP3 + PMA, p = 0.0001; DMSO vs. PP3 + PMA, p = 0.0068; DMSO vs. PP2 + PMA, p = 0.0001; DMSO vs. PP2, p < 0.0001. (M) F5,68 = 13.40. DMSO vs. PMA, p < 0.0001; PMA vs. PP2 + PMA, p < 0.0001; PP3 vs. PP3 + PMA, p = 0.0362; DMSO vs. PP3 + PMA, p = 0.0202. (C, D, F, H, J, L, M) Data are presented as mean ± standard error of the mean (SEM). Number (n) of independent experiments for each condition are indicated inside bars. Statistical analysis was by analysis of variance (ANOVA) with post hoc Bonferroni’s multiple comparisons test; *p ≤ 0.05, **p ≤ 0.01, ***p ≤ 0.001, ****p ≤ 0.0001. Bradykinin- and PMA-induced phosphorylation of Pyk2 on Y402 and Y579 and of Src on Y416, all of which were blocked by PF-431396 and PP2 but not the inactive PP3. Panel A was created using Biorender.com.
-
Figure 8—source data 1
Original files of the full raw unedited blots with bands labeled in red boxes.
- https://cdn.elifesciences.org/articles/79648/elife-79648-fig8-data1-v2.zip
Figure 9
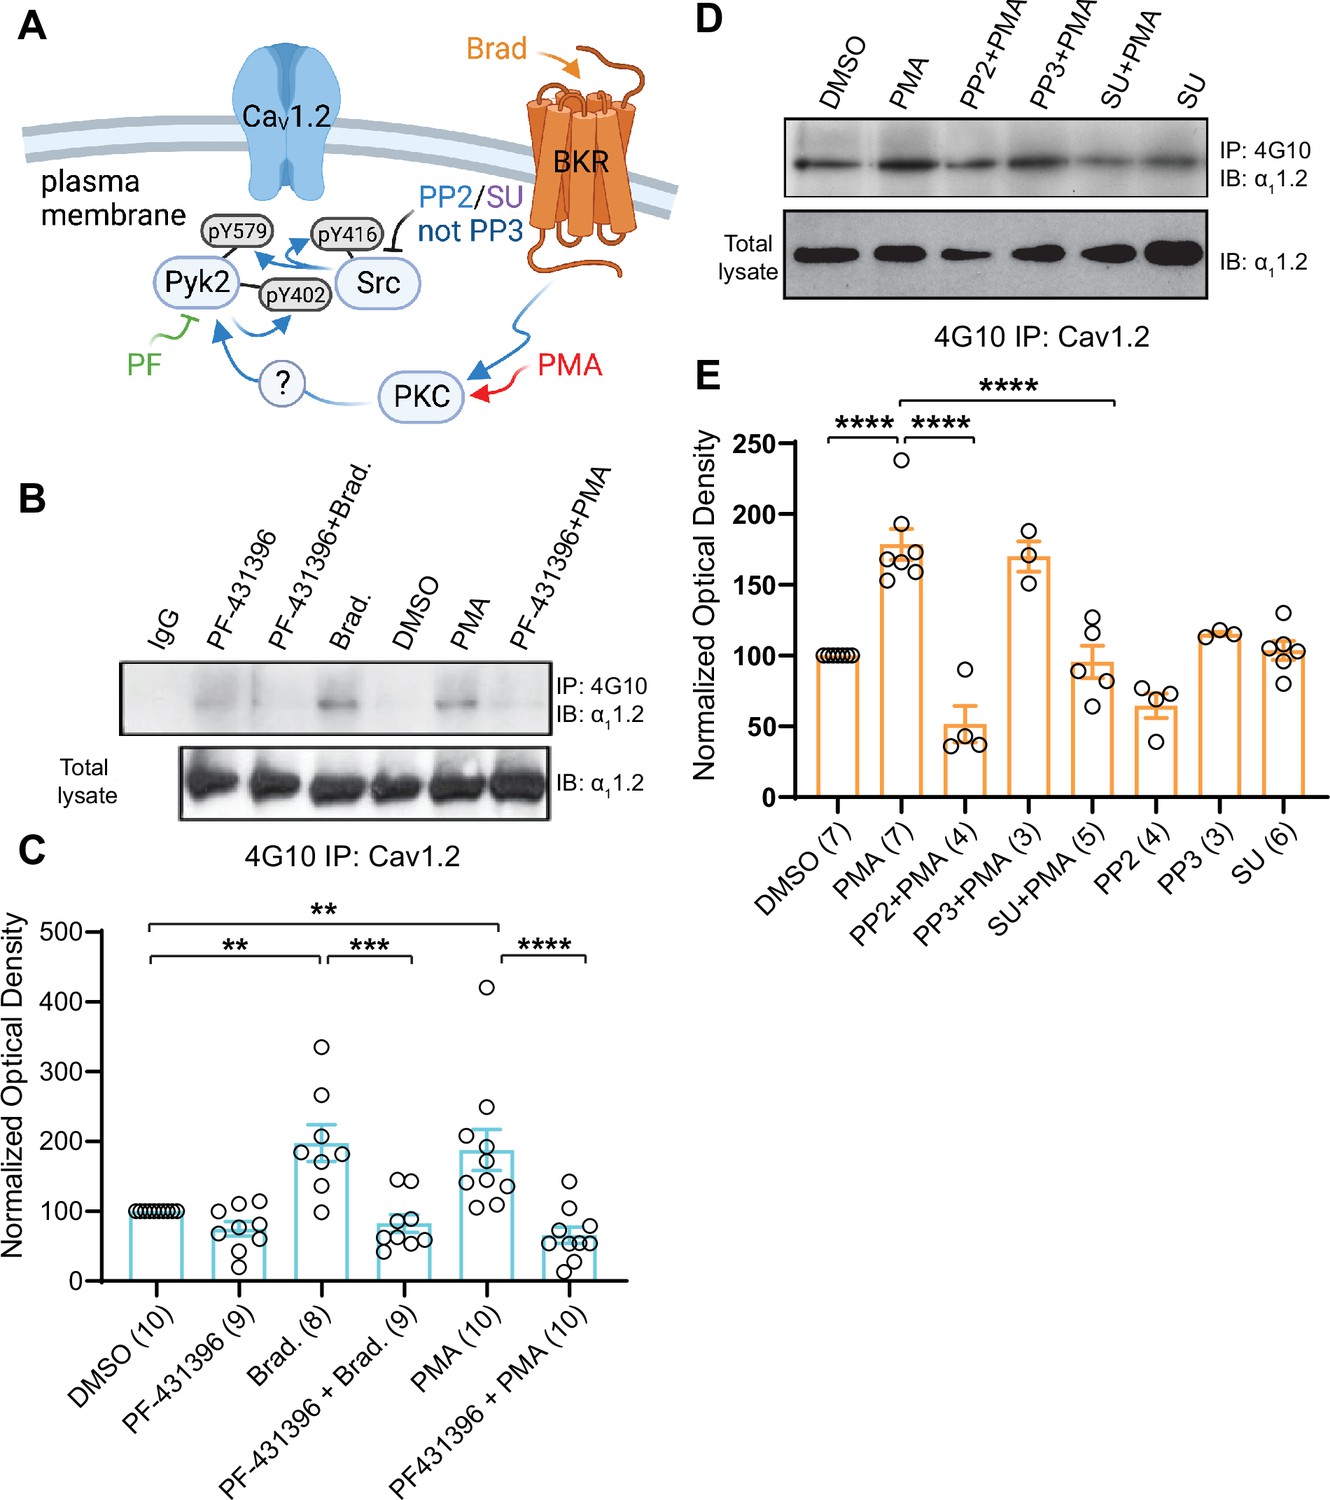
Increase in α11.2 tyrosine phosphorylation by PKC is blocked by inhibitors or Pyk2 and Src. PC12 cells were treated as in Figure 8 for analysis of tyrosine phosphorylation by immunoprecipitation (IP) with 4G10 and immunoblotting (IB) with anti-α11.2.
IgG indicates control IP with non-immune mouse IgG. Vehicle (0.02% DMSO), PF-431396 (3 μM), PP2 (10 μM), PP3 (10 μM), or SU6656 (SU, 10 μM) were applied 5 min before phorbol-12-myristate-13-acetate (PMA) or bradykinin (Brad.) when indicated. (A) Schematic diagram depicting the bradykinin receptor–PKC–Pyk2/Src–CaV1.2 signaling cascade and drugs used to target each molecular entity. (B, D) Upper panels: pY of α11.2 determined by 4G10 IP and α11.2 IB. Lower panels: Levels of total α11.2 detected with anti-α11.2 in corresponding lysates. (C, E) Ratios of pY signals in 4G10 IPs by IB with anti-α11.2 to α11.2 signals in lysates, normalized to control. Data are presented as mean ± standard error of the mean (SEM). Number (n) of independent experiments for each condition are indicated inside bars. Statistical analysis was by analysis of variance (ANOVA) with post hoc Bonferroni’s multiple comparisons test. (C) F5,50 = 10.65. DMSO vs. Brad., p = 0.0021; DMSO vs. PMA, p = 0.0036; Brad. vs. PF-431396 + Brad., p = 0.0003; PMA vs. PF-431396 + PMA, p < 0.0001. (E) F7,31 = 23.67. DMSO vs. PMA, p < 0.0001; PMA vs. PP2 + PMA, p < 0.0001; PMA vs. SU + PMA, p < 0.0001 (**p ≤ 0.01, ***p ≤ 0.001, ****p ≤ 0.0001). Bradykinin- and PMA-induced α11.2 tyrosine phosphorylation was blocked by PF-431396, SU6656 and PP2 but not the inactive PP3. Panel A was created using Biorender.com.
-
Figure 9—source data 1
Original files of the full raw unedited blots with bands labeled in red boxes.
- https://cdn.elifesciences.org/articles/79648/elife-79648-fig9-data1-v2.zip
Figure 10
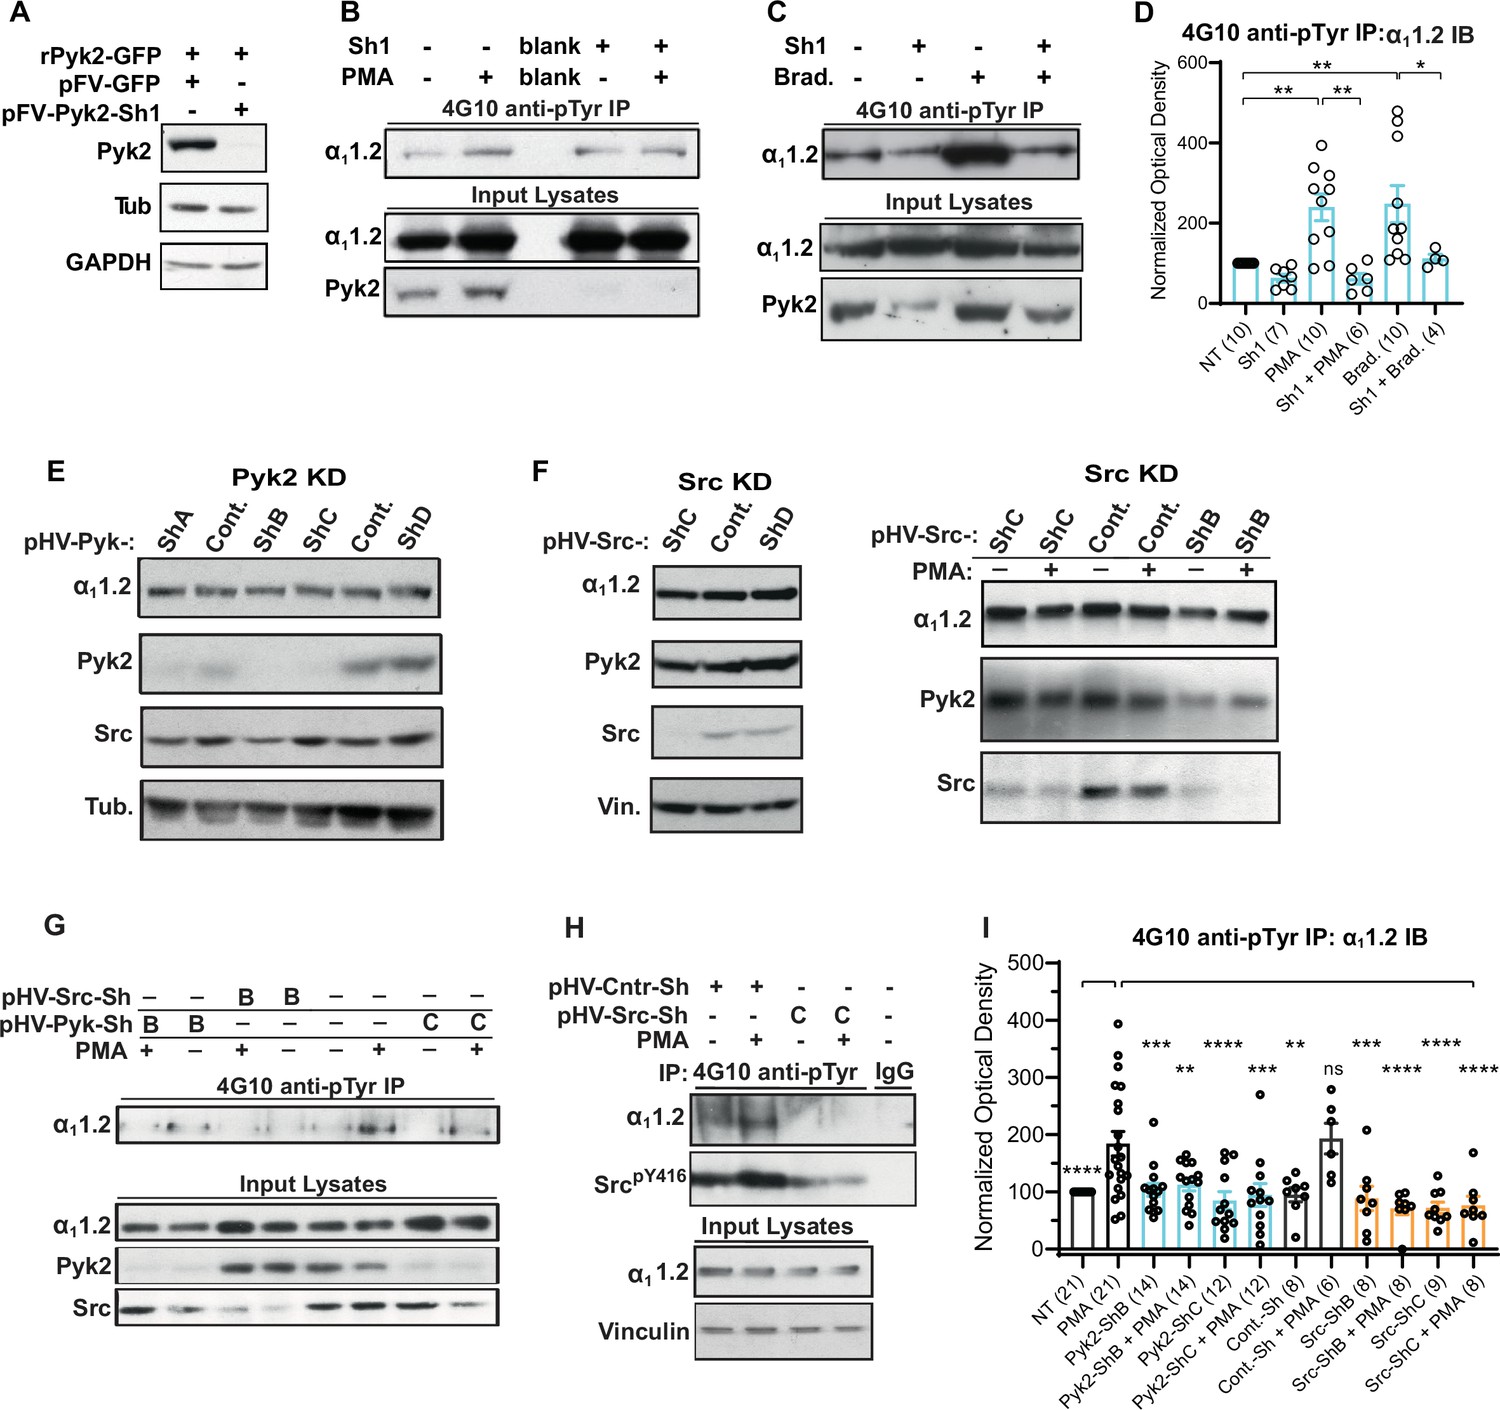
Increase in α11.2 tyrosine phosphorylation by PKC is blocked by knockdown of Pyk2 and Src.
(A) Lysates from HEK293T/17 cells transfected with vectors encoding rat Pyk2 (rPyk2-GFP) and either the Pyk2-targeting FIV lentivirus-derived, pVETL-Sh1-GFP (pFV-Pyk2-Sh1) or control (empty) pVETL-GFP (pFV-GFP) expression vectors, were immunoblotted (IB) with indicated antibodies. (B, C) IB analysis of indicated proteins in PC12 cultures incubated with viral particles containing pFV-Sh1-GFP (Sh1) FIV-based expression vector used in A or medium vehicle alone for 72 hr prior to treatment with either phorbol-12-myristate-13-acetate (PMA, B), bradykinin (Brad.; C), or vehicle alone (−; B, C). Upper blots in B and C show anti-α11.2 IBs of 4G10-anti-phosphotyrosine (pY) immunoprecipitation (IP) while middle and lower blots show direct IBs of indicated protein levels in input lysates. (D) Statistical analysis of the relative pY α11.2 levels. F5,41 = 8.276. NT vs. PMA, p = 0.0031; NT vs. Brad., p = 0.0017; PMA vs. Sh1 + PMA, p = 0.001; Brad vs. Sh1 + Brad, p = 0.0433. (E, F) Direct IB analysis of indicated proteins in lysates of PC12 cultures transduced with HIV vector-derived lentiviral particles (e.g., pGFP-Pyk2-ShB-Lenti) containing expression cassettes for GFP and either the Pyk2-targeting (denoted pHV-Pyk-ShB and -ShC), Src-targeting (denoted pHV-Src-ShC and -ShD), or scrambled hairpin control (Cont.) shRNAs. In some cases (right blot in F) cultures were treated with PMA (+) or vehicle alone (−) before harvesting for IB. (G, H) IB analysis of indicated proteins from PC12 cultures infected with lentiviral particles containing HIV-GFP expression vectors as in E and F prior to treatment with either PMA (+) or vehicle (−). Upper panels show anti-α11.2 IBs of 4G10-anti-pY IP while lower blots show direct IBs of input lysates with indicated antibodies. (I) Statistical analysis of relative α11.2 pY levels. F11,129 = 6.180. NT vs. PMA, p < 0.0001; PMA vs. Pyk2-ShB, p = 0.0005; PMA vs. Pyk2-ShB + PMA, p = 0.0029; PMA vs. Pyk2-ShC, p < 0.0001; PMA vs. Pyk2-ShC + PMA, p = 0.0002; PMA vs. Cont.-Sh, p = 0.0019; PMA vs. Cont.-Sh + PMA, p > 0.9999; PMA vs. Src-ShB, p = 0.0007; PMA vs. Src-ShB + PMA, p < 0.0001; PMA vs. Src-ShC, p < 0.0001; PMA vs. Src-ShC + PMA, p < 0.0001. The bar graphs in (D) and (I) show ratios of quantified anti-α11.2 IB signals in 4G10 IPs relative to α11.2 IB signals in total lysates, normalized to not treated (NT) control. Comparisons are made between samples treated with PMA (or bradykinin in D) and each of the other indicated conditions. Data are presented as mean ± standard error of the mean (SEM). Number (n) of independent experiments for each condition are indicated inside bars. Statistical analysis by analysis of variance (ANOVA) with post hoc Bonferroni’s multiple comparisons test (ns = not significant vs. PMA, *p ≤ 0.05, **p ≤ 0.01, ***p ≤ 0.001, ****p ≤ 0.0001).
-
Figure 10—source data 1
Original files of the full raw unedited blots with bands labeled in red boxes.
- https://cdn.elifesciences.org/articles/79648/elife-79648-fig10-data1-v2.zip
Figure 11
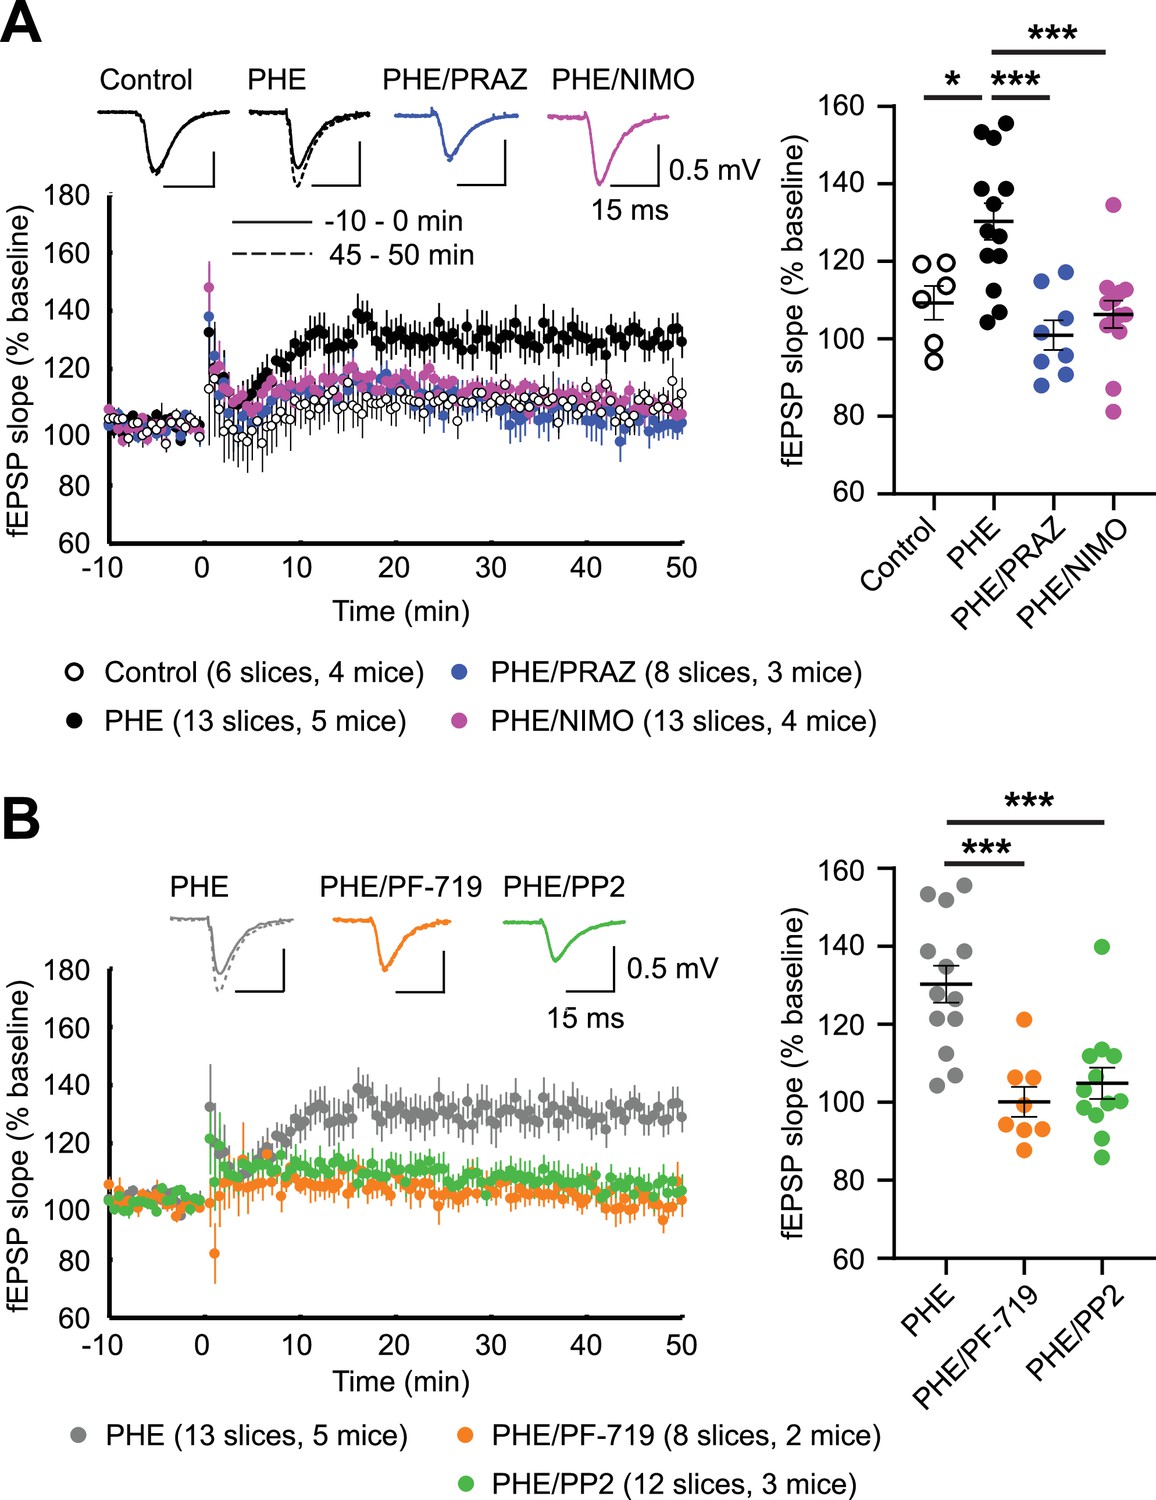
α1AR signaling augments LTPLTCC through L-type Ca2+ channel (LTCC) activity, Pyk2, and Src.
LTPLTCC was induced by four 200 Hz tetani, each 0.5 s long, in the CA3 Schaffer collateral projections to CA1 in acute hippocampal slices from 13- to 20-week-old mice. (A) LTPLTCC required phenylephrine (PHE; 10 μM) and was prevented by the LTCC blocker nimodipine (10 μM; NIMO) and the α1AR antagonist prazosin (1 μM; PRAZ). F3,36 = 9.937. Control vs. PHE, p = 0.012; PHE vs. PHE/PRAZ, p = 0.0001; PHE vs. PHE/NIMO, p = 0.0003. (B) PHE-mediated long-term potentiation (LTP) is blocked by inhibitors of Pyk2 (1 μM PF-719) and Src (10 μM PP2). F2,30 = 13.90. PHE vs. PHE/PF-719, p = 0.0002; PHE vs. PHE/PP2, p = 0.0003. Dot plots on the right show potentiation of field excitatory postsynaptic potentials (fEPSPs) determined as the averages of all responses between 45 and 50 min after high-frequency stimulation (HFS) as % of averages of all responses in the 5 min preceding HFS. Bars and whiskers represent means ± standard error of the mean (SEM; *p ≤ 0.05, ***p ≤ 0.001; one-way analysis of variance [ANOVA] with the Bonferroni correction). The number of slices and mice used is indicated.
Additional files
-
Supplementary file 1
Amino acid residues of fragments of intracellular loops of CaV1.2 α1-subunit used in GST pulldown studies.
- https://cdn.elifesciences.org/articles/79648/elife-79648-supp1-v2.docx
-
Supplementary file 2
Antibody dilutions used for immunoblotting.
- https://cdn.elifesciences.org/articles/79648/elife-79648-supp2-v2.docx
-
Supplementary file 3
shRNA sequences targeting rat Pyk2 and Src.
- https://cdn.elifesciences.org/articles/79648/elife-79648-supp3-v2.docx
-
Supplementary file 4
Sequencing primers for validation of knockdown constructs.
- https://cdn.elifesciences.org/articles/79648/elife-79648-supp4-v2.docx
-
MDAR checklist
- https://cdn.elifesciences.org/articles/79648/elife-79648-mdarchecklist1-v2.pdf
Download links
A two-part list of links to download the article, or parts of the article, in various formats.
Downloads (link to download the article as PDF)
Open citations (links to open the citations from this article in various online reference manager services)
Cite this article (links to download the citations from this article in formats compatible with various reference manager tools)
α1-Adrenergic receptor–PKC–Pyk2–Src signaling boosts L-type Ca2+ channel CaV1.2 activity and long-term potentiation in rodents
eLife 12:e79648.
https://doi.org/10.7554/eLife.79648


