Identification of putative enhancer-like elements predicts regulatory networks active in planarian adult stem cells
- Department of Zoology, University of Oxford, United Kingdom
- Living Systems Institute, University of Exeter, United Kingdom
Figures
Figure 1 with 1 supplement
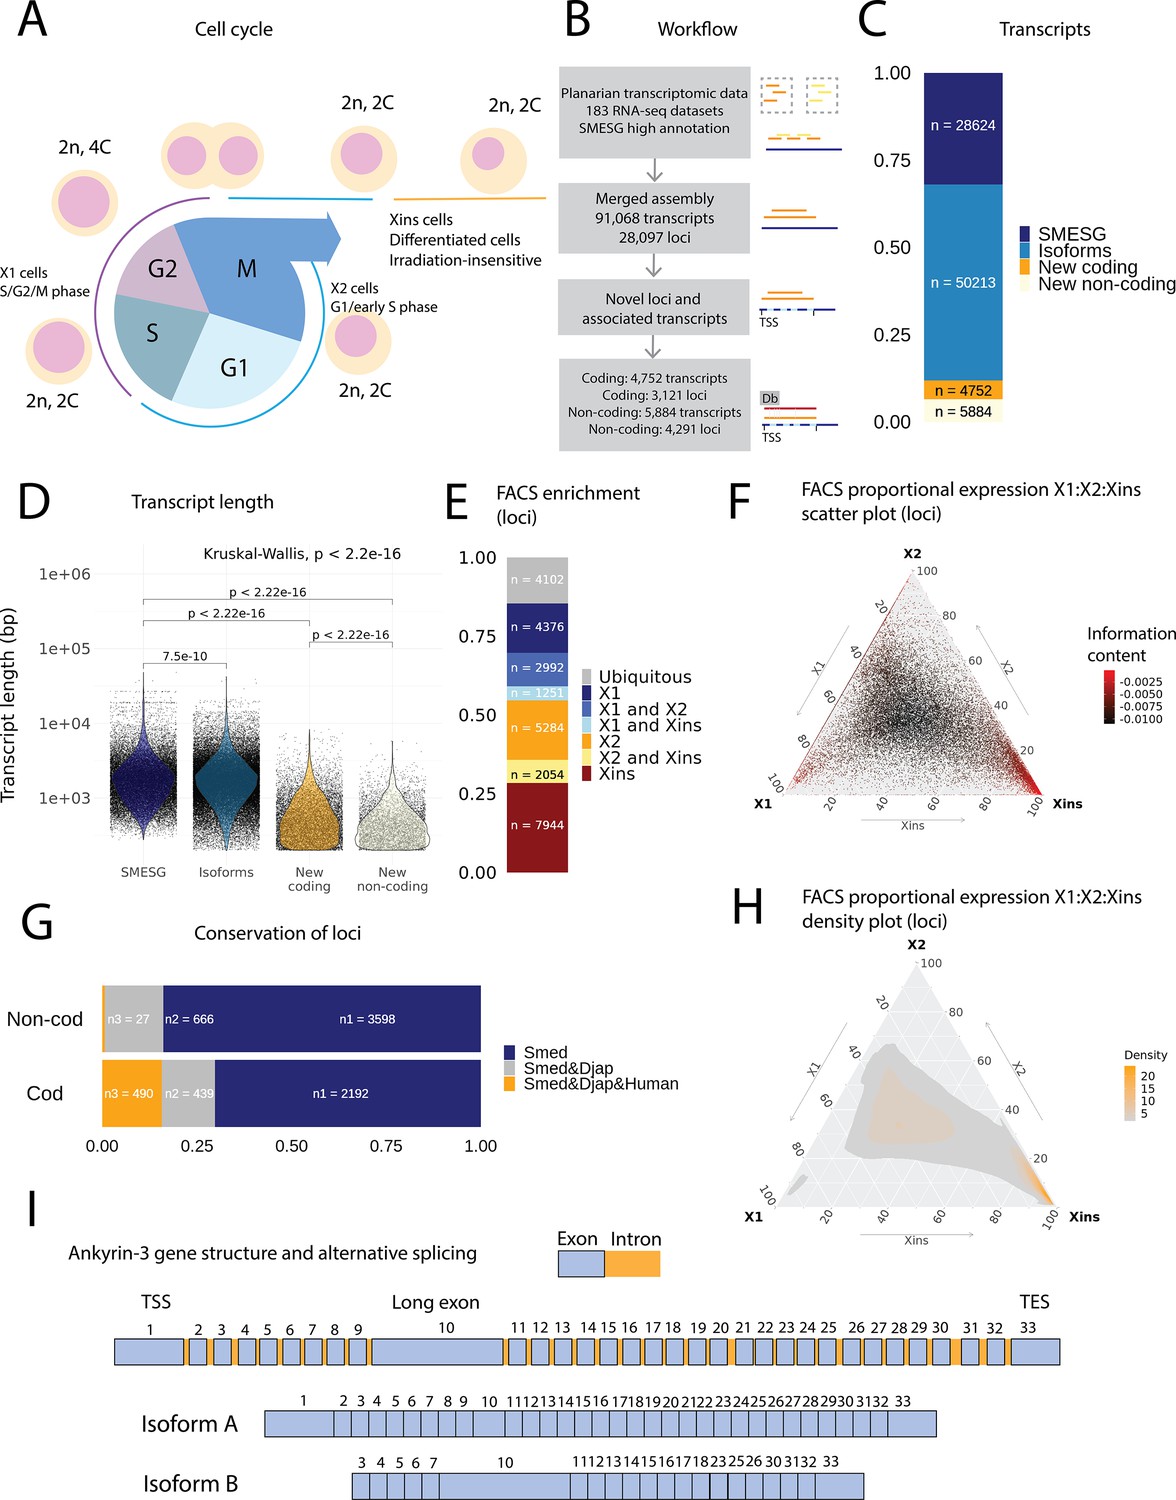
An expression-driven genome annotation of Schmidtea mediterranea.
(A) Diagram of the planarian neoblast cell cycle illustrating how the fluorescence-activated cell sorting (FACS) cell compartments X1, X2, and Xins relate to different cell-cycle phases. (B) Overview of methodology for annotating the S. mediterranea genome and identifying novel coding and non-coding transcripts. In total, 183 RNA-seq datasets were aligned to the SMESG.1 genome (Planmine). Novel transcripts were assembled by using the SMESG-high-confidence annotation as a reference (Planmine). (C) The proportion of transcript identities in the new annotation. ‘SMESG’ are transcripts present in the known SMESG high-confidence annotation, ‘Isoforms’ are transcripts that are isoforms or splicing variants of known transcripts in the SMESG high-confidence annotation, and ‘New coding’ and ‘New non-coding’ are previously unknown transcripts deemed to have coding and non-coding potential, respectively. (D) The transcript lengths of known transcripts (SMESG, n = 28624), isoforms (n = 50213), new coding transcripts (n = 4752), and new non-coding transcripts (n=5884). Kruskal-Wallis test is used to compare all groups and Wilcoxon rank-sum test is used for pairwise comparisons. (E) FACS categorization of 28,003 total loci into enrichment groups (Dattani et al., 2018). The enrichment groups are X1 (X1 proportional expression ≥ 50%), X2 (X2 proportional expression ≥ 50%), Xins (Xins proportional expression ≥ 50%), X1 and X2 (X1 + X2 proportional expression ≥ 75%, neither enriched in X1 nor X2), X1 and Xins (X1 + Xins proportional expression ≥ 75%, neither enriched in X1 nor Xins), X2 and Xins (X2 + Xins proportional expression ≥ 75%, neither enriched in X2 nor Xins), and ubiquitous (loci not categorized into the enrichment groups above and with roughly equal proportion in all three groups). (F) Ternary plot of proportional expression values in the X1, X2, and Xins cell compartments. Each dot represents one single locus. The information content metric represents the enrichment of a locus to one of the three compartments, meaning that gray loci are unspecific while red loci are specific to a single compartment (see ‘Materials and methods’ for details). (G) Conservation of new coding and non-coding loci to loci in Dugesia japonica and humans. ‘Smed’ (n1) are loci exclusive to S. mediterranea, ‘Smed&Djap’ (n2) are loci with a homolog in D. japonica but not in humans, and ‘Smed&Djap&Human’ (n3) are loci with homologs both in D. japonica and humans. (H) Ternary plot of the density distribution of proportional expression values in the X1, X2, and Xins cell compartments. The plot gives a visual condensation of ternary plot F. The density distribution is estimated by two-dimensional kernel density estimation. (I) Schematic of the gene structure of ankyrin-3 and two example isoforms that are alternatively spliced (SMEST010564001.1.p1 and MSTRG.3975.46.p1). The detailed genomic track of all the isoforms is given in Figure 1—figure supplement 1F. TSS, transcriptional start site; TES, transcript end site.
Figure 1—figure supplement 1
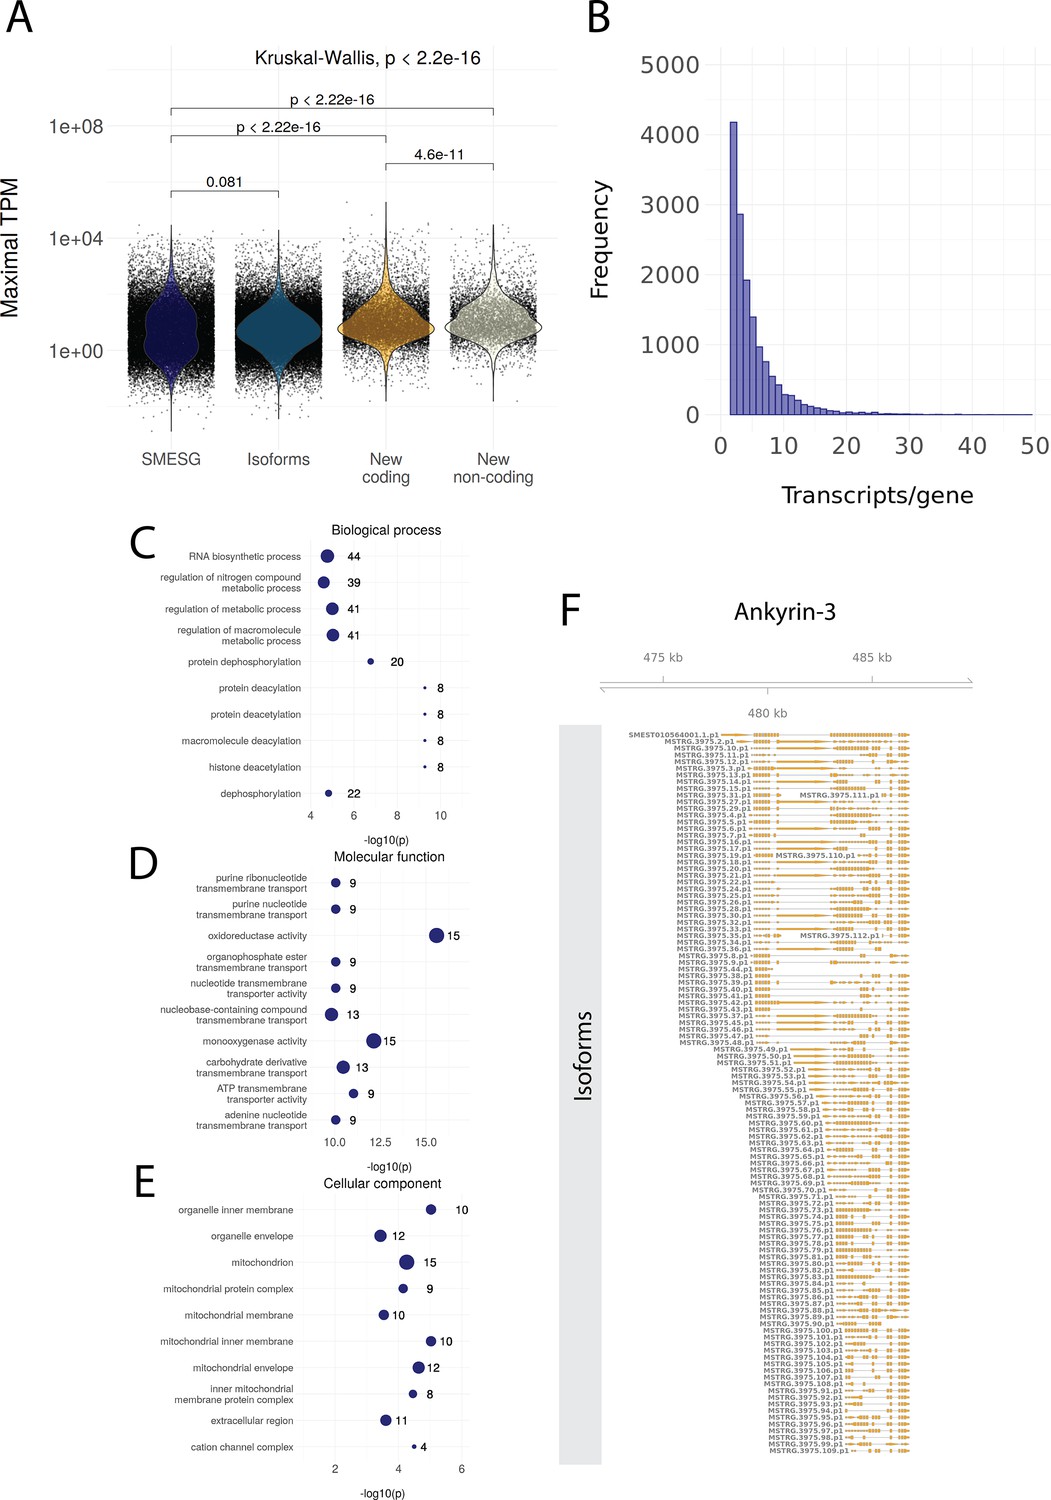
Information on the genome annotation of Schmidtea mediterranea.
(A) Maximal transcripts per kilobase million (TPM) of known transcripts (SMESG, n = 28624), isoforms (n = 50213), new coding transcripts (n = 4752), and new non-coding transcripts (n = 5884). Maximal TPM is defined as the highest TPM value in the 183 RNA-seq samples used for reannotation. Kruskal-Wallis test is used to compare all groups and Wilcoxon rank-sum test is used for pairwise comparisons. (B) The number of transcripts per gene (distribution up to 50 transcripts/gene). (C) The Gene Ontology (GO) terms for biological processes enriched in the new coding transcripts. (D) The GO terms for molecular functions enriched in the new coding transcripts. (E) The GO terms for cellular components enriched in the new coding transcripts. (F) All isoforms for ankyrin-3 (ankyrin-G).
Figure 2

Annotation of planarian transcription factors.
(A) Diagram of the transcription factor (TF) annotation process. The coding transcripts identified in the new genome annotation were screened for conserved TF structures by using Interproscan and the Pfam and SUPERFAMILY databases. Homologs were then searched for the TFs with BLAST, and the planarian literature was reviewed to assign screened TFs to previously described. The manually reviewed TF proteins were then used to predict motifs. (B–E) Identified TF families with basic domains (B), (C–E). ‘Old’ refers to TFs present in the literature, while ‘New’ are TFs without a reference in the literature or new additional homologs. (F) Ternary plot of proportional expression values in the X1, X2, and Xins cell compartments. Each dot represents one single TF. The information content metric represents the enrichment of a locus to one of the three compartments (see 'Materials and methods' for details). (G) Heatmap and hierarchical clustering of proportional fluorescence-activated cell sorting (FACS) expression profiles for all TFs. (H) Histogram of the total information content of the identified motifs. (I) Example sequence logos for some of the best characterized motifs. The motifs of pbx (MA0782.1) and prep (MA0783.1) have almost identical PWMs, but they are listed as separate motif entries in JASPAR.
Figure 3 with 1 supplement
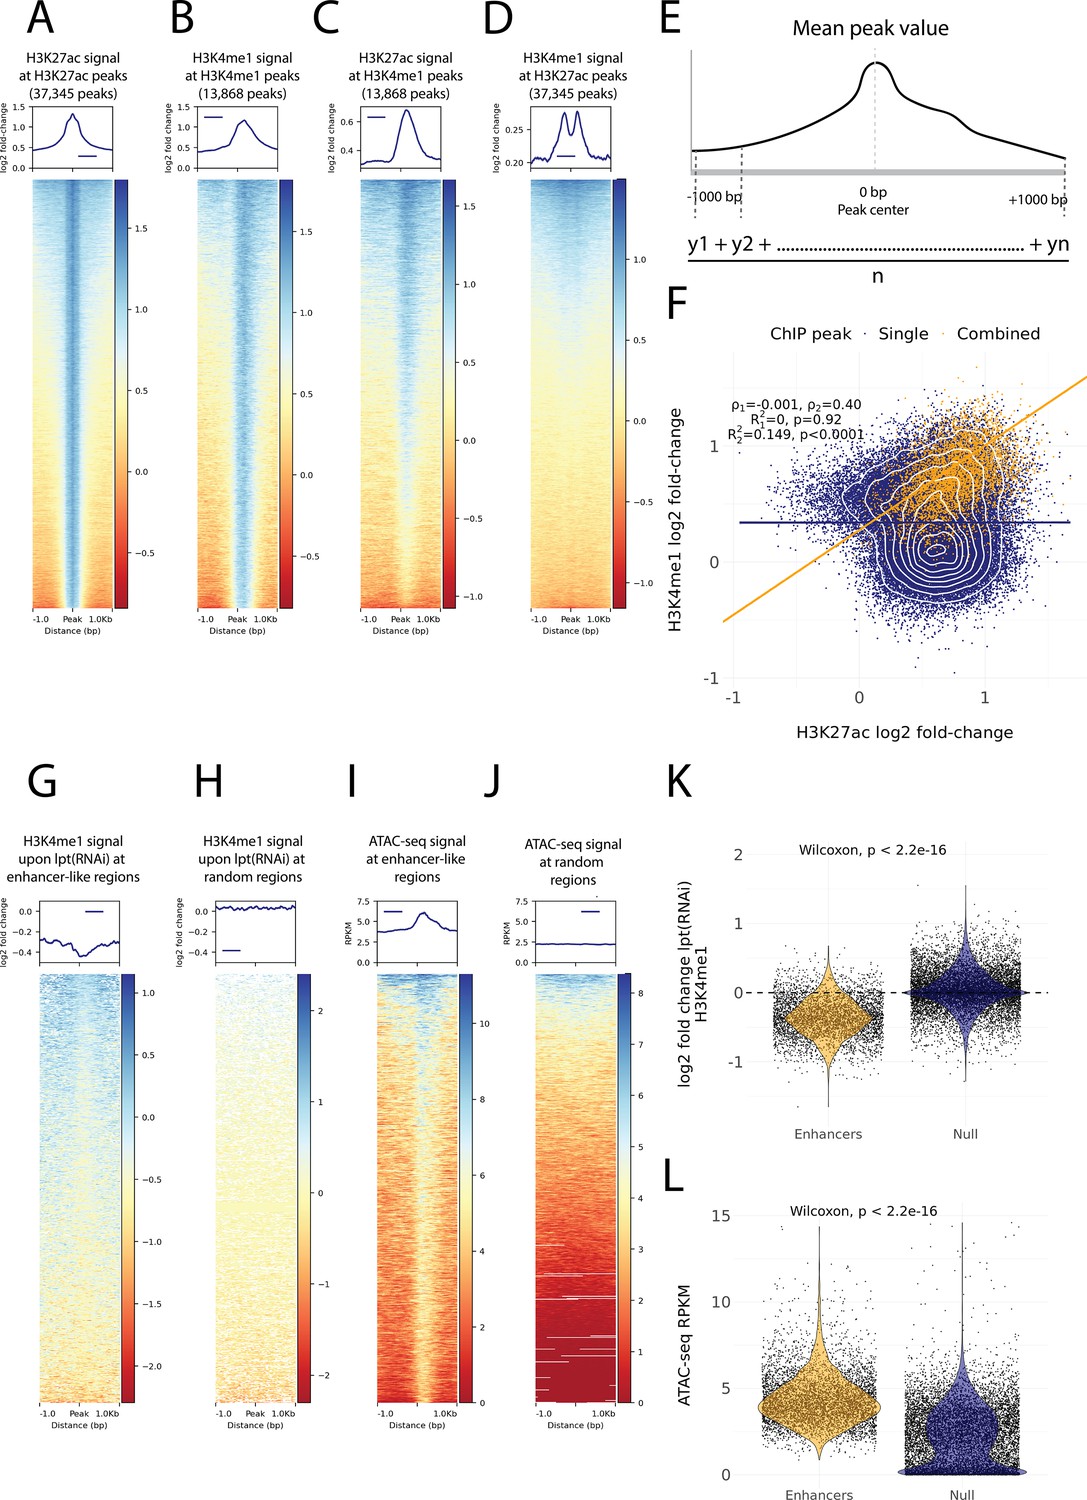
Histone modifications and chromatin accessibility of enhancer-like regions.
(A) H3K27ac ChIP-seq signal around independently called H3K27ac peaks. (B) H3K4me1 ChIP-seq signal around independently called H3K4me1 peaks. (C) H3K27ac signal around the same H3K4me1 peaks as in (B). The signal centers around the center region. (D) The H3K4me1 signal around the same H3K27ac peaks as in (A). The signal displays a bimodal shape around the center region. The signal of the y-axis and the heatmap in (A–D) is given as the log2 fold-change relative to the input and the peak width is 2000 bp. (E) A visual diagram of the calculation of the mean peak value. Mean peak value is defined as the mean of signal values taken at an interval of 10 bp from 1000 bp upstream to 1000 bp downstream of the peak center. (F) Scatter plot of H3K27ac and H3K4me1 log2 fold-change mean peak values at the ChIP-seq peaks. H3K4me1 peaks that are at most 500 bp from a H3K27ac peak are defined as combined peaks and putative enhancer-like regions (model 2, orange), while the non-overlapping H3K4me1 and H3K27ac peaks are referred to as single peaks (model 1, navyblue). (G) The change in the H3K4me1 signal upon lpt (mll3/4) RNAi at the combined peaks or putative enhancer-like regions. The change is strongest at the peak center. The log2 fold-change is calculated as the RNAi value relative to the wildtype value. (H) The H3K4me1 lpt(RNAi) signal at 10,000 random regions in the genome. (I) The ATAC-seq signal at the combined peaks or putative enhancer-like regions. The signal is given as reads per kilo base per million mapped reads (RPKM) (J) The ATAC-seq signal at 10,000 random regions in the genome. (K) Violin plot of H3K4me1 lpt(RNAi) signal at putative enhancer-like regions (n = 5529) and random regions (n = 10,000) in the genome. The H3K4me1 signal is reduced at enhancers. Wilcoxon rank-sum test is used for pairwise comparisons. (L) Violin plot of the ATAC-seq signal at putative enhancer-like regions (n = 5529) and random regions (n = 10,000) in the genome. The ATAC-seq signal is higher at enhancers. Wilcoxon rank-sum test is used for pairwise comparisons.
Figure 3—figure supplement 1
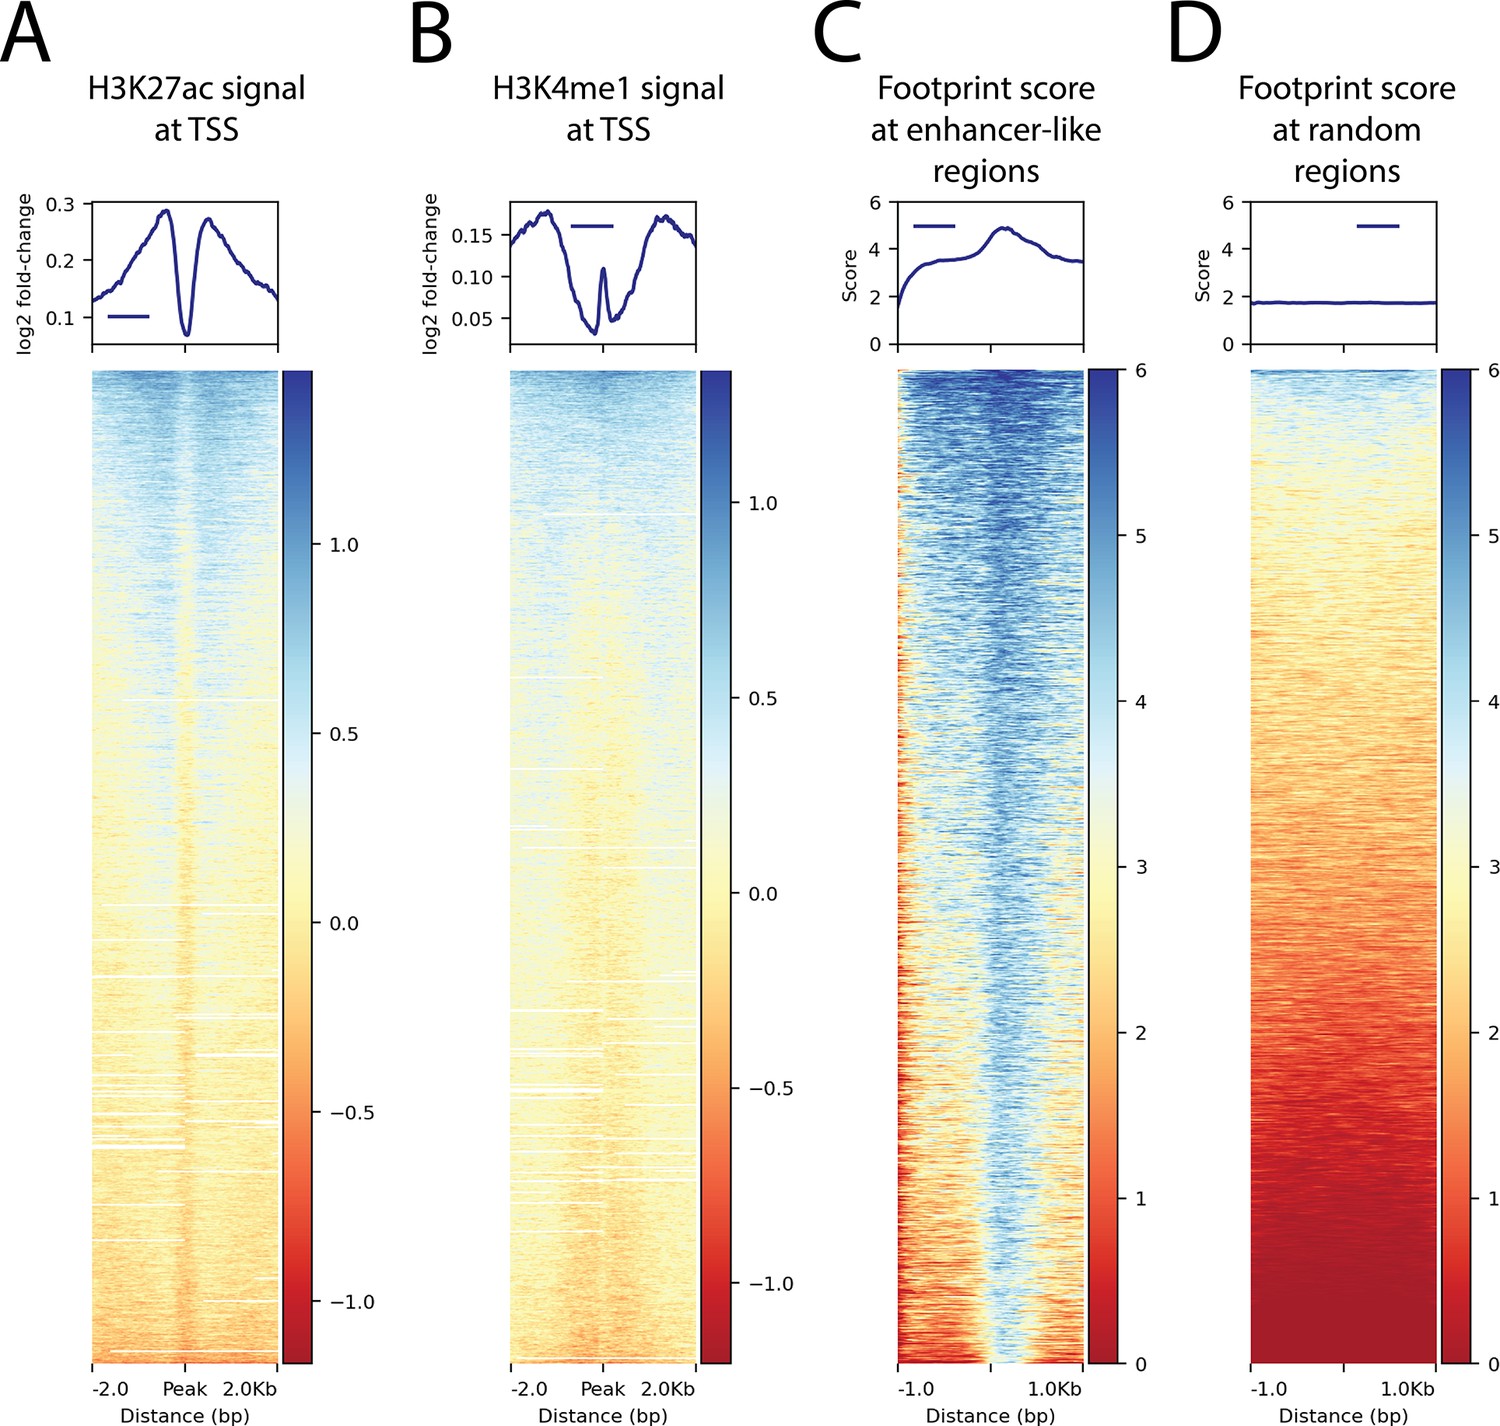
Histone modifications at transcription start sites and footprinting scores in relation to enhancer-like regions.
(A) H3K27ac ChIP-seq signal around transcription start sites (TSS) (B) H3K4me1 ChIP-seq signal around TSS. (C) The ATAC-seq footprint score at the combined peaks or putative enhancer-like regions. (D) The ATAC-seq footprint score at 10,000 random regions in the genome.
Figure 4 with 1 supplement
Predicted gene regulatory networks involving fate-specific transcription factors in neoblasts.
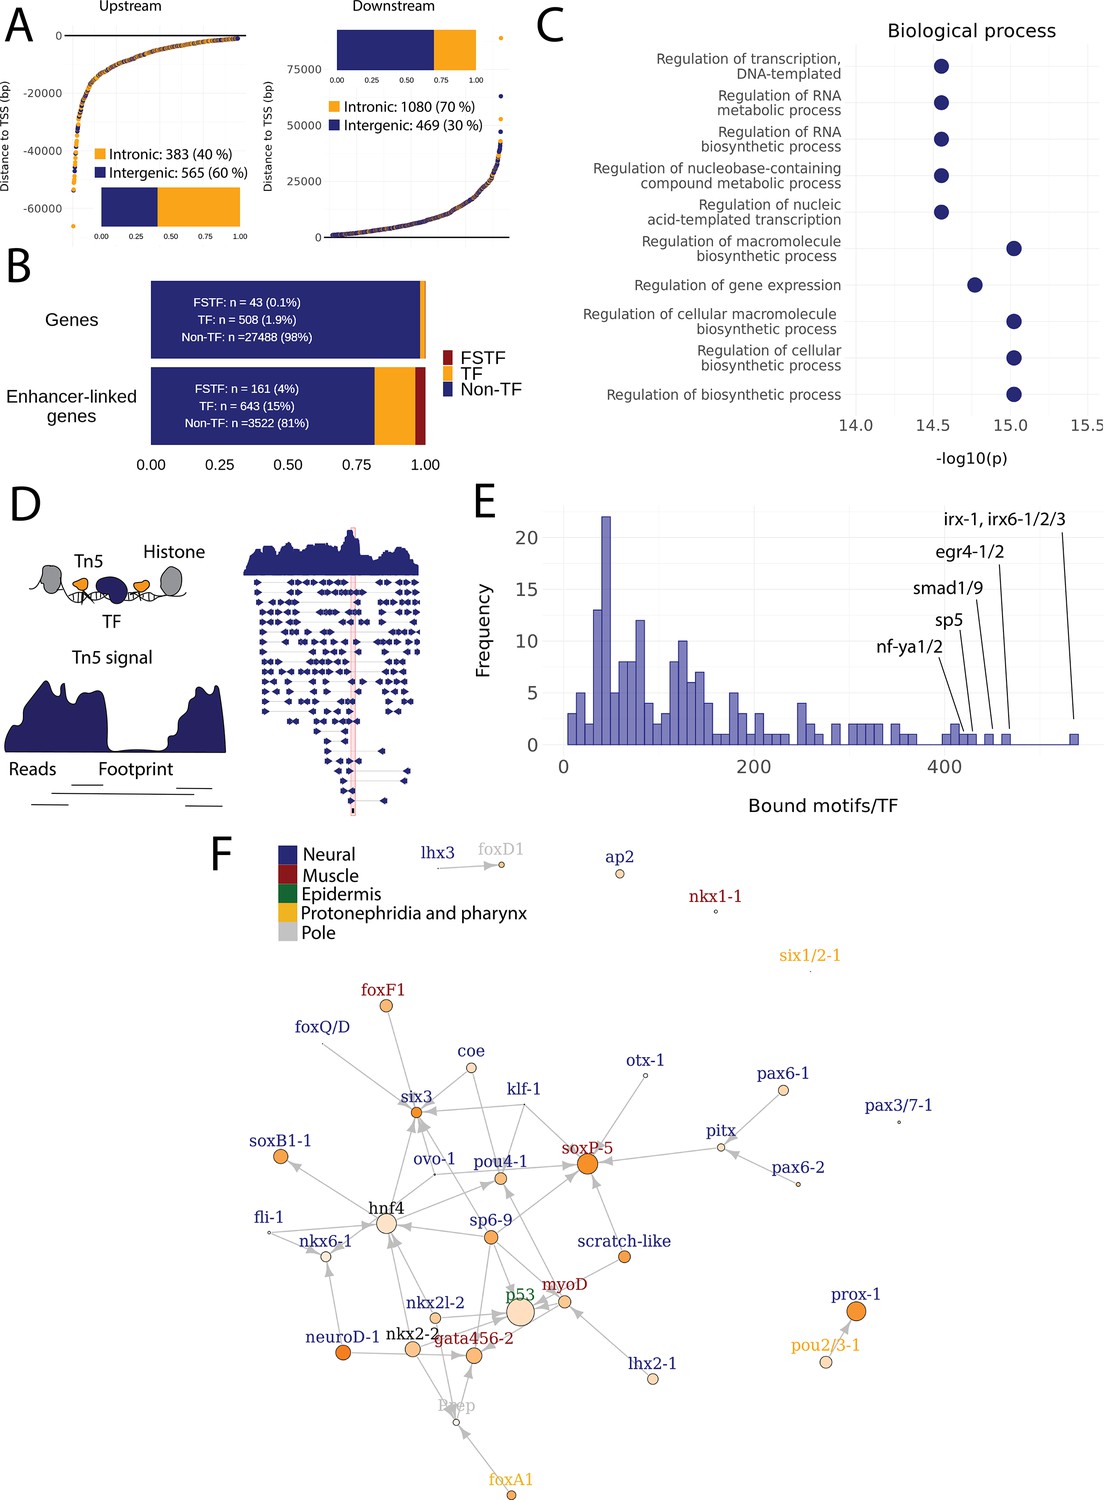
(A) Distance of enhancer-like regions to the transcription start site (TSS) of nearest genes. The nearest genes are assumed to be the putative target genes of the enhancer-like regions. (B) The proportion of fate-specific transcription factors (FSTFs), transcription factors (TFs), and non-TF genes of all planarian genes and of the target genes linked to enhancer-like regions. FSTFs and TFs are enriched in the set of target genes (χ2 = 2660, p<0.001). (C) Gene Ontology (GO) analysis of biological processes of enhancer-linked target genes compared to all genes in the planarian genome. (D) Schematic overview of ATAC-seq footprinting (Bentsen et al., 2020). Both the tagmenting enzyme Tn5 and TF bind to accessible regions of the genome. Footprints are short and sharp inaccessible segments in otherwise accessible regions. The genomic track figure represents an example of ATAC-seq reads and footprint score overlapping with an sp5 motif in the genome. (E) Histogram of the total number of bound motifs in the genome for each TF. The TFs with most bound motifs in the genome are marked. (F) Putative gene regulatory network (GRN) of FSTFs in neoblasts. The epidermal FSTFs are labeled in green, the pole-associated FSTFs are labeled in gray, the muscle FSTFs are labeled in red, the intestinal FSTFs are labeled in black, and the neural FSTFs are labeled in blue. The size of the nodes reflects the absolute expression in X1 cells (transcripts per million reads [TPM]), and the color of the node reflects the proportional expression in X1 cells (the more orange, the higher proportional expression). The arrows represent a regulatory link but do not discriminate between positive and negative interactions.
Figure 4—figure supplement 1
Distance of bound transcription factor footprints to transcriptional start sites.
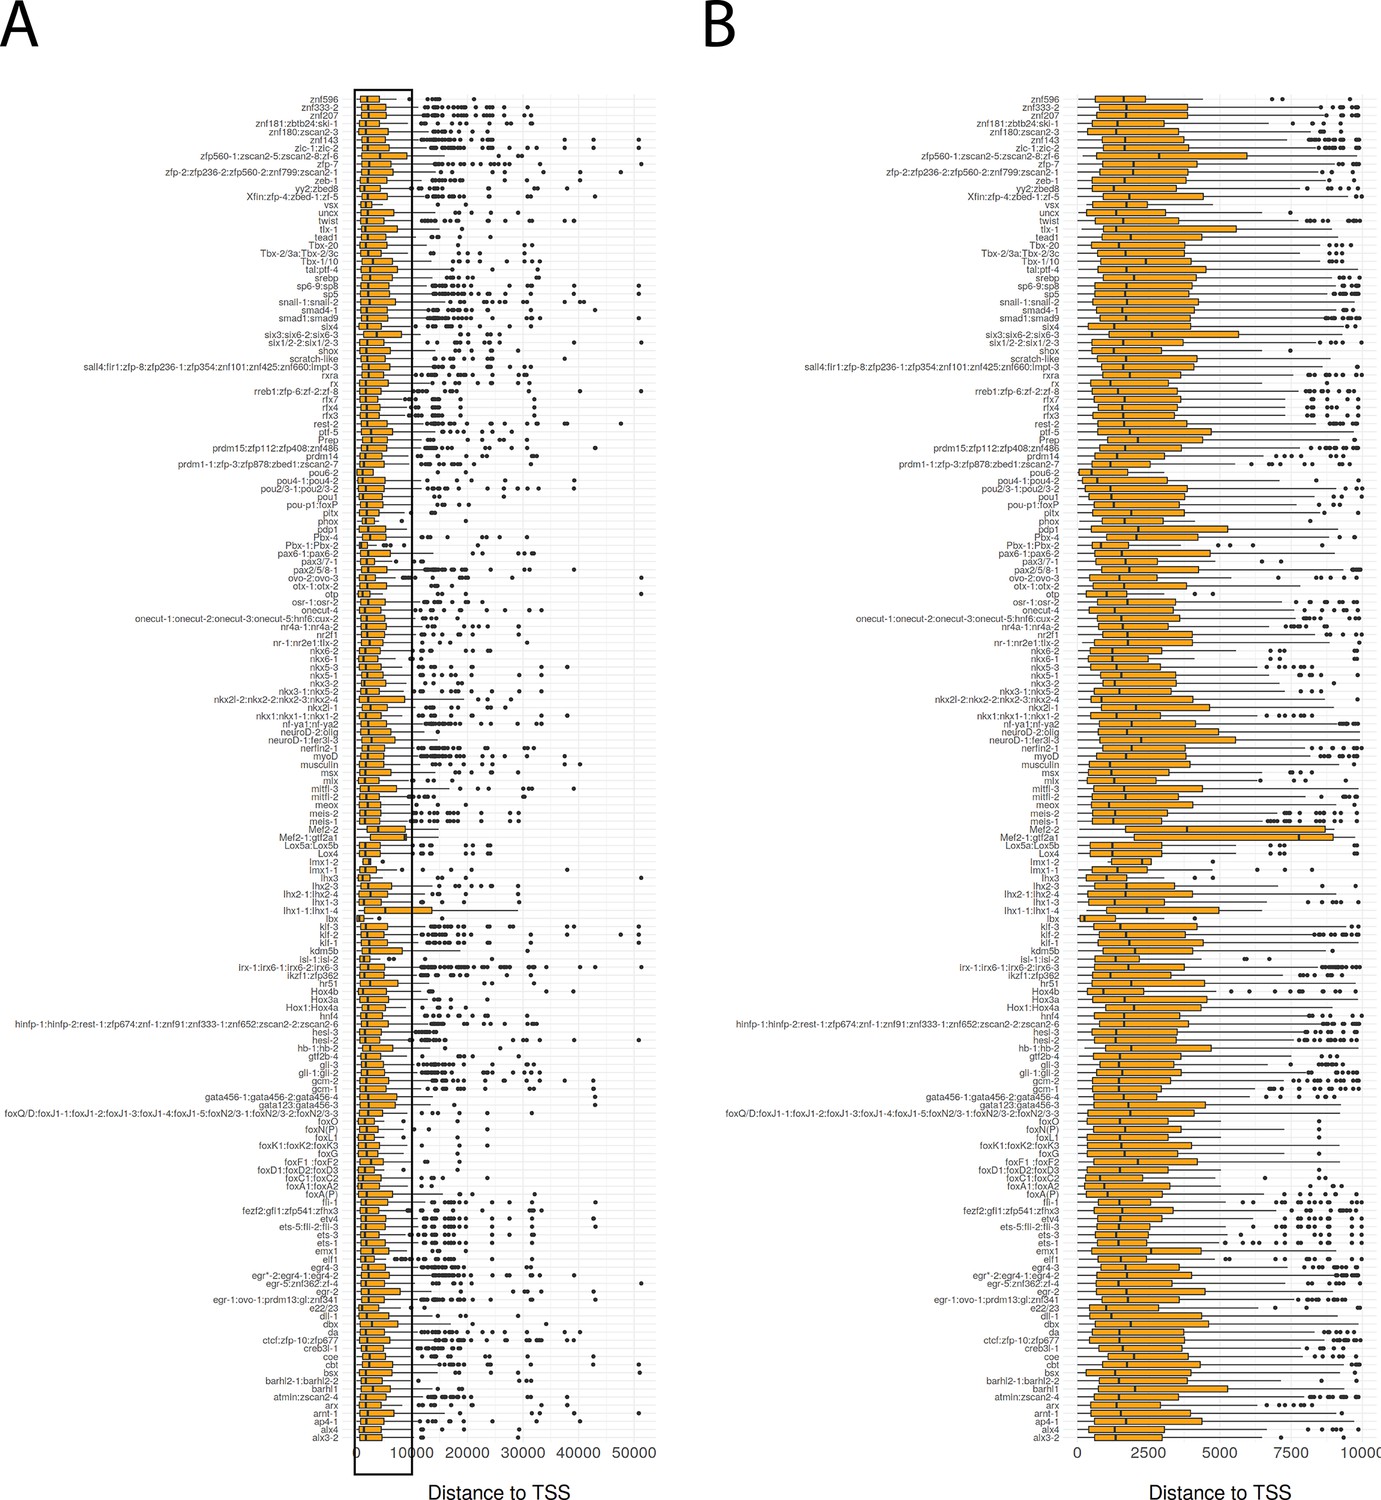
Boxplot of distance to transcriptional start site (TSS) for bound transcription factor footprints. Transcription factors predicted to have the same motif are grouped together. (B) Detailed view of (A) for distances from 0 bp to 10,000 bp.
Figure 5

The genomic tracks of four fate-specific transcription factors (FSTFs) (A–D).
The first track is the H3K27ac signal (log2 scale compared to the input sample), the second track is H3K4me1 signal (log2 scale compared to the input sample), the third track is the ATAC-seq footprint score (TOBIAS footprint score), the fourth track represents bound motifs in an enhancer-like region (as predicted by TOBIAS), the fifth track represents the transcripts of the gene in the new annotation, and the sixth track represents the gene expression level of the gene in X1 cells (RNA-seq fragments per kilobase of transcript per million [FPKM] mapped reads). (A) Genomic track of the epidermal FSTF p53. The promoter region marked in red (width 1000 bp) has multiple bound motifs. (B) Genomic track of the muscle FSTF myoD. An enhancer-like region marked in red (width 1000 bp) is located in the intron of the gene YTH domain containing 2 (ythdc23). The enhancer-like region is closer to the myoD promoter than the ythdc23 promoter and ythdc23 is not expressed almost at all in neoblasts, and hence the enhancer-like region is likely linked to myoD rather than ythdc2. (C) The neural FSTF nkx6-1 has a distal enhancer-like region marked in red (width 1000 bp) downstream of the gene body. (D) The neural FSTF soxB1-1 has a distal enhancer-like region marked in red (width 1000 bp) upstream of the gene body.
Figure 6
Enhancer-like regulatory regions in relation to unstudied planarian transcription factors.
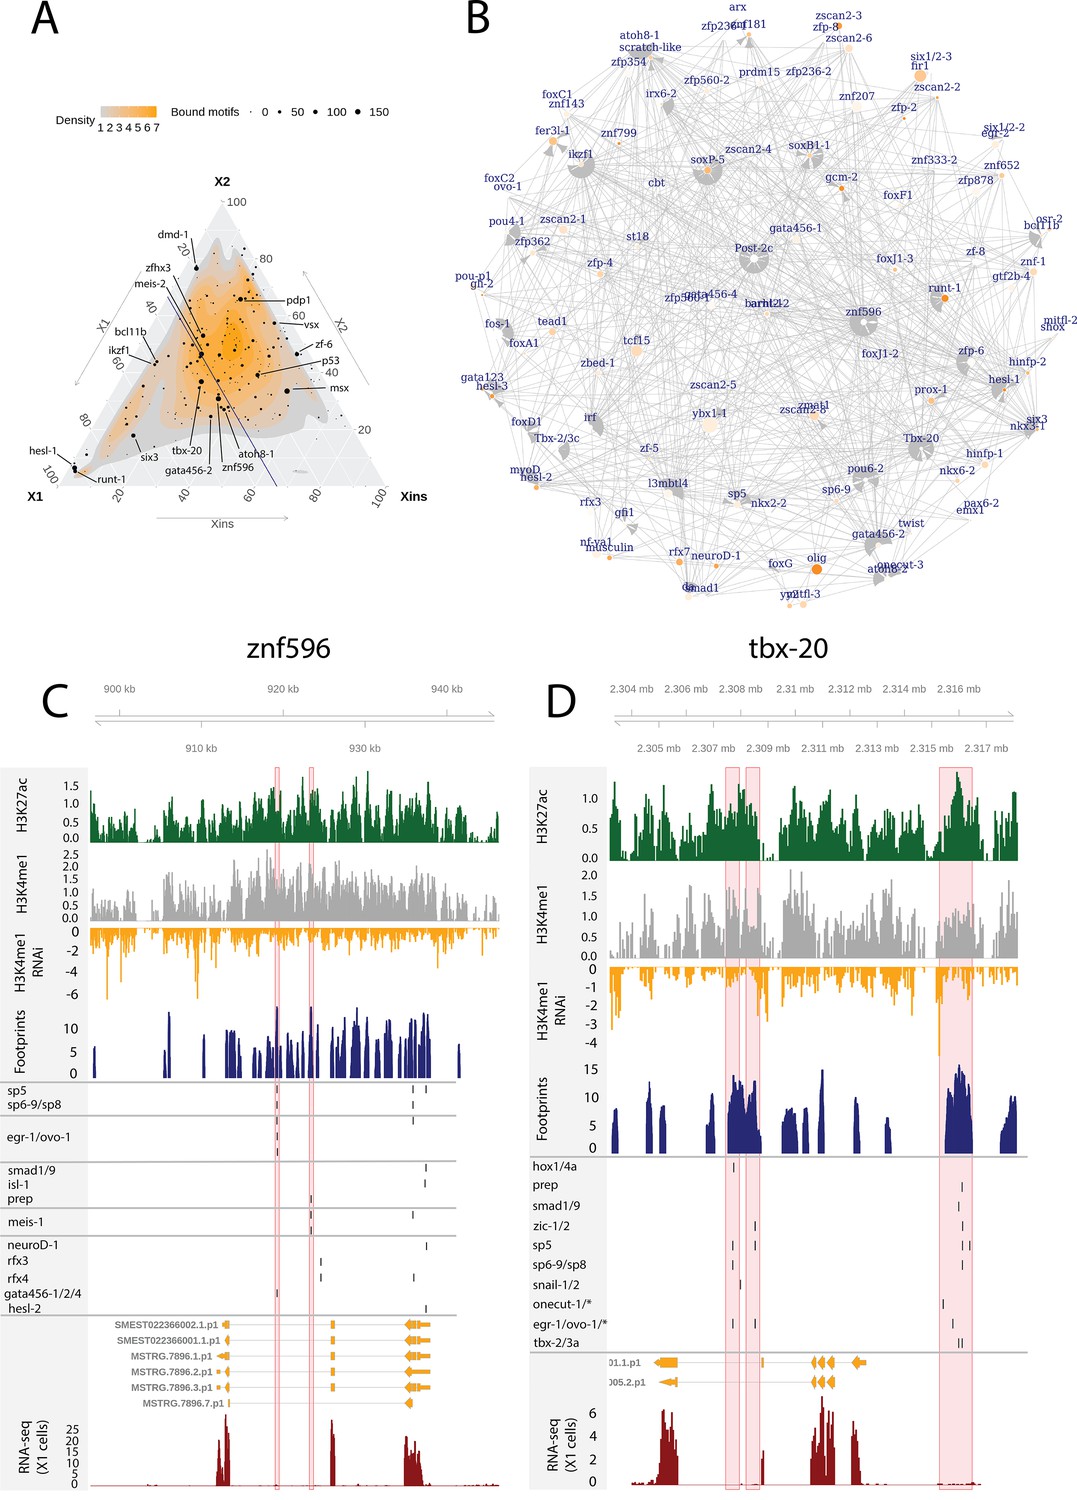
(A) Ternary plot of the proportional expression of all transcription factors (TFs) in the cell compartments (X1, X2, and Xins), and the number of bound motifs linked to the TFs. The size of the dot represents the number of bound motifs. The TFs with most bound motifs in enhancer-like regions are named and marked. (B) The putative gene regulatory network (GRN) of all TFs in the X1 compartment. The GRN includes all TFs with an X1 proportional expression higher than 1/3. The size of the nodes reflects the absolute expression in X1 cells (transcripts per million reads [TPM]), and the color of the node reflects the proportional expression in X1 cells (the more orange, the higher proportional expression). The genomic tracks of znf596 (C) and tbx-20 (D). The first track is the H3K27ac signal (log2 scale compared to the input sample), the second track is H3K4me1 signal (log2 scale compared to the input sample), the third track is the log2 fold-change upon lpt(RNAi), the fourth track is ATAC-seq footprint score (TOBIAS footprint score), the fifth track represents bound motifs in an enhancer-like region (as predicted by TOBIAS), the sixth track represents the transcripts of the gene in the new annotation, and the seventh track represents the gene expression level of the gene in X1 cells (RNA-seq fragments per kilobase of transcript per million [ FPKM] mapped reads). (C) Genomic track of znf596. Two intronic enhancer-like regions are marked in red (width 500 bp). (D) Genomic track of tbx-20. Two intronic (width 500 bp) and one distal enhancer-like region (width 1200 bp) are marked in red.
Figure 7 with 1 supplement

The genomic tracks of post-2c (A), wnt1 (B), prep (C), and ptch1 (D).
The first track is the H3K27ac signal (log2 scale compared to the input sample), the second track is H3K4me1 signal (log2 scale compared to the input sample), the third track is ATAC-seq footprint score (TOBIAS footprint score), the fourth track represents bound motifs in an enhancer-like region (as predicted by TOBIAS), the fifth track represents the transcripts of the gene in the new annotation, and the sixth track represents the gene expression level of the gene in X1 cells (RNA-seq fragments per kilobase of transcript per million [FPKM] mapped reads). (A) Genomic track of post-2c. One upstream cis-regulatory regions is marked in red (width 50 bp). The foxQ/D* footprint represents motif MA0851.1 corresponding to TFs foxQ/D, foxJ1-1, foxJ1-2, foxJ1-3, foxJ1-4, foxJ1-5, foxN2/3-1, foxN2/3-2, and foxN2/3-3. (B) Genomic track of wnt1. One intronic enhancer-like region with one potential Fox family TF binding motif with evidence of binding from footprinting analysis, other Fix TF motifs lie outside the enhancer predicted by ChIP-seq data (Pascual-Carreras et al., 2020). (C) Genomic track of prep. Two intronic enhancer-like regions are marked in red (width 500 bp). (D) Genomic track of ptch1. One intronic enhancer-like region (width 2000 bp) is marked in red. (E) Schematic of position control gene (PCG) regulatory links discussed.
Figure 7—figure supplement 1
Regulatory regions in relation to Hox genes.
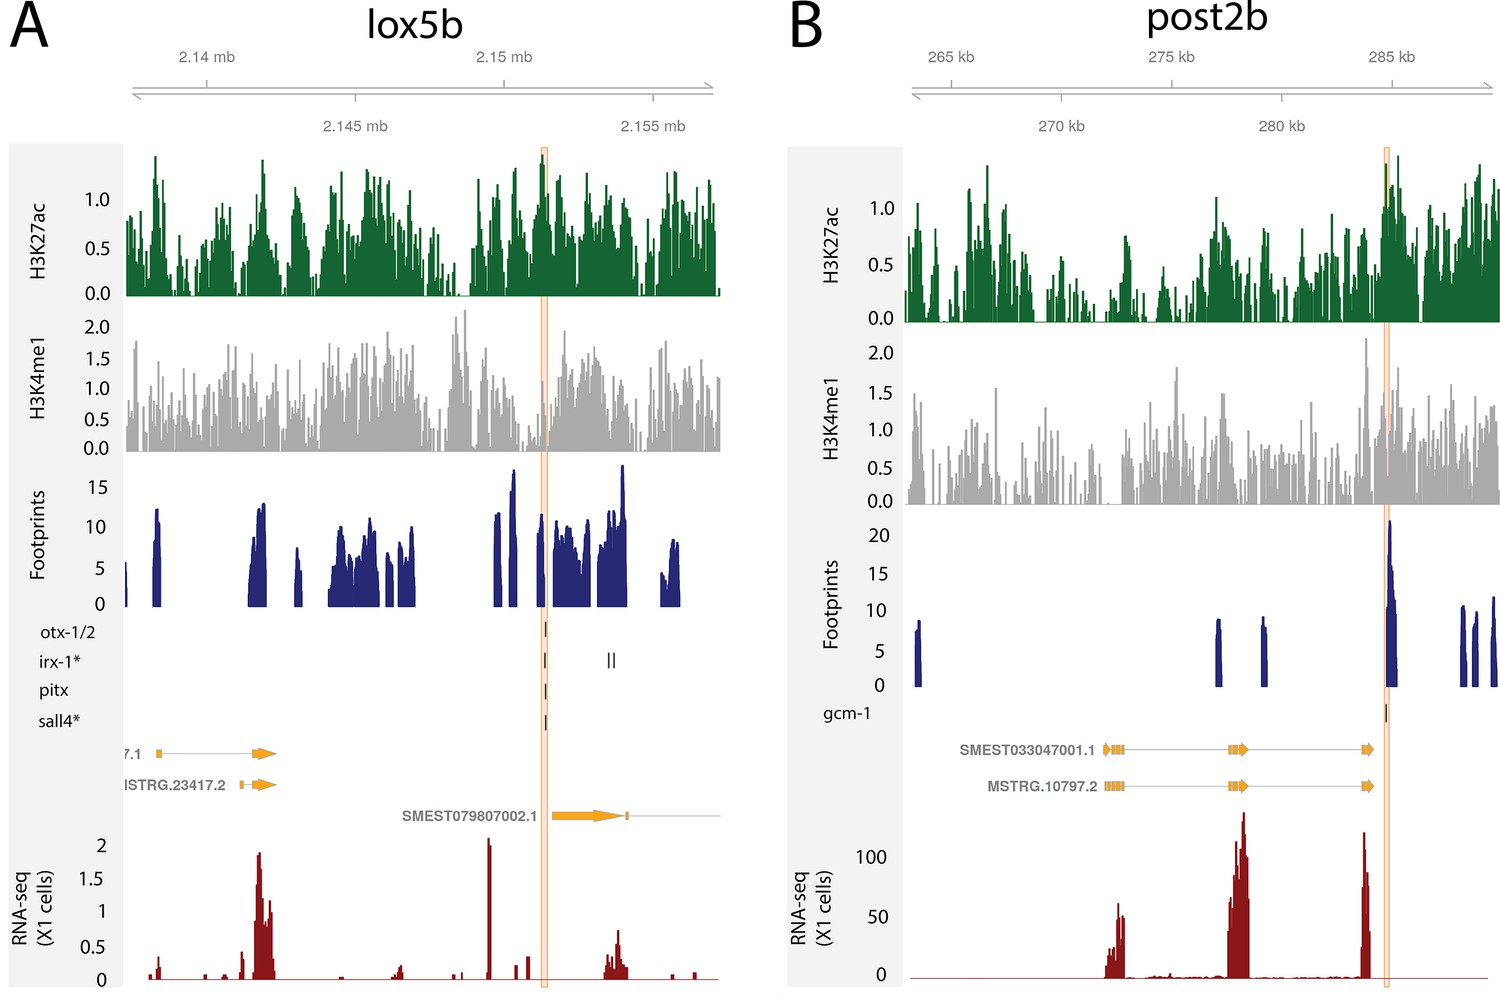
(A) Predicted enhancers binding sites at the loxBb locus. (B) Predicted bound enhancer at the post2B locus.
Figure 8 with 1 supplement
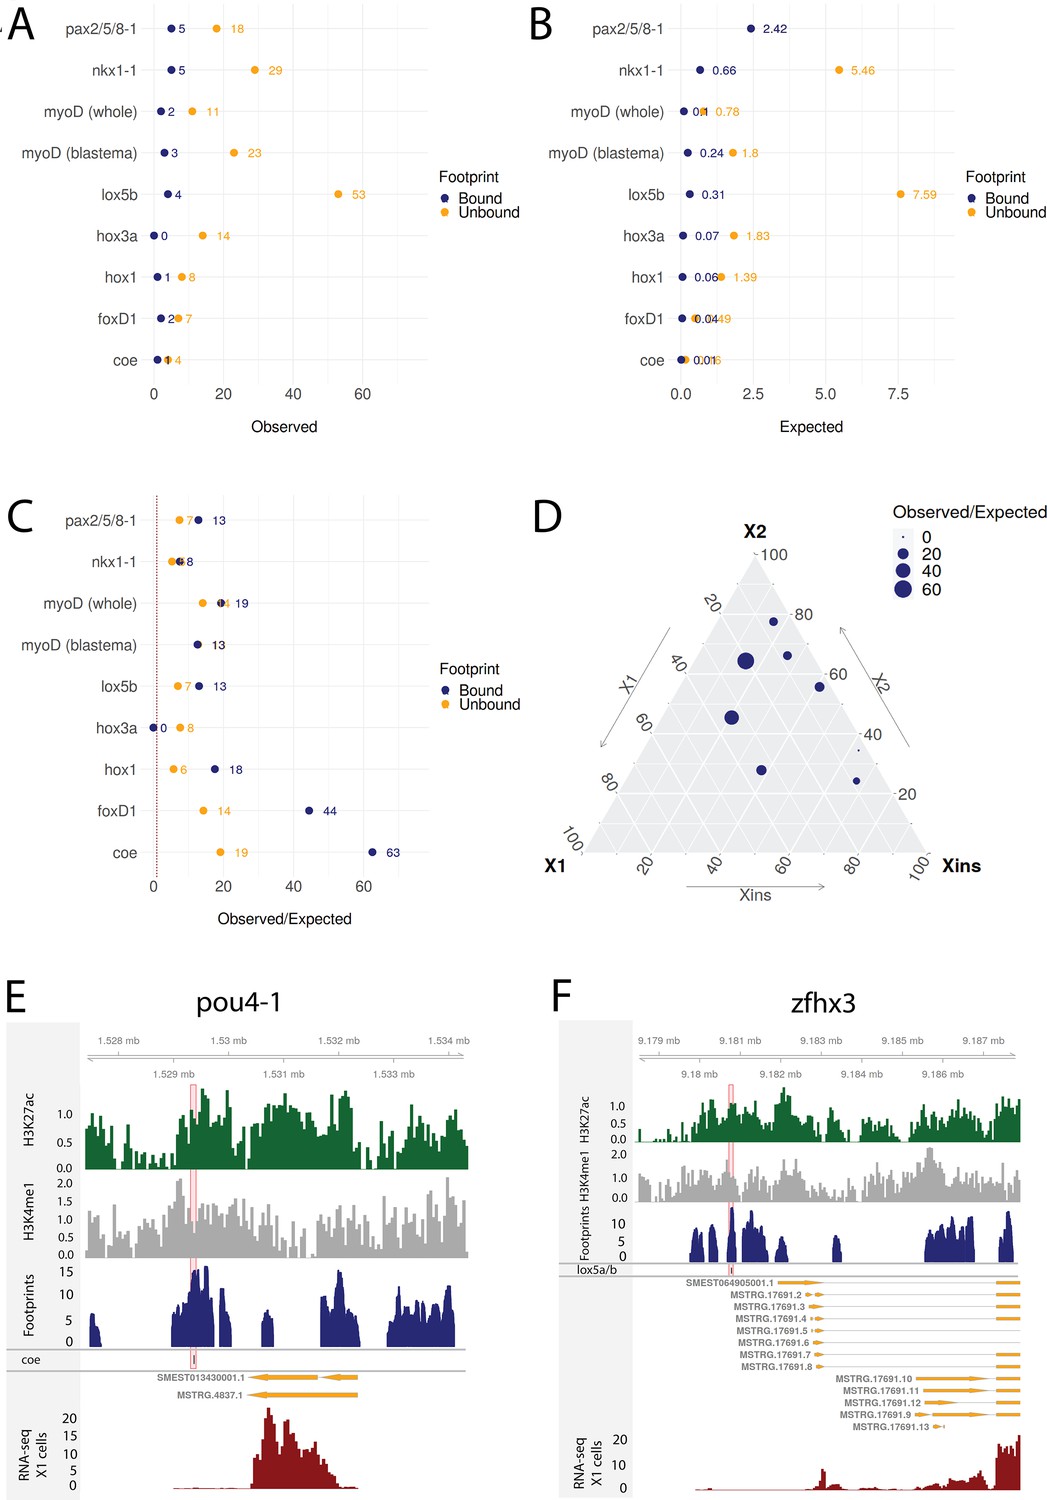
Transcriptomic data from knockdown experiments supports predicted regulatory links.
(A) The number of observed regulatory links between the knocked down transcription factor (TF) (y-axis) and differentially expressed TFs in our gene regulatory network (GRN) model. The regulatory links with unbound and bound footprints are displayed separately. (B) The number of expected regulatory links between the knocked down TF (y-axis) and differentially expressed TFs. (C) The ratio of observed and expected regulatory links as obtained from transcriptomic data for knocked down TFs. The regulatory links with unbound and bound footprints are displayed separately. (D) A ternary plot displaying the observed/expected ratio alongside the proportional expression values of the X1, X2, and Xins compartments. The size of the dot corresponds to the observed/expected ratio. The ratio is higher closer to the X1 and X2 compartment maxima, indicating that the GRN model predicts links better for TFs with higher expression in stem cells. (E) Genomic track of pou4-1. One coe bound footprint within a downstream enhancer-like region (width 100 bp) is marked in red. (F) Genomic track of zfhx3. One lox5a/b bound footprint within an upstream enhancer-like region (width 100 bp) is marked in red.
Figure 8—figure supplement 1
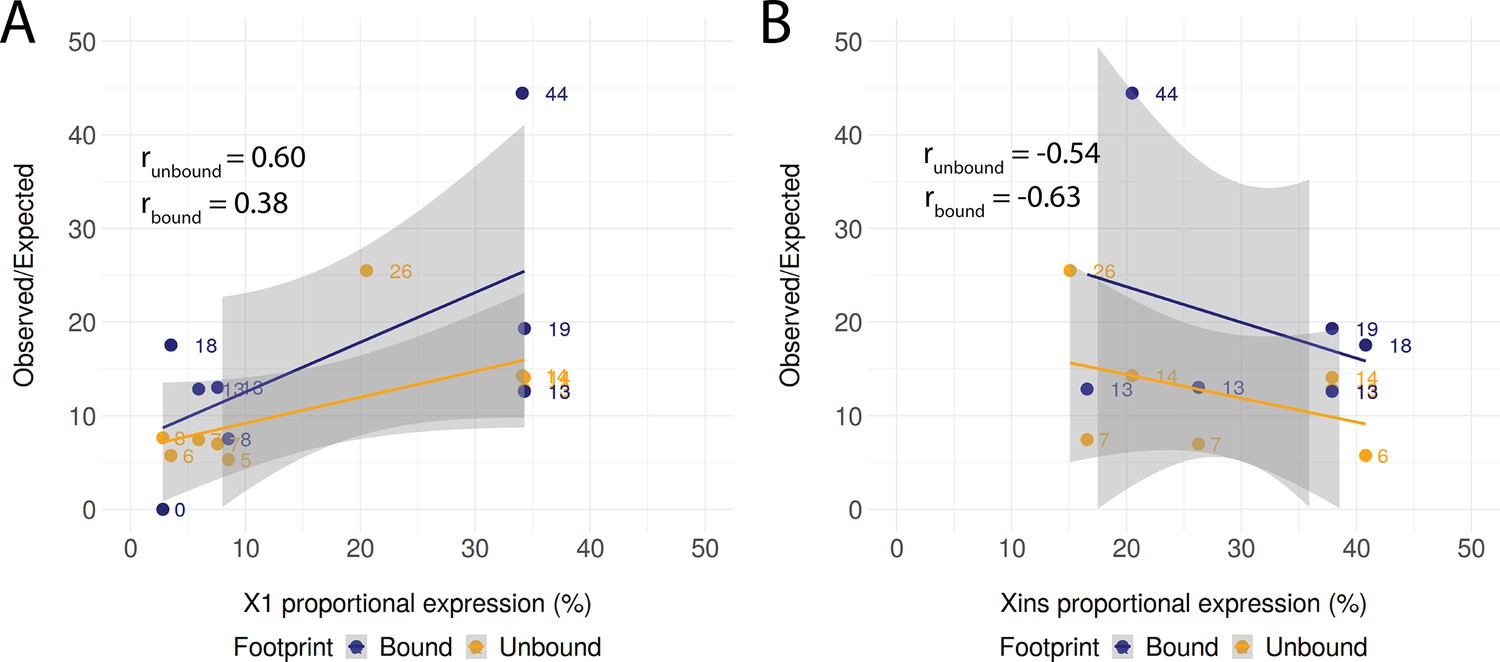
Correlation of compartment-specific proportional expression and the enrichment of observed regulatory links.
(A) Positive correlation of X1 proportional expression and the enrichment of observed regulatory links as compared to the expected number of regulatory links. The shaded area represents the confidence interval (0.95) for the linear regression lines. (B) Negative correlation of Xins proportional expression and the enrichment of observed regulatory links as compared to the expected number of regulatory links. The shaded area represents the confidence interval (0.95) for the linear regression lines.
Tables
Table 1
Genes with more than 100 transcript isoforms.
| Number of isoforms | Gene | Description |
|---|---|---|
| 571 | TMEM25 | Transmembrane protein 25 |
| 291 | CLEC18B | C-type lectin domain family 18 member B |
| 206 | ANK2 | Ankyrin 2 |
| 143 | GABPB2 | GA binding protein transcription factor subunit |
| 138 | PACRG | Parkin coregulated |
| 112 | ANK3 | Ankyrin 3 |
| 106 | DST | Dystonin |
| 104 | ANK3 | Ankyrin 3 |
Additional files
-
Supplementary file 1
Full list of transcription factors (TFs) annotated in the S. meditteranea genome.
TFs are named according to existing names in the literature or according to the currently agreed convention. The absolute (transcripts per million) or proportional expression in the fluorescence-activated cell sorting (FACS)-associated cell compartments X1, X2, and Xins is also recorded.
- https://cdn.elifesciences.org/articles/79675/elife-79675-supp1-v2.xlsx
-
Supplementary file 2
Full list of putative enhancers in adult stem cells defined by ChIP-seq and ATAC-seq analyses.
Includes the position in the genome and the identify of the predicted target gene based on proximity to the predicted transcriptional start site.
- https://cdn.elifesciences.org/articles/79675/elife-79675-supp2-v2.xlsx
-
Supplementary file 3
Full list of predicted ATAC-seq footprints in the genome, including predicted transcription factor (TF)/TF family, position of binding site in the genome, and position of the peak/enhancer in the genome.
- https://cdn.elifesciences.org/articles/79675/elife-79675-supp3-v2.xlsx
-
Supplementary file 4
Full list of motifs with and without footprints organized by transcription factor (TF)/TF family in predicted enhancer regions.
- https://cdn.elifesciences.org/articles/79675/elife-79675-supp4-v2.xlsx
-
Supplementary file 5
Overview of number of enhancers, predicted bound motifs (footprints), and unbound motifs for fate-specific transcription factors (FSTF) expressed in adult stem cells.
- https://cdn.elifesciences.org/articles/79675/elife-79675-supp5-v2.xlsx
-
Supplementary file 6
Full list of transcription factors (TFs), involved in a putative stem cell gene regulatory network (GRN).
Includes TF with expression >1/3 in the X1 compartment and includes other TFs implicated in regulating or being regulated by these TFs.
- https://cdn.elifesciences.org/articles/79675/elife-79675-supp6-v2.xlsx
-
Supplementary file 7
Differential expression analysis of transcription factor (TF) RNAi with RNA-seq datasets.
- https://cdn.elifesciences.org/articles/79675/elife-79675-supp7-v2.xlsx
-
Supplementary file 8
Differentially expressed transcription factor (TFs) after TF RNAi.
- https://cdn.elifesciences.org/articles/79675/elife-79675-supp8-v2.xlsx
-
MDAR checklist
- https://cdn.elifesciences.org/articles/79675/elife-79675-mdarchecklist1-v2.docx
-
Source code 1
Full set of codes used for analyses in this study.
- https://cdn.elifesciences.org/articles/79675/elife-79675-code1-v2.zip
Download links
A two-part list of links to download the article, or parts of the article, in various formats.
Downloads (link to download the article as PDF)
Open citations (links to open the citations from this article in various online reference manager services)
Cite this article (links to download the citations from this article in formats compatible with various reference manager tools)
Identification of putative enhancer-like elements predicts regulatory networks active in planarian adult stem cells
eLife 11:e79675.
https://doi.org/10.7554/eLife.79675


